Elgin, Illinois

Elgin: Fox River Bike Trail
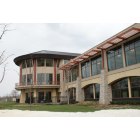
Elgin: Gail Borden Library
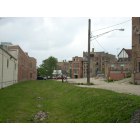
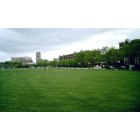
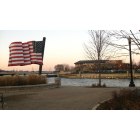
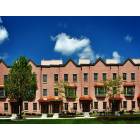
Elgin: Elgin
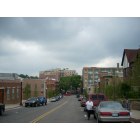
Elgin: Elgin
Elgin: Elgin
Elgin: Downtown Festival Park

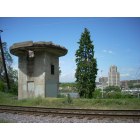
Elgin: Elgin Tower Building from Walton Islands

Elgin: Hemmens Auditorium from Walton Islands
Elgin: Gail Borden Library from Walton Islands
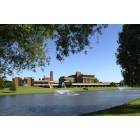
Elgin: Elgin Community College
Elgin: Downtown Elgin
- see
13
more - add
your
Submit your own pictures of this city and show them to the world
- OSM Map
- General Map
- Google Map
- MSN Map
Population change since 2000: +19.8%
 |
| Males: 57,060 | |
| Females: 56,117 |
| Median resident age: | 38.4 years |
| Illinois median age: | 39.1 years |
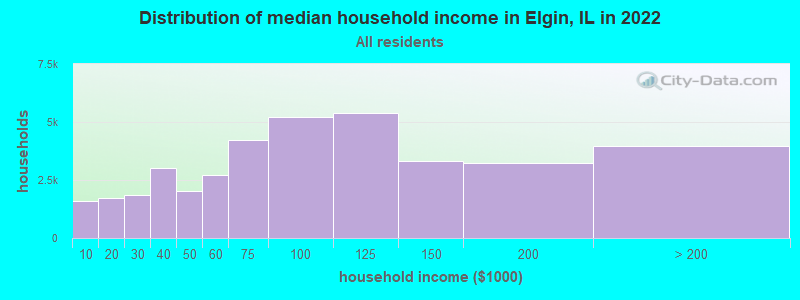
| Elgin: | $85,167 |
| IL: | $76,708 |
Estimated per capita income in 2022: $36,252 (it was $21,112 in 2000)
Elgin city income, earnings, and wages data
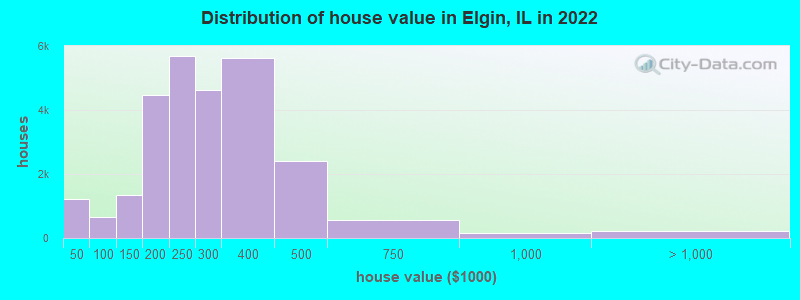
Estimated median house or condo value in 2022: $263,500 (it was $138,500 in 2000)
| Elgin: | $263,500 |
| IL: | $251,600 |
Mean prices in 2022: all housing units: $284,334; detached houses: $300,989; townhouses or other attached units: $213,893; in 2-unit structures: $193,338; in 3-to-4-unit structures: $216,848; in 5-or-more-unit structures: $849,211; mobile homes: $72,798
Median gross rent in 2022: $1,120.
(4.6% for White Non-Hispanic residents, 24.7% for Black residents, 14.8% for Hispanic or Latino residents, 24.9% for American Indian residents, 11.4% for Native Hawaiian and other Pacific Islander residents, 14.1% for other race residents, 9.9% for two or more races residents)
Detailed information about poverty and poor residents in Elgin, IL


Compare current foreclosures in Elgin, IL:
| Photo | Address | Area | Beds / Baths | Price | Details |
|---|---|---|---|---|---|

|
#1
W809 Bending Ln
Elgin, IL 60124
|
4,100 sq. feet
|
3 baths 4 beds |
$607,000
|
show details |

|
#2
Corron Rd
Elgin, IL 60124
|
3,352 sq. feet
|
3 baths 4 beds |
$709,000
|
show details |

|
#3
Page Ave
Elgin, IL 60120
|
- sq. feet
|
2 baths 3 beds |
$199,500
|
show details |

|
#4
Getty St
Elgin, IL 60120
|
1,280 sq. feet
|
3 baths 3 beds |
show details | |

|
#5
Cottonwood Dr
Elgin, IL 60123
|
1,751 sq. feet
|
3 baths 3 beds |
show details | |

|
#6
Raymond St
Elgin, IL 60120
|
1,489 sq. feet
|
1 baths - beds |
show details | |

|
#7
N Commonwealth Ave
Elgin, IL 60123
|
- sq. feet
|
1 baths 3 beds |
show details | |

|
#8
Ann St
Elgin, IL 60120
|
- sq. feet
|
1 baths 3 beds |
show details | |

|
#9
Lovell St
Elgin, IL 60120
|
1,056 sq. feet
|
1 baths - beds |
show details | |

|
#10
Bent Tree Ct
Elgin, IL 60120
|
960 sq. feet
|
1 baths - beds |
show details |
| Photo | Address | Area | Beds / Baths | Price | Details |
|---|---|---|---|---|---|

|
#11
Blackhawk Dr
Elgin, IL 60120
|
1,170 sq. feet
|
1 baths - beds |
show details | |

|
#12
Highbury Dr
Elgin, IL 60120
|
1,556 sq. feet
|
1 baths - beds |
show details | |

|
#13
Kramer Ave
Elgin, IL 60120
|
1,728 sq. feet
|
1 baths - beds |
show details | |

|
#14
Concord Dr
Elgin, IL 60120
|
1,020 sq. feet
|
1 baths - beds |
show details | |

|
#15
Village Ct
Elgin, IL 60120
|
1,116 sq. feet
|
2 baths - beds |
show details | |

|
#16
Sebring Dr
Elgin, IL 60120
|
1,162 sq. feet
|
1 baths - beds |
show details | |

|
#17
Algona Ave
Elgin, IL 60120
|
1,446 sq. feet
|
2 baths - beds |
show details | |

|
#18
Deer Run Ln
Elgin, IL 60120
|
1,368 sq. feet
|
2 baths - beds |
show details | |

|
#19
Pegwood Dr
Elgin, IL 60120
|
1,263 sq. feet
|
1 baths - beds |
show details | |

|
#20
Concord Dr
Elgin, IL 60120
|
1,223 sq. feet
|
1 baths - beds |
show details |
| Photo | Address | Area | Beds / Baths | Price | Details |
|---|---|---|---|---|---|

|
#21
Allen Dr
Elgin, IL 60120
|
2,552 sq. feet
|
3 baths - beds |
show details | |

|
#22
Sioux Dr
Elgin, IL 60120
|
984 sq. feet
|
2 baths - beds |
show details | |

|
#23
Huron Dr
Elgin, IL 60120
|
1,415 sq. feet
|
2 baths - beds |
show details | |

|
#24
Chaparral Cir
Elgin, IL 60120
|
1,329 sq. feet
|
1 baths - beds |
show details | |

|
#25
Cimarron Ct
Elgin, IL 60120
|
1,344 sq. feet
|
1 baths - beds |
show details | |

|
#26
Hampshire Ln
Elgin, IL 60120
|
1,875 sq. feet
|
2 baths - beds |
show details | |

|
#27
Hartwell Ave
Elgin, IL 60120
|
1,437 sq. feet
|
2 baths - beds |
show details | |

|
#28
Sebring Cir
Elgin, IL 60120
|
1,184 sq. feet
|
1 baths - beds |
show details | |

|
#29
Glen Ivy Dr
Elgin, IL 60120
|
1,200 sq. feet
|
1 baths - beds |
show details | |

|
#30
Martin Dr
Elgin, IL 60120
|
1,066 sq. feet
|
1 baths - beds |
show details |
| Photo | Address | Area | Beds / Baths | Price | Details |
|---|---|---|---|---|---|

|
#31
Leawood Dr
Elgin, IL 60120
|
1,134 sq. feet
|
1 baths - beds |
show details | |

|
#32
Eliot Trl
Elgin, IL 60120
|
2,108 sq. feet
|
2 baths - beds |
show details | |

|
#33
Times Sq Apt 112
Elgin, IL 60120
|
- sq. feet
|
- baths - beds |
show details | |

|
#34
Atwell St
Elgin, IL 60124
|
- sq. feet
|
- baths - beds |
show details | |

|
#35
Preston Ave
Elgin, IL 60120
|
- sq. feet
|
- baths - beds |
show details | |

|
#36
Todd Farm Dr Apt 201
Elgin, IL 60123
|
- sq. feet
|
- baths - beds |
show details | |

|
#37
Long Common Pkwy
Elgin, IL 60124
|
- sq. feet
|
- baths - beds |
show details | |

|
#38
Chaucer Ct Apt B
Elgin, IL 60120
|
- sq. feet
|
- baths - beds |
show details | |

|
#39
Wickenden Ave
Elgin, IL 60124
|
- sq. feet
|
- baths - beds |
show details | |

|
#40
Route 20
Elgin, IL 60124
|
- sq. feet
|
- baths - beds |
show details |
| Photo | Address | Area | Beds / Baths | Price | Details |
|---|---|---|---|---|---|

|
#41
Ceresa Dr
Elgin, IL 60120
|
- sq. feet
|
- baths - beds |
show details | |

|
#42
Bowes Rd
Elgin, IL 60123
|
- sq. feet
|
- baths - beds |
show details | |

|
#43
Bowes Bend Dr
Elgin, IL 60124
|
- sq. feet
|
- baths - beds |
show details | |

|
#44
Route 20
Elgin, IL 60124
|
- sq. feet
|
- baths - beds |
show details | |

|
#45
Wildwood Dr
Elgin, IL 60124
|
- sq. feet
|
- baths - beds |
show details | |

|
#46
Belmont Ave
Elgin, IL 60123
|
- sq. feet
|
- baths - beds |
show details | |

|
#47
Indian Dr
Elgin, IL 60120
|
- sq. feet
|
- baths - beds |
show details | |

|
#48
Dundee Ave
Elgin, IL 60120
|
- sq. feet
|
- baths - beds |
show details | |

|
#49
Crane Pt
Elgin, IL 60124
|
- sq. feet
|
- baths - beds |
show details | |

|
Check over 1 million property listings on Foreclosure.com!
|
browse all offers | |||


- 47,92443.7%Hispanic
- 43,86140.0%White alone
- 8,1637.4%Asian alone
- 5,7485.2%Black alone
- 3,0482.8%Two or more races
- 4740.4%American Indian alone
- 4160.4%Other race alone
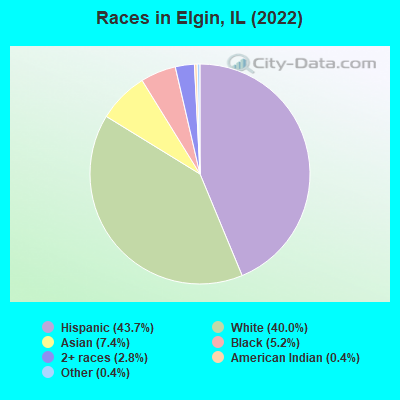
Races in Elgin detailed stats: ancestries, foreign born residents, place of birth
According to our research of Illinois and other state lists, there were 167 registered sex offenders living in Elgin, Illinois as of April 27, 2024.
The ratio of all residents to sex offenders in Elgin is 686 to 1.
The ratio of registered sex offenders to all residents in this city is near the state average.
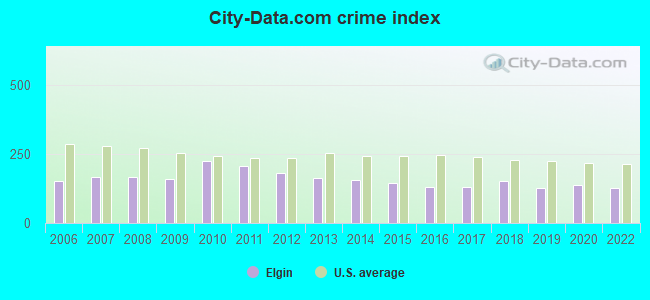
The City-Data.com crime index weighs serious crimes and violent crimes more heavily. Higher means more crime, U.S. average is 246.1. It adjusts for the number of visitors and daily workers commuting into cities.
- means the value is smaller than the state average.- means the value is about the same as the state average.
- means the value is bigger than the state average.
- means the value is much bigger than the state average.
Crime rate in Elgin detailed stats: murders, rapes, robberies, assaults, burglaries, thefts, arson
Full-time law enforcement employees in 2021, including police officers: 270 (189 officers - 165 male; 24 female).
| Officers per 1,000 residents here: | 1.71 |
| Illinois average: | 2.84 |
 Recent articles from our blog. Our writers, many of them Ph.D. graduates or candidates, create easy-to-read articles on a wide variety of topics.

 | Single working in Elgin (7 replies) |
| Elgin & Kennington Square (1 reply) |
| Suburb thoughts? South Elgin/Fox River Grove/Crystal Lake or somewhere else? (10 replies) |
| Living in Elgin? Pros & Cons (85 replies) |
| top 3 areas to avoid in nw suburbs (84 replies) |
| Schaumburg and Elgin areas (5 replies) |
Latest news from Elgin, IL collected exclusively by city-data.com from local newspapers, TV, and radio stations
Ancestries: German (5.2%), Polish (3.3%), American (3.0%), Italian (3.0%), Irish (2.3%), European (1.8%).
Current Local Time: CST time zone
Incorporated on 01/18/1881
Elevation: 745 feet
Land area: 25.0 square miles.
Population density: 4,527 people per square mile (average).
29,314 residents are foreign born (18.8% Latin America, 4.4% Asia).
| This city: | 25.8% |
| Illinois: | 14.1% |
Median real estate property taxes paid for housing units with mortgages in 2022: $5,951 (2.2%)
Median real estate property taxes paid for housing units with no mortgage in 2022: $5,730 (2.3%)
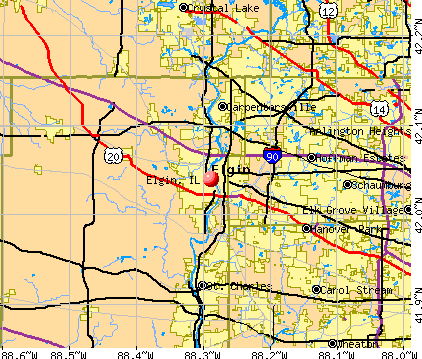
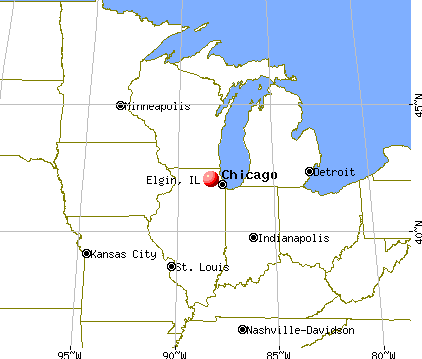
Nearest city with pop. 200,000+: Chicago, IL  (34.2 miles , pop. 2,896,016).
Nearest cities:
), ), Latitude: 42.04 N, Longitude: 88.29 W
Daytime population change due to commuting: +2,900 (+2.6%)
Workers who live and work in this city: 21,520 (38.3%)
Area codes: 847, 630, 224
Elgin, Illinois accommodation & food services, waste management - Economy and Business Data
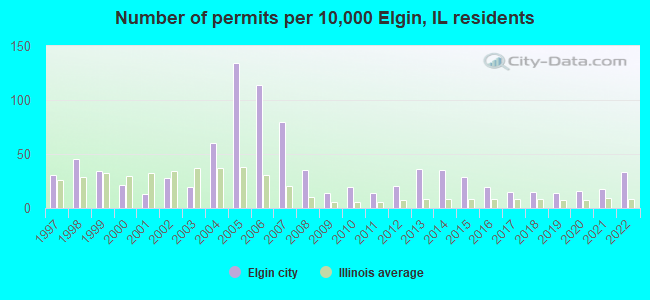
Single-family new house construction building permits:
- 2022: 308 buildings, average cost: $230,000
- 2021: 167 buildings, average cost: $216,300
- 2020: 153 buildings, average cost: $216,200
- 2019: 133 buildings, average cost: $216,500
- 2018: 146 buildings, average cost: $215,100
- 2017: 141 buildings, average cost: $225,100
- 2016: 175 buildings, average cost: $185,700
- 2015: 272 buildings, average cost: $166,600
- 2014: 333 buildings, average cost: $159,100
- 2013: 343 buildings, average cost: $171,200
- 2012: 192 buildings, average cost: $161,300
- 2011: 133 buildings, average cost: $158,000
- 2010: 182 buildings, average cost: $122,500
- 2009: 128 buildings, average cost: $135,700
- 2008: 332 buildings, average cost: $156,500
- 2007: 756 buildings, average cost: $143,500
- 2006: 1077 buildings, average cost: $129,700
- 2005: 1262 buildings, average cost: $155,700
- 2004: 563 buildings, average cost: $144,700
- 2003: 179 buildings, average cost: $123,400
- 2002: 265 buildings, average cost: $129,400
- 2001: 126 buildings, average cost: $98,300
- 2000: 194 buildings, average cost: $112,600
- 1999: 319 buildings, average cost: $108,500
- 1998: 428 buildings, average cost: $93,600
- 1997: 294 buildings, average cost: $103,200

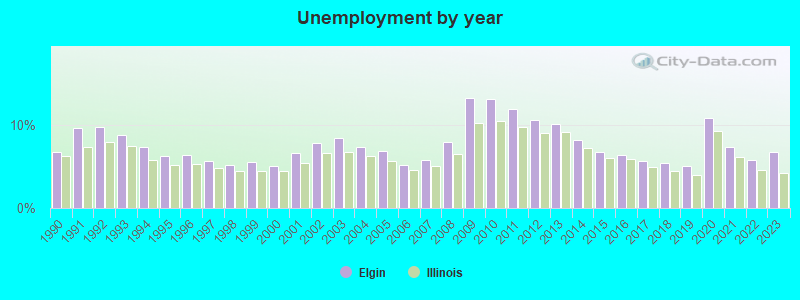
| Here: | 6.8% |
| Illinois: | 4.2% |
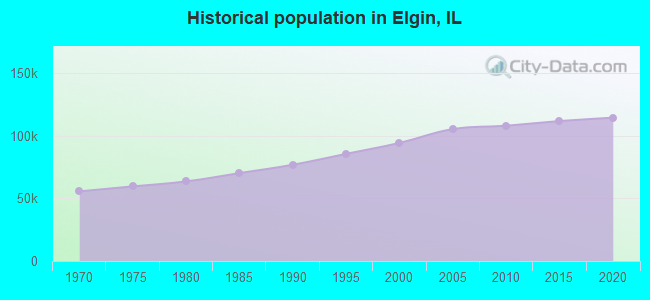
Population change in the 1990s: +16,713 (+21.5%).
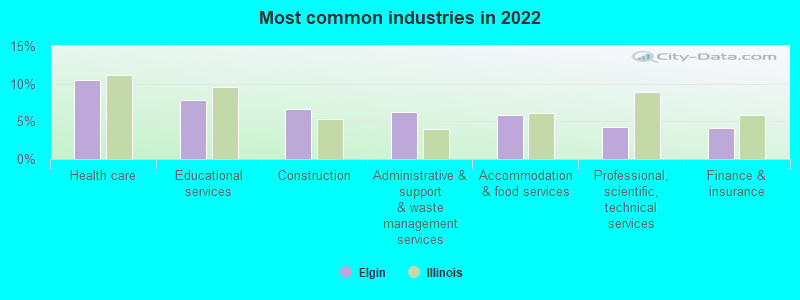
- Health care (10.5%)
- Educational services (7.9%)
- Construction (6.7%)
- Administrative & support & waste management services (6.3%)
- Accommodation & food services (5.8%)
- Professional, scientific, technical services (4.2%)
- Finance & insurance (4.1%)
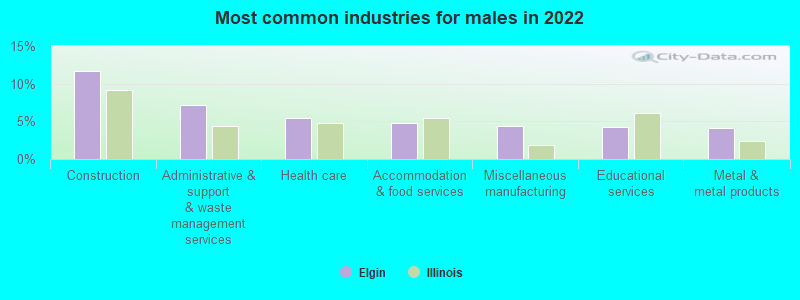
- Construction (11.7%)
- Administrative & support & waste management services (7.2%)
- Health care (5.4%)
- Accommodation & food services (4.8%)
- Miscellaneous manufacturing (4.3%)
- Educational services (4.2%)
- Metal & metal products (4.1%)
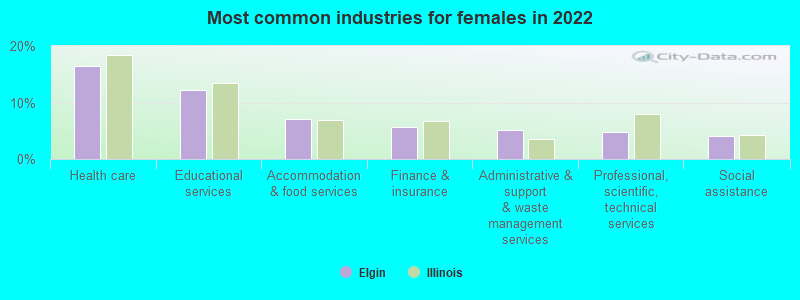
- Health care (16.5%)
- Educational services (12.3%)
- Accommodation & food services (7.1%)
- Finance & insurance (5.6%)
- Administrative & support & waste management services (5.2%)
- Professional, scientific, technical services (4.8%)
- Social assistance (4.0%)
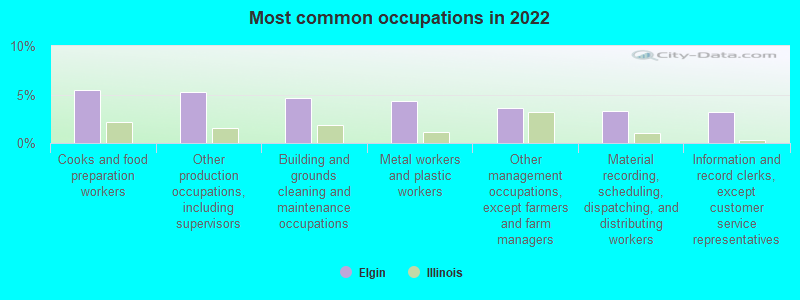
- Cooks and food preparation workers (5.4%)
- Other production occupations, including supervisors (5.2%)
- Building and grounds cleaning and maintenance occupations (4.6%)
- Metal workers and plastic workers (4.3%)
- Other management occupations, except farmers and farm managers (3.6%)
- Material recording, scheduling, dispatching, and distributing workers (3.3%)
- Information and record clerks, except customer service representatives (3.2%)
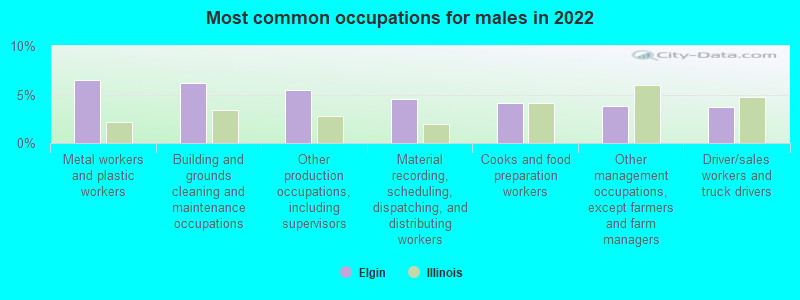
- Metal workers and plastic workers (6.5%)
- Building and grounds cleaning and maintenance occupations (6.2%)
- Other production occupations, including supervisors (5.5%)
- Material recording, scheduling, dispatching, and distributing workers (4.6%)
- Cooks and food preparation workers (4.2%)
- Other management occupations, except farmers and farm managers (3.8%)
- Driver/sales workers and truck drivers (3.7%)
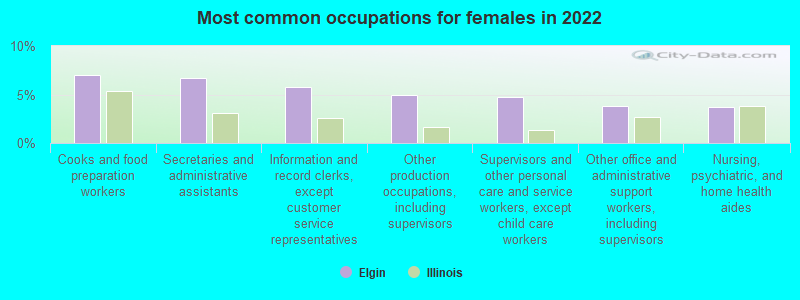
- Cooks and food preparation workers (7.0%)
- Secretaries and administrative assistants (6.7%)
- Information and record clerks, except customer service representatives (5.8%)
- Other production occupations, including supervisors (5.0%)
- Supervisors and other personal care and service workers, except child care workers (4.7%)
- Other office and administrative support workers, including supervisors (3.8%)
- Nursing, psychiatric, and home health aides (3.7%)
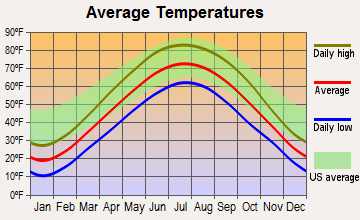
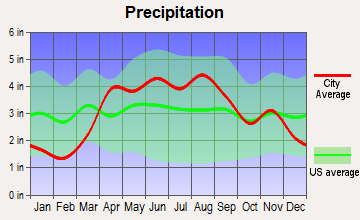
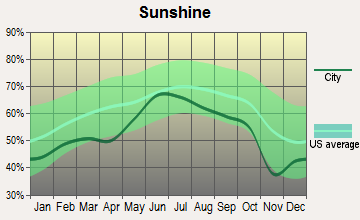
Average climate in Elgin, Illinois
Based on data reported by over 4,000 weather stations


|
|


(lower is better)
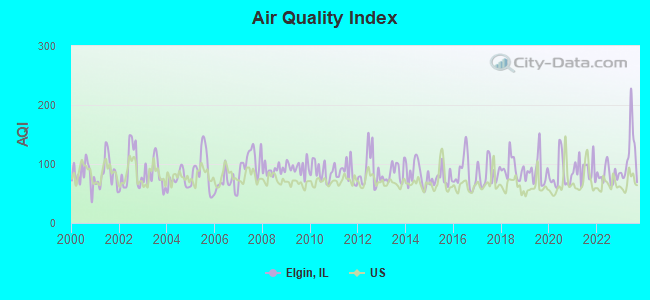
Air Quality Index (AQI) level in 2023 was 116. This is significantly worse than average.
| City: | 116 |
| U.S.: | 73 |
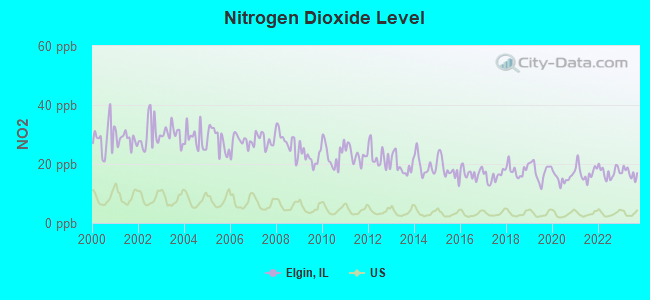
Nitrogen Dioxide (NO2) [ppb] level in 2023 was 16.9. This is significantly worse than average. Closest monitor was 9.7 miles away from the city center.
| City: | 16.9 |
| U.S.: | 5.1 |
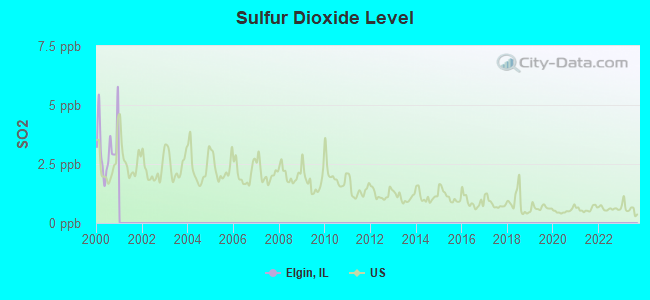
Sulfur Dioxide (SO2) [ppb] level in 2000 was 3.23. This is significantly worse than average. Closest monitor was 1.0 miles away from the city center.
| City: | 3.23 |
| U.S.: | 1.51 |
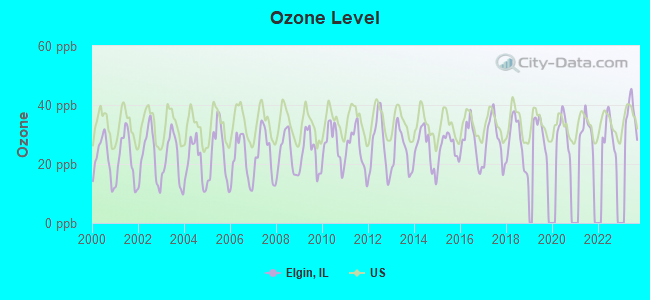
Ozone [ppb] level in 2023 was 37.0. This is about average. Closest monitor was 0.9 miles away from the city center.
| City: | 37.0 |
| U.S.: | 33.3 |
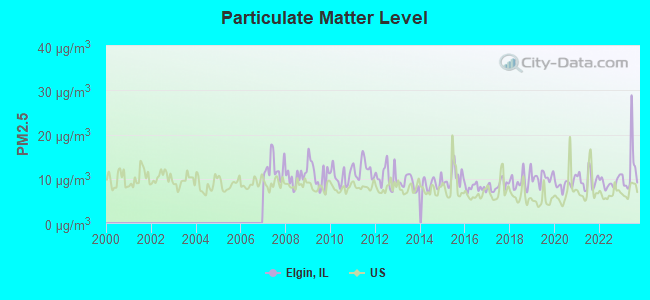
Particulate Matter (PM2.5) [µg/m3] level in 2023 was 12.1. This is significantly worse than average. Closest monitor was 0.9 miles away from the city center.
| City: | 12.1 |
| U.S.: | 8.1 |
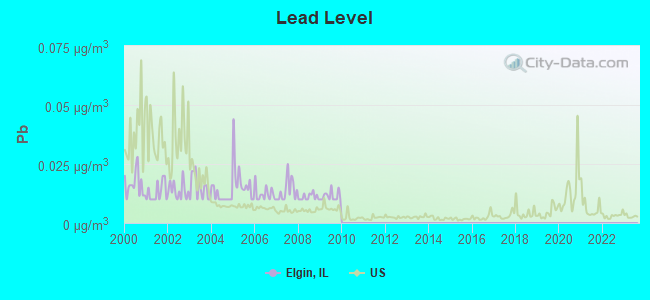
Lead (Pb) [µg/m3] level in 2009 was 0.0114. This is worse than average. Closest monitor was 0.2 miles away from the city center.
| City: | 0.0114 |
| U.S.: | 0.0093 |
Tornado activity:
Elgin-area historical tornado activity is slightly below Illinois state average. It is 43% greater than the overall U.S. average.
On 8/28/1990, a category F5 (max. wind speeds 261-318 mph) tornado 25.1 miles away from the Elgin city center killed 29 people and injured 350 people and caused between $50,000 and $500,000 in damages.
On 4/21/1967, a category F4 (max. wind speeds 207-260 mph) tornado 7.7 miles away from the city center killed one person and injured 100 people and caused between $500,000 and $5,000,000 in damages.
Earthquake activity:
Elgin-area historical earthquake activity is significantly above Illinois state average. It is 45% greater than the overall U.S. average.On 4/18/2008 at 09:36:59, a magnitude 5.4 (5.1 MB, 4.8 MS, 5.4 MW, 5.2 MW, Class: Moderate, Intensity: VI - VII) earthquake occurred 249.0 miles away from Elgin center
On 6/10/1987 at 23:48:54, a magnitude 5.1 (4.9 MB, 4.4 MS, 4.6 MS, 5.1 LG) earthquake occurred 223.6 miles away from the city center
On 4/18/2008 at 09:36:59, a magnitude 5.2 (5.2 MW, Depth: 8.9 mi) earthquake occurred 249.1 miles away from the city center
On 6/28/2004 at 06:10:52, a magnitude 4.2 (4.2 MW, Depth: 6.2 mi, Class: Light, Intensity: IV - V) earthquake occurred 51.0 miles away from the city center
On 2/10/2010 at 09:59:35, a magnitude 3.8 (3.8 MW, Depth: 6.2 mi, Class: Light, Intensity: II - III) earthquake occurred 11.8 miles away from Elgin center
On 6/18/2002 at 17:37:15, a magnitude 5.0 (4.3 MB, 4.6 MW, 5.0 LG) earthquake occurred 281.6 miles away from Elgin center
Magnitude types: regional Lg-wave magnitude (LG), body-wave magnitude (MB), surface-wave magnitude (MS), moment magnitude (MW)
Natural disasters:
The number of natural disasters in Kane County (15) is near the US average (15).Major Disasters (Presidential) Declared: 10
Emergencies Declared: 4
Causes of natural disasters: Floods: 7, Storms: 7, Snowstorms: 2, Tornadoes: 2, Winter Storms: 2, Blizzard: 1, Hurricane: 1, Snow: 1, Wind: 1, Other: 1 (Note: some incidents may be assigned to more than one category).
Main business address for: MIDDLEBY CORP (REFRIGERATION & SERVICE INDUSTRY MACHINERY), EFC BANCORP INC (SAVINGS INSTITUTIONS, NOT FEDERALLY CHARTERED).
Hospitals in Elgin:
- ELGIN MENTAL HEALTH CENTER (750 S STATE ST)
- ELGIN STATE HOSP-MED AND SURG DIV (provides emergency services, 750 S STATE ST)
- LITTLE ANGELS (1435 SUMMIT STREET)
- PASSAGES HOSPICE (134 NORTH MCLEAN BLVD)
- PRESENCE SAINT JOSEPH HOSPITAL - ELGIN (Voluntary non-profit - Church, 77 N AIRLITE STREET)
- PROVENA HOSPICE (77 NORTH AIRLITE STREET)
- SHERMAN HOSPITAL (Voluntary non-profit - Private, 1425 NORTH RANDALL ROAD)
Nursing Homes in Elgin:
- APOSTOLIC CHRISTIAN RESTHAVEN (2750 WEST HIGHLAND AVENUE)
- ASHWOOD HEALTH CARE CENTER (134 N MCLEAN BOULEVARD)
- ASTA CARE CENTER OF ELGIN (134 NORTH MCLEAN BOULEVARD)
- HERITAGE HEALTH-ELGIN (355 RAYMOND STREET)
- LITTLE ANGELS NH INC (BOX 304 RT 4)
- MANORCARE OF ELGIN (180 SOUTH STATE STREET)
- MAPLEWOOD CARE (50 NORTH JANE)
- OLIVETTE SKILLED NURSING CARE CENTER (355 RAYMOND STREET)
- ROSEWOOD CARE CENTER OF ELGIN (2355 ROYAL BOULEVARD)
- SHERMAN HOSPITAL SCU (934 CENTER STREET)
- SHERMAN WEST COURT (1950 LARKIN AVENUE)
Dialysis Facilities in Elgin:
Home Health Centers in Elgin:
Heliports located in Elgin:
- Il Department Of Transportation Heliport (2IL8)
- Presence St Joseph Hospital - Elgin Heliport (IS20)
- Sherman Hospital Randall Road Heliport (25LL)
Colleges/Universities in Elgin:
- Elgin Community College (Full-time enrollment: 8,173; Location: 1700 Spartan Drive; Public; Website: www.elgin.edu)
- Judson University (Full-time enrollment: 1,133; Location: 1151 N State St; Private, not-for-profit; Website: www.judsonu.edu; Offers Doctor's degree)
- Regency Beauty Institute-Elgin (Full-time enrollment: 98; Location: 609 S. Randall Road; Private, for-profit; Website: www.regency.edu)
- Cannella School of Hair Design-Elgin (Full-time enrollment: 84; Location: 117 W Chicago St; Private, for-profit; Website: cannellabeautyschools.com)
- J Renee Career Facilitation (Full-time enrollment: 79; Location: 415 Airport Road; Private, for-profit; Website: www.JRenee.edu)
- The Salon Professional Academy-Elgin (Full-time enrollment: 48; Location: 264 S. Randall Road; Private, for-profit; Website: www.elgin.mysalonacademy.com)
Other colleges/universities with over 2000 students near Elgin:
- Harper College (about 12 miles; Palatine, IL; Full-time enrollment: 10,800)
- American InterContinental University-Online (about 14 miles; Schaumburg, IL; FT enrollment: 16,158)
- Universal Technical Institute of Illinois Inc (about 14 miles; Glendale Heights, IL; FT enrollment: 2,281)
- Chamberlain College of Nursing-Illinois (about 15 miles; Addison, IL; FT enrollment: 8,977)
- Wheaton College (about 16 miles; Wheaton, IL; FT enrollment: 2,948)
- McHenry County College (about 16 miles; Crystal Lake, IL; FT enrollment: 4,886)
- College of DuPage (about 18 miles; Glen Ellyn, IL; FT enrollment: 18,910)
Public high schools in Elgin:
- LARKIN HIGH SCHOOL (Students: 2,163, Location: 1475 LARKIN AVE, Grades: 9-12)
- ELGIN HIGH SCHOOL (Students: 2,089, Location: 1200 MAROON DR, Grades: 9-12)
- GIFFORD STREET HIGH SCHOOL (Students: 131, Location: 46 S GIFFORD ST, Grades: 7-12)
- CENTRAL SCHOOL PROGRAM (Students: 118, Location: 355 E CHICAGO ST, Grades: 10-11)
- GIFFORD ST REGIONAL SAFE SCH PROG (Location: 46 S GIFFORD ST, Grades: 6-12)
Private high schools in Elgin:
- HARVEST CHRISTIAN ACADEMY (Students: 632, Location: 1000 N RANDALL RD, Grades: PK-12)
- ELGIN ACADEMY (Students: 460, Location: 350 PARK ST, Grades: PK-12)
- WESTMINSTER CHRISTIAN SCHOOL (Students: 457, Location: 2700 W HIGHLAND AVE, Grades: PK-12)
- ST EDWARD CENTRAL CATHOLIC HIGH SCHOOL (Students: 430, Location: 335 LOCUST ST, Grades: 9-12)
- INSTITUTE OF ISLAMIC EDUCATION (Students: 113, Location: 1048 BLUFF CITY BLVD, Grades: UG-12)
- THE EINSTEIN ACADEMY (Students: 101, Location: 747 DAVIS RD, Grades: PK-12)
- SUMMIT SCHOOL (Students: 79, Location: 333 W RIVER RD, Grades: 2-12)
- LARKIN CENTER SCHOOL (Students: 50, Location: 515 SPORTS WAY, Grades: 1-12)
- HAMILTON ACADEMY (Students: 18, Location: 665 TOLLGATE RD STE D, Grades: 7-12)
Biggest public elementary/middle schools in Elgin:
- LORDS PARK ELEM SCHOOL (Students: 796, Location: 323 WAVERLY DR, Grades: KG-6)
- KIMBALL MIDDLE SCHOOL (Students: 765, Location: 451 N MCLEAN BLVD, Grades: 7-8)
- LARSEN MIDDLE SCHOOL (Students: 657, Location: 665 DUNDEE AVE, Grades: 7-8)
- HUFF ELEM SCHOOL (Students: 624, Location: 801 HASTINGS ST, Grades: PK-6)
- HILLTOP ELEMENTARY SCHOOL (Students: 623, Location: 1855 ROHRSON RD, Grades: KG-6)
- HILLCREST ELEM SCHOOL (Students: 617, Location: 80 N AIRLITE ST, Grades: KG-6)
- COLEMAN ELEM SCHOOL (Students: 601, Location: 1220 DUNDEE AVE, Grades: KG-6)
- PRAIRIE VIEW GRADE SCHOOL (Students: 583, Location: 10N630 NESLER RD, Grades: KG-5)
- CHANNING MEMORIAL ELEM SCHOOL (Students: 578, Location: 63 S CHANNING ST, Grades: KG-6)
- CREEKSIDE ELEM (Students: 557, Location: 655 N AIRLITE ST, Grades: PK-6)
Private elementary/middle schools in Elgin:
- ST THOMAS MORE ELEMENTARY SCHOOL (Students: 271, Location: 1625 W HIGHLAND AVE, Grades: PK-8)
- ST MARY SCHOOL (Students: 220, Location: 103 S GIFFORD ST, Grades: KG-8)
- ST JOHNS LUTHERAN SCHOOL (Students: 213, Location: 109 N SPRING ST, Grades: PK-8)
- ST JOSEPH CATHOLIC SCHOOL (Students: 211, Location: 274 DIVISION ST, Grades: PK-8)
- ST LAURENCE ELEMENTARY SCHOOL (Students: 210, Location: 572 STANDISH ST, Grades: PK-8)
- DA VINCI ACADEMY (Students: 130, Location: 37W080 HOPPS RD, Grades: PK-8)
- HIGHLAND CHRISTIAN ACADEMY (Students: 119, Location: 2250 W HIGHLAND AVE, Grades: PK-8)
Library in Elgin:
- GAIL BORDEN PUBLIC LIBRARY DISTRICT (Operating income: $12,437,003; Location: 270 NORTH GROVE AVENUE; 407,074 books; 2,388 e-books; 36,617 audio materials; 22,771 video materials; 34 local licensed databases; 14 state licensed databases; 9 other licensed databases; 719 print serial subscriptions; 3 electronic serial subscriptions)
User-submitted facts and corrections:
- The link to the "Local government website is now: http://www.cityofelgin.org/
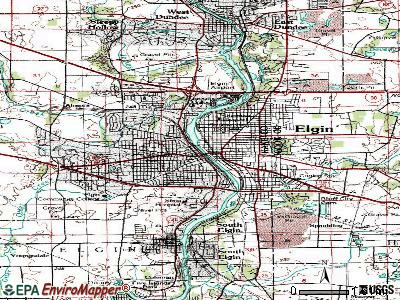
Points of interest:
Notable locations in Elgin: Spartan Meadows Golf Course (A), Fox Bluff Corporate Center (B), Elgin Corporate Center (C), Westfield Business Park (D), Northwest Corporate Center (E), Nor-West Marina (F), Fox Valley Professional Park (G), Jaynes Industrial Park (H), Maywood Park Training Track (I), Riverside Water Treatment Plant (J), Elgin City Hall (K), Elgin Fire Barn Number 5 Museum (L), Elgin Fire Department Station 1 (M), Elgin Fire Department Station 2 (N), Elgin Fire Department Station 3 (O), Elgin Fire Department Station 4 (P), Benjamin P Browne Library (Q), Harm A Weber Administration Building (R), Ohio Hall (S), Volkman Hall (T). Display/hide their locations on the map
Shopping Centers: Wing Park Manor Shopping Center (1), Tyler Creek Plaza Shopping Center (2), Randall Lake Crossing Shopping Center (3), Sunset Center Shopping Center (4), Town and Country Plaza Shopping Center (5), Cobblers Crossing Shopping Center (6), Summit Square Shopping Center (7), Fox River Plaza Shopping Center (8), Clock Tower Plaza Shopping Center (9). Display/hide their locations on the map
Main business address in Elgin include: MIDDLEBY CORP (A), EFC BANCORP INC (B). Display/hide their locations on the map
Churches in Elgin include: Calvary Baptist Church (A), Calvary Lutheran Church (B), Church of the Redeemer (C), El Mesias United Methodist Church (D), Epworth Church (E), Faith United Methodist Church (F), First Church of Christ (G), First Congregational Church (H), First Missionary Baptist Church (I). Display/hide their locations on the map
Cemeteries: Bluff City Cemetery (1), Mount Hope Cemetery (2), Elgin State Hospital Cemetery (3). Display/hide their locations on the map
Lakes and swamps: Willow Lake (A), Bluff Spring Fen (B). Display/hide their locations on the map
Creek: Tyler Creek (A). Display/hide its location on the map
Parks in Elgin include: Memorial Stadium (1), Poplar Creek County Forest Preserve (2), Elgin Shores County Forest Preserve (3), College Park (4), Zayres Park (5), Millennium Park (6), Willow Bay Park (7), Kiwanis Park (8), Wright Avenue Park (9). Display/hide their locations on the map
Tourist attractions: Elgin Fire Barn No 5 Museum (533 Saint Charles Street) (1), Elgin Area Historical Society (Museums; 360 Park Street) (2), MPI Springs- Inc. (Recreation Areas; 2521 Technology Dr Suite 208) (3), Elgin Area Convention Visitors Bureau (77 South Riverside Drive) (4). Display/hide their approximate locations on the map
Hotels: Elgin-Days Inn (1585 Dundee Ave) (1), Colonial Lodge Motel (788 Villa Street) (2), Crowne Plaza (575 Tollgate Road) (3), Best Western Plaza Hotel & Convention Center (345 West River Road) (4), Country Inn-Suites Elgin (2270 Point Boulevard) (5), Crowne Plaza Hotel of Elgin (495 Airport Road) (6), Hampton Inn Chicago Elgin / I-90 (405 Airport Road) (7), Chicago/Elgin Super 8 Motel (435 Airport Rd) (8), Country Inn & Suites by Carlson-Elgin (2270 Point Boulevard) (9). Display/hide their approximate locations on the map
Court: Illinois State - Appellate Court- 2nd District Clerk's Ofc (55 Symphony Way) (1). Display/hide its approximate location on the map
Birthplace of: Madman Muntz - Advertising pioneer, David Otunga - Professional wrestler, Ray Barnhart - Politician, William Dale Phillips - Chemist, Angel Leigh McCoy - Game designer and fiction writer, Bethany Goldsmith - Girls Professional Baseball League player, Earl Muetterties - Chemist, Bill Mehlhorn - Professional golfer, Steve Rauschenberger - Politician, William M. Hartmann - Scientist.
Drinking water stations with addresses in Elgin and their reported violations in the past:
CENTURY PINES APARTMENTS (Population served: 50, Groundwater):Past monitoring violations:NEW CREATIONS PRESCHOOL (Population served: 25, Groundwater):
- Monitoring and Reporting (DBP) - Between OCT-2007 and DEC-2007, Contaminant: Chlorine. Follow-up actions: St Violation/Reminder Notice (JAN-18-2008), St Compliance achieved (FEB-04-2008)
- Monitoring and Reporting (DBP) - Between APR-2007 and JUN-2007, Contaminant: Chlorine. Follow-up actions: St Compliance achieved (JUL-01-2007), St Public Notif requested (JUL-18-2007), St Violation/Reminder Notice (JUL-18-2007), St Public Notif received (JUL-30-2007)
Past health violations:Past monitoring violations:
- MCL, Monthly (TCR) - Between APR-2007 and JUN-2007, Contaminant: Coliform. Follow-up actions: St Formal NOV issued (MAY-21-2007), St Public Notif received (MAY-23-2007), St Compliance achieved (MAY-29-2007), St Site Visit (enforcement) (MAY-29-2007)
- One routine major monitoring violation
Drinking water stations with addresses in Elgin that have no violations reported:
| This city: | 3.0 people |
| Illinois: | 2.6 people |
| This city: | 72.0% |
| Whole state: | 65.8% |
| This city: | 7.7% |
| Whole state: | 6.3% |
Likely homosexual households (counted as self-reported same-sex unmarried-partner households)
- Lesbian couples: 0.5% of all households
- Gay men: 0.3% of all households
People in group quarters in Elgin in 2010:
- 699 people in nursing facilities/skilled-nursing facilities
- 588 people in college/university student housing
- 308 people in mental (psychiatric) hospitals and psychiatric units in other hospitals
- 181 people in other noninstitutional facilities
- 55 people in emergency and transitional shelters (with sleeping facilities) for people experiencing homelessness
- 54 people in residential treatment centers for adults
- 22 people in group homes for juveniles (non-correctional)
- 19 people in group homes intended for adults
- 15 people in workers' group living quarters and job corps centers
- 12 people in residential treatment centers for juveniles (non-correctional)
People in group quarters in Elgin in 2000:
- 613 people in nursing homes
- 494 people in college dormitories (includes college quarters off campus)
- 257 people in mental (psychiatric) hospitals or wards
- 243 people in state prisons
- 145 people in other noninstitutional group quarters
- 42 people in homes or halfway houses for drug/alcohol abuse
- 41 people in homes for the mentally ill
- 34 people in other group homes
- 32 people in halfway houses
- 4 people in religious group quarters
- 3 people in other nonhousehold living situations
Banks with most branches in Elgin (2011 data):
- JPMorgan Chase Bank, National Association: Larkin Branch, Mcclean, Elgin Branch, Elgin Randall Rd Branch, Shady Oaks. Info updated 2011/11/10: Bank assets: $1,811,678.0 mil, Deposits: $1,190,738.0 mil, headquarters in Columbus, OH, positive income, International Specialization, 5577 total offices, Holding Company: Jpmorgan Chase & Co.
- PNC Bank, National Association: South Elgin Branch, 850 Summit St Branch, Larkin Branch, Grove Branch. Info updated 2012/03/20: Bank assets: $263,309.6 mil, Deposits: $197,343.0 mil, headquarters in Wilmington, DE, positive income, Commercial Lending Specialization, 3085 total offices, Holding Company: Pnc Financial Services Group, Inc., The
- St. Charles Bank & Trust Company: Elgin Branch, Mclean Office, Summit Branch. Info updated 2011/10/05: Bank assets: $614.3 mil, Deposits: $533.4 mil, headquarters in Saint Charles, IL, positive income, Commercial Lending Specialization, 5 total offices, Holding Company: Wintrust Financial Corporation
- Fifth Third Bank: Waverly Branch, Highland Branch, Larkin Branch. Info updated 2009/10/05: Bank assets: $114,540.4 mil, Deposits: $89,689.1 mil, headquarters in Cincinnati, OH, positive income, Commercial Lending Specialization, 1378 total offices, Holding Company: Fifth Third Bancorp
- First Community Bank: Tyler Creek Plaza Banking Center at 50 Tyler Creek Plaza, branch established on 2000/06/20; at 165 South Randall Road, branch established on 1993/10/04. Info updated 2006/11/03: Bank assets: $168.5 mil, Deposits: $142.0 mil, local headquarters, positive income, Commercial Lending Specialization, 2 total offices, Holding Company: First Community Financial Corporation
- Old Second National Bank: Elgin-Route 20 Branch at 3290 Us Highway 20 And Nesler Road, branch established on 2006/11/06; Elgin Mclean Branch at 1000 S Mclean Blvd, branch established on 2006/11/06. Info updated 2008/03/03: Bank assets: $1,939.3 mil, Deposits: $1,741.1 mil, headquarters in Aurora, IL, positive income, Commercial Lending Specialization, 27 total offices, Holding Company: Old Second Bancorp, Inc.
- Bank of America, National Association: Elgin - Randall And College Gree at 635 S. Randall Road, branch established on 2006/11/22; Elgin Branch at 2000 Big Timber Road, branch established on 2001/05/07. Info updated 2009/11/18: Bank assets: $1,451,969.3 mil, Deposits: $1,077,176.8 mil, headquarters in Charlotte, NC, positive income, 5782 total offices, Holding Company: Bank Of America Corporation
- Associated Bank, National Association: Elgin Branch at 16 North Spring Street, branch established on 1883/01/01; West Elgin Branch at 2001 Larkin Avenue, branch established on 2001/06/30. Info updated 2008/09/12: Bank assets: $21,715.0 mil, Deposits: $15,244.4 mil, headquarters in Green Bay, WI, positive income, Commercial Lending Specialization, 282 total offices, Holding Company: Associated Banc-Corp
- BMO Harris Bank National Association: Elgin - Dundee Branch at 250 Dundee Avenue, branch established on 2003/11/17; Elgin - Mclean Branch at 170 N Mc Lean Blvd, branch established on 2003/11/20. Info updated 2011/07/14: Bank assets: $97,264.0 mil, Deposits: $75,624.6 mil, headquarters in Chicago, IL, positive income, 717 total offices, Holding Company: Bank Of Montreal
- 7 other banks with 8 local branches
For population 15 years and over in Elgin:
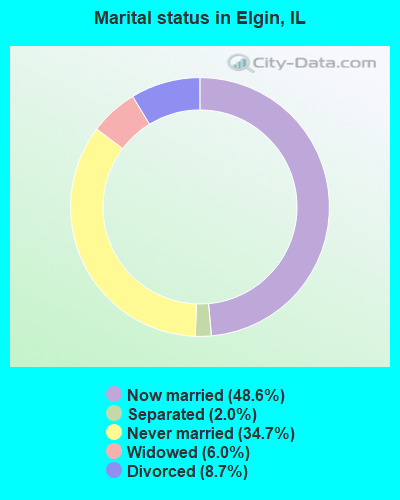
- Never married: 34.7%
- Now married: 48.6%
- Separated: 2.0%
- Widowed: 6.0%
- Divorced: 8.7%
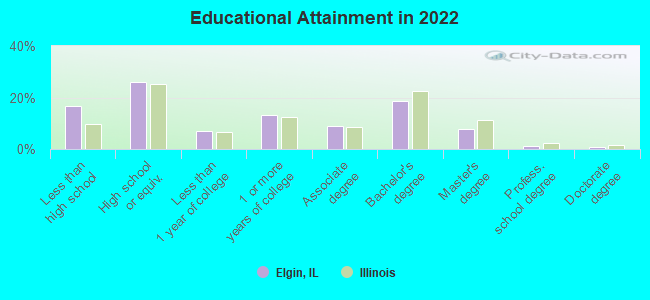
For population 25 years and over in Elgin:
- High school or higher: 83.4%
- Bachelor's degree or higher: 28.0%
- Graduate or professional degree: 9.5%
- Unemployed: 5.8%
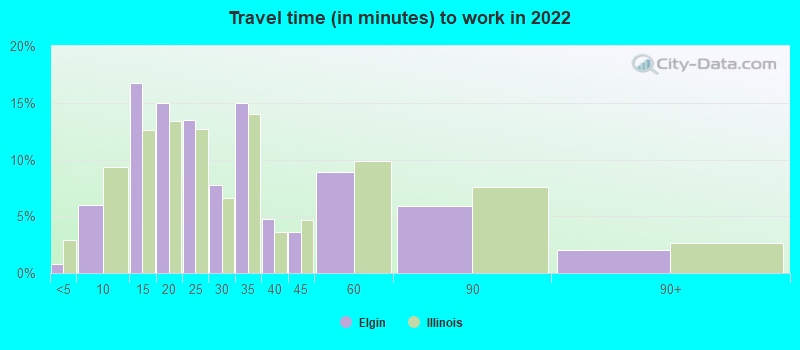
- Mean travel time to work (commute): 24.6 minutes
| Here: | 15.1 |
| Illinois average: | 12.5 |
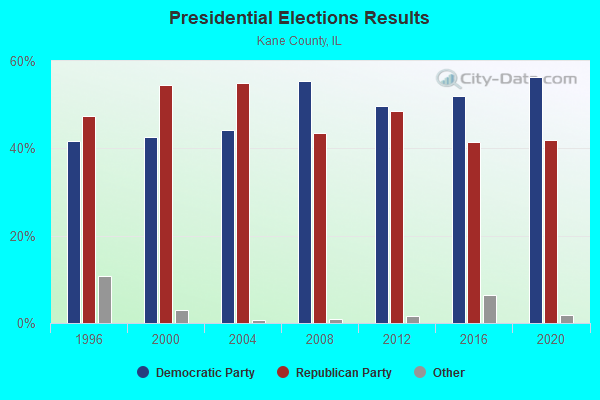
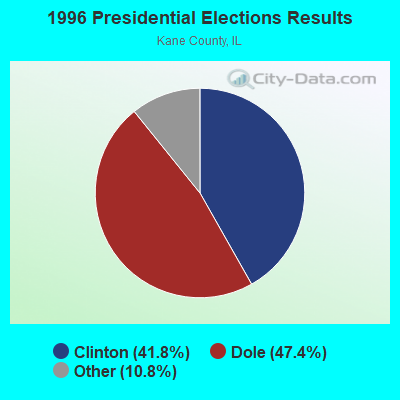
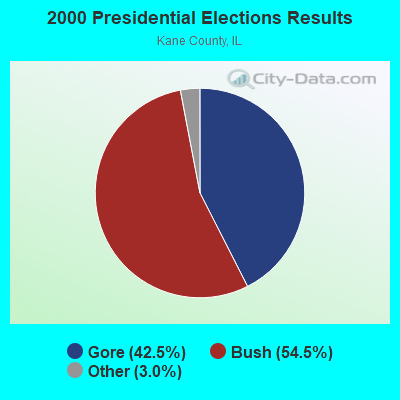
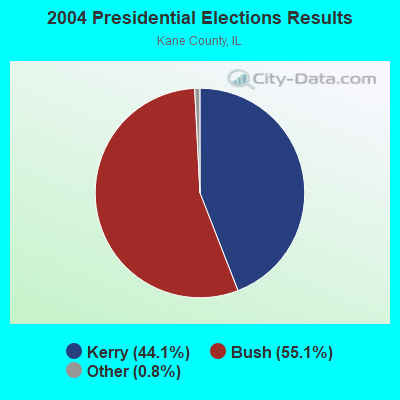
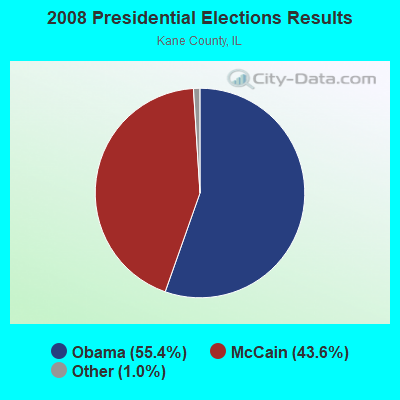
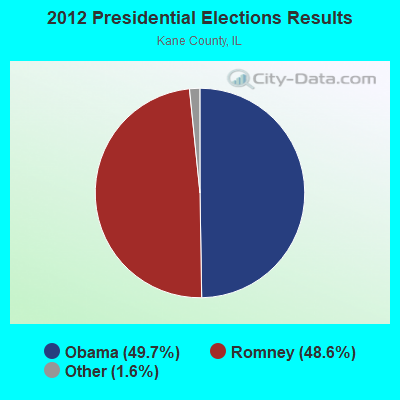
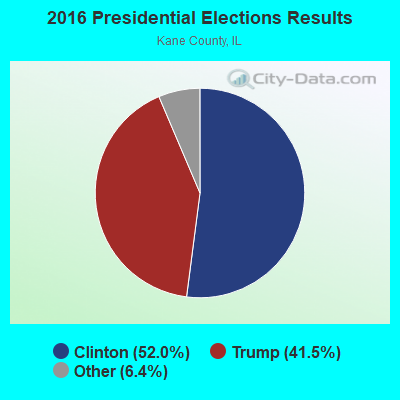
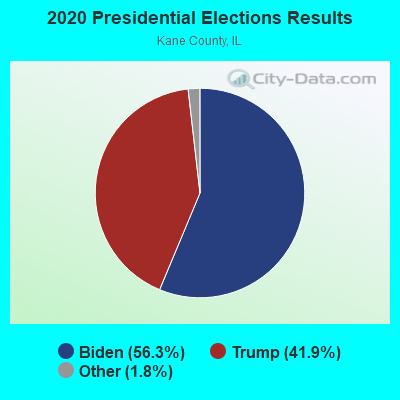
Graphs represent county-level data. Detailed 2008 Election Results
Religion statistics for Elgin, IL (based on Kane County data)
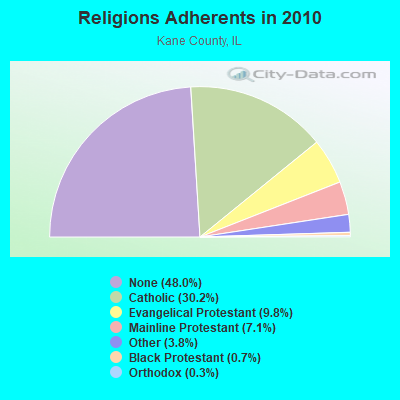
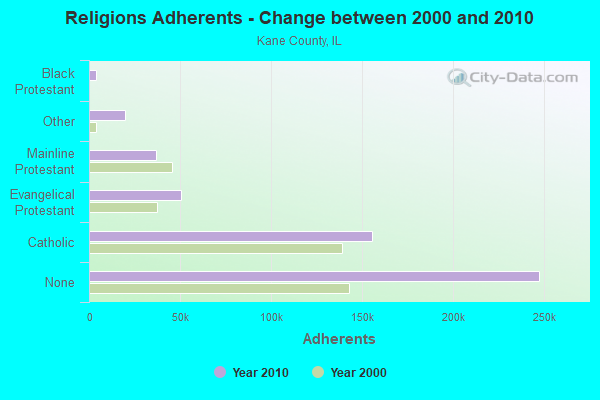
| Religion | Adherents | Congregations |
|---|---|---|
| Catholic | 155,391 | 28 |
| Evangelical Protestant | 50,728 | 184 |
| Mainline Protestant | 36,576 | 72 |
| Other | 19,744 | 30 |
| Black Protestant | 3,679 | 10 |
| Orthodox | 1,630 | 2 |
| None | 247,521 | - |
Food Environment Statistics:
| Kane County: | 1.61 / 10,000 pop. |
| State: | 2.24 / 10,000 pop. |
| Kane County: | 0.08 / 10,000 pop. |
| Illinois: | 0.08 / 10,000 pop. |
| Kane County: | 0.54 / 10,000 pop. |
| State: | 0.75 / 10,000 pop. |
| Kane County: | 1.95 / 10,000 pop. |
| Illinois: | 2.61 / 10,000 pop. |
| This county: | 5.90 / 10,000 pop. |
| State: | 6.86 / 10,000 pop. |
| This county: | 7.2% |
| Illinois: | 8.3% |
| Kane County: | 27.2% |
| State: | 25.2% |
| Here: | 15.1% |
| Illinois: | 14.5% |
Health and Nutrition:
| This city: | 47.3% |
| Illinois: | 49.5% |
| Here: | 46.2% |
| Illinois: | 47.2% |
| This city: | 28.4 |
| Illinois: | 28.6 |
| This city: | 21.8% |
| Illinois: | 20.5% |
| Here: | 10.1% |
| State: | 10.8% |
| Elgin: | 6.8 |
| Illinois: | 6.8 |
| This city: | 31.4% |
| Illinois: | 33.4% |
| This city: | 55.7% |
| State: | 56.4% |
| This city: | 80.7% |
| Illinois: | 79.9% |
More about Health and Nutrition of Elgin, IL Residents
| Local government employment and payroll (March 2022) | |||||
| Function | Full-time employees | Monthly full-time payroll | Average yearly full-time wage | Part-time employees | Monthly part-time payroll |
|---|---|---|---|---|---|
| Police Protection - Officers | 188 | $1,684,230 | $107,504 | 0 | $0 |
| Firefighters | 131 | $1,354,614 | $124,087 | 0 | $0 |
| Other Government Administration | 69 | $473,124 | $82,282 | 2 | $2,699 |
| Parks and Recreation | 65 | $313,966 | $57,963 | 183 | $187,824 |
| Police - Other | 60 | $424,660 | $84,932 | 20 | $27,016 |
| Water Supply | 42 | $36,014 | $10,290 | 1 | $2,183 |
| Financial Administration | 31 | $237,114 | $91,786 | 7 | $7,518 |
| Streets and Highways | 31 | $250,470 | $96,956 | 2 | $2,265 |
| Sewerage | 25 | $198,212 | $95,142 | 0 | $0 |
| Other and Unallocable | 11 | $81,650 | $89,073 | 15 | $28,357 |
| Judicial and Legal | 8 | $79,159 | $118,739 | 0 | $0 |
| Fire - Other | 7 | $35,035 | $60,060 | 1 | $1,993 |
| Natural Resources | 3 | $19,319 | $77,276 | 1 | $4,339 |
| Totals for Government | 671 | $5,187,566 | $92,773 | 232 | $264,193 |
Elgin government finances - Expenditure in 2021 (per resident):
- Construction - Water Utilities: $2,233,000 ($19.73)
Central Staff Services: $2,133,000 ($18.85)
Regular Highways: $1,959,000 ($17.31)
Sewerage: $247,000 ($2.18)
Parks and Recreation: $103,000 ($0.91)
- Current Operations - Police Protection: $51,390,000 ($454.07)
Local Fire Protection: $31,983,000 ($282.59)
Water Utilities: $19,721,000 ($174.25)
Parks and Recreation: $15,626,000 ($138.07)
Regular Highways: $9,437,000 ($83.38)
Solid Waste Management: $7,320,000 ($64.68)
General - Other: $6,985,000 ($61.72)
Central Staff Services: $6,670,000 ($58.93)
Protective Inspection and Regulation - Other: $3,302,000 ($29.18)
Financial Administration: $2,324,000 ($20.53)
Public Welfare - Other: $1,323,000 ($11.69)
General Public Buildings: $1,227,000 ($10.84)
Miscellaneous Commercial Activities - Other: $557,000 ($4.92)
- General - Interest on Debt: $2,319,000 ($20.49)
- Intergovernmental to Local - Other - General - Other: $3,767,000 ($33.28)
- Other Capital Outlay - Central Staff Services: $1,511,000 ($13.35)
Water Utilities: $1,438,000 ($12.71)
Parks and Recreation: $1,233,000 ($10.89)
Local Fire Protection: $268,000 ($2.37)
Police Protection: $213,000 ($1.88)
Parking Facilities: $101,000 ($0.89)
- Total Salaries and Wages: $72,507,000 ($640.65)
Elgin government finances - Revenue in 2021 (per resident):
- Charges - Other: $9,994,000 ($88.30)
Solid Waste Management: $6,775,000 ($59.86)
Sewerage: $6,143,000 ($54.28)
Parks and Recreation: $5,358,000 ($47.34)
- Federal Intergovernmental - Public Welfare: $6,594,000 ($58.26)
Other: $216,000 ($1.91)
Highways: $40,000 ($0.35)
- Local Intergovernmental - Other: $1,281,000 ($11.32)
- Miscellaneous - General Revenue - Other: $4,601,000 ($40.65)
Interest Earnings: $1,484,000 ($13.11)
Fines and Forfeits: $1,292,000 ($11.42)
- Revenue - Water Utilities: $24,204,000 ($213.86)
- State Intergovernmental - General Local Government Support: $39,005,000 ($344.64)
Highways: $6,674,000 ($58.97)
Public Welfare: $48,000 ($0.42)
- Tax - Property: $54,274,000 ($479.55)
General Sales and Gross Receipts: $14,039,000 ($124.04)
Public Utilities Sales: $7,907,000 ($69.86)
Other Selective Sales: $4,568,000 ($40.36)
Other License: $2,139,000 ($18.90)
Elgin government finances - Debt in 2021 (per resident):
- Long Term Debt - Beginning Outstanding - Unspecified Public Purpose: $67,255,000 ($594.25)
Outstanding Unspecified Public Purpose: $60,845,000 ($537.61)
Retired Unspecified Public Purpose: $18,305,000 ($161.74)
Issue, Unspecified Public Purpose: $11,895,000 ($105.10)
Elgin government finances - Cash and Securities in 2021 (per resident):
- Other Funds - Cash and Securities: $188,736,000 ($1667.62)
7.35% of this county's 2020 resident taxpayers moved to other counties in 2021 ($81,683 average adjusted gross income)
| Here: | 7.35% |
| Illinois average: | 6.10% |
0.01% of residents moved to foreign countries ($73 average AGI)
Kane County: 0.01% Illinois average: 0.01%
Top counties to which taxpayers relocated from this county between 2020 and 2021:
| to Cook County, IL | |
| to DuPage County, IL | |
| to McHenry County, IL |
| Businesses in Elgin, IL | ||||
| Name | Count | Name | Count | |
|---|---|---|---|---|
| 7-Eleven | 4 | Jimmy John's | 2 | |
| ALDI | 2 | KFC | 2 | |
| Ace Hardware | 2 | Little Caesars Pizza | 2 | |
| Advance Auto Parts | 2 | Lowe's | 1 | |
| Applebee's | 1 | MasterBrand Cabinets | 9 | |
| Arby's | 1 | Mazda | 1 | |
| AutoZone | 2 | McDonald's | 5 | |
| Baskin-Robbins | 4 | Meijer | 1 | |
| Blockbuster | 3 | Menards | 1 | |
| Burger King | 3 | Nike | 4 | |
| Burlington Coat Factory | 1 | Nissan | 1 | |
| CVS | 1 | OfficeMax | 1 | |
| Caribou Coffee | 1 | Panera Bread | 1 | |
| Circle K | 1 | Papa John's Pizza | 1 | |
| Comfort Suites | 1 | Payless | 1 | |
| Cricket Wireless | 3 | Pizza Hut | 2 | |
| Curves | 1 | Popeyes | 1 | |
| DHL | 1 | Quality | 1 | |
| Dairy Queen | 4 | Quiznos | 1 | |
| Decora Cabinetry | 2 | RadioShack | 1 | |
| Discount Tire | 1 | Sears | 1 | |
| Domino's Pizza | 1 | Sprint Nextel | 1 | |
| Dunkin Donuts | 5 | Starbucks | 2 | |
| Fashion Bug | 1 | Steak 'n Shake | 1 | |
| FedEx | 15 | Super 8 | 3 | |
| Firestone Complete Auto Care | 1 | T-Mobile | 3 | |
| GNC | 1 | Taco Bell | 3 | |
| H&R Block | 4 | Target | 1 | |
| Hilton | 1 | Toyota | 1 | |
| Hobby Lobby | 1 | U-Haul | 4 | |
| Holiday Inn | 2 | U.S. Cellular | 1 | |
| Home Depot | 1 | UPS | 19 | |
| Honda | 1 | Walgreens | 2 | |
| Hyundai | 1 | Walmart | 1 | |
| IHOP | 1 | Wendy's | 3 | |
| Jewel-Osco | 2 | YMCA | 2 | |
Strongest AM radio stations in Elgin:
- WSCR (670 AM; 50 kW; CHICAGO, IL; Owner: INFINITY BROADCASTING OPERATIONS, INC.)
- WGN (720 AM; 50 kW; CHICAGO, IL; Owner: WGN CONTINENTAL BROADCASTING CO.)
- WBBM (780 AM; 50 kW; CHICAGO, IL; Owner: INFINITY BROADCASTING OPERATIONS, INC.)
- WRMN (1410 AM; 1 kW; ELGIN, IL; Owner: ELGIN BROADCASTING CO., INC.)
- WMVP (1000 AM; 50 kW; CHICAGO, IL; Owner: ABC, INC.)
- WYLL (1160 AM; 50 kW; CHICAGO, IL; Owner: SCA LICENSE CORPORATION)
- WLS (890 AM; 50 kW; CHICAGO, IL; Owner: WLS, INC.)
- WTMJ (620 AM; 50 kW; MILWAUKEE, WI; Owner: JOURNAL BROADCAST CORPORATION)
- WNVR (1030 AM; 5 kW; VERNON HILLS, IL; Owner: POLNET COMMUNICATIONS, LTD.)
- WISN (1130 AM; 50 kW; MILWAUKEE, WI; Owner: CAPSTAR TX LIMITED PARTNERSHIP)
- WMBI (1110 AM; daytime; 5 kW; CHICAGO, IL; Owner: THE MOODY BIBLE INSTITUTE OF CHICAGO)
- WAIT (850 AM; daytime; 2 kW; CRYSTAL LAKE, IL; Owner: NM LICENSING, LLC)
- WVIV (1200 AM; 20 kW; CHICAGO, IL; Owner: WLXX-AM LICENSE CORP.)
Strongest FM radio stations in Elgin:
- WJKL (94.3 FM; ELGIN, IL; Owner: ELGIN BROADCASTING CO., INC.)
- WEPS (88.9 FM; ELGIN, IL; Owner: BD. OF ED. UNION SCHOOL DISTRICT #46)
- WZCH (103.9 FM; DUNDEE, IL; Owner: ENTRAVISION HOLDINGS, LLC)
- WZSR (105.5 FM; WOODSTOCK, IL; Owner: NM LICENSING, LLC)
- WCKG (105.9 FM; ELMWOOD PARK, IL; Owner: INFINITY HOLDINGS CORPORATION OF ORLANDO)
- WLIT-FM (93.9 FM; CHICAGO, IL; Owner: AMFM RADIO LICENSES, L.L.C.)
- WJMK (104.3 FM; CHICAGO, IL; Owner: INFINITY BROADCASTING CORP. OF ILLINOIS)
- WNUA (95.5 FM; CHICAGO, IL; Owner: AMFM RADIO LICENSES, L.L.C.)
- WTMX (101.9 FM; SKOKIE, IL; Owner: BONNEVILLE HOLDING COMPANY)
- WGCI-FM (107.5 FM; CHICAGO, IL; Owner: AMFM RADIO LICENSES, L.L.C.)
- WBBM-FM (96.3 FM; CHICAGO, IL; Owner: INFINITY BROADCASTING OPERATIONS, INC.)
- WKSC-FM (103.5 FM; CHICAGO, IL; Owner: AMFM RADIO LICENSES, L.L.C.)
- WFMT (98.7 FM; CHICAGO, IL; Owner: WINDOW TO THE WORLD COMMUNICATIONS)
- WZZN (94.7 FM; CHICAGO, IL; Owner: ABC CHICAGO FM RADIO,INC.)
- WLEY-FM (107.9 FM; AURORA, IL; Owner: WLEY LICENSING, INC.)
- WBEZ (91.5 FM; CHICAGO, IL; Owner: THE WBEZ ALLIANCE, INC.)
- WKQX (101.1 FM; CHICAGO, IL; Owner: EMMIS RADIO LICENSE CORPORATION)
- WLUP-FM (97.9 FM; CHICAGO, IL; Owner: BONNEVILLE HOLDING COMPANY)
- WNND (100.3 FM; CHICAGO, IL; Owner: BONNEVILLE HOLDING COMPANY)
- WOJO (105.1 FM; EVANSTON, IL; Owner: TICHENOR LICENSE CORPORATION ("TLC"))
TV broadcast stations around Elgin:
- W57DN (Channel 57; ELGIN, IL; Owner: TRINITY BROADCASTING NETWORK)
- W34CK (Channel 34; ARLINGTON HEIGHTS, IL; Owner: FIRST UNITED, INC.)
- WLS-TV (Channel 7; CHICAGO, IL; Owner: WLS TELEVISION, INC.)
- WMAQ-TV (Channel 5; CHICAGO, IL; Owner: NBC SUBSIDIARY (WMAQ-TV), INC.)
- WTTW (Channel 11; CHICAGO, IL; Owner: WINDOW TO THE WORLD COMMUNICATIONS, INC.)
- WGN-TV (Channel 9; CHICAGO, IL; Owner: WGN CONTINENTAL BROADCASTING COMPANY)
- WGBO-TV (Channel 66; JOLIET, IL; Owner: WGBO LICENSE PARTNERSHIP, G.P.)
- WBBM-TV (Channel 2; CHICAGO, IL; Owner: CBS BROADCASTING INC.)
- WPWR-TV (Channel 50; GARY, IN; Owner: FOX TELEVISION STATIONS, INC.)
- WXFT (Channel 60; AURORA, IL; Owner: TELEFUTURA CHICAGO LLC)
- W64CQ (Channel 64; ARLINGTON HEIGHTS, IL; Owner: TRINITY BROADCASTING NETWORK)
- WCIU-TV (Channel 26; CHICAGO, IL; Owner: WCIU-TV LIMITED PARTNERSHIP)
- WCPX (Channel 38; CHICAGO, IL; Owner: PAXSON CHICAGO LICENSE, INC.)
- WFLD (Channel 32; CHICAGO, IL; Owner: FOX TELEVISION STATIONS, INC.)
- W68DO (Channel 68; PALATINE, IL; Owner: TRINITY BROADCASTING NETWORK)
- WFBT-CA (Channel 23; CHICAGO, IL; Owner: CHANNEL 23 LIMITED PARTNERSHIP)
- WSNS-TV (Channel 44; CHICAGO, IL; Owner: TELEMUNDO OF CHICAGO, INC.)
- WJYS (Channel 62; HAMMOND, IN; Owner: JOVON BROADCASTING CORPORATION)
- W24AJ (Channel 24; AURORA, IL; Owner: NELSON TV, INC.)
- WOCH-LP (Channel 28; CHICAGO, IL; Owner: KM LPTV OF CHICAGO-28, L.L.C.)
- WYCC (Channel 20; CHICAGO, IL; Owner: COLLEGE DIST. #508, COUNTY OF COOK)
- WOCK-CA (Channel 13; CHICAGO, IL; Owner: KM LPTV OF CHICAGO-13, L.L.C.)
- WSPY-LP (Channel 30; PLANO, IL; Owner: WSPY-TV, INC.)
- W54BE (Channel 54; SUGAR GROVE, IL; Owner: WAUBONSEE COMMUNITY COLLEGE)
- National Bridge Inventory (NBI) Statistics
- 72Number of bridges
- 1,119ft / 341mTotal length
- $8,149,000Total costs
- 1,546,850Total average daily traffic
- 205,527Total average daily truck traffic
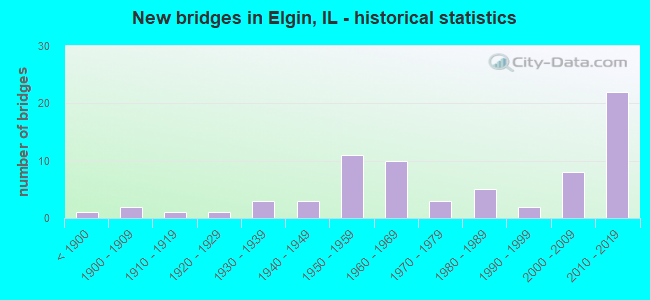
- New bridges - historical statistics
- 1Before 1900
- 21900-1909
- 11910-1919
- 11920-1929
- 31930-1939
- 31940-1949
- 111950-1959
- 101960-1969
- 31970-1979
- 51980-1989
- 21990-1999
- 82000-2009
- 222010-2019
FCC Registered Antenna Towers: 279 (See the full list of FCC Registered Antenna Towers)
FCC Registered Commercial Land Mobile Towers: 1 (See the full list of FCC Registered Commercial Land Mobile Towers in Elgin, IL)
FCC Registered Private Land Mobile Towers: 3 (See the full list of FCC Registered Private Land Mobile Towers)
FCC Registered Broadcast Land Mobile Towers: 73 (See the full list of FCC Registered Broadcast Land Mobile Towers)
FCC Registered Microwave Towers: 82 (See the full list of FCC Registered Microwave Towers in this town)
FCC Registered Paging Towers: 14 (See the full list of FCC Registered Paging Towers)
FCC Registered Amateur Radio Licenses: 332 (See the full list of FCC Registered Amateur Radio Licenses in Elgin)
FAA Registered Aircraft Manufacturers and Dealers: 4 (See the full list of FAA Registered Manufacturers and Dealers in Elgin)
FAA Registered Aircraft: 55 (See the full list of FAA Registered Aircraft)
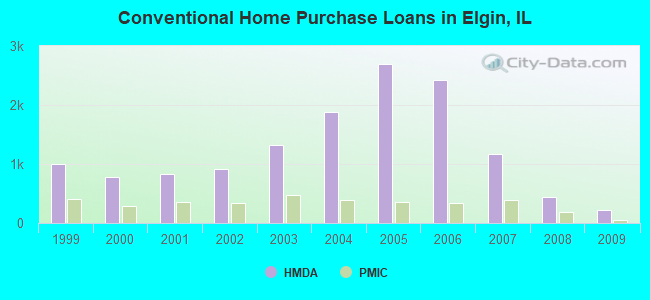
| Home Mortgage Disclosure Act Aggregated Statistics For Year 2009 (Based on 8 full and 11 partial tracts) | ||||||||||||||
| A) FHA, FSA/RHS & VA Home Purchase Loans | B) Conventional Home Purchase Loans | C) Refinancings | D) Home Improvement Loans | E) Loans on Dwellings For 5+ Families | F) Non-occupant Loans on < 5 Family Dwellings (A B C & D) | G) Loans On Manufactured Home Dwelling (A B C & D) | ||||||||
|---|---|---|---|---|---|---|---|---|---|---|---|---|---|---|
| Number | Average Value | Number | Average Value | Number | Average Value | Number | Average Value | Number | Average Value | Number | Average Value | Number | Average Value | |
| LOANS ORIGINATED | 336 | $163,676 | 221 | $155,644 | 1,572 | $194,396 | 35 | $65,558 | 16 | $446,236 | 103 | $123,452 | 6 | $136,767 |
| APPLICATIONS APPROVED, NOT ACCEPTED | 26 | $145,825 | 40 | $147,494 | 171 | $201,807 | 7 | $63,751 | 0 | $0 | 11 | $113,469 | 6 | $39,230 |
| APPLICATIONS DENIED | 78 | $150,558 | 73 | $143,840 | 618 | $188,564 | 43 | $71,511 | 4 | $661,488 | 37 | $162,058 | 7 | $27,866 |
| APPLICATIONS WITHDRAWN | 36 | $153,373 | 24 | $198,448 | 284 | $194,656 | 5 | $102,532 | 4 | $530,130 | 16 | $101,397 | 0 | $0 |
| FILES CLOSED FOR INCOMPLETENESS | 16 | $144,252 | 13 | $174,252 | 91 | $201,914 | 3 | $112,900 | 0 | $0 | 3 | $170,930 | 1 | $82,530 |
Detailed mortgage data for all 18 tracts in Elgin, IL
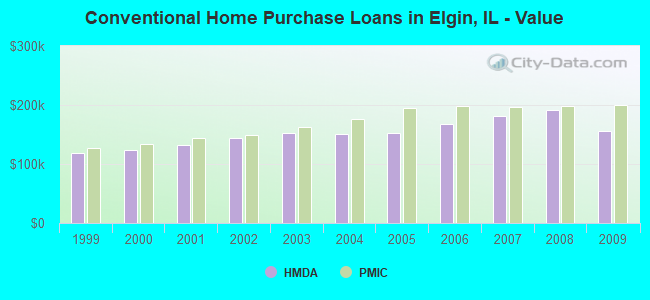
| Private Mortgage Insurance Companies Aggregated Statistics For Year 2009 (Based on 8 full and 10 partial tracts) | ||||||
| A) Conventional Home Purchase Loans | B) Refinancings | C) Non-occupant Loans on < 5 Family Dwellings (A & B) | ||||
|---|---|---|---|---|---|---|
| Number | Average Value | Number | Average Value | Number | Average Value | |
| LOANS ORIGINATED | 55 | $200,129 | 35 | $230,564 | 0 | $0 |
| APPLICATIONS APPROVED, NOT ACCEPTED | 26 | $203,036 | 21 | $223,543 | 1 | $155,000 |
| APPLICATIONS DENIED | 13 | $165,386 | 14 | $220,316 | 0 | $0 |
| APPLICATIONS WITHDRAWN | 7 | $196,690 | 9 | $184,930 | 0 | $0 |
| FILES CLOSED FOR INCOMPLETENESS | 3 | $215,630 | 2 | $249,185 | 0 | $0 |
2002 - 2018 National Fire Incident Reporting System (NFIRS) incidents
- Fire incident types reported to NFIRS in Elgin, IL
- 2,51245.3%Structure Fires
- 1,91134.5%Outside Fires
- 91916.6%Mobile Property/Vehicle Fires
- 2013.6%Other
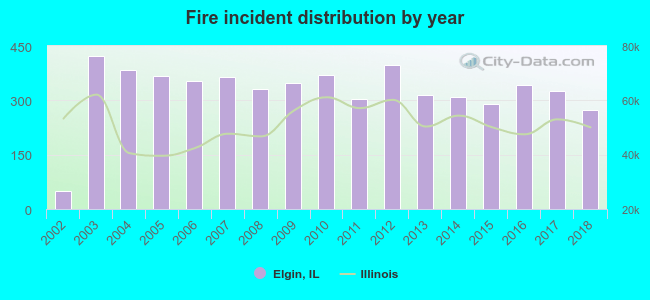 According to the data from the years 2002 - 2018 the average number of fires per year is 326. The highest number of reported fires - 422 took place in 2003, and the least - 49 in 2002. The data has an increasing trend.
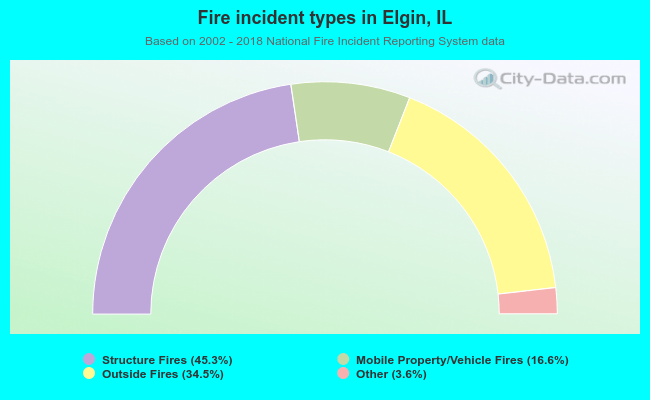 When looking into fire subcategories, the most incidents belonged to: Structure Fires (45.3%), and Outside Fires (34.5%).
Fire-safe hotels and motels in Elgin, Illinois:
- Super 8 Motel Elgin, 425 Airport Rd, Elgin, Illinois 60123 , Phone: (708) 697-8828
- Quality Inn, 500 Tollgate Rd, Elgin, Illinois 60123 , Phone: (847) 608-7300, Fax: (847) 931-4894
- Days Inn Elgin, 1585 Dundee Ave, Elgin, Illinois 60120 , Phone: (847) 695-2100, Fax: (847) 697-9114
- Colonial Lodge Motel, 788 Villa St, Elgin, Illinois 60120 , Phone: (847) 742-2790, Fax: (847) 742-0019
- Hampton Inn Elgin, 405 Airport Rd, Elgin, Illinois 60123 , Phone: (847) 931-1940, Fax: (847) 931-5190
- Holiday Inn Hotel & Suites Chicago-Northwest, 495 Airport Rd, Elgin, Illinois 60123 , Phone: (847) 488-9000, Fax: (847) 488-9800
- Country Inn & Suites By Carlson Elgin, 2270 Point Blvd, Elgin, Illinois 60123 , Phone: (847) 426-6400, Fax: (847) 426-6410
- Comfort Suites, 2480 Bushwood Dr, Elgin, Illinois 60123 , Phone: (847) 836-9500, Fax: (847) 836-9520
- Candlewood Suites, 1780 Capital St, Elgin, Illinois 60124 , Phone: (847) 888-0600, Fax: (847) 531-2701
| Most common first names in Elgin, IL among deceased individuals | ||
| Name | Count | Lived (average) |
|---|---|---|
| John | 535 | 74.2 years |
| William | 462 | 75.1 years |
| Mary | 381 | 79.7 years |
| Robert | 359 | 70.3 years |
| Helen | 291 | 80.8 years |
| George | 279 | 75.8 years |
| Charles | 264 | 75.0 years |
| James | 255 | 71.1 years |
| Frank | 240 | 78.5 years |
| Edward | 240 | 75.4 years |
| Most common last names in Elgin, IL among deceased individuals | ||
| Last name | Count | Lived (average) |
|---|---|---|
| Johnson | 201 | 77.3 years |
| Smith | 156 | 75.6 years |
| Anderson | 126 | 78.1 years |
| Miller | 118 | 77.1 years |
| Nelson | 87 | 78.5 years |
| Brown | 62 | 75.9 years |
| Peterson | 61 | 79.5 years |
| Schmidt | 59 | 78.3 years |
| Wilson | 57 | 78.7 years |
| Schultz | 54 | 77.8 years |
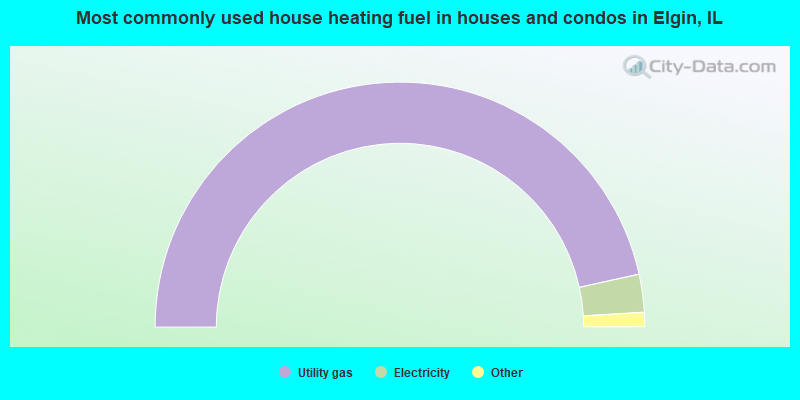
- 93.1%Utility gas
- 5.0%Electricity
- 0.8%Bottled, tank, or LP gas
- 0.5%Other fuel
- 0.4%No fuel used
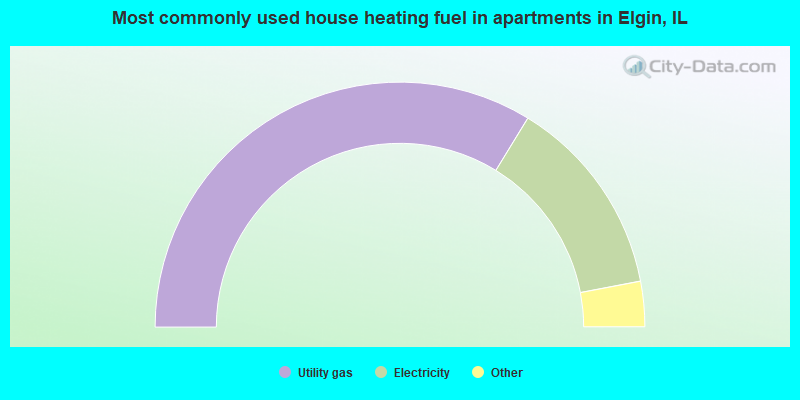
- 67.5%Utility gas
- 26.5%Electricity
- 3.9%No fuel used
- 1.7%Bottled, tank, or LP gas
- 0.3%Other fuel
Elgin compared to Illinois state average:
- Unemployed percentage below state average.
- Black race population percentage below state average.
- Hispanic race population percentage above state average.
- Median age below state average.
- Foreign-born population percentage above state average.
- Length of stay since moving in below state average.
Elgin on our top lists:
- #1 on the list of "Top 101 cities with largest percentage of females in industries: management of companies and enterprises (population 50,000+)"
- #18 on the list of "Top 101 cities with largest percentage of females in occupations: office and administrative support occupations (population 50,000+)"
- #25 on the list of "Top 101 cities with largest percentage of males in occupations: production occupations (population 50,000+)"
- #25 on the list of "Top 101 cities with largest percentage of females in industries: manufacturing (population 50,000+)"
- #28 on the list of "Top 101 cities with largest percentage of females in occupations: production occupations (population 50,000+)"
- #40 on the list of "Top 101 cities with the largest city-data.com crime index decrease from 2011 to 2012 (population 50,000+)"
- #42 on the list of "Top 101 cities with largest percentage of males in occupations: healthcare support occupations (population 50,000+)"
- #43 on the list of "Top 101 cities with the coldest winters (population 50,000+)"
- #45 on the list of "Top 101 cities with the highest ratio of rapes to murders between 2002 and 2012 (population 50,000+)"
- #47 on the list of "Top 101 cities with the lowest daily low temperatures (population 50,000+)"
- #50 on the list of "Top 101 cities with the largest temperature differences during a year (population 50,000+)"
- #50 on the list of "Top 101 larger cities with the largest decrease or smallest increase in house/condo value from 2000 (population 50,000+)"
- #50 on the list of "Top 101 cities with largest percentage of males in industries: manufacturing (population 50,000+)"
- #58 on the list of "Top 101 cities with the lowest number of auto thefts per 100,000 residents (population 50,000+)"
- #64 on the list of "Top 101 cities with largest percentage of females in industries: wholesale trade (population 50,000+)"
- #67 on the list of "Top 101 cities with largest percentage of females in occupations: installation, maintenance, and repair occupations (population 50,000+)"
- #69 on the list of "Top 101 cities with largest percentage of males in occupations: installation, maintenance, and repair occupations (population 50,000+)"
- #71 on the list of "Top 101 cities with the lowest average temperatures (population 50,000+)"
- #72 on the list of "Top 101 cities with the highest number of rapes per 100,000 residents, excludes tourist destinations and others with a lot of outsiders visiting based on city industries data (population 50,000+)"
- #92 on the list of "Top 100 low-educated but high-earning cities (pop. 50,000+)"
- #8 on the list of "Top 101 counties with the largest decrease in the number of births per 1000 residents 2000-2006 to 2007-2013 (pop 50,000+)"
- #58 on the list of "Top 101 counties with the lowest number of deaths per 1000 residents 2007-2013 (pop. 50,000+)"
- #65 on the list of "Top 101 counties with the largest increase in the number of infant deaths per 1000 residents 2000-2006 to 2007-2013 (pop. 50,000+)"
- #76 on the list of "Top 101 counties with the highest ground withdrawal of fresh water for public supply"
- #84 on the list of "Top 101 counties with the largest number of children under 18 without health insurance coverage in 2000 (pop. 50,000+)"

|
|
Total of 651 patent applications in 2008-2024.