Percentage of residents living in poverty in 2022: 5.1%
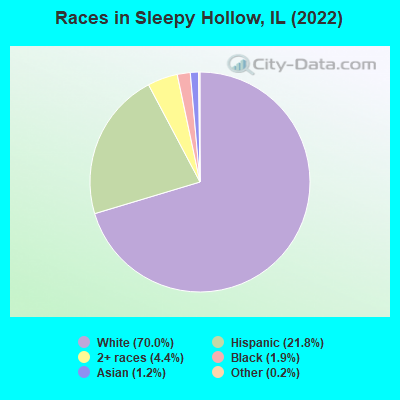
(1.0% for White Non-Hispanic residents, 20.5% for Hispanic or Latino residents, 18.7% for other race residents, 28.1% for two or more races residents)
According to our research of Illinois and other state lists, there was 1 registered sex offender living in Sleepy Hollow, Illinois as of April 26, 2024. The ratio of all residents to sex offenders in Sleepy Hollow is 3,370 to 1. The ratio of registered sex offenders to all residents in this city is much lower than the state average.
Crime rates in Sleepy Hollow by year
Type
2010
2011
2012
2013
2014
2015
2016
2017
2018
2019
2020
2022
Murders (per 100,000)
0 (0.0)
0 (0.0)
0 (0.0)
0 (0.0)
0 (0.0)
0 (0.0)
0 (0.0)
0 (0.0)
0 (0.0)
0 (0.0)
0 (0.0)
0 (0.0)
Rapes (per 100,000)
0 (0.0)
0 (0.0)
0 (0.0)
0 (0.0)
0 (0.0)
0 (0.0)
0 (0.0)
1 (30.0)
0 (0.0)
0 (0.0)
0 (0.0)
0 (0.0)
Robberies (per 100,000)
0 (0.0)
0 (0.0)
0 (0.0)
0 (0.0)
0 (0.0)
0 (0.0)
0 (0.0)
0 (0.0)
0 (0.0)
0 (0.0)
0 (0.0)
0 (0.0)
Assaults (per 100,000)
0 (0.0)
0 (0.0)
2 (59.9)
1 (29.9)
1 (30.0)
1 (29.9)
0 (0.0)
1 (30.0)
2 (60.4)
0 (0.0)
2 (61.8)
2 (63.3)
Burglaries (per 100,000)
3 (90.8)
5 (150.9)
1 (29.9)
5 (149.3)
2 (59.9)
2 (59.7)
1 (29.8)
0 (0.0)
0 (0.0)
2 (61.1)
3 (92.7)
0 (0.0)
Thefts (per 100,000)
10 (302.7)
28 (844.9)
31 (928.4)
35 (1,045)
15 (449.4)
9 (268.8)
9 (268.3)
8 (240.0)
8 (241.4)
9 (275.0)
8 (247.2)
6 (189.9)
Auto thefts (per 100,000)
0 (0.0)
1 (30.2)
0 (0.0)
0 (0.0)
0 (0.0)
0 (0.0)
0 (0.0)
0 (0.0)
0 (0.0)
0 (0.0)
2 (61.8)
2 (63.3)
Arson (per 100,000)
0 (0.0)
0 (0.0)
0 (0.0)
0 (0.0)
0 (0.0)
0 (0.0)
0 (0.0)
0 (0.0)
0 (0.0)
0 (0.0)
0 (0.0)
0 (0.0)
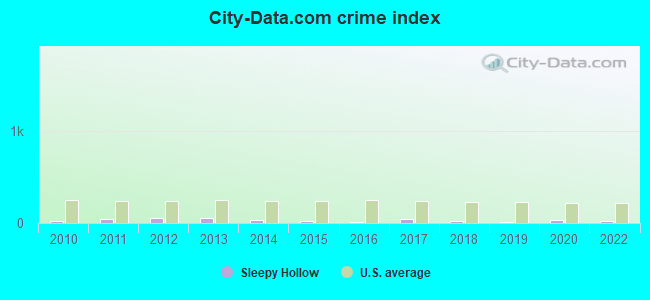
City-Data.com crime index
18.5
46.8
51.2
58.2
28.2
20.9
12.8
39.6
21.7
15.3
33.7
25.3
The City-Data.com crime index weighs serious crimes and violent crimes more heavily. Higher means more crime, U.S. average is 246.1. It adjusts for the number of visitors and daily workers commuting into cities.
Latest news from Sleepy Hollow, IL collected exclusively by city-data.com from local newspapers, TV, and radio stations
Ancestries: German (14.8%), Polish (13.2%), Irish (10.1%), Italian (4.5%), English (4.0%), Austrian (2.6%).
Current Local Time: CST time zone
Incorporated on 05/05/1958
Land area: 2.01 square miles.
Population density: 1,565 people per square mile (low).
398 residents are foreign born (7.7% Latin America, 4.0% Europe).
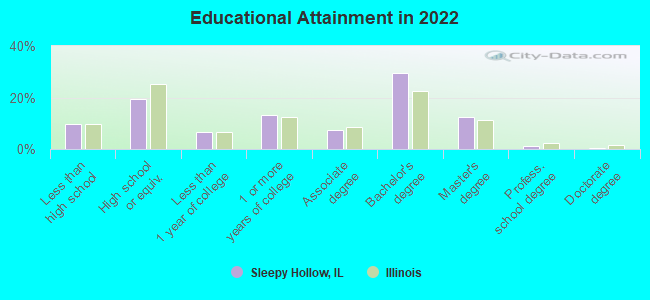
This village:
12.5%
Illinois:
14.1%
Median real estate property taxes paid for housing units with mortgages in 2022: $8,211 (2.2%) Median real estate property taxes paid for housing units with no mortgage in 2022: $8,538 (2.3%)
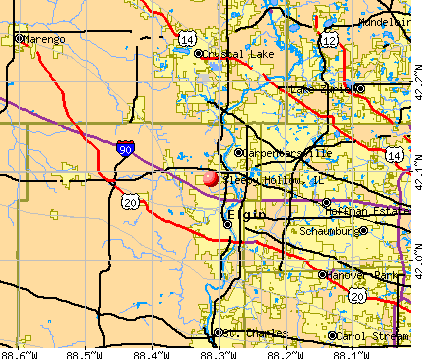
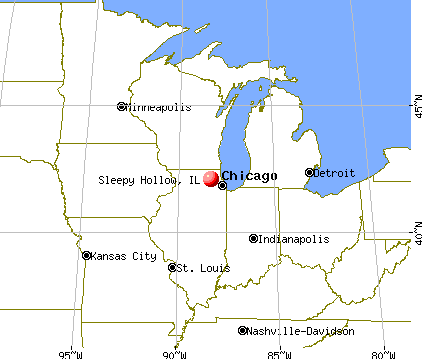
Nearest city with pop. 50,000+: Elgin, IL (3.8 miles , pop. 94,487).
Nearest city with pop. 200,000+: Chicago, IL (36.9 miles , pop. 2,896,016).
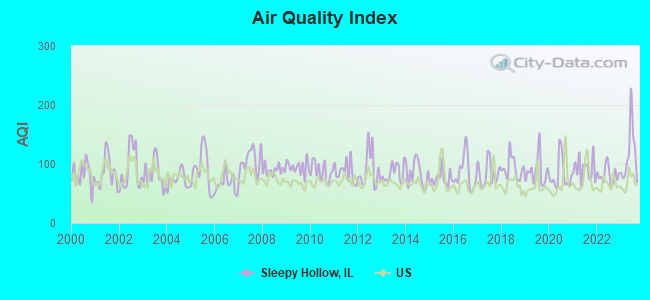
Air Quality Index (AQI) level in 2023 was 116. This is significantly worse than average.
City:
116
U.S.:
73
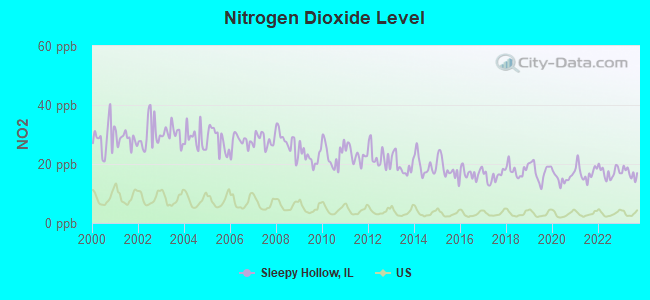
Nitrogen Dioxide (NO2) [ppb] level in 2023 was 16.9. This is significantly worse than average.Closest monitor was 13.0 miles away from the city center.
City:
16.9
U.S.:
5.1
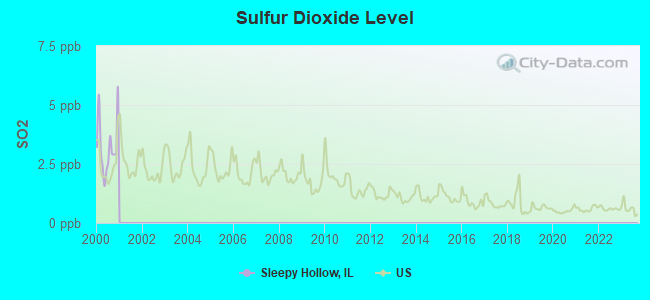
Sulfur Dioxide (SO2) [ppb] level in 2000 was 3.23. This is significantly worse than average.Closest monitor was 3.5 miles away from the city center.
City:
3.23
U.S.:
1.51
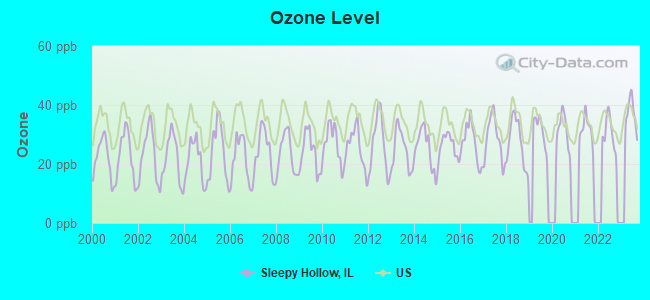
Ozone [ppb] level in 2023 was 36.9. This is about average.Closest monitor was 3.2 miles away from the city center.
City:
36.9
U.S.:
33.3
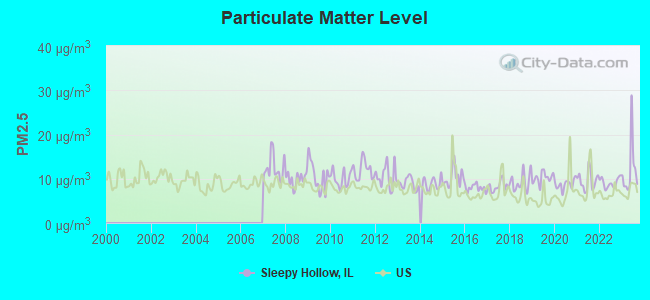
Particulate Matter (PM2.5) [µg/m3] level in 2023 was 11.9. This is significantly worse than average.Closest monitor was 3.2 miles away from the city center.
City:
11.9
U.S.:
8.1
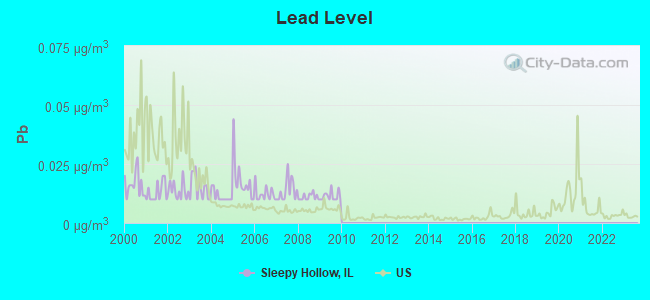
Lead (Pb) [µg/m3] level in 2009 was 0.0114. This is worse than average.Closest monitor was 3.2 miles away from the city center.
City:
0.0114
U.S.:
0.0093
Tornado activity:
Sleepy Hollow-area historical tornado activity is slightly below Illinois state average. It is 42% greater than the overall U.S. average.
On 4/21/1967, a category F4 (max. wind speeds 207-260 mph) tornado 4.6 miles away from the Sleepy Hollow village center killed one personand injured 100 peopleand causedbetween $500,000 and $5,000,000 in damages.
On 8/28/1990, a category F5 (max. wind speeds 261-318 mph) tornado 28.5 miles away from the village center killed 29 peopleand injured 350 peopleand causedbetween $50,000 and $500,000 in damages.
Earthquake activity:
Sleepy Hollow-area historical earthquake activity is significantly above Illinois state average. It is 44% greater than the overall U.S. average.
On 4/18/2008 at 09:36:59, a magnitude 5.4 (5.1 MB, 4.8 MS, 5.4 MW, 5.2 MW, Class: Moderate, Intensity: VI - VII) earthquake occurred 252.7 miles away from Sleepy Hollow center On 6/10/1987 at 23:48:54, a magnitude 5.1 (4.9 MB, 4.4 MS, 4.6 MS, 5.1 LG) earthquake occurred 227.3 miles away from Sleepy Hollow center On 4/18/2008 at 09:36:59, a magnitude 5.2 (5.2 MW, Depth: 8.9 mi) earthquake occurred 252.7 miles away from Sleepy Hollow center On 6/28/2004 at 06:10:52, a magnitude 4.2 (4.2 MW, Depth: 6.2 mi, Class: Light, Intensity: IV - V) earthquake occurred 53.1 miles away from the city center On 2/10/2010 at 09:59:35, a magnitude 3.8 (3.8 MW, Depth: 6.2 mi, Class: Light, Intensity: II - III) earthquake occurred 12.7 miles away from Sleepy Hollow center On 6/18/2002 at 17:37:15, a magnitude 5.0 (4.3 MB, 4.6 MW, 5.0 LG) earthquake occurred 285.2 miles away from the city center Magnitude types: regional Lg-wave magnitude (LG), body-wave magnitude (MB), surface-wave magnitude (MS), moment magnitude (MW)
Natural disasters:
The number of natural disasters in Kane County (15) is near the US average (15). Major Disasters (Presidential) Declared: 10 Emergencies Declared: 4
Causes of natural disasters: Floods: 7, Storms: 7, Snowstorms: 2, Tornadoes: 2, Winter Storms: 2, Blizzard: 1, Hurricane: 1, Snow: 1, Wind: 1, Other: 1 (Note: some incidents may be assigned to more than one category).
Hospitals and medical centers near Sleepy Hollow:
FMC OF ELGIN (Dialysis Facility, about 2 miles away; ELGIN, IL)
QUALITY RENAL CARE (Dialysis Facility, about 3 miles away; CARPENTERSVILLE, IL)
SHERMAN HOSPITAL Acute Care Hospitals (about 3 miles away; ELGIN, IL)
HOME HEALTH RESOURCES, LLC (Home Health Center, about 3 miles away; ELGIN, IL)
ROSEWOOD CARE CENTER OF ELGIN (Nursing Home, about 3 miles away; ELGIN, IL)
SHERMAN HOSPITAL SCU (Nursing Home, about 4 miles away; ELGIN, IL)
SHERMAN HOME CARE PARTNERS (Home Health Center, about 4 miles away; ELGIN, IL)
Notable locations in Sleepy Hollow: Sleepy Hollow Village Hall (A), Rutland Dundee Fire Protection District Station 2 (B). Display/hide their locations on the map
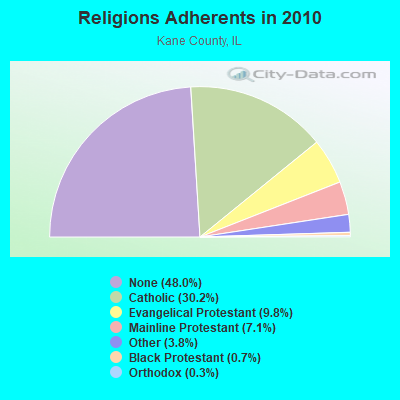
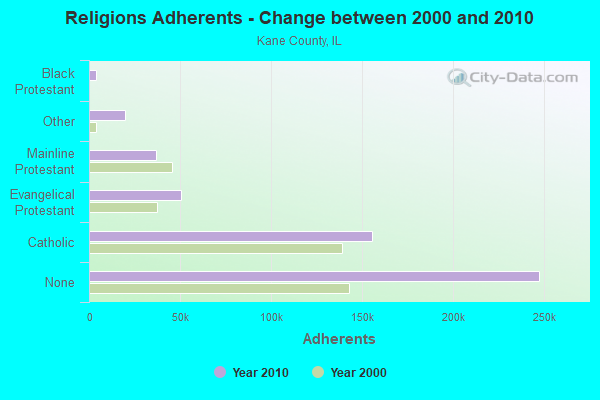
Religion statistics for Sleepy Hollow, IL (based on Kane County data)
Religion
Adherents
Congregations
Catholic
155,391
28
Evangelical Protestant
50,728
184
Mainline Protestant
36,576
72
Other
19,744
30
Black Protestant
3,679
10
Orthodox
1,630
2
None
247,521
-
Source: Clifford Grammich, Kirk Hadaway, Richard Houseal, Dale E.Jones, Alexei Krindatch, Richie Stanley and Richard H.Taylor. 2012. 2010 U.S.Religion Census: Religious Congregations & Membership Study. Association of Statisticians of American Religious Bodies. Jones, Dale E., et al. 2002. Congregations and Membership in the United States 2000. Nashville, TN: Glenmary Research Center. Graphs represent county-level data
Aircraft: CESSNA 170A (Category: Land, Seats: 4, Weight: Up to 12,499 Pounds, Speed: 105 mph), Engine: CONT MOTOR C145 SERIES (145 HP) (Reciprocating) N-Number: 1249D, N1249D, N-1249D, Serial Number: 20121, Year manufactured: 1951, Airworthiness Date: 06/21/1956, Certificate Issue Date: 07/11/2002 Registrant (Co-Owned): David Stokes, 905 Acorn Dr, Sleepy Hollow, IL 60118, Other Owners: Janet Stokes
Aircraft: BEECH F33A (Category: Land, Seats: 5, Weight: Up to 12,499 Pounds, Speed: 138 mph), Engine: CONT MOTOR IO 520 SERIES (285 HP) (Reciprocating) N-Number: 159GM, N159GM, N-159GM, Serial Number: CE-765, Year manufactured: 1978, Airworthiness Date: 02/06/1978, Certificate Issue Date: 06/17/2015 Registrant (Co-Owned): John Mansfield, 813 Acorn Dr, Sleepy Hollow, IL 60118, Other Owners: Wendy Young
Aircraft: ZINKOWSKI RAYMOND HP-18-55 (Category: Land, Weight: Up to 12,499 Pounds), Engine: None N-Number: 37175, N37175, N-37175, Serial Number: 55, Year manufactured: 1985, Airworthiness Date: 01/24/1985, Certificate Issue Date: 10/24/2018 Registrant (Individual): Larry E Kase, 416 Arabian Pkwy, Sleepy Hollow, IL 60118
Aircraft: CESSNA 150E (Category: Land, Seats: 2, Weight: Up to 12,499 Pounds, Speed: 90 mph), Engine: CONT MOTOR 0-200 SERIES (100 HP) (Reciprocating) N-Number: 6074T, N6074T, N-6074T, Serial Number: 15060774, Year manufactured: 1964, Airworthiness Date: 09/19/1964, Certificate Issue Date: 03/28/2005 Registrant (Individual): Larry E Kase, 416 Arabian Pkwy, Sleepy Hollow, IL 60118
Aircraft: BEECH C35 (Category: Land, Seats: 4, Weight: Up to 12,499 Pounds, Speed: 120 mph), Engine: CONT MOTOR E185 SERIES (205 HP) (Reciprocating) N-Number: 764D, N764D, N-764D, Serial Number: D-3034, Year manufactured: 1951, Airworthiness Date: 07/25/1956, Certificate Issue Date: 08/13/2014 Registrant (Partnership): Partners Bonanza, 922 Saratoga Pkwy, Sleepy Hollow, IL 60118
Aircraft: RICHARD D BOHNSACK RV-7 (Category: Land, Seats: 2, Weight: Up to 12,499 Pounds), Engine: LYCOMING O-360 SERIES (180 HP) (Reciprocating) N-Number: 909RB, N909RB, N-909RB, Serial Number: 70909, Year manufactured: 2015, Airworthiness Date: 06/25/2015, Certificate Issue Date: 06/05/2018 Registrant (Individual): Gerald J Fagan, 1141 Anne Ct, Sleepy Hollow, IL 60118
Home Mortgage Disclosure Act Aggregated Statistics For Year 2009 (Based on 1 partial tract)
A) FHA, FSA/RHS & VA Home Purchase Loans
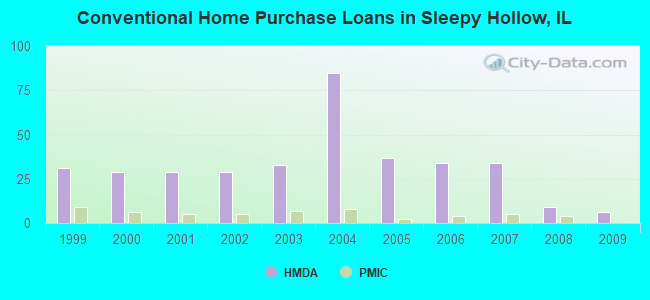
B) Conventional Home Purchase Loans
C) Refinancings
D) Home Improvement Loans
Number
Average Value
Number
Average Value
Number
Average Value
Number
Average Value
LOANS ORIGINATED
4
$262,192
6
$205,172
53
$226,133
1
$91,010
APPLICATIONS APPROVED, NOT ACCEPTED
0
$0
0
$0
4
$281,772
0
$0
APPLICATIONS DENIED
1
$300,330
1
$299,380
17
$257,491
1
$142,260
APPLICATIONS WITHDRAWN
0
$0
0
$0
6
$227,525
0
$0
FILES CLOSED FOR INCOMPLETENESS
0
$0
1
$162,380
3
$228,323
0
$0
Aggregated Statistics For Year 2008 (Based on 1 partial tract)
A) FHA, FSA/RHS & VA Home Purchase Loans
B) Conventional Home Purchase Loans
C) Refinancings
D) Home Improvement Loans
F) Non-occupant Loans on < 5 Family Dwellings (A B C & D)
Number
Average Value
Number
Average Value
Number
Average Value
Number
Average Value
Number
Average Value
LOANS ORIGINATED
1
$306,800
9
$276,303
33
$246,416
2
$71,010
1
$156,150
APPLICATIONS APPROVED, NOT ACCEPTED
0
$0
1
$194,230
6
$290,673
0
$0
0
$0
APPLICATIONS DENIED
0
$0
1
$163,820
11
$295,652
1
$108,250
1
$293,630
APPLICATIONS WITHDRAWN
0
$0
2
$195,790
5
$226,806
0
$0
0
$0
FILES CLOSED FOR INCOMPLETENESS
0
$0
0
$0
4
$210,220
0
$0
0
$0
Aggregated Statistics For Year 2007 (Based on 1 partial tract)
A) FHA, FSA/RHS & VA Home Purchase Loans
B) Conventional Home Purchase Loans
C) Refinancings
D) Home Improvement Loans
F) Non-occupant Loans on < 5 Family Dwellings (A B C & D)
Number
Average Value
Number
Average Value
Number
Average Value
Number
Average Value
Number
Average Value
LOANS ORIGINATED
1
$261,770
34
$236,154
46
$231,029
6
$87,657
3
$153,200
APPLICATIONS APPROVED, NOT ACCEPTED
0
$0
5
$186,906
9
$221,937
2
$124,060
0
$0
APPLICATIONS DENIED
0
$0
4
$276,502
20
$238,339
3
$68,657
0
$0
APPLICATIONS WITHDRAWN
0
$0
4
$285,185
10
$244,027
1
$50,530
1
$82,630
FILES CLOSED FOR INCOMPLETENESS
0
$0
0
$0
5
$245,200
0
$0
0
$0
Aggregated Statistics For Year 2006 (Based on 1 partial tract)
B) Conventional Home Purchase Loans
C) Refinancings
D) Home Improvement Loans
F) Non-occupant Loans on < 5 Family Dwellings (A B C & D)
Number
Average Value
Number
Average Value
Number
Average Value
Number
Average Value
LOANS ORIGINATED
34
$224,468
45
$205,582
6
$78,517
1
$288,840
APPLICATIONS APPROVED, NOT ACCEPTED
3
$198,467
8
$226,836
0
$0
0
$0
APPLICATIONS DENIED
7
$193,687
20
$233,189
2
$28,140
1
$133,880
APPLICATIONS WITHDRAWN
3
$220,180
9
$226,328
1
$75,680
0
$0
FILES CLOSED FOR INCOMPLETENESS
0
$0
4
$188,725
0
$0
0
$0
Aggregated Statistics For Year 2005 (Based on 1 partial tract)
B) Conventional Home Purchase Loans
C) Refinancings
D) Home Improvement Loans
F) Non-occupant Loans on < 5 Family Dwellings (A B C & D)
Number
Average Value
Number
Average Value
Number
Average Value
Number
Average Value
LOANS ORIGINATED
37
$213,259
50
$235,060
4
$90,770
3
$156,393
APPLICATIONS APPROVED, NOT ACCEPTED
4
$268,240
8
$203,395
0
$0
1
$151,840
APPLICATIONS DENIED
4
$219,322
21
$247,483
2
$48,860
1
$123,100
APPLICATIONS WITHDRAWN
5
$165,974
15
$263,977
1
$362,120
1
$325,960
FILES CLOSED FOR INCOMPLETENESS
1
$209,320
4
$263,270
1
$137,710
0
$0
Aggregated Statistics For Year 2004 (Based on 1 partial tract)
A) FHA, FSA/RHS & VA Home Purchase Loans
B) Conventional Home Purchase Loans
C) Refinancings
D) Home Improvement Loans
F) Non-occupant Loans on < 5 Family Dwellings (A B C & D)
Number
Average Value
Number
Average Value
Number
Average Value
Number
Average Value
Number
Average Value
LOANS ORIGINATED
1
$188,250
85
$228,238
58
$217,619
4
$63,528
3
$206,530
APPLICATIONS APPROVED, NOT ACCEPTED
0
$0
6
$314,343
8
$192,618
1
$50,060
0
$0
APPLICATIONS DENIED
0
$0
9
$234,683
16
$195,507
2
$101,670
0
$0
APPLICATIONS WITHDRAWN
1
$200,700
14
$221,743
13
$235,226
0
$0
0
$0
FILES CLOSED FOR INCOMPLETENESS
0
$0
2
$348,830
4
$194,772
0
$0
0
$0
Aggregated Statistics For Year 2003 (Based on 1 partial tract)
A) FHA, FSA/RHS & VA Home Purchase Loans
B) Conventional Home Purchase Loans
C) Refinancings
D) Home Improvement Loans
F) Non-occupant Loans on < 5 Family Dwellings (A B C & D)
Number
Average Value
Number
Average Value
Number
Average Value
Number
Average Value
Number
Average Value
LOANS ORIGINATED
2
$166,095
33
$207,197
164
$186,408
2
$30,775
4
$133,580
APPLICATIONS APPROVED, NOT ACCEPTED
0
$0
3
$194,633
15
$182,036
1
$34,010
0
$0
APPLICATIONS DENIED
0
$0
3
$164,537
15
$181,285
1
$56,280
1
$145,140
APPLICATIONS WITHDRAWN
0
$0
4
$210,520
18
$166,984
0
$0
0
$0
FILES CLOSED FOR INCOMPLETENESS
0
$0
1
$214,350
4
$172,560
0
$0
0
$0
Aggregated Statistics For Year 2002 (Based on 1 partial tract)
A) FHA, FSA/RHS & VA Home Purchase Loans
B) Conventional Home Purchase Loans
C) Refinancings
D) Home Improvement Loans
F) Non-occupant Loans on < 5 Family Dwellings (A B C & D)
Number
Average Value
Number
Average Value
Number
Average Value
Number
Average Value
Number
Average Value
LOANS ORIGINATED
2
$124,420
29
$193,070
113
$181,289
3
$35,447
2
$165,975
APPLICATIONS APPROVED, NOT ACCEPTED
0
$0
3
$233,593
10
$174,021
0
$0
0
$0
APPLICATIONS DENIED
0
$0
3
$192,637
10
$157,830
2
$33,650
0
$0
APPLICATIONS WITHDRAWN
0
$0
1
$86,460
9
$174,888
0
$0
0
$0
FILES CLOSED FOR INCOMPLETENESS
0
$0
0
$0
6
$214,752
0
$0
0
$0
Aggregated Statistics For Year 2001 (Based on 1 partial tract)
A) FHA, FSA/RHS & VA Home Purchase Loans
B) Conventional Home Purchase Loans
C) Refinancings
D) Home Improvement Loans
F) Non-occupant Loans on < 5 Family Dwellings (A B C & D)
Number
Average Value
Number
Average Value
Number
Average Value
Number
Average Value
Number
Average Value
LOANS ORIGINATED
1
$209,080
29
$178,791
77
$178,788
3
$30,417
1
$100,590
APPLICATIONS APPROVED, NOT ACCEPTED
0
$0
4
$150,345
8
$181,062
1
$30,420
0
$0
APPLICATIONS DENIED
0
$0
1
$251,000
14
$161,526
2
$25,030
0
$0
APPLICATIONS WITHDRAWN
1
$81,430
2
$156,990
7
$171,481
1
$16,530
0
$0
FILES CLOSED FOR INCOMPLETENESS
0
$0
0
$0
4
$158,130
0
$0
0
$0
Aggregated Statistics For Year 2000 (Based on 1 partial tract)
A) FHA, FSA/RHS & VA Home Purchase Loans
B) Conventional Home Purchase Loans
C) Refinancings
D) Home Improvement Loans
Number
Average Value
Number
Average Value
Number
Average Value
Number
Average Value
LOANS ORIGINATED
1
$206,690
29
$169,401
17
$143,108
4
$27,302
APPLICATIONS APPROVED, NOT ACCEPTED
0
$0
1
$294,350
3
$73,767
3
$54,367
APPLICATIONS DENIED
0
$0
1
$359,490
5
$134,886
1
$58,680
APPLICATIONS WITHDRAWN
0
$0
2
$251,955
6
$137,273
1
$31,370
FILES CLOSED FOR INCOMPLETENESS
0
$0
0
$0
3
$145,297
0
$0
Aggregated Statistics For Year 1999 (Based on 1 partial tract)
A) FHA, FSA/RHS & VA Home Purchase Loans
B) Conventional Home Purchase Loans
C) Refinancings
D) Home Improvement Loans
F) Non-occupant Loans on < 5 Family Dwellings (A B C & D)
Detailed PMIC statistics for the following Tracts:8506.00
2002 - 2018 National Fire Incident Reporting System (NFIRS) incidents
According to the data from the years 2002 - 2018 the average number of fire incidents per year is 12. The highest number of fire incidents - 24 took place in 2016, and the least - 2 in 2002. The data has an increasing trend.
When looking into fire subcategories, the most incidents belonged to: Structure Fires (63.1%), and Outside Fires (26.3%).
Fire incident types reported to NFIRS in Sleepy Hollow, IL
#21 on the list of "Top 101 cities with the most residents born in Other Eastern Asia (population 500+)"
#73 on the list of "Top 101 cities with the most residents born in South Africa (population 500+)"
#74 on the list of "Top 101 cities with the most residents born in Southern Africa (population 500+)"
#8 on the list of "Top 101 counties with the largest decrease in the number of births per 1000 residents 2000-2006 to 2007-2013 (pop 50,000+)"
#58 on the list of "Top 101 counties with the lowest number of deaths per 1000 residents 2007-2013 (pop. 50,000+)"
#65 on the list of "Top 101 counties with the largest increase in the number of infant deaths per 1000 residents 2000-2006 to 2007-2013 (pop. 50,000+)"
#76 on the list of "Top 101 counties with the highest ground withdrawal of fresh water for public supply"
#84 on the list of "Top 101 counties with the largest number of children under 18 without health insurance coverage in 2000 (pop. 50,000+)"


 Recent articles from our blog. Our writers, many of them Ph.D. graduates or candidates, create easy-to-read articles on a wide variety of topics.

 (3.8 miles

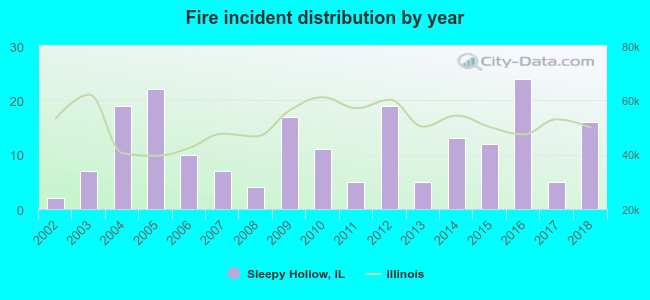 According to the data from the years 2002 - 2018 the average number of fire incidents per year is 12. The highest number of fire incidents - 24 took place in 2016, and the least - 2 in 2002. The data has an increasing trend.
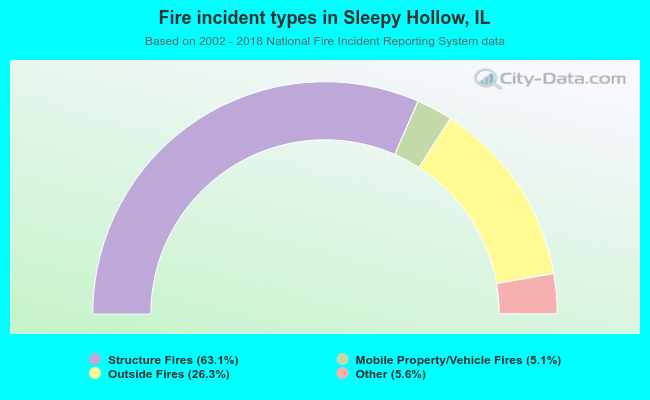 When looking into fire subcategories, the most incidents belonged to: Structure Fires (63.1%), and Outside Fires (26.3%).