| Fire incidents reported |
|---|
| Sreet name | Count |
|---|
| MAIN ST | 18 | | HOLLY CT | 14 | | SLEEPY HOLLOW ROAD RD | 14 | | LOCUST DRIVE DR | 12 | | WILLOW LANE LN | 12 | | BONCOSKY ROAD RD | 10 | | HILLTOP LANE LN | 10 | | KAY COURT CT | 10 | | GLEN OAK DRIVE DR | 8 | | JILL PEAK DR | 8 | | SHARON DR | 8 | | WILLOW LN | 8 | | CRANE DRIVE DR | 6 | | DEER LN | 6 | | HILLTOP LN | 6 | | JOY LN | 6 | | KATRINA DRIVE DR | 6 | | MAIN STREET ST | 6 | | SHARON DRIVE DR | 6 | | TIMBER DRIVE DR | 6 | | WINMOOR CT | 6 | | ACORN DR | 4 | | BEAU BRUMMEL DRIVE DR | 4 | | CAROL CREST DR | 4 | | HILLCREST DR | 4 |
| | | Fire incidents reported |
|---|
| Sreet name | Count |
|---|
| HILLTOP | 4 | | HOLLY COURT CT | 4 | | JAYCLAY COURT CT | 4 | | JILL PEAK RD | 4 | | LOCUST DR | 4 | | MAPLE LANE LN | 4 | | MAPLE LN | 4 | | PINE CONE LN | 4 | | PINECONE LANE LN | 4 | | PLUM COURT CT | 4 | | SARATOGA PARKWAY PKY | 4 | | SLEEPY HOLLOW RD | 4 | | STEVENS COURT CT | 4 | | SYCAMORE | 4 | | SYCAMORE LN | 4 | | THOROBRED LANE LN | 4 | | TIMBER DR | 4 | | WINDSOR COURT CT | 4 | | WINDSOR CT | 4 | | WINMOOR | 4 | | WINMOOR DRIVE DR | 4 | | ACORN COURT CT | 2 | | ACORN DRIVE DR | 2 | | ARABIAN PARKWAY PKY | 2 | | ARLINGTON PARKWAY PKY | 2 |
|
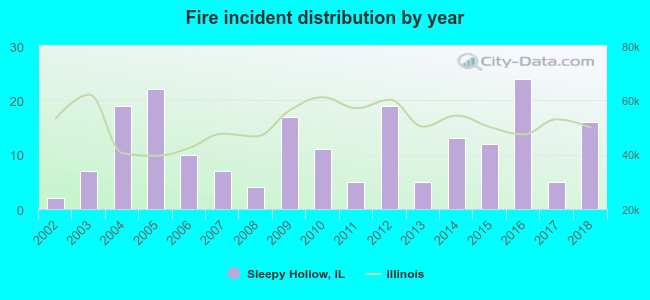 Based on the data from the years 2002 - 2018 the average number of fire incidents per year is 12. The highest number of reported fire incidents - 24 took place in 2016, and the least - 2 in 2002. The data has an increasing trend.
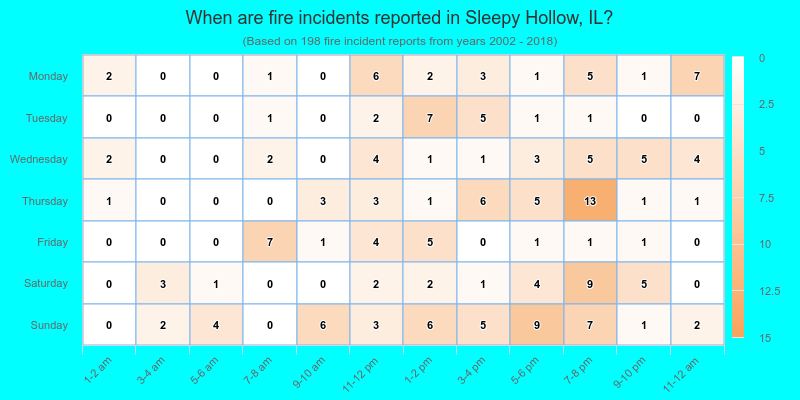
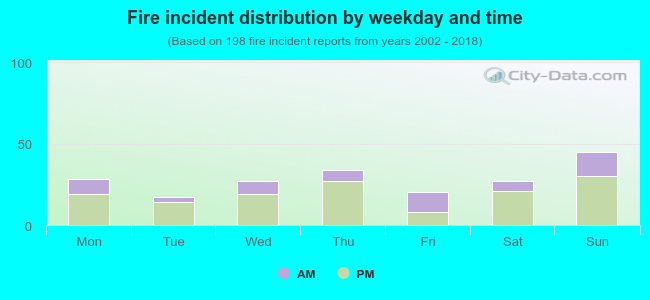 30.3% incidents where reported in the morning and 69.7% in the evening. The most fires (22.7%) took place on Sunday, and the least (8.6%) on Tuesday.
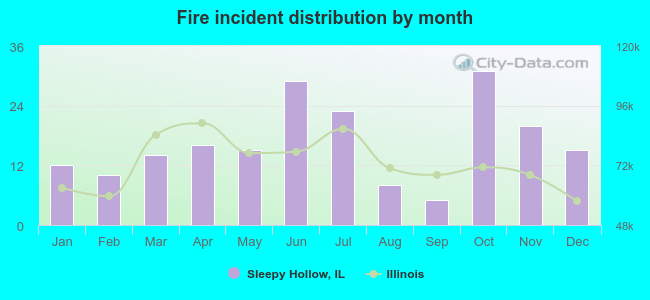 Based on the 198 incident reports from years 2002 - 2018 most fires (15.7%) took place during October, and the least (2.5%) in September.
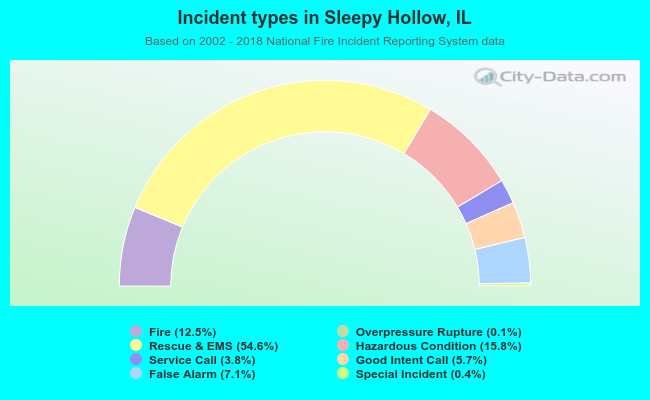 Out of all 1,586 cases reported during the years 2002 - 2018, the most belonged to the categories: Rescue & EMS (54.6%), Hazardous Condition (15.8%), and Fire (12.5%).
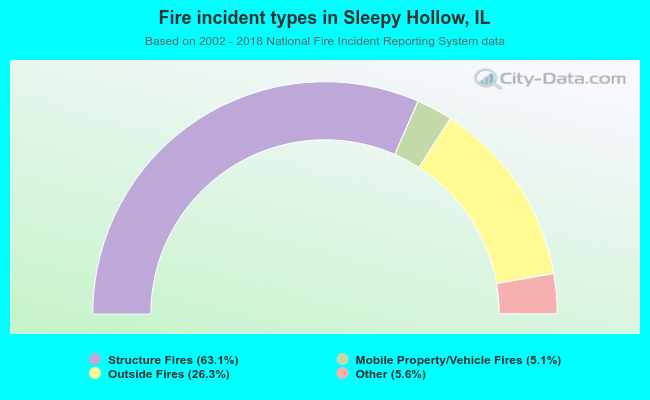 When looking into fire subcategories, the most reports belonged to: Structure Fires (63.1%), and Outside Fires (26.3%).