Algonquin, Illinois Submit your own pictures of this village and show them to the world
OSM Map
General Map
Google Map
MSN Map
OSM Map
General Map
Google Map
MSN Map
OSM Map
General Map
Google Map
MSN Map
OSM Map
General Map
Google Map
MSN Map
Please wait while loading the map...
Population in 2022: 29,951 (100% urban, 0% rural). Population change since 2000: +28.7%Males: 15,098 Females: 14,853
March 2022 cost of living index in Algonquin: 100.9 (near average, U.S. average is 100) Percentage of residents living in poverty in 2022: 4.4%for White Non-Hispanic residents , 8.3% for Black residents , 3.7% for Hispanic or Latino residents , 2.0% for other race residents , 5.8% for two or more races residents )
Profiles of local businesses
Business Search - 14 Million verified businesses
Data:
Median household income ($)
Median household income (% change since 2000)
Household income diversity
Ratio of average income to average house value (%)
Ratio of average income to average rent
Median household income ($) - White
Median household income ($) - Black or African American
Median household income ($) - Asian
Median household income ($) - Hispanic or Latino
Median household income ($) - American Indian and Alaska Native
Median household income ($) - Multirace
Median household income ($) - Other Race
Median household income for houses/condos with a mortgage ($)
Median household income for apartments without a mortgage ($)
Races - White alone (%)
Races - White alone (% change since 2000)
Races - Black alone (%)
Races - Black alone (% change since 2000)
Races - American Indian alone (%)
Races - American Indian alone (% change since 2000)
Races - Asian alone (%)
Races - Asian alone (% change since 2000)
Races - Hispanic (%)
Races - Hispanic (% change since 2000)
Races - Native Hawaiian and Other Pacific Islander alone (%)
Races - Native Hawaiian and Other Pacific Islander alone (% change since 2000)
Races - Two or more races (%)
Races - Two or more races (% change since 2000)
Races - Other race alone (%)
Races - Other race alone (% change since 2000)
Racial diversity
Unemployment (%)
Unemployment (% change since 2000)
Unemployment (%) - White
Unemployment (%) - Black or African American
Unemployment (%) - Asian
Unemployment (%) - Hispanic or Latino
Unemployment (%) - American Indian and Alaska Native
Unemployment (%) - Multirace
Unemployment (%) - Other Race
Population density (people per square mile)
Population - Males (%)
Population - Females (%)
Population - Males (%) - White
Population - Males (%) - Black or African American
Population - Males (%) - Asian
Population - Males (%) - Hispanic or Latino
Population - Males (%) - American Indian and Alaska Native
Population - Males (%) - Multirace
Population - Males (%) - Other Race
Population - Females (%) - White
Population - Females (%) - Black or African American
Population - Females (%) - Asian
Population - Females (%) - Hispanic or Latino
Population - Females (%) - American Indian and Alaska Native
Population - Females (%) - Multirace
Population - Females (%) - Other Race
Coronavirus confirmed cases (Apr 27, 2024)
Deaths caused by coronavirus (Apr 27, 2024)
Coronavirus confirmed cases (per 100k population) (Apr 27, 2024)
Deaths caused by coronavirus (per 100k population) (Apr 27, 2024)
Daily increase in number of cases (Apr 27, 2024)
Weekly increase in number of cases (Apr 27, 2024)
Cases doubled (in days) (Apr 27, 2024)
Hospitalized patients (Apr 18, 2022)
Negative test results (Apr 18, 2022)
Total test results (Apr 18, 2022)
COVID Vaccine doses distributed (per 100k population) (Sep 19, 2023)
COVID Vaccine doses administered (per 100k population) (Sep 19, 2023)
COVID Vaccine doses distributed (Sep 19, 2023)
COVID Vaccine doses administered (Sep 19, 2023)
Likely homosexual households (%)
Likely homosexual households (% change since 2000)
Likely homosexual households - Lesbian couples (%)
Likely homosexual households - Lesbian couples (% change since 2000)
Likely homosexual households - Gay men (%)
Likely homosexual households - Gay men (% change since 2000)
Cost of living index
Median gross rent ($)
Median contract rent ($)
Median monthly housing costs ($)
Median house or condo value ($)
Median house or condo value ($ change since 2000)
Mean house or condo value by units in structure - 1, detached ($)
Mean house or condo value by units in structure - 1, attached ($)
Mean house or condo value by units in structure - 2 ($)
Mean house or condo value by units in structure by units in structure - 3 or 4 ($)
Mean house or condo value by units in structure - 5 or more ($)
Mean house or condo value by units in structure - Boat, RV, van, etc. ($)
Mean house or condo value by units in structure - Mobile home ($)
Median house or condo value ($) - White
Median house or condo value ($) - Black or African American
Median house or condo value ($) - Asian
Median house or condo value ($) - Hispanic or Latino
Median house or condo value ($) - American Indian and Alaska Native
Median house or condo value ($) - Multirace
Median house or condo value ($) - Other Race
Median resident age
Resident age diversity
Median resident age - Males
Median resident age - Females
Median resident age - White
Median resident age - Black or African American
Median resident age - Asian
Median resident age - Hispanic or Latino
Median resident age - American Indian and Alaska Native
Median resident age - Multirace
Median resident age - Other Race
Median resident age - Males - White
Median resident age - Males - Black or African American
Median resident age - Males - Asian
Median resident age - Males - Hispanic or Latino
Median resident age - Males - American Indian and Alaska Native
Median resident age - Males - Multirace
Median resident age - Males - Other Race
Median resident age - Females - White
Median resident age - Females - Black or African American
Median resident age - Females - Asian
Median resident age - Females - Hispanic or Latino
Median resident age - Females - American Indian and Alaska Native
Median resident age - Females - Multirace
Median resident age - Females - Other Race
Commute - mean travel time to work (minutes)
Travel time to work - Less than 5 minutes (%)
Travel time to work - Less than 5 minutes (% change since 2000)
Travel time to work - 5 to 9 minutes (%)
Travel time to work - 5 to 9 minutes (% change since 2000)
Travel time to work - 10 to 19 minutes (%)
Travel time to work - 10 to 19 minutes (% change since 2000)
Travel time to work - 20 to 29 minutes (%)
Travel time to work - 20 to 29 minutes (% change since 2000)
Travel time to work - 30 to 39 minutes (%)
Travel time to work - 30 to 39 minutes (% change since 2000)
Travel time to work - 40 to 59 minutes (%)
Travel time to work - 40 to 59 minutes (% change since 2000)
Travel time to work - 60 to 89 minutes (%)
Travel time to work - 60 to 89 minutes (% change since 2000)
Travel time to work - 90 or more minutes (%)
Travel time to work - 90 or more minutes (% change since 2000)
Marital status - Never married (%)
Marital status - Now married (%)
Marital status - Separated (%)
Marital status - Widowed (%)
Marital status - Divorced (%)
Median family income ($)
Median family income (% change since 2000)
Median non-family income ($)
Median non-family income (% change since 2000)
Median per capita income ($)
Median per capita income (% change since 2000)
Median family income ($) - White
Median family income ($) - Black or African American
Median family income ($) - Asian
Median family income ($) - Hispanic or Latino
Median family income ($) - American Indian and Alaska Native
Median family income ($) - Multirace
Median family income ($) - Other Race
Median year house/condo built
Median year apartment built
Year house built - Built 2005 or later (%)
Year house built - Built 2000 to 2004 (%)
Year house built - Built 1990 to 1999 (%)
Year house built - Built 1980 to 1989 (%)
Year house built - Built 1970 to 1979 (%)
Year house built - Built 1960 to 1969 (%)
Year house built - Built 1950 to 1959 (%)
Year house built - Built 1940 to 1949 (%)
Year house built - Built 1939 or earlier (%)
Average household size
Household density (households per square mile)
Average household size - White
Average household size - Black or African American
Average household size - Asian
Average household size - Hispanic or Latino
Average household size - American Indian and Alaska Native
Average household size - Multirace
Average household size - Other Race
Occupied housing units (%)
Vacant housing units (%)
Owner occupied housing units (%)
Renter occupied housing units (%)
Vacancy status - For rent (%)
Vacancy status - For sale only (%)
Vacancy status - Rented or sold, not occupied (%)
Vacancy status - For seasonal, recreational, or occasional use (%)
Vacancy status - For migrant workers (%)
Vacancy status - Other vacant (%)
Residents with income below the poverty level (%)
Residents with income below 50% of the poverty level (%)
Children below poverty level (%)
Poor families by family type - Married-couple family (%)
Poor families by family type - Male, no wife present (%)
Poor families by family type - Female, no husband present (%)
Poverty status for native-born residents (%)
Poverty status for foreign-born residents (%)
Poverty among high school graduates not in families (%)
Poverty among people who did not graduate high school not in families (%)
Residents with income below the poverty level (%) - White
Residents with income below the poverty level (%) - Black or African American
Residents with income below the poverty level (%) - Asian
Residents with income below the poverty level (%) - Hispanic or Latino
Residents with income below the poverty level (%) - American Indian and Alaska Native
Residents with income below the poverty level (%) - Multirace
Residents with income below the poverty level (%) - Other Race
Air pollution - Air Quality Index (AQI)
Air pollution - CO
Air pollution - NO2
Air pollution - SO2
Air pollution - Ozone
Air pollution - PM10
Air pollution - PM25
Air pollution - Pb
Crime - Murders per 100,000 population
Crime - Rapes per 100,000 population
Crime - Robberies per 100,000 population
Crime - Assaults per 100,000 population
Crime - Burglaries per 100,000 population
Crime - Thefts per 100,000 population
Crime - Auto thefts per 100,000 population
Crime - Arson per 100,000 population
Crime - City-data.com crime index
Crime - Violent crime index
Crime - Property crime index
Crime - Murders per 100,000 population (5 year average)
Crime - Rapes per 100,000 population (5 year average)
Crime - Robberies per 100,000 population (5 year average)
Crime - Assaults per 100,000 population (5 year average)
Crime - Burglaries per 100,000 population (5 year average)
Crime - Thefts per 100,000 population (5 year average)
Crime - Auto thefts per 100,000 population (5 year average)
Crime - Arson per 100,000 population (5 year average)
Crime - City-data.com crime index (5 year average)
Crime - Violent crime index (5 year average)
Crime - Property crime index (5 year average)
1996 Presidential Elections Results (%) - Democratic Party (Clinton)
1996 Presidential Elections Results (%) - Republican Party (Dole)
1996 Presidential Elections Results (%) - Other
2000 Presidential Elections Results (%) - Democratic Party (Gore)
2000 Presidential Elections Results (%) - Republican Party (Bush)
2000 Presidential Elections Results (%) - Other
2004 Presidential Elections Results (%) - Democratic Party (Kerry)
2004 Presidential Elections Results (%) - Republican Party (Bush)
2004 Presidential Elections Results (%) - Other
2008 Presidential Elections Results (%) - Democratic Party (Obama)
2008 Presidential Elections Results (%) - Republican Party (McCain)
2008 Presidential Elections Results (%) - Other
2012 Presidential Elections Results (%) - Democratic Party (Obama)
2012 Presidential Elections Results (%) - Republican Party (Romney)
2012 Presidential Elections Results (%) - Other
2016 Presidential Elections Results (%) - Democratic Party (Clinton)
2016 Presidential Elections Results (%) - Republican Party (Trump)
2016 Presidential Elections Results (%) - Other
2020 Presidential Elections Results (%) - Democratic Party (Biden)
2020 Presidential Elections Results (%) - Republican Party (Trump)
2020 Presidential Elections Results (%) - Other
Ancestries Reported - Arab (%)
Ancestries Reported - Czech (%)
Ancestries Reported - Danish (%)
Ancestries Reported - Dutch (%)
Ancestries Reported - English (%)
Ancestries Reported - French (%)
Ancestries Reported - French Canadian (%)
Ancestries Reported - German (%)
Ancestries Reported - Greek (%)
Ancestries Reported - Hungarian (%)
Ancestries Reported - Irish (%)
Ancestries Reported - Italian (%)
Ancestries Reported - Lithuanian (%)
Ancestries Reported - Norwegian (%)
Ancestries Reported - Polish (%)
Ancestries Reported - Portuguese (%)
Ancestries Reported - Russian (%)
Ancestries Reported - Scotch-Irish (%)
Ancestries Reported - Scottish (%)
Ancestries Reported - Slovak (%)
Ancestries Reported - Subsaharan African (%)
Ancestries Reported - Swedish (%)
Ancestries Reported - Swiss (%)
Ancestries Reported - Ukrainian (%)
Ancestries Reported - United States (%)
Ancestries Reported - Welsh (%)
Ancestries Reported - West Indian (%)
Ancestries Reported - Other (%)
Educational Attainment - No schooling completed (%)
Educational Attainment - Less than high school (%)
Educational Attainment - High school or equivalent (%)
Educational Attainment - Less than 1 year of college (%)
Educational Attainment - 1 or more years of college (%)
Educational Attainment - Associate degree (%)
Educational Attainment - Bachelor's degree (%)
Educational Attainment - Master's degree (%)
Educational Attainment - Professional school degree (%)
Educational Attainment - Doctorate degree (%)
School Enrollment - Nursery, preschool (%)
School Enrollment - Kindergarten (%)
School Enrollment - Grade 1 to 4 (%)
School Enrollment - Grade 5 to 8 (%)
School Enrollment - Grade 9 to 12 (%)
School Enrollment - College undergrad (%)
School Enrollment - Graduate or professional (%)
School Enrollment - Not enrolled in school (%)
School enrollment - Public schools (%)
School enrollment - Private schools (%)
School enrollment - Not enrolled (%)
Median number of rooms in houses and condos
Median number of rooms in apartments
Housing units lacking complete plumbing facilities (%)
Housing units lacking complete kitchen facilities (%)
Density of houses
Urban houses (%)
Rural houses (%)
Households with people 60 years and over (%)
Households with people 65 years and over (%)
Households with people 75 years and over (%)
Households with one or more nonrelatives (%)
Households with no nonrelatives (%)
Population in households (%)
Family households (%)
Nonfamily households (%)
Population in families (%)
Family households with own children (%)
Median number of bedrooms in owner occupied houses
Mean number of bedrooms in owner occupied houses
Median number of bedrooms in renter occupied houses
Mean number of bedrooms in renter occupied houses
Median number of vehichles in owner occupied houses
Mean number of vehichles in owner occupied houses
Median number of vehichles in renter occupied houses
Mean number of vehichles in renter occupied houses
Mortgage status - with mortgage (%)
Mortgage status - with second mortgage (%)
Mortgage status - with home equity loan (%)
Mortgage status - with both second mortgage and home equity loan (%)
Mortgage status - without a mortgage (%)
Average family size
Average family size - White
Average family size - Black or African American
Average family size - Asian
Average family size - Hispanic or Latino
Average family size - American Indian and Alaska Native
Average family size - Multirace
Average family size - Other Race
Geographical mobility - Same house 1 year ago (%)
Geographical mobility - Moved within same county (%)
Geographical mobility - Moved from different county within same state (%)
Geographical mobility - Moved from different state (%)
Geographical mobility - Moved from abroad (%)
Place of birth - Born in state of residence (%)
Place of birth - Born in other state (%)
Place of birth - Native, outside of US (%)
Place of birth - Foreign born (%)
Housing units in structures - 1, detached (%)
Housing units in structures - 1, attached (%)
Housing units in structures - 2 (%)
Housing units in structures - 3 or 4 (%)
Housing units in structures - 5 to 9 (%)
Housing units in structures - 10 to 19 (%)
Housing units in structures - 20 to 49 (%)
Housing units in structures - 50 or more (%)
Housing units in structures - Mobile home (%)
Housing units in structures - Boat, RV, van, etc. (%)
House/condo owner moved in on average (years ago)
Renter moved in on average (years ago)
Year householder moved into unit - Moved in 1999 to March 2000 (%)
Year householder moved into unit - Moved in 1995 to 1998 (%)
Year householder moved into unit - Moved in 1990 to 1994 (%)
Year householder moved into unit - Moved in 1980 to 1989 (%)
Year householder moved into unit - Moved in 1970 to 1979 (%)
Year householder moved into unit - Moved in 1969 or earlier (%)
Means of transportation to work - Drove car alone (%)
Means of transportation to work - Carpooled (%)
Means of transportation to work - Public transportation (%)
Means of transportation to work - Bus or trolley bus (%)
Means of transportation to work - Streetcar or trolley car (%)
Means of transportation to work - Subway or elevated (%)
Means of transportation to work - Railroad (%)
Means of transportation to work - Ferryboat (%)
Means of transportation to work - Taxicab (%)
Means of transportation to work - Motorcycle (%)
Means of transportation to work - Bicycle (%)
Means of transportation to work - Walked (%)
Means of transportation to work - Other means (%)
Working at home (%)
Industry diversity
Most Common Industries - Agriculture, forestry, fishing and hunting, and mining (%)
Most Common Industries - Agriculture, forestry, fishing and hunting (%)
Most Common Industries - Mining, quarrying, and oil and gas extraction (%)
Most Common Industries - Construction (%)
Most Common Industries - Manufacturing (%)
Most Common Industries - Wholesale trade (%)
Most Common Industries - Retail trade (%)
Most Common Industries - Transportation and warehousing, and utilities (%)
Most Common Industries - Transportation and warehousing (%)
Most Common Industries - Utilities (%)
Most Common Industries - Information (%)
Most Common Industries - Finance and insurance, and real estate and rental and leasing (%)
Most Common Industries - Finance and insurance (%)
Most Common Industries - Real estate and rental and leasing (%)
Most Common Industries - Professional, scientific, and management, and administrative and waste management services (%)
Most Common Industries - Professional, scientific, and technical services (%)
Most Common Industries - Management of companies and enterprises (%)
Most Common Industries - Administrative and support and waste management services (%)
Most Common Industries - Educational services, and health care and social assistance (%)
Most Common Industries - Educational services (%)
Most Common Industries - Health care and social assistance (%)
Most Common Industries - Arts, entertainment, and recreation, and accommodation and food services (%)
Most Common Industries - Arts, entertainment, and recreation (%)
Most Common Industries - Accommodation and food services (%)
Most Common Industries - Other services, except public administration (%)
Most Common Industries - Public administration (%)
Occupation diversity
Most Common Occupations - Management, business, science, and arts occupations (%)
Most Common Occupations - Management, business, and financial occupations (%)
Most Common Occupations - Management occupations (%)
Most Common Occupations - Business and financial operations occupations (%)
Most Common Occupations - Computer, engineering, and science occupations (%)
Most Common Occupations - Computer and mathematical occupations (%)
Most Common Occupations - Architecture and engineering occupations (%)
Most Common Occupations - Life, physical, and social science occupations (%)
Most Common Occupations - Education, legal, community service, arts, and media occupations (%)
Most Common Occupations - Community and social service occupations (%)
Most Common Occupations - Legal occupations (%)
Most Common Occupations - Education, training, and library occupations (%)
Most Common Occupations - Arts, design, entertainment, sports, and media occupations (%)
Most Common Occupations - Healthcare practitioners and technical occupations (%)
Most Common Occupations - Health diagnosing and treating practitioners and other technical occupations (%)
Most Common Occupations - Health technologists and technicians (%)
Most Common Occupations - Service occupations (%)
Most Common Occupations - Healthcare support occupations (%)
Most Common Occupations - Protective service occupations (%)
Most Common Occupations - Fire fighting and prevention, and other protective service workers including supervisors (%)
Most Common Occupations - Law enforcement workers including supervisors (%)
Most Common Occupations - Food preparation and serving related occupations (%)
Most Common Occupations - Building and grounds cleaning and maintenance occupations (%)
Most Common Occupations - Personal care and service occupations (%)
Most Common Occupations - Sales and office occupations (%)
Most Common Occupations - Sales and related occupations (%)
Most Common Occupations - Office and administrative support occupations (%)
Most Common Occupations - Natural resources, construction, and maintenance occupations (%)
Most Common Occupations - Farming, fishing, and forestry occupations (%)
Most Common Occupations - Construction and extraction occupations (%)
Most Common Occupations - Installation, maintenance, and repair occupations (%)
Most Common Occupations - Production, transportation, and material moving occupations (%)
Most Common Occupations - Production occupations (%)
Most Common Occupations - Transportation occupations (%)
Most Common Occupations - Material moving occupations (%)
People in Group quarters - Institutionalized population (%)
People in Group quarters - Correctional institutions (%)
People in Group quarters - Federal prisons and detention centers (%)
People in Group quarters - Halfway houses (%)
People in Group quarters - Local jails and other confinement facilities (including police lockups) (%)
People in Group quarters - Military disciplinary barracks (%)
People in Group quarters - State prisons (%)
People in Group quarters - Other types of correctional institutions (%)
People in Group quarters - Nursing homes (%)
People in Group quarters - Hospitals/wards, hospices, and schools for the handicapped (%)
People in Group quarters - Hospitals/wards and hospices for chronically ill (%)
People in Group quarters - Hospices or homes for chronically ill (%)
People in Group quarters - Military hospitals or wards for chronically ill (%)
People in Group quarters - Other hospitals or wards for chronically ill (%)
People in Group quarters - Hospitals or wards for drug/alcohol abuse (%)
People in Group quarters - Mental (Psychiatric) hospitals or wards (%)
People in Group quarters - Schools, hospitals, or wards for the mentally retarded (%)
People in Group quarters - Schools, hospitals, or wards for the physically handicapped (%)
People in Group quarters - Institutions for the deaf (%)
People in Group quarters - Institutions for the blind (%)
People in Group quarters - Orthopedic wards and institutions for the physically handicapped (%)
People in Group quarters - Wards in general hospitals for patients who have no usual home elsewhere (%)
People in Group quarters - Wards in military hospitals for patients who have no usual home elsewhere (%)
People in Group quarters - Juvenile institutions (%)
People in Group quarters - Long-term care (%)
People in Group quarters - Homes for abused, dependent, and neglected children (%)
People in Group quarters - Residential treatment centers for emotionally disturbed children (%)
People in Group quarters - Training schools for juvenile delinquents (%)
People in Group quarters - Short-term care, detention or diagnostic centers for delinquent children (%)
People in Group quarters - Type of juvenile institution unknown (%)
People in Group quarters - Noninstitutionalized population (%)
People in Group quarters - College dormitories (includes college quarters off campus) (%)
People in Group quarters - Military quarters (%)
People in Group quarters - On base (%)
People in Group quarters - Barracks, unaccompanied personnel housing (UPH), (Enlisted/Officer), ;and similar group living quarters for military personnel (%)
People in Group quarters - Transient quarters for temporary residents (%)
People in Group quarters - Military ships (%)
People in Group quarters - Group homes (%)
People in Group quarters - Homes or halfway houses for drug/alcohol abuse (%)
People in Group quarters - Homes for the mentally ill (%)
People in Group quarters - Homes for the mentally retarded (%)
People in Group quarters - Homes for the physically handicapped (%)
People in Group quarters - Other group homes (%)
People in Group quarters - Religious group quarters (%)
People in Group quarters - Dormitories (%)
People in Group quarters - Agriculture workers' dormitories on farms (%)
People in Group quarters - Job Corps and vocational training facilities (%)
People in Group quarters - Other workers' dormitories (%)
People in Group quarters - Crews of maritime vessels (%)
People in Group quarters - Other nonhousehold living situations (%)
People in Group quarters - Other noninstitutional group quarters (%)
Residents speaking English at home (%)
Residents speaking English at home - Born in the United States (%)
Residents speaking English at home - Native, born elsewhere (%)
Residents speaking English at home - Foreign born (%)
Residents speaking Spanish at home (%)
Residents speaking Spanish at home - Born in the United States (%)
Residents speaking Spanish at home - Native, born elsewhere (%)
Residents speaking Spanish at home - Foreign born (%)
Residents speaking other language at home (%)
Residents speaking other language at home - Born in the United States (%)
Residents speaking other language at home - Native, born elsewhere (%)
Residents speaking other language at home - Foreign born (%)
Class of Workers - Employee of private company (%)
Class of Workers - Self-employed in own incorporated business (%)
Class of Workers - Private not-for-profit wage and salary workers (%)
Class of Workers - Local government workers (%)
Class of Workers - State government workers (%)
Class of Workers - Federal government workers (%)
Class of Workers - Self-employed workers in own not incorporated business and Unpaid family workers (%)
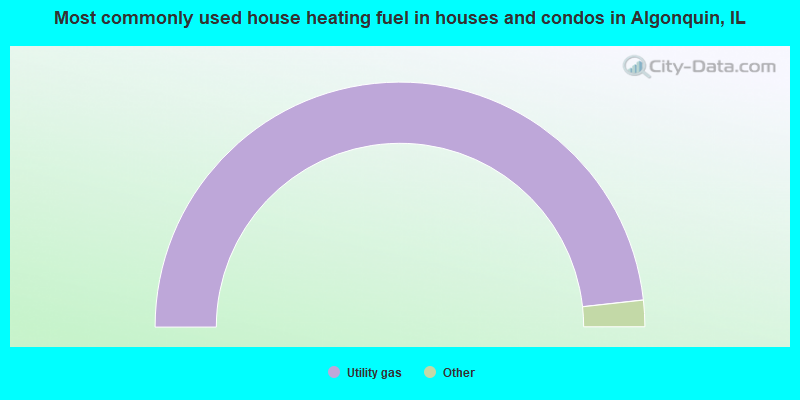
House heating fuel used in houses and condos - Utility gas (%)
House heating fuel used in houses and condos - Bottled, tank, or LP gas (%)
House heating fuel used in houses and condos - Electricity (%)
House heating fuel used in houses and condos - Fuel oil, kerosene, etc. (%)
House heating fuel used in houses and condos - Coal or coke (%)
House heating fuel used in houses and condos - Wood (%)
House heating fuel used in houses and condos - Solar energy (%)
House heating fuel used in houses and condos - Other fuel (%)
House heating fuel used in houses and condos - No fuel used (%)
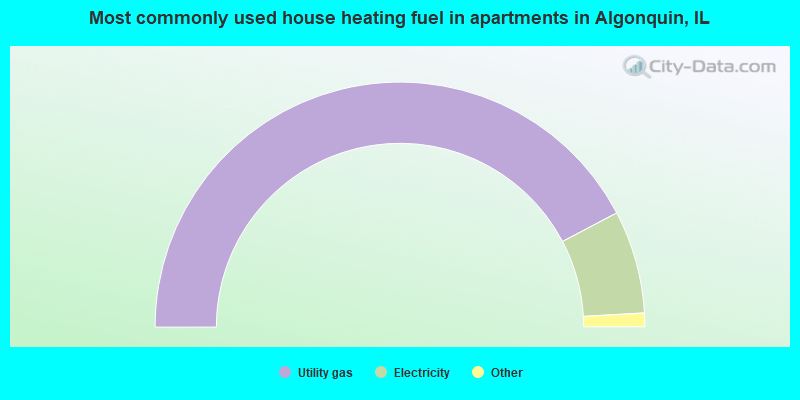
House heating fuel used in apartments - Utility gas (%)
House heating fuel used in apartments - Bottled, tank, or LP gas (%)
House heating fuel used in apartments - Electricity (%)
House heating fuel used in apartments - Fuel oil, kerosene, etc. (%)
House heating fuel used in apartments - Coal or coke (%)
House heating fuel used in apartments - Wood (%)
House heating fuel used in apartments - Solar energy (%)
House heating fuel used in apartments - Other fuel (%)
House heating fuel used in apartments - No fuel used (%)
Armed forces status - In Armed Forces (%)
Armed forces status - Civilian (%)
Armed forces status - Civilian - Veteran (%)
Armed forces status - Civilian - Nonveteran (%)
Fatal accidents locations in years 2005-2021
Fatal accidents locations in 2005
Fatal accidents locations in 2006
Fatal accidents locations in 2007
Fatal accidents locations in 2008
Fatal accidents locations in 2009
Fatal accidents locations in 2010
Fatal accidents locations in 2011
Fatal accidents locations in 2012
Fatal accidents locations in 2013
Fatal accidents locations in 2014
Fatal accidents locations in 2015
Fatal accidents locations in 2016
Fatal accidents locations in 2017
Fatal accidents locations in 2018
Fatal accidents locations in 2019
Fatal accidents locations in 2020
Fatal accidents locations in 2021
Alcohol use - People drinking some alcohol every month (%)
Alcohol use - People not drinking at all (%)
Alcohol use - Average days/month drinking alcohol
Alcohol use - Average drinks/week
Alcohol use - Average days/year people drink much
Audiometry - Average condition of hearing (%)
Audiometry - People that can hear a whisper from across a quiet room (%)
Audiometry - People that can hear normal voice from across a quiet room (%)
Audiometry - Ears ringing, roaring, buzzing (%)
Audiometry - Had a job exposure to loud noise (%)
Audiometry - Had off-work exposure to loud noise (%)
Blood Pressure & Cholesterol - Has high blood pressure (%)
Blood Pressure & Cholesterol - Checking blood pressure at home (%)
Blood Pressure & Cholesterol - Frequently checking blood cholesterol (%)
Blood Pressure & Cholesterol - Has high cholesterol level (%)
Consumer Behavior - Money monthly spent on food at supermarket/grocery store
Consumer Behavior - Money monthly spent on food at other stores
Consumer Behavior - Money monthly spent on eating out
Consumer Behavior - Money monthly spent on carryout/delivered foods
Consumer Behavior - Income spent on food at supermarket/grocery store (%)
Consumer Behavior - Income spent on food at other stores (%)
Consumer Behavior - Income spent on eating out (%)
Consumer Behavior - Income spent on carryout/delivered foods (%)
Current Health Status - General health condition (%)
Current Health Status - Blood donors (%)
Current Health Status - Has blood ever tested for HIV virus (%)
Current Health Status - Left-handed people (%)
Dermatology - People using sunscreen (%)
Diabetes - Diabetics (%)
Diabetes - Had a blood test for high blood sugar (%)
Diabetes - People taking insulin (%)
Diet Behavior & Nutrition - Diet health (%)
Diet Behavior & Nutrition - Milk product consumption (# of products/month)
Diet Behavior & Nutrition - Meals not home prepared (#/week)
Diet Behavior & Nutrition - Meals from fast food or pizza place (#/week)
Diet Behavior & Nutrition - Ready-to-eat foods (#/month)
Diet Behavior & Nutrition - Frozen meals/pizza (#/month)
Drug Use - People that ever used marijuana or hashish (%)
Drug Use - Ever used hard drugs (%)
Drug Use - Ever used any form of cocaine (%)
Drug Use - Ever used heroin (%)
Drug Use - Ever used methamphetamine (%)
Health Insurance - People covered by health insurance (%)
Kidney Conditions-Urology - Avg. # of times urinating at night
Medical Conditions - People with asthma (%)
Medical Conditions - People with anemia (%)
Medical Conditions - People with psoriasis (%)
Medical Conditions - People with overweight (%)
Medical Conditions - Elderly people having difficulties in thinking or remembering (%)
Medical Conditions - People who ever received blood transfusion (%)
Medical Conditions - People having trouble seeing even with glass/contacts (%)
Medical Conditions - People with arthritis (%)
Medical Conditions - People with gout (%)
Medical Conditions - People with congestive heart failure (%)
Medical Conditions - People with coronary heart disease (%)
Medical Conditions - People with angina pectoris (%)
Medical Conditions - People who ever had heart attack (%)
Medical Conditions - People who ever had stroke (%)
Medical Conditions - People with emphysema (%)
Medical Conditions - People with thyroid problem (%)
Medical Conditions - People with chronic bronchitis (%)
Medical Conditions - People with any liver condition (%)
Medical Conditions - People who ever had cancer or malignancy (%)
Mental Health - People who have little interest in doing things (%)
Mental Health - People feeling down, depressed, or hopeless (%)
Mental Health - People who have trouble sleeping or sleeping too much (%)
Mental Health - People feeling tired or having little energy (%)
Mental Health - People with poor appetite or overeating (%)
Mental Health - People feeling bad about themself (%)
Mental Health - People who have trouble concentrating on things (%)
Mental Health - People moving or speaking slowly or too fast (%)
Mental Health - People having thoughts they would be better off dead (%)
Oral Health - Average years since last visit a dentist
Oral Health - People embarrassed because of mouth (%)
Oral Health - People with gum disease (%)
Oral Health - General health of teeth and gums (%)
Oral Health - Average days a week using dental floss/device
Oral Health - Average days a week using mouthwash for dental problem
Oral Health - Average number of teeth
Pesticide Use - Households using pesticides to control insects (%)
Pesticide Use - Households using pesticides to kill weeds (%)
Physical Activity - People doing vigorous-intensity work activities (%)
Physical Activity - People doing moderate-intensity work activities (%)
Physical Activity - People walking or bicycling (%)
Physical Activity - People doing vigorous-intensity recreational activities (%)
Physical Activity - People doing moderate-intensity recreational activities (%)
Physical Activity - Average hours a day doing sedentary activities
Physical Activity - Average hours a day watching TV or videos
Physical Activity - Average hours a day using computer
Physical Functioning - People having limitations keeping them from working (%)
Physical Functioning - People limited in amount of work they can do (%)
Physical Functioning - People that need special equipment to walk (%)
Physical Functioning - People experiencing confusion/memory problems (%)
Physical Functioning - People requiring special healthcare equipment (%)
Prescription Medications - Average number of prescription medicines taking
Preventive Aspirin Use - Adults 40+ taking low-dose aspirin (%)
Reproductive Health - Vaginal deliveries (%)
Reproductive Health - Cesarean deliveries (%)
Reproductive Health - Deliveries resulted in a live birth (%)
Reproductive Health - Pregnancies resulted in a delivery (%)
Reproductive Health - Women breastfeeding newborns (%)
Reproductive Health - Women that had a hysterectomy (%)
Reproductive Health - Women that had both ovaries removed (%)
Reproductive Health - Women that have ever taken birth control pills (%)
Reproductive Health - Women taking birth control pills (%)
Reproductive Health - Women that have ever used Depo-Provera or injectables (%)
Reproductive Health - Women that have ever used female hormones (%)
Sexual Behavior - People 18+ that ever had sex (vaginal, anal, or oral) (%)
Sexual Behavior - Males 18+ that ever had vaginal sex with a woman (%)
Sexual Behavior - Males 18+ that ever performed oral sex on a woman (%)
Sexual Behavior - Males 18+ that ever had anal sex with a woman (%)
Sexual Behavior - Males 18+ that ever had any sex with a man (%)
Sexual Behavior - Females 18+ that ever had vaginal sex with a man (%)
Sexual Behavior - Females 18+ that ever performed oral sex on a man (%)
Sexual Behavior - Females 18+ that ever had anal sex with a man (%)
Sexual Behavior - Females 18+ that ever had any kind of sex with a woman (%)
Sexual Behavior - Average age people first had sex
Sexual Behavior - Average number of female sex partners in lifetime (males 18+)
Sexual Behavior - Average number of female vaginal sex partners in lifetime (males 18+)
Sexual Behavior - Average age people first performed oral sex on a woman (18+)
Sexual Behavior - Average number of woman performed oral sex on in lifetime (18+)
Sexual Behavior - Average number of male sex partners in lifetime (males 18+)
Sexual Behavior - Average number of male anal sex partners in lifetime (males 18+)
Sexual Behavior - Average age people first performed oral sex on a man (18+)
Sexual Behavior - Average number of male oral sex partners in lifetime (18+)
Sexual Behavior - People using protection when performing oral sex (%)
Sexual Behavior - Average number of times people have vaginal or anal sex a year
Sexual Behavior - People having sex without condom (%)
Sexual Behavior - Average number of male sex partners in lifetime (females 18+)
Sexual Behavior - Average number of male vaginal sex partners in lifetime (females 18+)
Sexual Behavior - Average number of female sex partners in lifetime (females 18+)
Sexual Behavior - Circumcised males 18+ (%)
Sleep Disorders - Average hours sleeping at night
Sleep Disorders - People that has trouble sleeping (%)
Smoking-Cigarette Use - People smoking cigarettes (%)
Taste & Smell - People 40+ having problems with smell (%)
Taste & Smell - People 40+ having problems with taste (%)
Taste & Smell - People 40+ that ever had wisdom teeth removed (%)
Taste & Smell - People 40+ that ever had tonsils teeth removed (%)
Taste & Smell - People 40+ that ever had a loss of consciousness because of a head injury (%)
Taste & Smell - People 40+ that ever had a broken nose or other serious injury to face or skull (%)
Taste & Smell - People 40+ that ever had two or more sinus infections (%)
Weight - Average height (inches)
Weight - Average weight (pounds)
Weight - Average BMI
Weight - People that are obese (%)
Weight - People that ever were obese (%)
Weight - People trying to lose weight (%)
According to our research of Illinois and other state lists, there were 22 registered sex offenders living in Algonquin, Illinois as of April 27, 2024 . The ratio of all residents to sex offenders in Algonquin is 1,377 to 1.The ratio of registered sex offenders to all residents in this city is lower than the state average.
Officers per 1,000 residents here:
1.49Illinois average:
2.84
Latest news from Algonquin, IL collected exclusively by city-data.com from local newspapers, TV, and radio stations
Ancestries: Polish (16.7%), German (16.6%), Irish (7.7%), Italian (5.9%), American (3.8%), English (3.0%).
Current Local Time:
Incorporated on 07/06/1894
Land area: 9.83 square miles.
Population density: 3,046 people per square mile (average).
3,477 residents are foreign born (4.4% Europe , 3.4% Asia , 2.9% Latin America ).
This village:
11.6%Illinois:
14.1%
Median real estate property taxes paid for housing units with mortgages in 2022: $7,337 (2.2%)Median real estate property taxes paid for housing units with no mortgage in 2022: $7,379 (2.2%)
Nearest city with pop. 50,000+: Elgin, IL
Nearest city with pop. 200,000+: Chicago, IL
Nearest cities:
Latitude: 42.16 N, Longitude: 88.30 W
Nickname or alias (official or unofficial): The Gem of the Fox River Valley
Daytime population change due to commuting: -3,519 (-11.8%)Workers who live and work in this village: 5,279 (30.3%)
Algonquin tourist attractions:
Single-family new house construction building permits:
2022: 112 buildings , average cost: $248,6002021: 105 buildings , average cost: $262,7002020: 29 buildings , average cost: $264,4002019: 49 buildings , average cost: $132,0002018: 86 buildings , average cost: $142,7002017: 33 buildings , average cost: $330,2002016: 27 buildings , average cost: $356,9002015: 24 buildings , average cost: $357,8002014: 18 buildings , average cost: $384,2002013: 4 buildings , average cost: $338,9002010: 2 buildings , average cost: $622,2002009: 4 buildings , average cost: $360,3002008: 18 buildings , average cost: $316,0002007: 33 buildings , average cost: $251,8002006: 119 buildings , average cost: $211,0002005: 246 buildings , average cost: $163,7002004: 279 buildings , average cost: $149,8002003: 220 buildings , average cost: $138,5002002: 455 buildings , average cost: $162,2002001: 594 buildings , average cost: $146,4002000: 387 buildings , average cost: $185,3001999: 384 buildings , average cost: $151,1001998: 323 buildings , average cost: $151,4001997: 296 buildings , average cost: $140,100Unemployment in December 2023:
Population change in the 1990s: +10,724 (+85.4%).
Most common occupations in Algonquin, IL (%)
Both Males Females
Other sales and related occupations, including supervisors (5.1%)
Other management occupations, except farmers and farm managers (4.9%)
Sales representatives, services, wholesale and manufacturing (4.6%)
Computer specialists (4.5%)
Other office and administrative support workers, including supervisors (4.1%)
Retail sales workers, except cashiers (3.5%)
Top executives (3.5%)
Other sales and related occupations, including supervisors (6.3%)
Other management occupations, except farmers and farm managers (6.2%)
Computer specialists (6.2%)
Top executives (5.3%)
Sales representatives, services, wholesale and manufacturing (4.9%)
Operations specialties managers, except financial managers (4.6%)
Engineers (4.5%)
Other office and administrative support workers, including supervisors (8.8%)
Secretaries and administrative assistants (6.5%)
Preschool, kindergarten, elementary, and middle school teachers (5.5%)
Customer service representatives (4.8%)
Sales representatives, services, wholesale and manufacturing (4.2%)
Other sales and related occupations, including supervisors (3.4%)
Information and record clerks, except customer service representatives (3.4%)
Tornado activity:
Algonquin-area historical tornado activity is slightly below Illinois state average. It is 41% greater than the overall U.S. average.
On 4/21/1967, a category F4 (max. wind speeds 207-260 mph) tornado 1.9 miles away from the Algonquin village center killed one person and injured 100 people and caused between $500,000 and $5,000,000 in damages.
On 4/11/1965, a category F4 tornado 5.6 miles away from the village center killed 6 people and injured 75 people .
Earthquake activity:
Algonquin-area historical earthquake activity is significantly above Illinois state average. It is 42% greater than the overall U.S. average. On 4/18/2008 at 09:36:59, a magnitude 5.4 (5.1 MB, 4.8 MS, 5.4 MW, 5.2 MW, Class: Moderate, Intensity: VI - VII) earthquake occurred 257.6 miles away from the city center On 6/10/1987 at 23:48:54, a magnitude 5.1 (4.9 MB, 4.4 MS, 4.6 MS, 5.1 LG) earthquake occurred 232.2 miles away from Algonquin center On 6/28/2004 at 06:10:52, a magnitude 4.2 (4.2 MW, Depth: 6.2 mi, Class: Light, Intensity: IV - V) earthquake occurred 57.5 miles away from the city center On 4/18/2008 at 09:36:59, a magnitude 5.2 (5.2 MW, Depth: 8.9 mi) earthquake occurred 257.6 miles away from the city center On 2/10/2010 at 09:59:35, a magnitude 3.8 (3.8 MW, Depth: 6.2 mi, Class: Light, Intensity: II - III) earthquake occurred 16.7 miles away from Algonquin center On 6/18/2002 at 17:37:15, a magnitude 5.0 (4.3 MB, 4.6 MW, 5.0 LG) earthquake occurred 290.1 miles away from the city center Magnitude types: regional Lg-wave magnitude (LG), body-wave magnitude (MB), surface-wave magnitude (MS), moment magnitude (MW) Natural disasters: The number of natural disasters in McHenry County (15) is near the US average (15).Major Disasters (Presidential) Declared: 8Emergencies Declared: 6Storms: 7, Floods: 6, Snows: 3, Snowstorms: 2, Tornadoes: 2, Winter Storms: 2, Blizzard: 1, Hurricane: 1, Wind: 1, Other: 1 (Note: some incidents may be assigned to more than one category). Hospitals and medical centers in Algonquin: EMMANUEL HOME HEALTH, INC (610 LAKE PLUMLEIGH WAY)
Other hospitals and medical centers near Algonquin: NORTHWEST HOME HEALTH AND REHAB (Home Health Center, about 3 miles away; LAKE IN THE HILLS, IL)
QUALITY RENAL CARE (Dialysis Facility, about 4 miles away; CARPENTERSVILLE, IL)
DAVITA - CRYSTAL SPRINGS DIALYSIS (Dialysis Facility, about 5 miles away; CRYSTAL LAKE, IL)
ARA - CRYSTAL LAKE DIALYSIS CENTER (Dialysis Facility, about 5 miles away; CRYSTAL LAKE, IL)
FMC OF ELGIN (Dialysis Facility, about 6 miles away; ELGIN, IL)
FAIR OAKS HEALTH CARE CENTER (Nursing Home, about 6 miles away; CRYSTAL LAKE, IL)
CRYSTAL PINES REHAB AND HCC (Nursing Home, about 6 miles away; CRYSTAL LAKE, IL)
Colleges/universities with over 2000 students nearest to Algonquin:
McHenry County College (about 8 miles; Crystal Lake, IL ; Full-time enrollment: 4,886)
Elgin Community College (about 11 miles; Elgin, IL ; FT enrollment: 8,173)
Harper College (about 14 miles; Palatine, IL ; FT enrollment: 10,800)
American InterContinental University-Online (about 17 miles; Schaumburg, IL ; FT enrollment: 16,158)
College of Lake County (about 20 miles; Grayslake, IL ; FT enrollment: 11,041)
Chamberlain College of Nursing-Illinois (about 21 miles; Addison, IL ; FT enrollment: 8,977)
Universal Technical Institute of Illinois Inc (about 21 miles; Glendale Heights, IL ; FT enrollment: 2,281)
Public high school in Algonquin:
Public elementary/middle schools in Algonquin: WESTFIELD COMMUNITY SCHOOL Students: 1,745, Location: 2100 SLEEPY HOLLOW RD, Grades: KG-8)HEINEMAN MIDDLE SCHOOL Students: 818, Location: 725 ACADEMIC DR, Grades: 6-8)MACKEBEN ELEMENTARY SCHOOL Students: 721, Location: 800 ACADEMIC DR, Grades: KG-2)CONLEY ELEMENTARY SCHOOL Students: 615, Location: 750 ACADEMIC DR, Grades: 3-5)KENNETH E NEUBERT ELEM SCHOOL Students: 600, Location: 1100 HUNTINGTON DR, Grades: KG-5)ALGONQUIN MIDDLE SCHOOL Students: 561, Location: 520 LONGWOOD DR, Grades: 6-8)ALGONQUIN LAKES ELEM SCH Students: 487, Location: 1401 COMPTON DR, Grades: KG-5)EASTVIEW ELEM SCHOOL Location: 540 LONGWOOD DR, Grades: KG-5)
Private elementary/middle schools in Algonquin: ST MARGARET MARY CATHOLIC SCHOOL Students: 457, Location: 119 S HUBBARD ST, Grades: PK-8)
ST JOHNS LUTHERAN SCHOOL Students: 90, Location: 300 JEFFERSON ST, Grades: PK-8)
FOUNDATIONS MONTESSORI SCHOOL Students: 85, Location: 2651 W ALGONQUIN RD, Grades: PK-5)
See full list of schools located in Algonquin Library in Algonquin: ALGONQUIN AREA PUBLIC LIBRARY DISTRICT Operating income: $5,313,454; Location: 2600 HARNISH DRIVE; 202,391 books ; 12,803 e-books ; 15,513 audio materials ; 19,009 video materials ; 17 local licensed databases ; 3 state licensed databases ; 2 other licensed databases ; 404 print serial subscriptions ; 3 electronic serial subscriptions )
User-submitted facts and corrections:
Hospitals in area: Advocate Good Shepherd (LOcated less than 8 miles away in Barrington IL)
Village of Algonquin is both in McHenry and Kane counties.
Notable locations in Algonquin: (A) , Terrace Hill Golf Course (B) , Algonquin Lake in the Hills Fire Department Station 3 (C) , Algonquin Lake in the Hills Fire Department Station 2 (D) . Display/hide their locations on the map
Shopping Centers: (1) , Eagle Country Market Center Shopping Center (2) , River Pointe Shopping Center (3) . Display/hide their locations on the map
Churches in Algonquin include: (A) , Saint Johns Lutheran Church (B) , Saint Margaret Mary Roman Catholic Church (C) , Light of Christ Lutheran Church (D) . Display/hide their locations on the map
Lake: (A) . Display/hide its location on the map
Streams, rivers, and creeks: (A) . Display/hide its location on the map
Parks in Algonquin include: (1) , Snapper Field Park (2) , Yellowstone Park (3) , River Front Park (4) , Braewood Park (5) , Towne Park (6) , Gaslight Park (7) , Holder Memorial Park (8) . Display/hide their locations on the map
Hotels: (1) , Holiday Inn Express Hotel & Suites (2595 Bunker Hill Road) (2) . Display/hide their approximate locations on the map
Birthplace of: Theresa Schwegel - Crime fiction writer, Evan Jager - Middle distance runners, Eric Vierneisel - College basketball player (California Golden Bears).
McHenry County has a predicted average indoor radon screening level between 2 and 4 pCi/L (pico curies per liter) - Moderate Potential Drinking water stations with addresses in Algonquin and their reported violations in the past:
ALGONQUIN (Address: 110 MEYER DRIVE Population served: 30,046, Groundwater):
Past health violations:
MCL, Monthly (TCR) - In AUG-2006, Contaminant: Coliform. Follow-up actions: St Public Notif requested (SEP-13-2006), St Violation/Reminder Notice (SEP-13-2006), St Public Notif received (OCT-10-2006), St Compliance achieved (MAR-01-2007)
Past monitoring violations:
Monitoring and Reporting (DBP) - Between JUL-2006 and SEP-2006, Contaminant: Chlorine. Follow-up actions: St Public Notif requested (AUG-14-2006), St Violation/Reminder Notice (AUG-14-2006), St Compliance achieved (AUG-21-2006), St Public Notif received (AUG-14-2007)
One minor monitoring violation
Average household size: This village:
2.9 peopleIllinois:
2.6 people
Percentage of family households: This village:
79.7%Whole state:
65.8%
Percentage of households with unmarried partners: This village:
4.5%Whole state:
6.3%
Likely homosexual households (counted as self-reported same-sex unmarried-partner households)
Lesbian couples: 0.3% of all households Gay men: 0.2% of all households
8 people in other nonhousehold living situations in 2000people in religious group quarters in 2000
Banks with most branches in Algonquin (2011 data):
Algonquin State Bank, National Association: at 2400 Huntington Drive North, Eastgate Manor Mobile Branch, Main Street Branch, Algonquin Road Facility. Info updated 2006/11/03: Bank assets: $147.3 mil, Deposits: $129.1 mil, local headquarters , positive income , 4 total offices , Holding Company: First Algonquin Company
TCF National Bank: Algonquin Jewel Branch #2264 at 103 South Randall Road, branch established on 1996/08/22; Algonquin Jewel Branch at 1501 East Algonquin Road, branch established on 2006/08/30. Info updated 2009/11/23: Bank assets: $19,007.0 mil, Deposits: $12,377.0 mil, headquarters in Sioux Falls, SD, positive income , Commercial Lending Specialization, 441 total offices , Holding Company: Tcf Financial Corporation
U.S. Bank National Association: Algonquin Meijer Branch at 400 South Randall Road, branch established on 2001/08/12; Algonquin Office at 798 S Randall Rd, branch established on 2011/09/12. Info updated 2012/01/30: Bank assets: $330,470.8 mil, Deposits: $236,091.5 mil, headquarters in Cincinnati, OH, positive income , 3121 total offices , Holding Company: U.S. Bancorp
JPMorgan Chase Bank, National Association: Randall And Harnish Branch at 1000 S Randall Rd, branch established on 2010/09/23; Algonquin Branch at 1350 East Algonquin Road, branch established on 1992/07/01. Info updated 2011/11/10: Bank assets: $1,811,678.0 mil, Deposits: $1,190,738.0 mil, headquarters in Columbus, OH, positive income , International Specialization, 5577 total offices , Holding Company: Jpmorgan Chase & Co.
Woodforest National Bank: Algonquin Illinois Branch at 1410 South Randall Rd, branch established on 2009/07/01; Algonquin Illinois Branch at 1410 South Randall Road, branch established on 2009/05/27. Info updated 2011/05/10: Bank assets: $3,488.9 mil, Deposits: $3,097.6 mil, headquarters in Houston, TX, positive income , Commercial Lending Specialization, 766 total offices , Holding Company: Woodforest Financial Group Employee Stock Ownership Plan (With 401(K) Provisions)
Crystal Lake Bank and Trust Company, National Association: Algonquin Bank Branch at 4049 W. Algonquin Rd, branch established on 2006/05/24. Info updated 2008/08/11: Bank assets: $731.0 mil, Deposits: $580.0 mil, headquarters in Crystal Lake, IL, negative income in the last year , Commercial Lending Specialization, 8 total offices , Holding Company: Wintrust Financial Corporation
RBS Citizens, National Association: Greatbank Branch at 234 South Randall Road, branch established on 1995/06/05. Info updated 2007/09/19: Bank assets: $106,940.6 mil, Deposits: $75,690.2 mil, headquarters in Providence, RI, positive income , 1135 total offices , Holding Company: Uk Financial Investments Limited
BMO Harris Bank National Association: Harris Bank Algonquin Branch at 225 South Randall Road, branch established on 1996/04/01. Info updated 2011/07/14: Bank assets: $97,264.0 mil, Deposits: $75,624.6 mil, headquarters in Chicago, IL, positive income , 717 total offices , Holding Company: Bank Of Montreal
Fifth Third Bank: Algonquin Banking Center Branch at 450 S. Randell Road, branch established on 2003/01/27. Info updated 2009/10/05: Bank assets: $114,540.4 mil, Deposits: $89,689.1 mil, headquarters in Cincinnati, OH, positive income , Commercial Lending Specialization, 1378 total offices , Holding Company: Fifth Third Bancorp
2 other banks with 2 local branches
For population 15 years and over in Algonquin:
Never married: 30.1%Now married: 54.1%Separated: 0.8%Widowed: 5.4%Divorced: 9.6% For population 25 years and over in Algonquin:
High school or higher: 94.6%Bachelor's degree or higher: 43.5%Graduate or professional degree: 16.6%Unemployed: 2.8%Mean travel time to work (commute): 25.7 minutes
Education Gini index (Inequality in education) Here:
10.1Illinois average:
12.5
Religion statistics for Algonquin, IL (based on McHenry County data)
Religion Adherents Congregations Catholic 108,465 17 Mainline Protestant 25,985 46 Evangelical Protestant 22,386 76 Other 8,809 20 Orthodox 54 1 None 143,061 -
Source: Clifford Grammich, Kirk Hadaway, Richard Houseal, Dale E.Jones, Alexei Krindatch, Richie Stanley and Richard H.Taylor. 2012. 2010 U.S.Religion Census: Religious Congregations & Membership Study. Association of Statisticians of American Religious Bodies. Jones, Dale E., et al. 2002. Congregations and Membership in the United States 2000. Nashville, TN: Glenmary Research Center. Graphs represent county-level data
Food Environment Statistics: Number of grocery stores : 44McHenry County :
1.40 / 10,000 pop.Illinois :
2.24 / 10,000 pop.
Number of supercenters and club stores : 4This county :
0.13 / 10,000 pop.State :
0.08 / 10,000 pop.
Number of convenience stores (no gas) : 24McHenry County :
0.76 / 10,000 pop.Illinois :
0.75 / 10,000 pop.
Number of convenience stores (with gas) : 64McHenry County :
2.03 / 10,000 pop.State :
2.61 / 10,000 pop.
Number of full-service restaurants : 198Here :
6.29 / 10,000 pop.State :
6.86 / 10,000 pop.
Adult diabetes rate : This county :
6.8%Illinois :
8.3%
Adult obesity rate : McHenry County :
26.5%Illinois :
25.2%
Low-income preschool obesity rate : This county :
17.7%State :
14.5%
Health and Nutrition: Healthy diet rate : Algonquin:
52.1%Illinois:
49.5%
Average overall health of teeth and gums : Algonquin:
51.6%State:
47.2%
Average BMI : This city:
28.2Illinois:
28.6
People feeling badly about themselves : People not drinking alcohol at all : Average hours sleeping at night : This city:
6.9Illinois:
6.8
Overweight people : Algonquin:
33.2%Illinois:
33.4%
General health condition : Algonquin:
60.3%Illinois:
56.4%
Average condition of hearing : More about Health and Nutrition of Algonquin, IL Residents
Local government employment and payroll (March 2022)
Function
Full-time employees
Monthly full-time payroll
Average yearly full-time wage
Part-time employees
Monthly part-time payroll
Police Protection - Officers
48 $415,974 $103,994 0 $0 Other and Unallocable
21 $169,482 $96,847 4 $5,548 Water Supply
11 $80,302 $87,602 0 $0 Financial Administration
9 $64,943 $86,591 2 $2,252 Streets and Highways
9 $59,352 $79,136 0 $0 Parks and Recreation
8 $48,094 $72,141 1 $789 Other Government Administration
6 $32,943 $65,886 17 $9,354 Sewerage
6 $41,184 $82,368 0 $0 Police - Other
6 $29,922 $59,844 5 $3,300 Natural Resources
3 $24,044 $96,176 0 $0 Solid Waste Management
1 $7,149 $85,788 0 $0 Welfare
0 $0 3 $3,353
Totals for Government
128 $973,389 $91,255 32 $24,596
Algonquin government finances - Expenditure in 2021 (per resident):
Construction - General - Other: $5,332,000 ($178.02)
Regular Highways: $1,109,000 ($37.03)Current Operations - Police Protection: $9,633,000 ($321.63)
Regular Highways: $5,727,000 ($191.21)Central Staff Services: $4,219,000 ($140.86)General - Other: $3,504,000 ($116.99)Water Utilities: $2,736,000 ($91.35)Sewerage: $2,549,000 ($85.11)Parks and Recreation: $1,568,000 ($52.35)Miscellaneous Commercial Activities - Other: $34,000 ($1.14)General - Interest on Debt: $1,260,000 ($42.07)
Intergovernmental to Local - Other - General - Other: $540,000 ($18.03)
Total Salaries and Wages: $11,384,000 ($380.09)
Algonquin government finances - Revenue in 2021 (per resident):
Charges - Parks and Recreation: $547,000 ($18.26)
Other: $172,000 ($5.74)Local Intergovernmental - Other: $2,430,000 ($81.13)
Miscellaneous - General Revenue - Other: $935,000 ($31.22)
Fines and Forfeits: $249,000 ($8.31)Interest Earnings: $164,000 ($5.48)Revenue - Water Utilities: $11,840,000 ($395.31)
State Intergovernmental - General Local Government Support: $12,409,000 ($414.31)
Highways: $2,132,000 ($71.18)Tax - Property: $6,711,000 ($224.07)
Other Selective Sales: $4,110,000 ($137.22)Public Utilities Sales: $1,294,000 ($43.20)Other License: $726,000 ($24.24)
Algonquin government finances - Debt in 2021 (per resident):
Long Term Debt - Outstanding Unspecified Public Purpose: $38,367,000 ($1280.99)
Beginning Outstanding - Unspecified Public Purpose: $31,506,000 ($1051.92)Issue, Unspecified Public Purpose: $20,140,000 ($672.43)Retired Unspecified Public Purpose: $13,279,000 ($443.36)
Algonquin government finances - Cash and Securities in 2021 (per resident):
Bond Funds - Cash and Securities: $420,000 ($14.02)
Other Funds - Cash and Securities: $38,543,000 ($1286.87)
Businesses in Algonquin, IL
Name Count Name Count
7-Eleven 2 Lane Bryant 1 ALDI 1 Maurices 1 AT&T 1 McDonald's 2 Aeropostale 1 Meijer 1 American Eagle Outfitters 1 Men's Wearhouse 1 Ann Taylor 1 Motherhood Maternity 2 Applebee's 1 New York & Co 1 Ashley Furniture 1 Nike 3 Baskin-Robbins 1 Office Depot 1 Bath & Body Works 1 OfficeMax 1 Brunswick Bowling & Billiards 2 Old Navy 1 Buffalo Wild Wings 1 On The Border 1 Burger King 1 Pac Sun 1 Chico's 1 Panda Express 1 Chipotle 1 Panera Bread 1 Clarks 1 Papa John's Pizza 1 Coldwater Creek 1 Payless 1 Dairy Queen 1 PetSmart 1 Discount Tire 1 Pier 1 Imports 1 Domino's Pizza 1 Plato's Closet 1 DressBarn 1 Pottery Barn 1 Dressbarn 1 Quiznos 1 Express 1 Red Robin 1 Famous Footwear 1 SONIC Drive-In 1 FedEx 4 Sephora 1 GameStop 2 Shoe Carnival 1 Gap 1 Sprint Nextel 1 Gymboree 1 Starbucks 2 Holiday Inn 1 T-Mobile 3 Hollister Co. 1 T.J.Maxx 1 Home Depot 1 Target 1 Houlihan's 1 The Room Place 2 Hyundai 1 Toys"R"Us 1 J. Jill 1 Trader Joe's 1 JCPenney 1 U-Haul 2 Jamba Juice 1 UPS 5 Jewel-Osco 2 Vans 1 JoS. A. Bank 1 Victoria's Secret 1 Justice 1 Walgreens 2 KFC 1 Walmart 1 Kohl's 1 Wendy's 1 La-Z-Boy 1 YMCA 1
Strongest AM radio stations in Algonquin:
WGN (720 AM; 50 kW; CHICAGO, IL; Owner: WGN CONTINENTAL BROADCASTING CO.)
WBBM (780 AM; 50 kW; CHICAGO, IL; Owner: INFINITY BROADCASTING OPERATIONS, INC.)
WSCR (670 AM; 50 kW; CHICAGO, IL; Owner: INFINITY BROADCASTING OPERATIONS, INC.)
WNVR (1030 AM; 5 kW; VERNON HILLS, IL; Owner: POLNET COMMUNICATIONS, LTD.)
WMVP (1000 AM; 50 kW; CHICAGO, IL; Owner: ABC, INC.)
WAIT (850 AM; daytime; 2 kW; CRYSTAL LAKE, IL; Owner: NM LICENSING, LLC)
WTMJ (620 AM; 50 kW; MILWAUKEE, WI; Owner: JOURNAL BROADCAST CORPORATION)
WISN (1130 AM; 50 kW; MILWAUKEE, WI; Owner: CAPSTAR TX LIMITED PARTNERSHIP)
WLS (890 AM; 50 kW; CHICAGO, IL; Owner: WLS, INC.)
WYLL (1160 AM; 50 kW; CHICAGO, IL; Owner: SCA LICENSE CORPORATION)
WMBI (1110 AM; daytime; 5 kW; CHICAGO, IL; Owner: THE MOODY BIBLE INSTITUTE OF CHICAGO)
WKTA (1330 AM; 5 kW; EVANSTON, IL; Owner: POLNET COMMUNICATIONS, LTD.)
WVIV (1200 AM; 20 kW; CHICAGO, IL; Owner: WLXX-AM LICENSE CORP.)
Strongest FM radio stations in Algonquin:
WZSR (105.5 FM; WOODSTOCK, IL; Owner: NM LICENSING, LLC)
WZCH (103.9 FM; DUNDEE, IL; Owner: ENTRAVISION HOLDINGS, LLC)
WJKL (94.3 FM; ELGIN, IL; Owner: ELGIN BROADCASTING CO., INC.)
WCKG (105.9 FM; ELMWOOD PARK, IL; Owner: INFINITY HOLDINGS CORPORATION OF ORLANDO)
WLIT-FM (93.9 FM; CHICAGO, IL; Owner: AMFM RADIO LICENSES, L.L.C.)
WJMK (104.3 FM; CHICAGO, IL; Owner: INFINITY BROADCASTING CORP. OF ILLINOIS)
WNUA (95.5 FM; CHICAGO, IL; Owner: AMFM RADIO LICENSES, L.L.C.)
WTMX (101.9 FM; SKOKIE, IL; Owner: BONNEVILLE HOLDING COMPANY)
WGCI-FM (107.5 FM; CHICAGO, IL; Owner: AMFM RADIO LICENSES, L.L.C.)
WBBM-FM (96.3 FM; CHICAGO, IL; Owner: INFINITY BROADCASTING OPERATIONS, INC.)
WKSC-FM (103.5 FM; CHICAGO, IL; Owner: AMFM RADIO LICENSES, L.L.C.)
WFMT (98.7 FM; CHICAGO, IL; Owner: WINDOW TO THE WORLD COMMUNICATIONS)
WZZN (94.7 FM; CHICAGO, IL; Owner: ABC CHICAGO FM RADIO,INC.)
WVIV-FM (103.1 FM; HIGHLAND PARK, IL; Owner: HBC LICENSE CORPORATION)
WBEZ (91.5 FM; CHICAGO, IL; Owner: THE WBEZ ALLIANCE, INC.)
WKQX (101.1 FM; CHICAGO, IL; Owner: EMMIS RADIO LICENSE CORPORATION)
WLUP-FM (97.9 FM; CHICAGO, IL; Owner: BONNEVILLE HOLDING COMPANY)
WNND (100.3 FM; CHICAGO, IL; Owner: BONNEVILLE HOLDING COMPANY)
WOJO (105.1 FM; EVANSTON, IL; Owner: TICHENOR LICENSE CORPORATION ("TLC"))
WUSN (99.5 FM; CHICAGO, IL; Owner: INFINITY BROADCASTING CORPORATION OF CHICAGO)
TV broadcast stations around Algonquin:
W34CK (Channel 34; ARLINGTON HEIGHTS, IL; Owner: FIRST UNITED, INC.)
W64CQ (Channel 64; ARLINGTON HEIGHTS, IL; Owner: TRINITY BROADCASTING NETWORK)
W57DN (Channel 57; ELGIN, IL; Owner: TRINITY BROADCASTING NETWORK)
WLS-TV (Channel 7; CHICAGO, IL; Owner: WLS TELEVISION, INC.)
WMAQ-TV (Channel 5; CHICAGO, IL; Owner: NBC SUBSIDIARY (WMAQ-TV), INC.)
WTTW (Channel 11; CHICAGO, IL; Owner: WINDOW TO THE WORLD COMMUNICATIONS, INC.)
WGN-TV (Channel 9; CHICAGO, IL; Owner: WGN CONTINENTAL BROADCASTING COMPANY)
WGBO-TV (Channel 66; JOLIET, IL; Owner: WGBO LICENSE PARTNERSHIP, G.P.)
WBBM-TV (Channel 2; CHICAGO, IL; Owner: CBS BROADCASTING INC.)
WPWR-TV (Channel 50; GARY, IN; Owner: FOX TELEVISION STATIONS, INC.)
WXFT (Channel 60; AURORA, IL; Owner: TELEFUTURA CHICAGO LLC)
WCIU-TV (Channel 26; CHICAGO, IL; Owner: WCIU-TV LIMITED PARTNERSHIP)
WCPX (Channel 38; CHICAGO, IL; Owner: PAXSON CHICAGO LICENSE, INC.)
WSNS-TV (Channel 44; CHICAGO, IL; Owner: TELEMUNDO OF CHICAGO, INC.)
WFLD (Channel 32; CHICAGO, IL; Owner: FOX TELEVISION STATIONS, INC.)
W68DO (Channel 68; PALATINE, IL; Owner: TRINITY BROADCASTING NETWORK)
WFBT-CA (Channel 23; CHICAGO, IL; Owner: CHANNEL 23 LIMITED PARTNERSHIP)
WJYS (Channel 62; HAMMOND, IN; Owner: JOVON BROADCASTING CORPORATION)
WOCH-LP (Channel 28; CHICAGO, IL; Owner: KM LPTV OF CHICAGO-28, L.L.C.)
WYCC (Channel 20; CHICAGO, IL; Owner: COLLEGE DIST. #508, COUNTY OF COOK)
WOCK-CA (Channel 13; CHICAGO, IL; Owner: KM LPTV OF CHICAGO-13, L.L.C.)
W24AJ (Channel 24; AURORA, IL; Owner: NELSON TV, INC.)
National Bridge Inventory (NBI) Statistics 14 Number of bridges125ft / 37.8m Total length $5,996,000 Total costs262,310 Total average daily traffic13,224 Total average daily truck traffic
New bridges - historical statistics
1 1920-1929 1 1950-1959 1 1980-1989 2 1990-1999 3 2000-2009 5 2010-2019 1 2020-2022
See full National Bridge Inventory statistics for Algonquin, IL
Home Mortgage Disclosure Act Aggregated Statistics For Year 2009(Based on 6 partial tracts) A) FHA, FSA/RHS & VA B) Conventional C) Refinancings D) Home Improvement Loans E) Loans on Dwellings For 5+ Families F) Non-occupant Loans on G) Loans On Manufactured Number Average Value Number Average Value Number Average Value Number Average Value Number Average Value Number Average Value Number Average Value
LOANS ORIGINATED 99 $194,656 90 $180,534 813 $198,035 15 $98,067 2 $445,480 20 $152,436 2 $289,575 APPLICATIONS APPROVED, NOT ACCEPTED 7 $181,026 7 $260,776 72 $205,312 3 $59,540 0 $0 1 $176,600 0 $0 APPLICATIONS DENIED 14 $197,264 11 $218,954 236 $217,528 7 $51,444 0 $0 8 $168,688 0 $0 APPLICATIONS WITHDRAWN 8 $179,678 11 $206,638 134 $212,918 5 $110,270 0 $0 3 $190,343 0 $0 FILES CLOSED FOR INCOMPLETENESS 2 $167,830 2 $177,230 48 $206,825 1 $112,550 0 $0 1 $148,010 0 $0
Aggregated Statistics For Year 2008(Based on 6 partial tracts) A) FHA, FSA/RHS & VA B) Conventional C) Refinancings D) Home Improvement Loans E) Loans on Dwellings For 5+ Families F) Non-occupant Loans on Number Average Value Number Average Value Number Average Value Number Average Value Number Average Value Number Average Value
LOANS ORIGINATED 56 $215,845 141 $208,242 448 $206,760 28 $69,995 1 $321,400 25 $166,904 APPLICATIONS APPROVED, NOT ACCEPTED 2 $240,055 15 $217,553 92 $210,404 8 $26,306 0 $0 3 $131,767 APPLICATIONS DENIED 14 $227,308 20 $215,904 233 $232,872 20 $76,515 0 $0 6 $148,073 APPLICATIONS WITHDRAWN 8 $230,059 12 $251,490 87 $223,214 3 $93,127 0 $0 2 $193,725 FILES CLOSED FOR INCOMPLETENESS 2 $215,490 4 $195,510 34 $206,172 3 $45,400 0 $0 0 $0
Aggregated Statistics For Year 2007(Based on 6 partial tracts) A) FHA, FSA/RHS & VA B) Conventional C) Refinancings D) Home Improvement Loans E) Loans on Dwellings For 5+ Families F) Non-occupant Loans on Number Average Value Number Average Value Number Average Value Number Average Value Number Average Value Number Average Value
LOANS ORIGINATED 12 $223,310 354 $190,583 647 $194,287 64 $87,805 1 $272,830 39 $169,118 APPLICATIONS APPROVED, NOT ACCEPTED 1 $191,510 37 $204,310 107 $181,933 17 $60,428 0 $0 3 $155,273 APPLICATIONS DENIED 3 $236,040 65 $209,953 323 $207,176 34 $79,276 0 $0 12 $144,322 APPLICATIONS WITHDRAWN 3 $158,750 27 $212,578 140 $225,547 10 $119,476 0 $0 5 $195,368 FILES CLOSED FOR INCOMPLETENESS 0 $0 7 $229,704 53 $205,397 3 $77,910 0 $0 1 $148,060
Aggregated Statistics For Year 2006(Based on 6 partial tracts) A) FHA, FSA/RHS & VA B) Conventional C) Refinancings D) Home Improvement Loans E) Loans on Dwellings For 5+ Families F) Non-occupant Loans on G) Loans On Manufactured Number Average Value Number Average Value Number Average Value Number Average Value Number Average Value Number Average Value Number Average Value
LOANS ORIGINATED 16 $216,101 582 $182,681 742 $180,851 76 $66,665 1 $595,100 64 $162,780 1 $61,710 APPLICATIONS APPROVED, NOT ACCEPTED 1 $196,590 70 $175,621 128 $184,107 14 $76,056 0 $0 10 $127,570 0 $0 APPLICATIONS DENIED 6 $215,603 95 $176,402 319 $204,602 44 $77,918 0 $0 22 $161,745 0 $0 APPLICATIONS WITHDRAWN 0 $0 55 $194,487 184 $208,584 7 $100,131 0 $0 13 $154,115 0 $0 FILES CLOSED FOR INCOMPLETENESS 0 $0 16 $193,628 55 $185,727 4 $108,972 0 $0 4 $133,375 0 $0
Aggregated Statistics For Year 2005(Based on 6 partial tracts) A) FHA, FSA/RHS & VA B) Conventional C) Refinancings D) Home Improvement Loans E) Loans on Dwellings For 5+ Families F) Non-occupant Loans on G) Loans On Manufactured Number Average Value Number Average Value Number Average Value Number Average Value Number Average Value Number Average Value Number Average Value
LOANS ORIGINATED 34 $208,976 791 $176,797 853 $190,552 70 $85,892 1 $534,040 62 $156,087 0 $0 APPLICATIONS APPROVED, NOT ACCEPTED 1 $169,790 68 $173,594 126 $178,464 17 $45,684 0 $0 4 $158,080 1 $15,450 APPLICATIONS DENIED 4 $228,940 106 $159,087 369 $197,049 42 $63,986 0 $0 16 $145,301 1 $51,890 APPLICATIONS WITHDRAWN 3 $219,637 93 $168,227 258 $212,132 21 $181,212 1 $162,660 13 $158,349 0 $0 FILES CLOSED FOR INCOMPLETENESS 1 $151,160 17 $182,451 49 $214,895 3 $72,953 0 $0 0 $0 0 $0
Aggregated Statistics For Year 2004(Based on 6 partial tracts) A) FHA, FSA/RHS & VA B) Conventional C) Refinancings D) Home Improvement Loans E) Loans on Dwellings For 5+ Families F) Non-occupant Loans on G) Loans On Manufactured Number Average Value Number Average Value Number Average Value Number Average Value Number Average Value Number Average Value Number Average Value
LOANS ORIGINATED 55 $191,639 663 $180,624 1,013 $184,742 73 $62,733 1 $198,880 60 $158,882 2 $51,940 APPLICATIONS APPROVED, NOT ACCEPTED 1 $241,190 58 $189,018 129 $177,419 18 $46,618 1 $394,050 6 $148,232 0 $0 APPLICATIONS DENIED 4 $195,312 74 $163,503 352 $186,438 56 $56,573 0 $0 12 $135,185 1 $107,510 APPLICATIONS WITHDRAWN 4 $187,510 51 $182,058 293 $197,946 13 $72,419 0 $0 6 $175,472 0 $0 FILES CLOSED FOR INCOMPLETENESS 1 $258,400 13 $199,665 54 $199,896 5 $30,182 0 $0 1 $282,420 0 $0
Aggregated Statistics For Year 2003(Based on 6 partial tracts) A) FHA, FSA/RHS & VA B) Conventional C) Refinancings D) Home Improvement Loans E) Loans on Dwellings For 5+ Families F) Non-occupant Loans on Number Average Value Number Average Value Number Average Value Number Average Value Number Average Value Number Average Value
LOANS ORIGINATED 84 $180,079 641 $184,807 2,618 $169,996 36 $41,719 1 $218,060 49 $131,710 APPLICATIONS APPROVED, NOT ACCEPTED 6 $177,047 69 $183,074 240 $165,549 11 $27,135 0 $0 6 $170,517 APPLICATIONS DENIED 7 $174,840 37 $162,906 411 $158,235 31 $27,831 0 $0 10 $175,241 APPLICATIONS WITHDRAWN 4 $186,750 51 $189,635 381 $171,042 8 $56,929 0 $0 4 $148,070 FILES CLOSED FOR INCOMPLETENESS 3 $166,903 12 $213,798 73 $184,422 6 $40,627 0 $0 1 $140,120
Aggregated Statistics For Year 2002(Based on 1 partial tract) A) FHA, FSA/RHS & VA B) Conventional C) Refinancings D) Home Improvement Loans F) Non-occupant Loans on Number Average Value Number Average Value Number Average Value Number Average Value Number Average Value
LOANS ORIGINATED 8 $156,721 70 $189,520 211 $174,127 6 $31,727 4 $115,898 APPLICATIONS APPROVED, NOT ACCEPTED 1 $129,050 6 $202,898 23 $158,923 2 $57,880 0 $0 APPLICATIONS DENIED 1 $192,640 5 $205,190 29 $144,465 3 $27,913 1 $69,800 APPLICATIONS WITHDRAWN 1 $163,570 5 $191,730 25 $166,909 1 $42,800 0 $0 FILES CLOSED FOR INCOMPLETENESS 0 $0 1 $102,910 11 $170,082 0 $0 0 $0
Aggregated Statistics For Year 2001(Based on 1 partial tract) A) FHA, FSA/RHS & VA B) Conventional C) Refinancings D) Home Improvement Loans F) Non-occupant Loans on Number Average Value Number Average Value Number Average Value Number Average Value Number Average Value
LOANS ORIGINATED 19 $154,357 72 $176,055 148 $160,640 6 $25,138 4 $115,108 APPLICATIONS APPROVED, NOT ACCEPTED 0 $0 4 $182,298 14 $139,944 2 $43,560 0 $0 APPLICATIONS DENIED 2 $173,150 6 $157,995 27 $121,145 4 $20,990 0 $0 APPLICATIONS WITHDRAWN 2 $119,080 7 $175,624 20 $147,892 1 $31,470 1 $218,020 FILES CLOSED FOR INCOMPLETENESS 0 $0 1 $228,250 5 $146,818 0 $0 0 $0
Aggregated Statistics For Year 2000(Based on 1 partial tract) A) FHA, FSA/RHS & VA B) Conventional C) Refinancings D) Home Improvement Loans F) Non-occupant Loans on Number Average Value Number Average Value Number Average Value Number Average Value Number Average Value
LOANS ORIGINATED 21 $146,242 61 $162,388 23 $113,985 6 $30,002 1 $66,100 APPLICATIONS APPROVED, NOT ACCEPTED 0 $0 4 $142,388 4 $92,565 2 $30,710 0 $0 APPLICATIONS DENIED 2 $154,800 5 $136,560 12 $90,351 4 $16,852 0 $0 APPLICATIONS WITHDRAWN 1 $233,370 6 $161,263 8 $89,311 1 $28,640 0 $0 FILES CLOSED FOR INCOMPLETENESS 0 $0 1 $93,110 3 $139,067 0 $0 0 $0
Aggregated Statistics For Year 1999(Based on 4 partial tracts) A) FHA, FSA/RHS & VA B) Conventional C) Refinancings D) Home Improvement Loans E) Loans on Dwellings For 5+ Families F) Non-occupant Loans on Number Average Value Number Average Value Number Average Value Number Average Value Number Average Value Number Average Value
LOANS ORIGINATED 107 $135,591 456 $142,250 489 $122,868 75 $23,578 1 $376,500 17 $104,440 APPLICATIONS APPROVED, NOT ACCEPTED 2 $171,845 28 $132,399 67 $107,692 9 $22,236 0 $0 2 $81,925 APPLICATIONS DENIED 7 $140,489 36 $116,560 139 $104,620 36 $20,856 0 $0 2 $43,380 APPLICATIONS WITHDRAWN 8 $123,111 32 $154,025 103 $103,893 11 $41,656 0 $0 3 $74,313 FILES CLOSED FOR INCOMPLETENESS 1 $87,240 8 $133,828 41 $126,559 1 $53,630 0 $0 1 $25,540
Detailed HMDA statistics for the following Tracts:
8501.00
, 8711.03 , 8712.06 , 8713.09 , 8714.03 , 8714.04
Private Mortgage Insurance Companies Aggregated Statistics For Year 2009(Based on 6 partial tracts) A) Conventional B) Refinancings C) Non-occupant Loans on Number Average Value Number Average Value Number Average Value
LOANS ORIGINATED 19 $193,107 17 $228,846 0 $0 APPLICATIONS APPROVED, NOT ACCEPTED 5 $257,476 10 $224,821 0 $0 APPLICATIONS DENIED 1 $251,120 7 $216,947 1 $113,640 APPLICATIONS WITHDRAWN 0 $0 7 $214,337 0 $0 FILES CLOSED FOR INCOMPLETENESS 0 $0 1 $254,320 0 $0
Aggregated Statistics For Year 2008(Based on 6 partial tracts) A) Conventional B) Refinancings C) Non-occupant Loans on Number Average Value Number Average Value Number Average Value
LOANS ORIGINATED 54 $220,449 40 $239,920 4 $188,328 APPLICATIONS APPROVED, NOT ACCEPTED 20 $248,326 24 $265,236 1 $118,360 APPLICATIONS DENIED 6 $268,868 4 $254,125 3 $297,900 APPLICATIONS WITHDRAWN 2 $227,010 7 $246,447 0 $0 FILES CLOSED FOR INCOMPLETENESS 2 $196,555 0 $0 0 $0
Aggregated Statistics For Year 2007(Based on 6 partial tracts) A) Conventional B) Refinancings C) Non-occupant Loans on Number Average Value Number Average Value Number Average Value
LOANS ORIGINATED 95 $219,493 65 $252,948 4 $179,378 APPLICATIONS APPROVED, NOT ACCEPTED 16 $238,148 18 $249,207 0 $0 APPLICATIONS DENIED 0 $0 2 $285,135 0 $0 APPLICATIONS WITHDRAWN 4 $264,558 6 $263,465 1 $165,910 FILES CLOSED FOR INCOMPLETENESS 1 $246,410 0 $0 0 $0
Aggregated Statistics For Year 2006(Based on 6 partial tracts) A) Conventional B) Refinancings C) Non-occupant Loans on Number Average Value Number Average Value Number Average Value
LOANS ORIGINATED 67 $232,800 36 $249,012 4 $220,228 APPLICATIONS APPROVED, NOT ACCEPTED 7 $244,251 11 $232,385 0 $0 APPLICATIONS DENIED 0 $0 1 $345,760 0 $0 APPLICATIONS WITHDRAWN 5 $254,614 2 $210,360 1 $79,100 FILES CLOSED FOR INCOMPLETENESS 0 $0 0 $0 0 $0
Aggregated Statistics For Year 2005(Based on 6 partial tracts) A) Conventional B) Refinancings C) Non-occupant Loans on Number Average Value Number Average Value Number Average Value
LOANS ORIGINATED 85 $223,201 44 $224,685 8 $181,840 APPLICATIONS APPROVED, NOT ACCEPTED 12 $228,338 9 $224,463 0 $0 APPLICATIONS DENIED 1 $156,880 1 $142,940 0 $0 APPLICATIONS WITHDRAWN 6 $182,015 6 $249,477 1 $190,400 FILES CLOSED FOR INCOMPLETENESS 1 $101,700 0 $0 0 $0
Aggregated Statistics For Year 2004(Based on 6 partial tracts) A) Conventional B) Refinancings C) Non-occupant Loans on D) Loans On Manufactured Number Average Value Number Average Value Number Average Value Number Average Value
LOANS ORIGINATED 124 $211,217 90 $216,772 7 $193,914 0 $0 APPLICATIONS APPROVED, NOT ACCEPTED 20 $204,898 27 $209,096 2 $230,760 1 $108,760 APPLICATIONS DENIED 0 $0 0 $0 0 $0 0 $0 APPLICATIONS WITHDRAWN 8 $195,102 4 $198,830 1 $223,740 0 $0 FILES CLOSED FOR INCOMPLETENESS 2 $317,795 0 $0 0 $0 0 $0
Aggregated Statistics For Year 2003(Based on 6 partial tracts) A) Conventional B) Refinancings C) Non-occupant Loans on Number Average Value Number Average Value Number Average Value
LOANS ORIGINATED 194 $203,037 206 $190,079 5 $162,918 APPLICATIONS APPROVED, NOT ACCEPTED 31 $207,590 52 $184,996 0 $0 APPLICATIONS DENIED 2 $158,375 1 $292,020 0 $0 APPLICATIONS WITHDRAWN 8 $218,668 11 $184,967 1 $148,560 FILES CLOSED FOR INCOMPLETENESS 1 $164,410 0 $0 0 $0
Aggregated Statistics For Year 2002(Based on 1 partial tract) A) Conventional B) Refinancings C) Non-occupant Loans on Number Average Value Number Average Value Number Average Value
LOANS ORIGINATED 16 $197,864 22 $189,273 1 $121,310 APPLICATIONS APPROVED, NOT ACCEPTED 4 $213,662 5 $192,012 1 $92,890 APPLICATIONS DENIED 0 $0 1 $140,370 0 $0 APPLICATIONS WITHDRAWN 0 $0 1 $199,720 0 $0 FILES CLOSED FOR INCOMPLETENESS 0 $0 0 $0 0 $0
Aggregated Statistics For Year 2001(Based on 1 partial tract) A) Conventional B) Refinancings C) Non-occupant Loans on Number Average Value Number Average Value Number Average Value
LOANS ORIGINATED 22 $194,307 19 $172,693 1 $71,330 APPLICATIONS APPROVED, NOT ACCEPTED 3 $203,643 3 $205,277 1 $70,130 APPLICATIONS DENIED 1 $102,150 1 $120,440 0 $0 APPLICATIONS WITHDRAWN 1 $178,270 1 $118,480 0 $0 FILES CLOSED FOR INCOMPLETENESS 1 $190,790 0 $0 0 $0
Aggregated Statistics For Year 2000(Based on 1 partial tract) A) Conventional B) Refinancings Number Average Value Number Average Value
LOANS ORIGINATED 20 $180,768 3 $147,123 APPLICATIONS APPROVED, NOT ACCEPTED 3 $203,317 1 $163,790 APPLICATIONS DENIED 0 $0 0 $0 APPLICATIONS WITHDRAWN 1 $87,120 0 $0 FILES CLOSED FOR INCOMPLETENESS 0 $0 0 $0
Aggregated Statistics For Year 1999(Based on 4 partial tracts) A) Conventional B) Refinancings C) Non-occupant Loans on Number Average Value Number Average Value Number Average Value
LOANS ORIGINATED 166 $158,653 80 $155,299 6 $103,182 APPLICATIONS APPROVED, NOT ACCEPTED 20 $160,666 16 $145,230 0 $0 APPLICATIONS DENIED 4 $197,230 6 $187,022 0 $0 APPLICATIONS WITHDRAWN 8 $152,908 3 $160,123 1 $143,010 FILES CLOSED FOR INCOMPLETENESS 2 $164,155 1 $204,250 0 $0
Detailed PMIC statistics for the following Tracts:
8501.00
, 8711.03 , 8712.06 , 8713.09 , 8714.03 , 8714.04 Algonquin compared to Illinois state average:
Median household income above state average. Unemployed percentage significantly below state average. Black race population percentage significantly below state average. Renting percentage significantly below state average. Number of rooms per house above state average. House age significantly below state average. Percentage of population with a bachelor's degree or higher above state average.
Top Patent Applicants
Vijay Nangia (87)
Bryan K. Glover (52)
Christopher Baldwin (36)
Philippe Sartori (35)
Teodoro Rivera (22)
Richard A. Johnson, Ii (19)
Bashar Jano (19)
Leena Munjal (15)
Alfonso Martinez Smith (14)
Stephen L. Kuffner (13)
Total of 809 patent applications in 2008-2024.
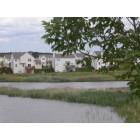
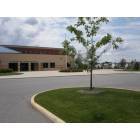
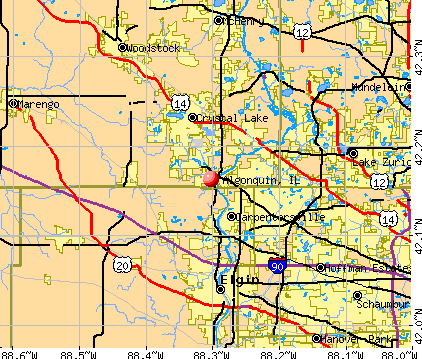


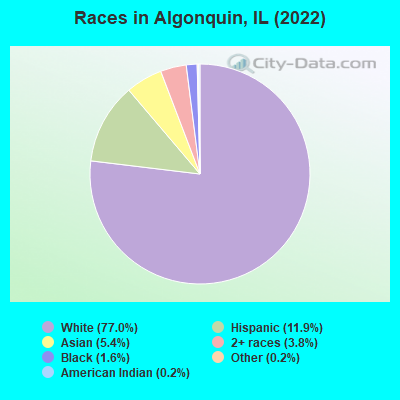
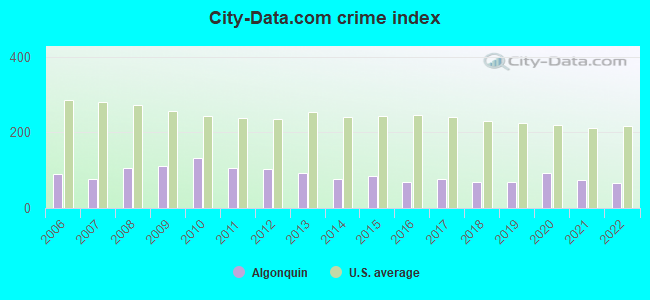
 Recent articles from our blog. Our writers, many of them Ph.D. graduates or candidates, create easy-to-read articles on a wide variety of topics.

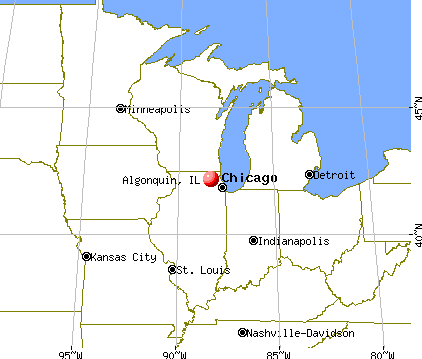
 (8.6 miles
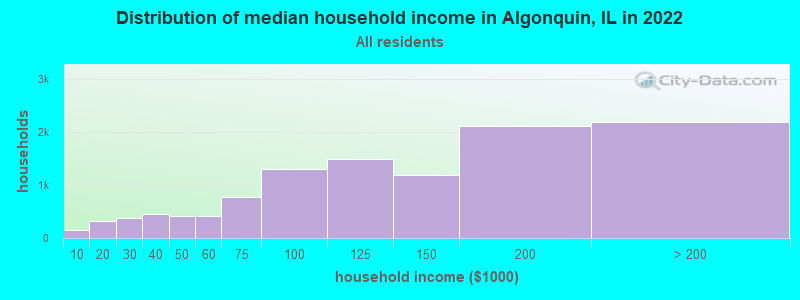
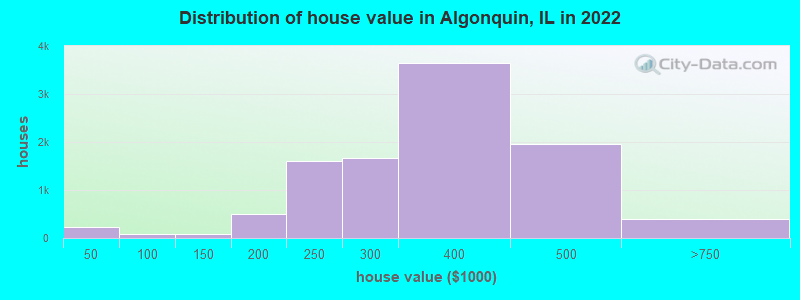
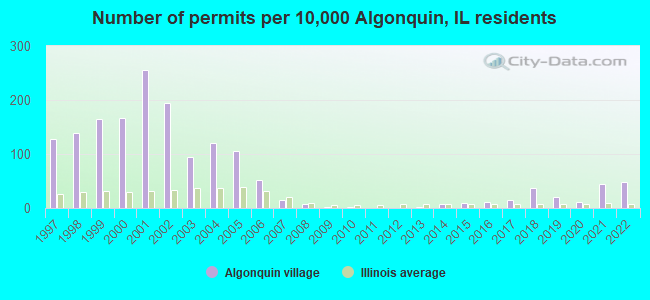
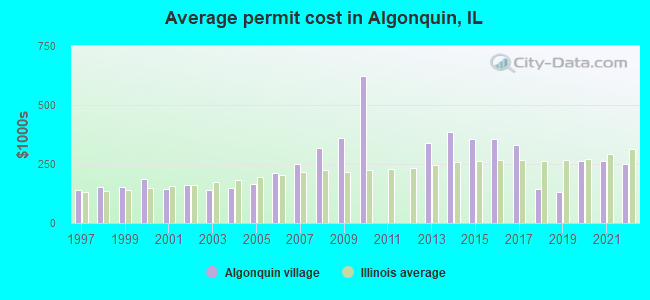
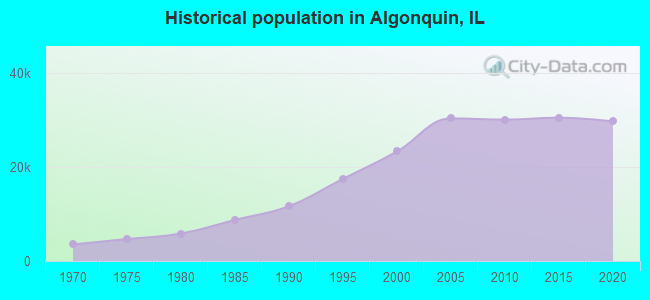
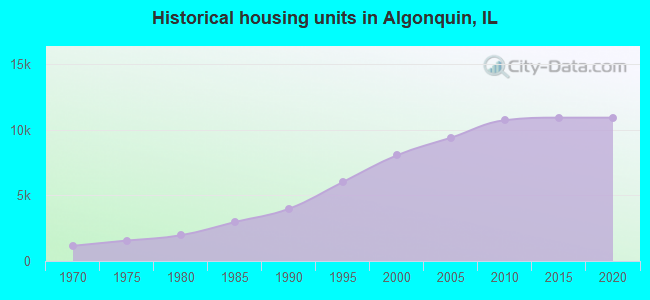
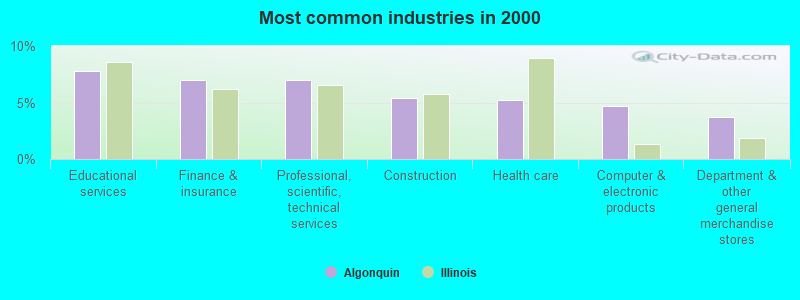
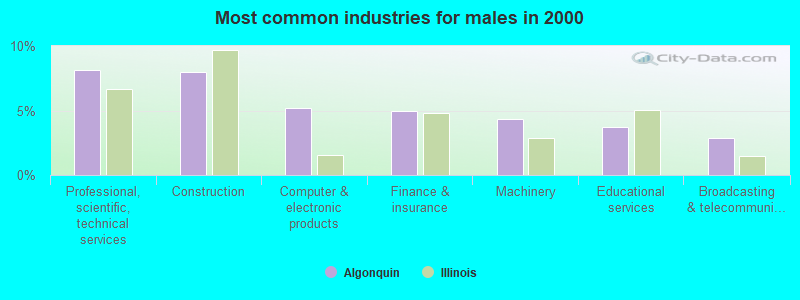
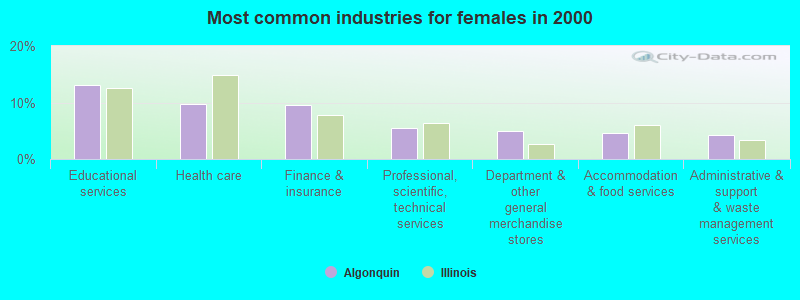
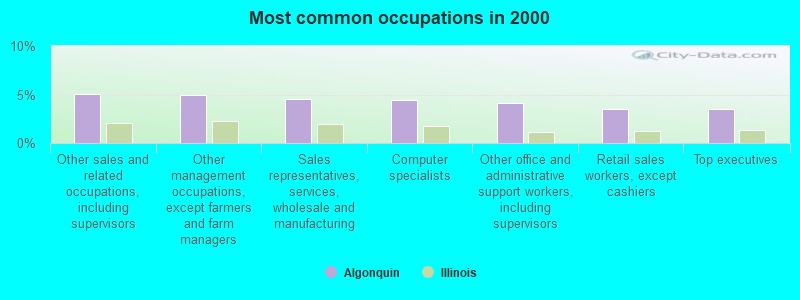
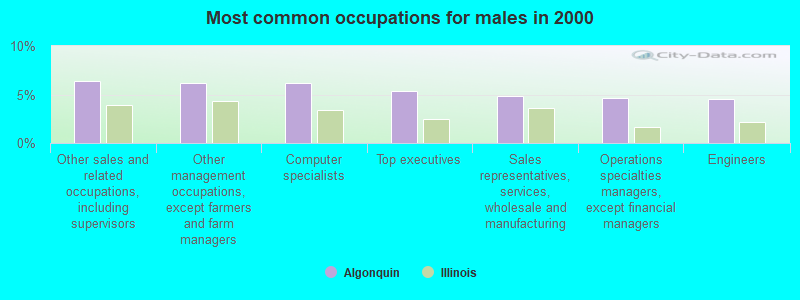
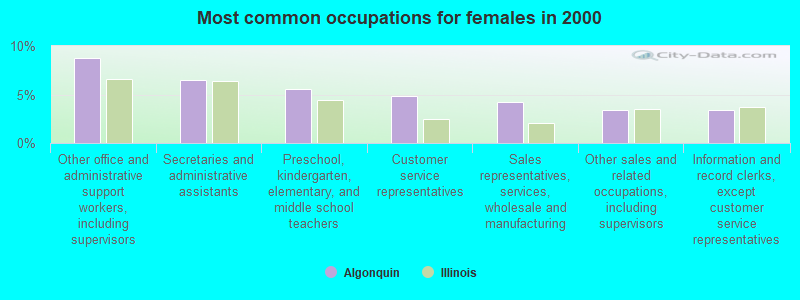
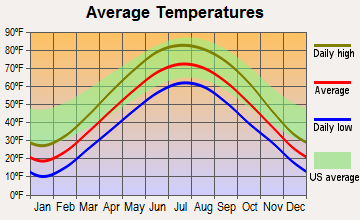
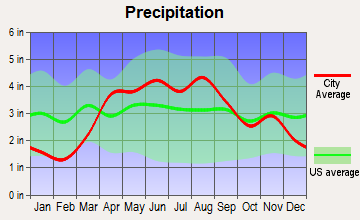
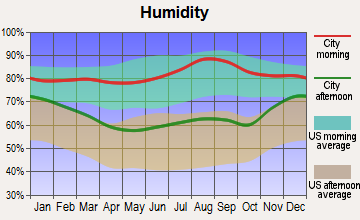
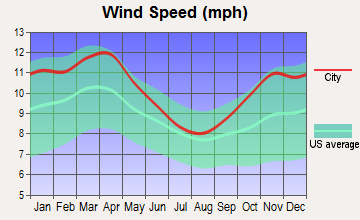
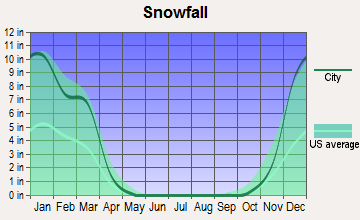
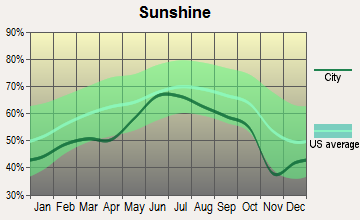
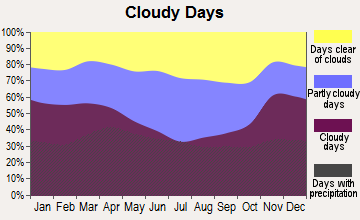
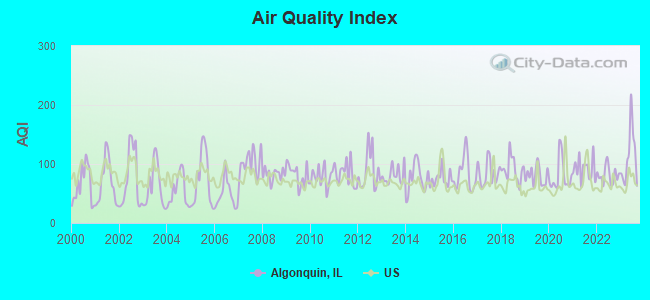
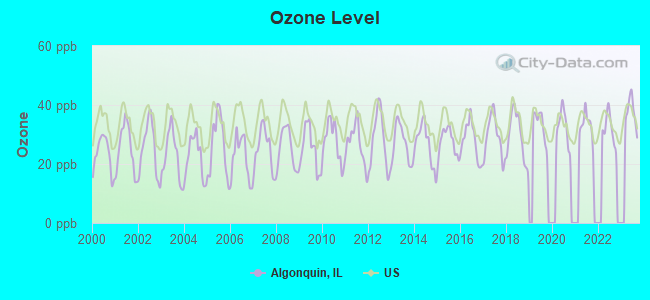
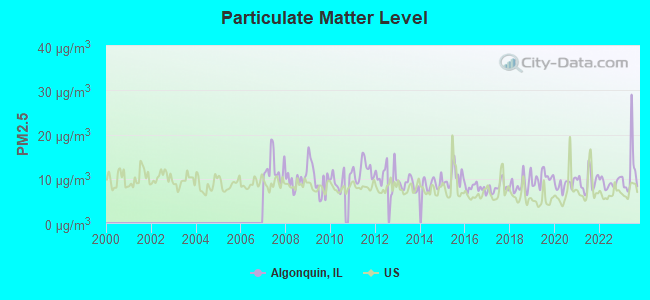
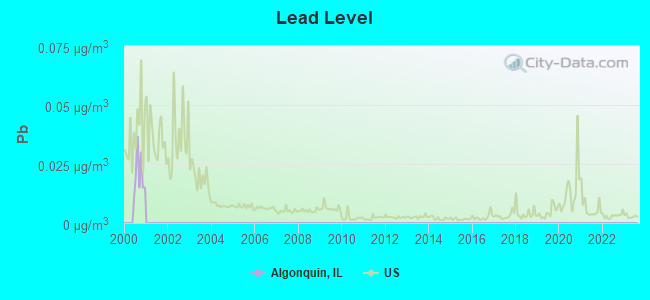
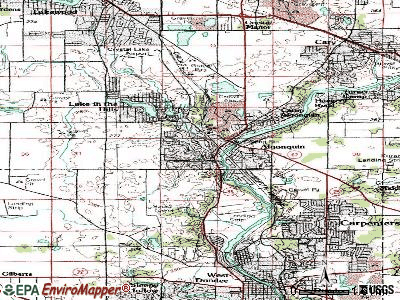
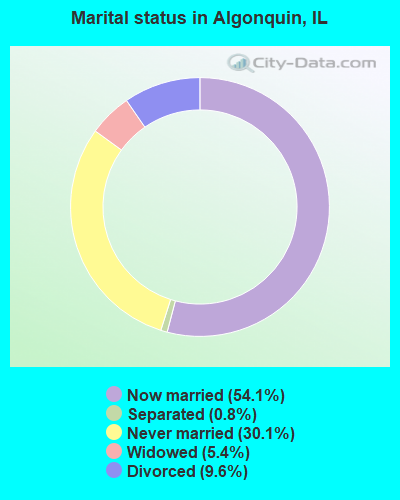
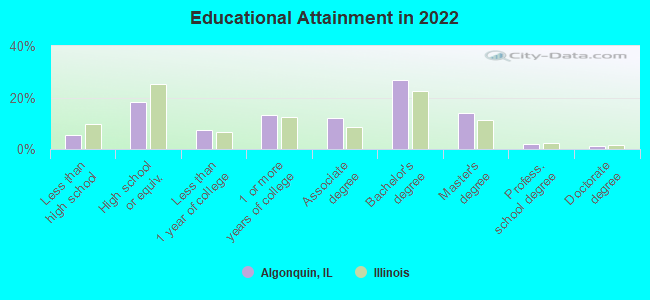
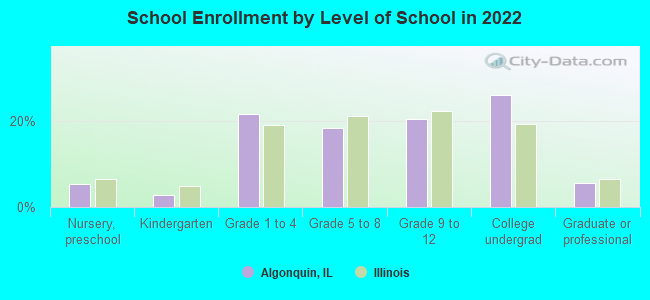
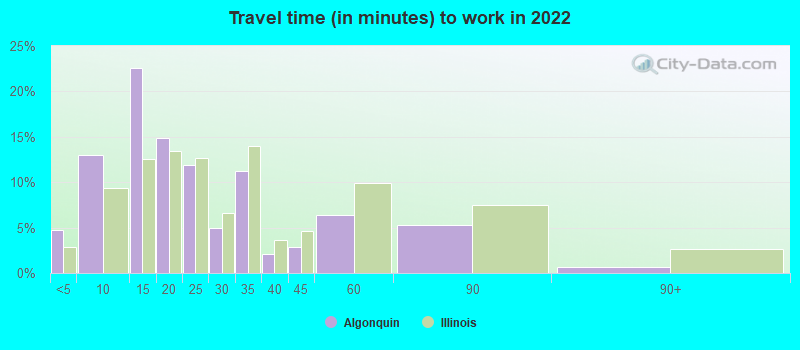
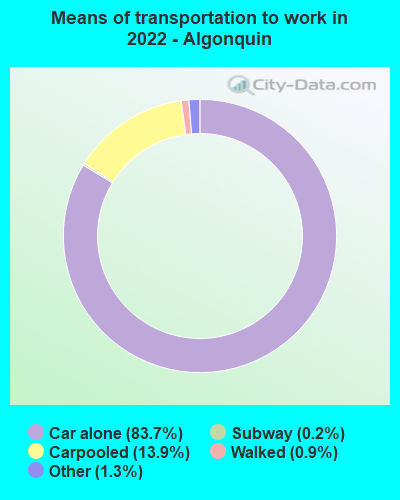
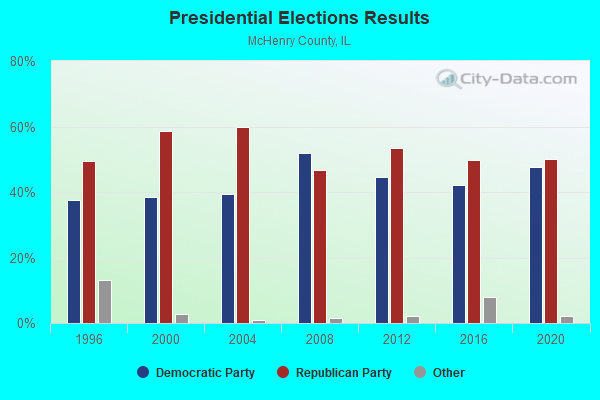
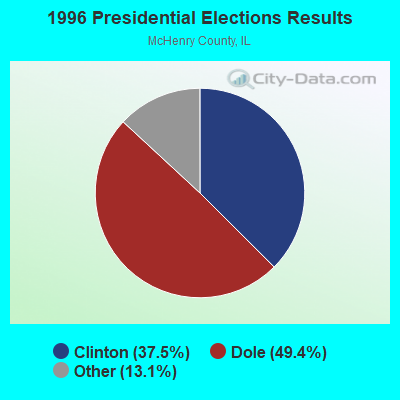
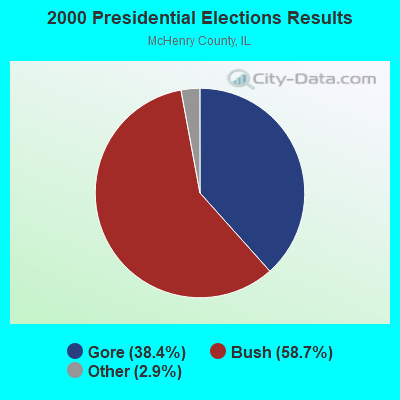
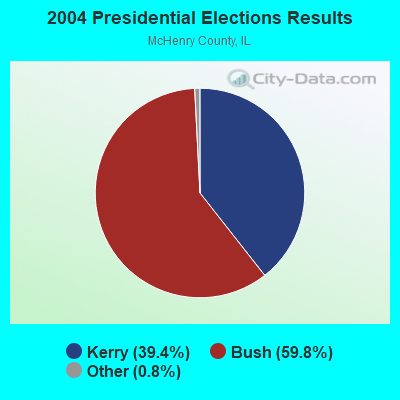
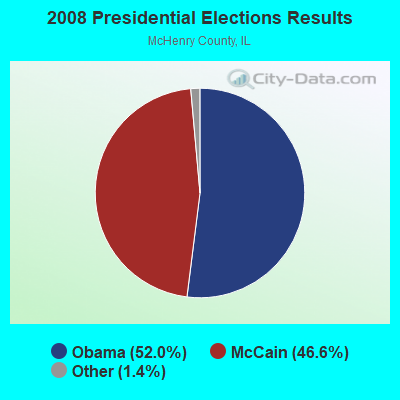
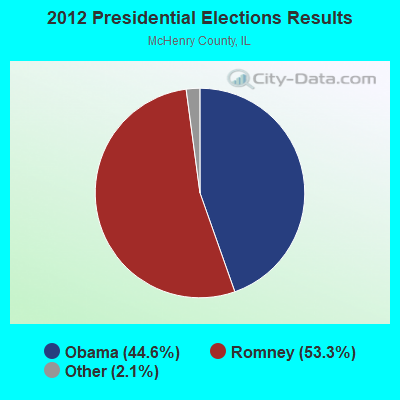
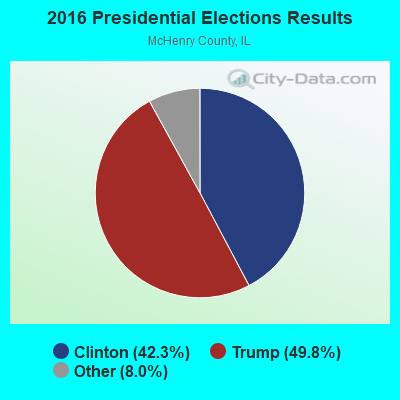
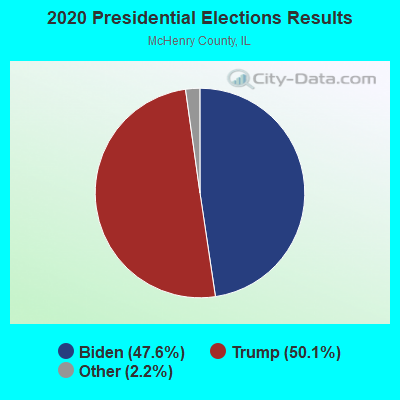
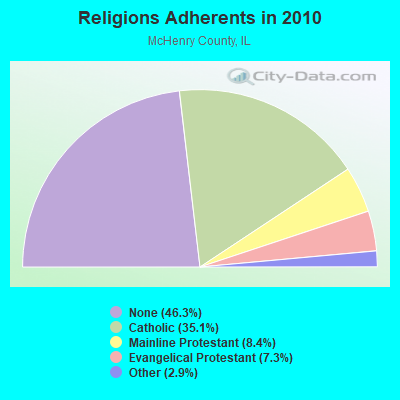
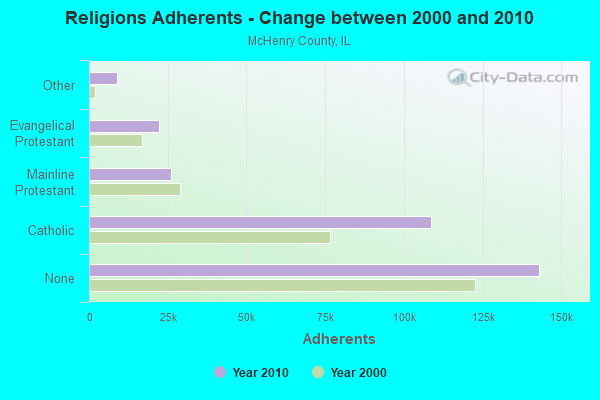
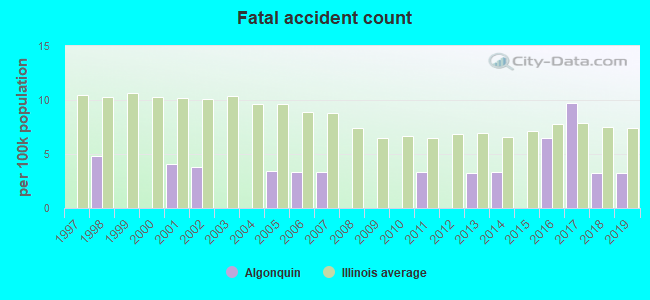
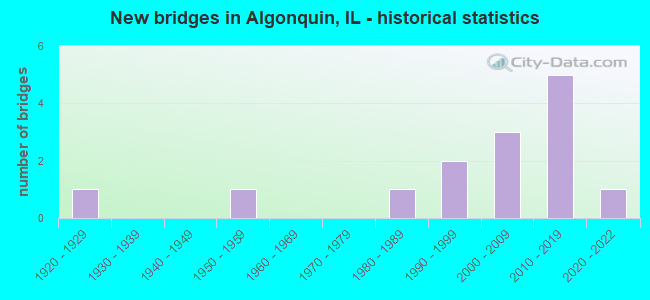
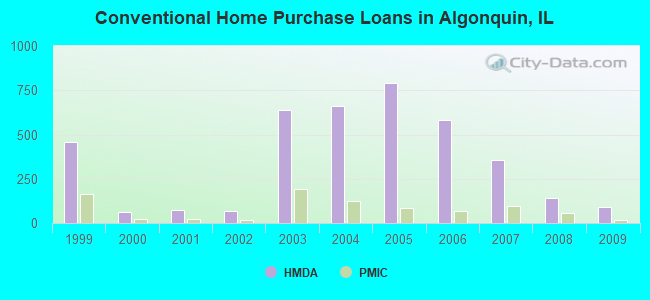
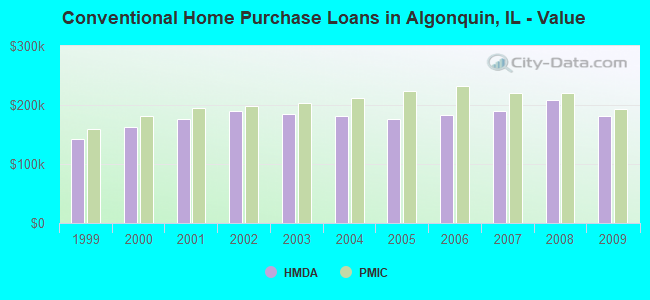
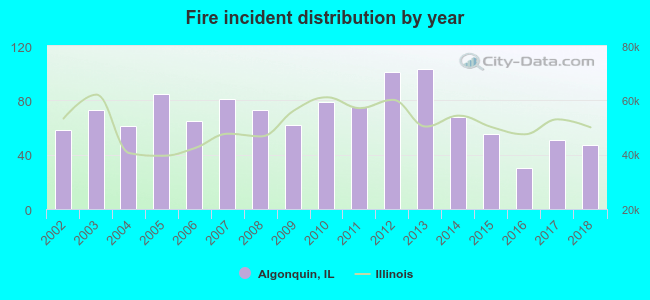 According to the data from the years 2002 - 2018 the average number of fires per year is 69. The highest number of reported fires - 103 took place in 2013, and the least - 30 in 2016. The data has a declining trend.
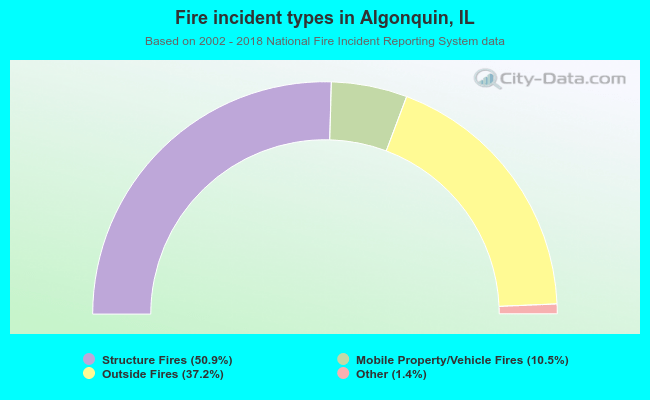 When looking into fire subcategories, the most reports belonged to: Structure Fires (50.9%), and Outside Fires (37.2%).