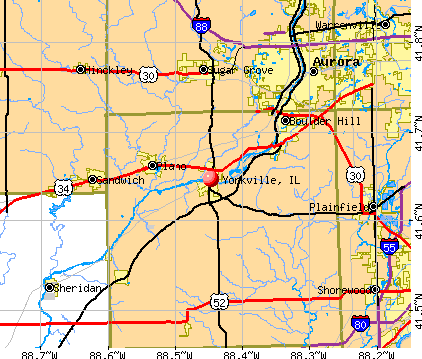
Yorkville, Illinois
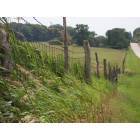
Yorkville: Fence in the Country Highpoint Road
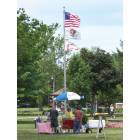
Yorkville: Hot Dog Stand in Town Square
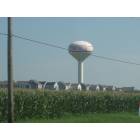
Yorkville: tower
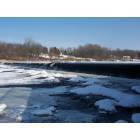
Yorkville: Fox River Dam at Riverfront Park

Yorkville: Yorkville IL, Bristol Bay
- add
your
Submit your own pictures of this city and show them to the world
- OSM Map
- General Map
- Google Map
- MSN Map
Population change since 2000: +285.1%
| Males: 11,363 | |
| Females: 12,472 |
| Median resident age: | 33.5 years |
| Illinois median age: | 39.1 years |
Zip codes: 60560.
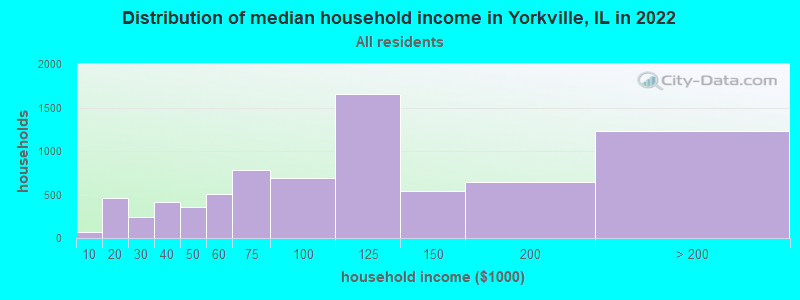
| Yorkville: | $100,459 |
| IL: | $76,708 |
Estimated per capita income in 2022: $41,840 (it was $24,514 in 2000)
Yorkville city income, earnings, and wages data
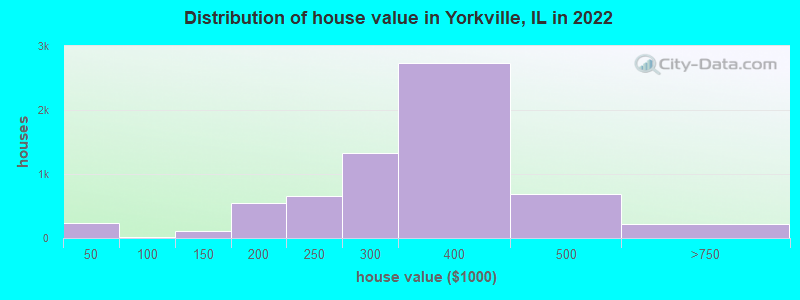
Estimated median house or condo value in 2022: $333,989 (it was $157,600 in 2000)
| Yorkville: | $333,989 |
| IL: | $251,600 |
Mean prices in 2022: all housing units: $300,064; detached houses: $321,597; townhouses or other attached units: $212,182; in 2-unit structures: $314,684; in 3-to-4-unit structures: $194,158; in 5-or-more-unit structures: $132,379; mobile homes: $32,523
Median gross rent in 2022: $1,284.
(1.1% for White Non-Hispanic residents, 31.8% for Black residents, 3.7% for Hispanic or Latino residents, 7.6% for other race residents, 6.1% for two or more races residents)
Detailed information about poverty and poor residents in Yorkville, IL


Compare current foreclosures in Yorkville, IL:
| Photo | Address | Area | Beds / Baths | Price | Details |
|---|---|---|---|---|---|

|
#1
Garritano St Unit B
Yorkville, IL 60560
|
1,551 sq. feet
|
2 baths 2 beds |
show details | |

|
#2
Phelps Ct
Yorkville, IL 60560
|
1,865 sq. feet
|
2 baths 3 beds |
show details | |

|
#3
Stoneridge Ct
Yorkville, IL 60560
|
- sq. feet
|
2 baths 3 beds |
show details | |

|
#4
E Ridge St
Yorkville, IL 60560
|
2,000 sq. feet
|
2 baths 3 beds |
show details | |

|
#5
W Barberry Cir
Yorkville, IL 60560
|
- sq. feet
|
2 baths 3 beds |
show details | |

|
#6
Tower Ln Apt A
Yorkville, IL 60560
|
- sq. feet
|
- baths - beds |
show details | |

|
#7
Justice Dr
Yorkville, IL 60560
|
- sq. feet
|
- baths - beds |
show details | |

|
#8
Mchugh Rd
Yorkville, IL 60560
|
- sq. feet
|
- baths - beds |
show details | |

|
#9
Bluebird Ln
Yorkville, IL 60560
|
- sq. feet
|
- baths - beds |
show details | |

|
#10
Fontana Dr
Yorkville, IL 60560
|
- sq. feet
|
- baths - beds |
show details |
| Photo | Address | Area | Beds / Baths | Price | Details |
|---|---|---|---|---|---|

|
#11
Market Place Dr Unit 4212
Yorkville, IL 60560
|
- sq. feet
|
- baths - beds |
show details | |

|
#12
Bertram Dr Unit G
Yorkville, IL 60560
|
- sq. feet
|
- baths - beds |
show details | |

|
#13
W Countryside Pkwy Apt D
Yorkville, IL 60560
|
- sq. feet
|
- baths - beds |
show details | |

|
#14
E Mill Brook Cir
Yorkville, IL 60560
|
- sq. feet
|
- baths - beds |
show details | |

|
#15
Sutton St
Yorkville, IL 60560
|
- sq. feet
|
- baths - beds |
show details | |

|
#16
Hawk Hollow Dr
Yorkville, IL 60560
|
- sq. feet
|
- baths - beds |
show details | |

|
#17
Bertram Dr
Yorkville, IL 60560
|
- sq. feet
|
- baths - beds |
show details | |

|
#18
Colonial Pkwy Unit C
Yorkville, IL 60560
|
- sq. feet
|
- baths - beds |
show details | |

|
#19
Olive Ln
Yorkville, IL 60560
|
- sq. feet
|
- baths - beds |
show details | |

|
#20
Hawk Hollow Dr
Yorkville, IL 60560
|
- sq. feet
|
- baths - beds |
show details |
| Photo | Address | Area | Beds / Baths | Price | Details |
|---|---|---|---|---|---|

|
#21
E Main St
Yorkville, IL 60560
|
- sq. feet
|
- baths - beds |
show details | |

|
#22
Hawk Hollow Dr
Yorkville, IL 60560
|
- sq. feet
|
- baths - beds |
show details | |

|
#23
Carolyn Ct
Yorkville, IL 60560
|
- sq. feet
|
- baths - beds |
show details | |

|
#24
Purcell St
Yorkville, IL 60560
|
- sq. feet
|
- baths - beds |
show details | |

|
#25
Appletree Ct Apt B
Yorkville, IL 60560
|
- sq. feet
|
- baths - beds |
show details | |

|
#26
Lauren Dr
Yorkville, IL 60560
|
- sq. feet
|
- baths - beds |
show details | |

|
#27
Camden Ln Unit D
Yorkville, IL 60560
|
- sq. feet
|
- baths - beds |
show details | |

|
#28
Hydraulic St
Yorkville, IL 60560
|
- sq. feet
|
- baths - beds |
show details | |

|
#29
Church St
Yorkville, IL 60560
|
- sq. feet
|
- baths - beds |
show details | |

|
#30
Mulhern Ct Apt 6
Yorkville, IL 60560
|
- sq. feet
|
- baths - beds |
show details |
| Photo | Address | Area | Beds / Baths | Price | Details |
|---|---|---|---|---|---|

|
#31
Walter St Apt A
Yorkville, IL 60560
|
- sq. feet
|
- baths - beds |
show details | |

|
#32
Portage Ln Unit D
Yorkville, IL 60560
|
- sq. feet
|
- baths - beds |
show details | |

|
#33
Fields Dr
Yorkville, IL 60560
|
- sq. feet
|
- baths - beds |
show details | |

|
#34
Muirfield Dr
Yorkville, IL 60560
|
- sq. feet
|
- baths - beds |
show details | |

|
#35
Marquette St
Yorkville, IL 60560
|
- sq. feet
|
- baths - beds |
show details | |

|
#36
Chicago Rd
Yorkville, IL 60560
|
- sq. feet
|
- baths - beds |
show details | |

|
#37
Kelly Ave
Yorkville, IL 60560
|
- sq. feet
|
- baths - beds |
show details | |

|
#38
Muirfield Dr
Yorkville, IL 60560
|
- sq. feet
|
- baths - beds |
show details | |

|
#39
Cryder Way
Yorkville, IL 60560
|
- sq. feet
|
- baths - beds |
show details | |

|
#40
Willow Way
Yorkville, IL 60560
|
- sq. feet
|
- baths - beds |
show details |
| Photo | Address | Area | Beds / Baths | Price | Details |
|---|---|---|---|---|---|

|
#41
Burning Bush Dr
Yorkville, IL 60560
|
- sq. feet
|
- baths - beds |
show details | |

|
#42
Orchid St
Yorkville, IL 60560
|
- sq. feet
|
- baths - beds |
show details | |

|
#43
Harrison St
Yorkville, IL 60560
|
- sq. feet
|
- baths - beds |
show details | |

|
#44
Coral Dr
Yorkville, IL 60560
|
- sq. feet
|
- baths - beds |
show details | |

|
#45
Walsh Dr
Yorkville, IL 60560
|
- sq. feet
|
- baths - beds |
show details | |

|
#46
Walsh Dr
Yorkville, IL 60560
|
- sq. feet
|
- baths - beds |
show details | |

|
#47
Kelly Ave
Yorkville, IL 60560
|
- sq. feet
|
- baths - beds |
show details | |

|
#48
Goldenrod Dr
Yorkville, IL 60560
|
- sq. feet
|
- baths - beds |
show details | |

|
#49
Homestead Dr
Yorkville, IL 60560
|
- sq. feet
|
- baths - beds |
show details | |

|
Check over 1 million property listings on Foreclosure.com!
|
browse all offers | |||


- 15,78771.8%White alone
- 3,50415.9%Hispanic
- 1,1785.4%Black alone
- 8443.8%Asian alone
- 3771.7%Two or more races
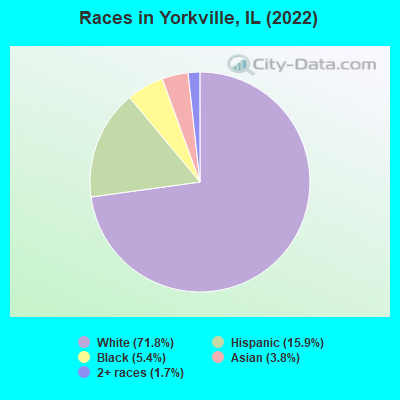
Races in Yorkville detailed stats: ancestries, foreign born residents, place of birth
According to our research of Illinois and other state lists, there were 16 registered sex offenders living in Yorkville, Illinois as of April 27, 2024.
The ratio of all residents to sex offenders in Yorkville is 1,148 to 1.
The ratio of registered sex offenders to all residents in this city is lower than the state average.
Type |
2010 |
2011 |
2012 |
2013 |
2014 |
2015 |
2016 |
2017 |
2018 |
2019 |
2020 |
2021 |
2022 |
|---|---|---|---|---|---|---|---|---|---|---|---|---|---|
| Murders (per 100,000) | 0 (0.0) | 0 (0.0) | 1 (5.8) | 0 (0.0) | 0 (0.0) | 0 (0.0) | 0 (0.0) | 0 (0.0) | 0 (0.0) | 0 (0.0) | 0 (0.0) | 0 (0.0) | 0 (0.0) |
| Rapes (per 100,000) | 3 (17.7) | 5 (29.5) | 13 (75.6) | 8 (45.3) | 5 (27.9) | 9 (49.0) | 4 (21.3) | 6 (31.3) | 8 (40.5) | 18 (87.6) | 8 (38.0) | 14 (64.7) | 13 (55.0) |
| Robberies (per 100,000) | 1 (5.9) | 4 (23.6) | 1 (5.8) | 0 (0.0) | 2 (11.2) | 3 (16.3) | 5 (26.7) | 1 (5.2) | 3 (15.2) | 5 (24.3) | 6 (28.5) | 3 (13.9) | 4 (16.9) |
| Assaults (per 100,000) | 14 (82.7) | 5 (29.5) | 7 (40.7) | 4 (22.7) | 2 (11.2) | 10 (54.4) | 4 (21.3) | 4 (20.9) | 7 (35.4) | 7 (34.1) | 6 (28.5) | 9 (41.6) | 5 (21.2) |
| Burglaries (per 100,000) | 50 (295.5) | 41 (241.6) | 32 (186.0) | 33 (186.9) | 23 (128.3) | 21 (114.3) | 28 (149.3) | 17 (88.7) | 17 (86.1) | 13 (63.3) | 6 (28.5) | 14 (64.7) | 5 (21.2) |
| Thefts (per 100,000) | 165 (975.1) | 206 (1,214) | 225 (1,308) | 170 (962.8) | 139 (775.3) | 135 (734.5) | 132 (703.9) | 143 (746.5) | 179 (906.3) | 125 (608.5) | 367 (1,743) | 91 (420.9) | 96 (406.2) |
| Auto thefts (per 100,000) | 2 (11.8) | 4 (23.6) | 1 (5.8) | 7 (39.6) | 7 (39.0) | 6 (32.6) | 11 (58.7) | 5 (26.1) | 5 (25.3) | 5 (24.3) | 5 (23.8) | 6 (27.7) | 4 (16.9) |
| Arson (per 100,000) | 3 (17.7) | 0 (0.0) | 1 (5.8) | 0 (0.0) | 1 (5.6) | 1 (5.4) | 1 (5.3) | 1 (5.2) | 2 (10.1) | 0 (0.0) | 2 (9.5) | 1 (4.6) | 2 (8.5) |
| City-Data.com crime index | 93.1 | 103.9 | 147.7 | 95.5 | 71.0 | 94.9 | 72.6 | 69.0 | 88.3 | 114.9 | 118.3 | 87.9 | 72.4 |
The City-Data.com crime index weighs serious crimes and violent crimes more heavily. Higher means more crime, U.S. average is 246.1. It adjusts for the number of visitors and daily workers commuting into cities.
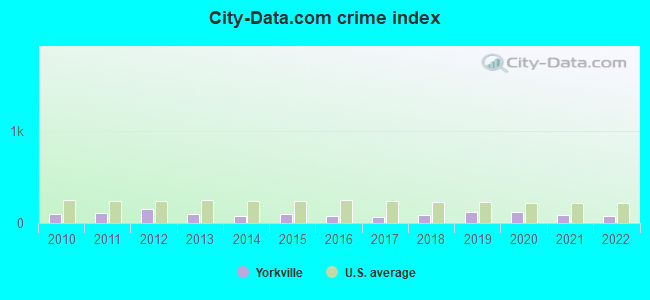
Crime rate in Yorkville detailed stats: murders, rapes, robberies, assaults, burglaries, thefts, arson
Full-time law enforcement employees in 2020, including police officers: 33 (30 officers - 29 male; 1 female).
| Officers per 1,000 residents here: | 1.43 |
| Illinois average: | 3.04 |
 Recent articles from our blog. Our writers, many of them Ph.D. graduates or candidates, create easy-to-read articles on a wide variety of topics.

 | Conservative Areas of Chicagoland (15 replies) |
| Talk to me about Aurora? (45 replies) |
| Plainfield - Thoughts (4 replies) |
| Maximizing Rural feel vs distance from city (19 replies) |
| Husband wants to move to South Burbs (39 replies) |
| Job in Morris, IL.... live in Shorewood? Plainfield? Or??? (13 replies) |
Latest news from Yorkville, IL collected exclusively by city-data.com from local newspapers, TV, and radio stations
Ancestries: German (22.4%), American (9.5%), Irish (9.0%), English (7.3%), Polish (6.0%), Italian (4.0%).
Current Local Time: CST time zone
Incorporated on 10/07/1873
Elevation: 630 feet
Land area: 7.04 square miles.
Population density: 3,384 people per square mile (average).
1,096 residents are foreign born (2.4% Latin America, 2.3% Asia).
| This city: | 5.0% |
| Illinois: | 14.1% |
Median real estate property taxes paid for housing units with mortgages in 2022: $8,169 (2.4%)
Median real estate property taxes paid for housing units with no mortgage in 2022: $7,987 (2.6%)
Nearest city with pop. 50,000+: Aurora, IL  (11.0 miles , pop. 142,990).
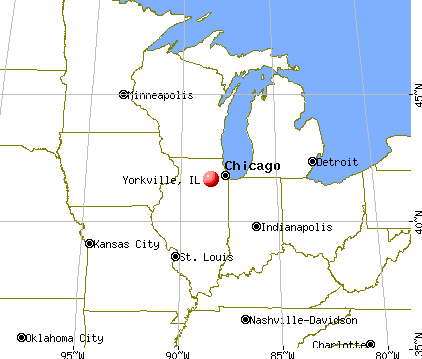
Nearest city with pop. 200,000+: Chicago, IL (41.8 miles , pop. 2,896,016).
Nearest cities:
), ), ), ), )Latitude: 41.65 N, Longitude: 88.45 W
Daytime population change due to commuting: -1,873 (-8.5%)
Workers who live and work in this city: 2,854 (25.8%)
Area code: 630
Yorkville, Illinois accommodation & food services, waste management - Economy and Business Data
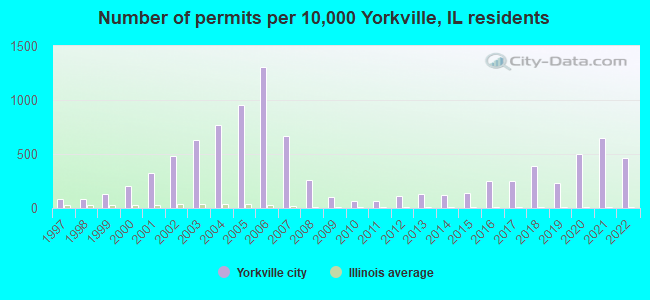
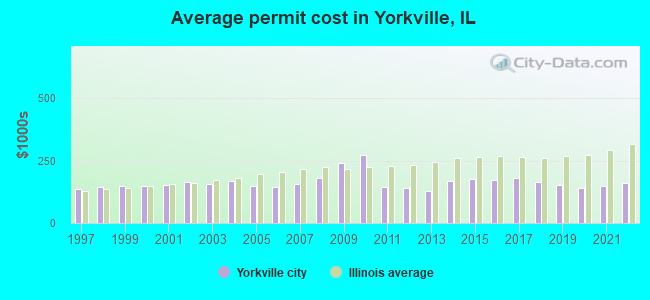
Single-family new house construction building permits:
- 2022: 284 buildings, average cost: $161,000
- 2021: 403 buildings, average cost: $146,600
- 2020: 308 buildings, average cost: $139,200
- 2019: 146 buildings, average cost: $151,100
- 2018: 243 buildings, average cost: $164,200
- 2017: 152 buildings, average cost: $182,300
- 2016: 154 buildings, average cost: $171,600
- 2015: 84 buildings, average cost: $177,000
- 2014: 74 buildings, average cost: $167,200
- 2013: 81 buildings, average cost: $130,000
- 2012: 67 buildings, average cost: $140,800
- 2011: 43 buildings, average cost: $144,300
- 2010: 42 buildings, average cost: $273,700
- 2009: 64 buildings, average cost: $240,800
- 2008: 158 buildings, average cost: $178,600
- 2007: 413 buildings, average cost: $155,400
- 2006: 809 buildings, average cost: $146,400
- 2005: 588 buildings, average cost: $147,100
- 2004: 474 buildings, average cost: $167,100
- 2003: 388 buildings, average cost: $156,500
- 2002: 299 buildings, average cost: $163,200
- 2001: 198 buildings, average cost: $151,400
- 2000: 127 buildings, average cost: $148,400
- 1999: 82 buildings, average cost: $150,100
- 1998: 50 buildings, average cost: $143,400
- 1997: 54 buildings, average cost: $137,600
| Here: | 3.5% |
| Illinois: | 4.2% |
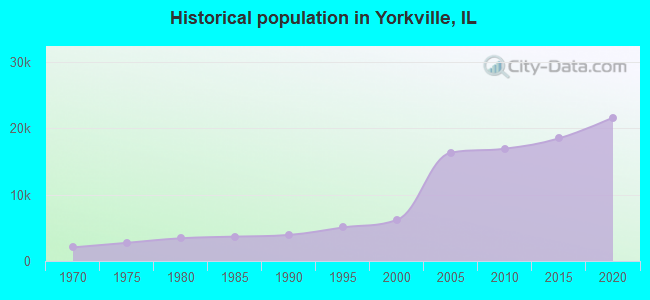
Population change in the 1990s: +2,122 (+52.2%).
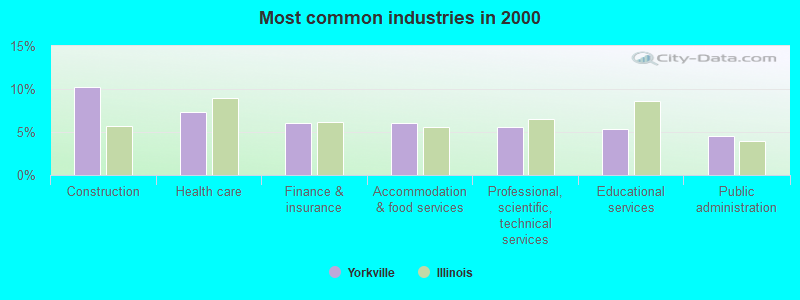
- Construction (10.2%)
- Health care (7.3%)
- Finance & insurance (6.1%)
- Accommodation & food services (6.0%)
- Professional, scientific, technical services (5.5%)
- Educational services (5.4%)
- Public administration (4.6%)
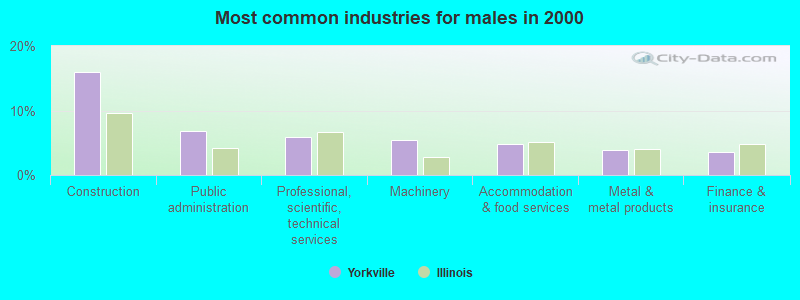
- Construction (15.9%)
- Public administration (6.9%)
- Professional, scientific, technical services (5.8%)
- Machinery (5.4%)
- Accommodation & food services (4.8%)
- Metal & metal products (3.9%)
- Finance & insurance (3.5%)
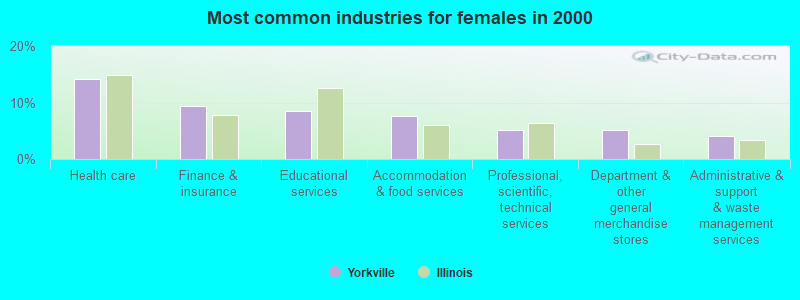
- Health care (14.1%)
- Finance & insurance (9.4%)
- Educational services (8.4%)
- Accommodation & food services (7.6%)
- Professional, scientific, technical services (5.2%)
- Department & other general merchandise stores (5.1%)
- Administrative & support & waste management services (4.0%)
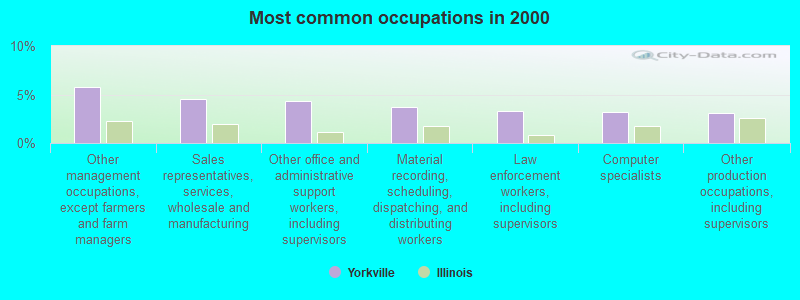
- Other management occupations, except farmers and farm managers (5.8%)
- Sales representatives, services, wholesale and manufacturing (4.5%)
- Other office and administrative support workers, including supervisors (4.4%)
- Material recording, scheduling, dispatching, and distributing workers (3.7%)
- Law enforcement workers, including supervisors (3.3%)
- Computer specialists (3.2%)
- Other production occupations, including supervisors (3.1%)
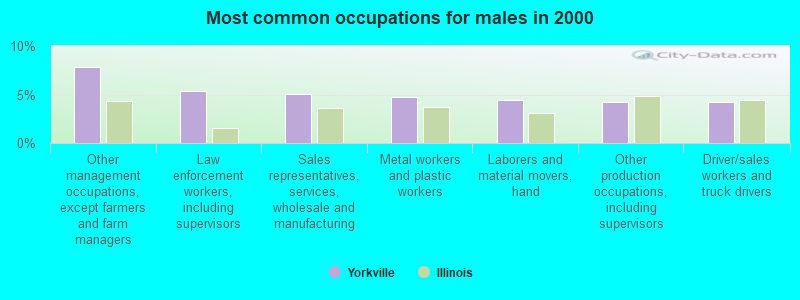
- Other management occupations, except farmers and farm managers (7.8%)
- Law enforcement workers, including supervisors (5.4%)
- Sales representatives, services, wholesale and manufacturing (5.1%)
- Metal workers and plastic workers (4.8%)
- Laborers and material movers, hand (4.5%)
- Other production occupations, including supervisors (4.2%)
- Driver/sales workers and truck drivers (4.2%)
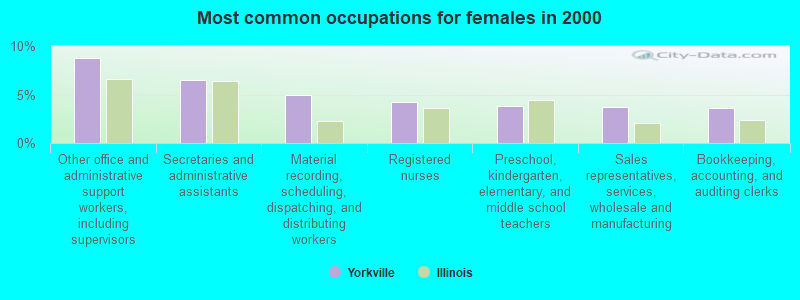
- Other office and administrative support workers, including supervisors (8.8%)
- Secretaries and administrative assistants (6.5%)
- Material recording, scheduling, dispatching, and distributing workers (5.0%)
- Registered nurses (4.2%)
- Preschool, kindergarten, elementary, and middle school teachers (3.8%)
- Sales representatives, services, wholesale and manufacturing (3.8%)
- Bookkeeping, accounting, and auditing clerks (3.6%)
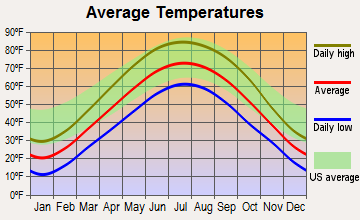
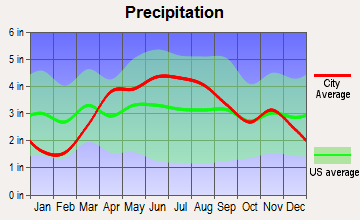
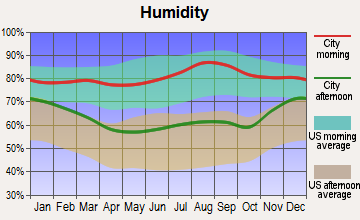
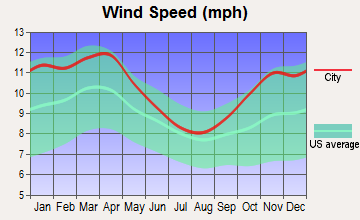
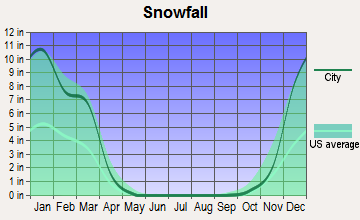
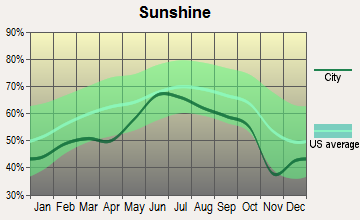
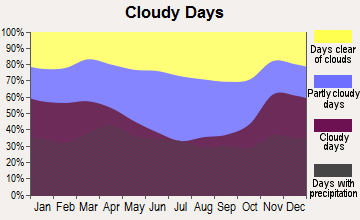
Average climate in Yorkville, Illinois
Based on data reported by over 4,000 weather stations
|
|

(lower is better)
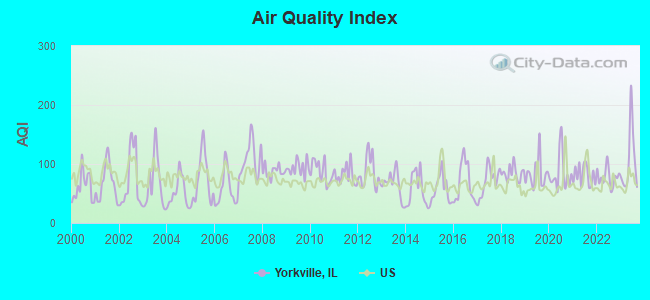
Air Quality Index (AQI) level in 2023 was 104. This is significantly worse than average.
| City: | 104 |
| U.S.: | 73 |
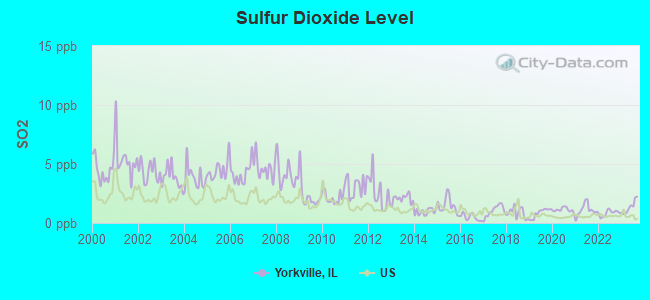
Sulfur Dioxide (SO2) [ppb] level in 2023 was 1.34. This is about average. Closest monitor was 17.0 miles away from the city center.
| City: | 1.34 |
| U.S.: | 1.51 |
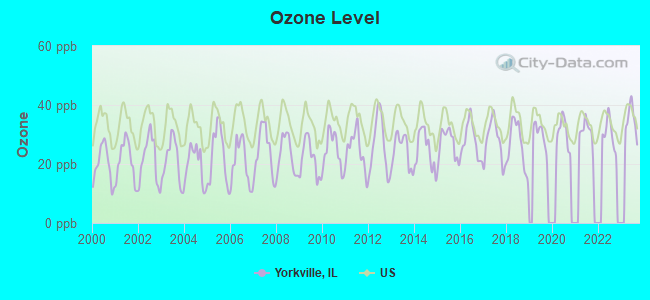
Ozone [ppb] level in 2023 was 35.0. This is about average. Closest monitor was 13.9 miles away from the city center.
| City: | 35.0 |
| U.S.: | 33.3 |
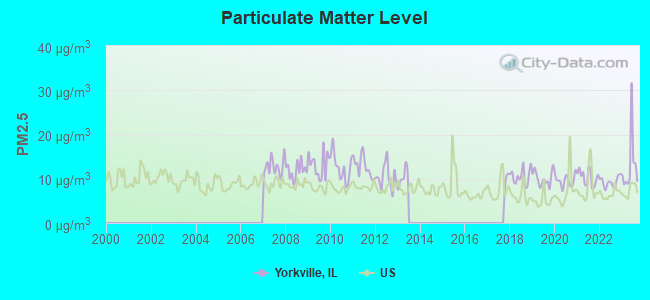
Particulate Matter (PM2.5) [µg/m3] level in 2023 was 12.9. This is significantly worse than average. Closest monitor was 11.3 miles away from the city center.
| City: | 12.9 |
| U.S.: | 8.1 |
Tornado activity:
Yorkville-area historical tornado activity is near Illinois state average. It is 56% greater than the overall U.S. average.
On 8/28/1990, a category F5 (max. wind speeds 261-318 mph) tornado 5.5 miles away from the Yorkville city center killed 29 people and injured 350 people and caused between $50,000 and $500,000 in damages.
On 6/13/1976, a category F4 (max. wind speeds 207-260 mph) tornado 23.1 miles away from the city center killed 2 people and injured 23 people and caused between $500,000 and $5,000,000 in damages.
Earthquake activity:
Yorkville-area historical earthquake activity is significantly above Illinois state average. It is 62% greater than the overall U.S. average.On 4/18/2008 at 09:36:59, a magnitude 5.4 (5.1 MB, 4.8 MS, 5.4 MW, 5.2 MW, Class: Moderate, Intensity: VI - VII) earthquake occurred 222.9 miles away from Yorkville center
On 6/10/1987 at 23:48:54, a magnitude 5.1 (4.9 MB, 4.4 MS, 4.6 MS, 5.1 LG) earthquake occurred 197.7 miles away from the city center
On 4/18/2008 at 09:36:59, a magnitude 5.2 (5.2 MW, Depth: 8.9 mi) earthquake occurred 223.0 miles away from Yorkville center
On 6/28/2004 at 06:10:52, a magnitude 4.2 (4.2 MW, Depth: 6.2 mi, Class: Light, Intensity: IV - V) earthquake occurred 26.8 miles away from Yorkville center
On 6/18/2002 at 17:37:15, a magnitude 5.0 (4.3 MB, 4.6 MW, 5.0 LG) earthquake occurred 255.6 miles away from Yorkville center
On 4/18/2008 at 15:14:16, a magnitude 4.8 (4.5 MB, 4.8 MW, 4.6 MW) earthquake occurred 221.6 miles away from Yorkville center
Magnitude types: regional Lg-wave magnitude (LG), body-wave magnitude (MB), surface-wave magnitude (MS), moment magnitude (MW)
Natural disasters:
The number of natural disasters in Kendall County (12) is smaller than the US average (15).Major Disasters (Presidential) Declared: 6
Emergencies Declared: 5
Causes of natural disasters: Floods: 5, Storms: 5, Snows: 2, Blizzard: 1, Hurricane: 1, Snowstorm: 1, Tornado: 1, Wind: 1, Winter Storm: 1, Other: 1 (Note: some incidents may be assigned to more than one category).
Hospitals and medical centers in Yorkville:
Heliports located in Yorkville:
Amtrak stations near Yorkville:
- 5 miles: PLANO (MAIN ST. WEST OF CENTER ST.)
- 19 miles: NAPERVILLE (E. 4TH & ELLSWORTH AVE.) . Services: ticket office, partially wheelchair accessible, enclosed waiting area, public restrooms, public payphones, free short-term parking, free long-term parking, call for taxi service, public transit connection.
Operable nuclear power plants near Yorkville:
- 20 miles: Dresden 2 and 3 in Morris, IL.
Colleges/universities with over 2000 students nearest to Yorkville:
- Aurora University (about 9 miles; Aurora, IL; Full-time enrollment: 4,596)
- Waubonsee Community College (about 11 miles; Sugar Grove, IL; FT enrollment: 7,698)
- Joliet Junior College (about 18 miles; Joliet, IL; FT enrollment: 11,401)
- North Central College (about 19 miles; Naperville, IL; FT enrollment: 2,860)
- Lewis University (about 20 miles; Romeoville, IL; FT enrollment: 5,739)
- University of St Francis (about 20 miles; Joliet, IL; FT enrollment: 2,454)
- Benedictine University (about 21 miles; Lisle, IL; FT enrollment: 5,694)
Public high schools in Yorkville:
- YORKVILLE HIGH SCHOOL (Students: 1,271, Location: 797 GAME FARM RD, Grades: 9-12)
- YEA PROGRAM (Location: 709 GAME FARM RD, Grades: 6-12)
Private high school in Yorkville:
Public elementary/middle schools in Yorkville:
- YORKVILLE MIDDLE SCHOOL (Students: 723, Location: 920 PRAIRIE CROSSING DR, Grades: 7-8)
- CIRCLE CENTER GRADE SCHOOL (Students: 639, Location: 901 MILL ST, Grades: PK-3)
- YORKVILLE INTERMEDIATE SCHOOL (Students: 568, Location: 103 E SCHOOLHOUSE RD, Grades: PK-6)
- GRANDE RESERVE ELEM SCH (Students: 560, Location: 3142 GRANDE TRL, Grades: KG-6)
- BRISTOL BAY ELEM SCH (Students: 495, Location: 427 BRISTOL BAY DR, Grades: KG-6)
- YORKVILLE GRADE SCHOOL (Students: 230, Location: 201 W SOMONAUK ST, Grades: KG-3)
- AUTUMN CREEK ELEM SCH (Location: 2377 AUTUMN CREEK BLVD, Grades: KG-6)
Private elementary/middle school in Yorkville:
User-submitted facts and corrections:
- New (2005) private Preschool/Elementary school is Peaceful Pathways Montessori Academy
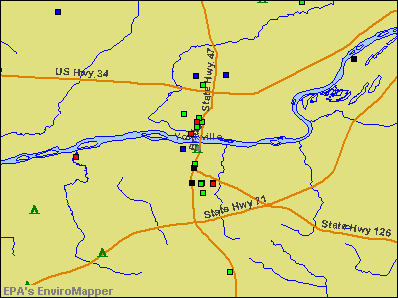
Points of interest:
Notable locations in Yorkville: Fox Industrial Park (A), Yorkville Public Library (B), Beecher Community Building (C), Kendall County Courthouse (D), Bristol - Kendall Fire Protection District Station 1 (E). Display/hide their locations on the map
Shopping Center: Countryside Center Shopping Center (1). Display/hide its location on the map
Churches in Yorkville include: Bible Baptist Church (A), Saint Patricks Parish Center (B), Yorkville Baptist Church (C), Yorkville Congregational Church (D), Yorkville United Methodist Church (E). Display/hide their locations on the map
Cemetery: Elmwood Cemetery (1). Display/hide its location on the map
Creek: Blackberry Creek (A). Display/hide its location on the map
Park in Yorkville: Yorkville City Park (1). Display/hide its location on the map
Hotel: Edwards Hospital (106 East Countryside Parkway).
Birthplace of: Mike Radja - Ice hockey forward, Trevor McCumby - Boxer.
Drinking water stations with addresses in Yorkville and their reported violations in the past:
JUMPIN JAVA (Population served: 210, Groundwater):Past monitoring violations:WHITETAIL GOLF CLUB (Population served: 100, Groundwater):
- One regular monitoring violation
Past monitoring violations:P N A YOUTH CAMP ASSN (Population served: 100, Groundwater):
- 2 regular monitoring violations
Past monitoring violations:RICHARD YOUNG FOREST PRESERVE (Population served: 25, Groundwater):
- 3 routine major monitoring violations
- One regular monitoring violation
Past monitoring violations:
- One regular monitoring violation
Drinking water stations with addresses in Yorkville that have no violations reported:
- SHOWBOAT THEATRES (Serves WI, Population served: 592, Primary Water Source Type: Groundwater)
- KENDALL COUNTY FAIR ASSOCIATION (Population served: 200, Primary Water Source Type: Groundwater)
- SUZYS PIZZA (Population served: 60, Primary Water Source Type: Groundwater)
- HARRIS FOREST PRESERVE (Population served: 25, Primary Water Source Type: Groundwater)
| This city: | 2.8 people |
| Illinois: | 2.6 people |
| This city: | 74.2% |
| Whole state: | 65.8% |
| This city: | 7.2% |
| Whole state: | 6.3% |
Likely homosexual households (counted as self-reported same-sex unmarried-partner households)
- Lesbian couples: 0.4% of all households
- Gay men: 0.1% of all households
People in group quarters in Yorkville in 2010:
- 65 people in nursing facilities/skilled-nursing facilities
- 61 people in local jails and other municipal confinement facilities
- 16 people in group homes intended for adults
Banks with most branches in Yorkville (2011 data):
- First National Bank of Omaha: Yorkville Mobile Branch at 109 West Veterans Parkway, branch established on 2006/08/15; Yorkville Branch at 109 West Veterans Parkway, branch established on 1914/02/21. Info updated 2010/10/13: Bank assets: $13,433.1 mil, Deposits: $10,746.6 mil, headquarters in Omaha, NE, positive income, Commercial Lending Specialization, 102 total offices, Holding Company: Lauritzen Corporation
- Fifth Third Bank: Yorkville Banking Center Branch at 444 E. Veterans Parkway, branch established on 2005/08/15. Info updated 2009/10/05: Bank assets: $114,540.4 mil, Deposits: $89,689.1 mil, headquarters in Cincinnati, OH, positive income, Commercial Lending Specialization, 1378 total offices, Holding Company: Fifth Third Bancorp
- TCF National Bank: Yorkville Branch at 234 E. Veterans Parkway, branch established on 2002/04/17. Info updated 2009/11/23: Bank assets: $19,007.0 mil, Deposits: $12,377.0 mil, headquarters in Sioux Falls, SD, positive income, Commercial Lending Specialization, 441 total offices, Holding Company: Tcf Financial Corporation
- State Bank of Illinois: Yorkville Branch at 28 East Schoolhouse Road, branch established on 2007/05/09. Info updated 2006/11/03: Bank assets: $185.5 mil, Deposits: $166.7 mil, headquarters in West Chicago, IL, negative income in the last year, Commercial Lending Specialization, 4 total offices, Holding Company: F.N.b.c. Of La Grange, Inc.
- Centrue Bank: Yorkville Branch at 208 East Veteran's Parkway, branch established on 2003/12/10. Info updated 2007/06/27: Bank assets: $964.9 mil, Deposits: $850.6 mil, headquarters in Streator, IL, negative income in the last year, Commercial Lending Specialization, 28 total offices, Holding Company: Centrue Financial Corporation
- Old Second National Bank: Countryside Branch at 26 West Countryside Parkway, branch established on 1988/09/15. Info updated 2008/03/03: Bank assets: $1,939.3 mil, Deposits: $1,741.1 mil, headquarters in Aurora, IL, positive income, Commercial Lending Specialization, 27 total offices, Holding Company: Old Second Bancorp, Inc.
- The First National Bank of Ottawa: First National Bank-Yorkville Branch at 1459 Cannonball Trail, branch established on 2005/05/13. Info updated 2006/11/03: Bank assets: $270.5 mil, Deposits: $242.3 mil, headquarters in Ottawa, IL, positive income, 8 total offices, Holding Company: First Ottawa Bancshares, Inc.
- West Suburban Bank: Yorkville Branch at 10 Saravanos, branch established on 2006/06/23. Info updated 2011/02/23: Bank assets: $1,927.7 mil, Deposits: $1,744.7 mil, headquarters in Lombard, IL, positive income, Commercial Lending Specialization, 44 total offices, Holding Company: West Suburban Bancorp, Inc.
- THE National Bank: Yorkville Branch at 2611 North Bridge Street, branch established on 2008/04/01. Info updated 2009/01/28: Bank assets: $1,088.2 mil, Deposits: $914.5 mil, headquarters in Moline, IL, positive income, Commercial Lending Specialization, 29 total offices, Holding Company: National Bancshares, Inc.
For population 15 years and over in Yorkville:
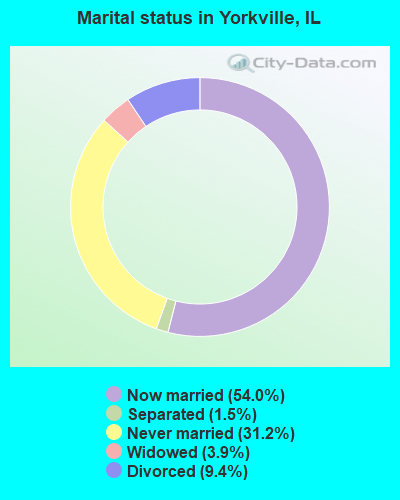
- Never married: 31.2%
- Now married: 54.0%
- Separated: 1.5%
- Widowed: 3.9%
- Divorced: 9.4%
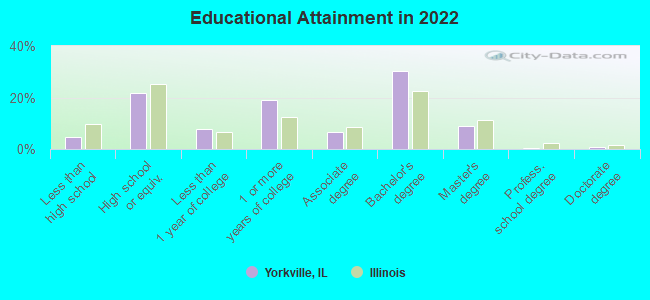
For population 25 years and over in Yorkville:
- High school or higher: 96.1%
- Bachelor's degree or higher: 39.8%
- Graduate or professional degree: 9.8%
- Unemployed: 1.9%
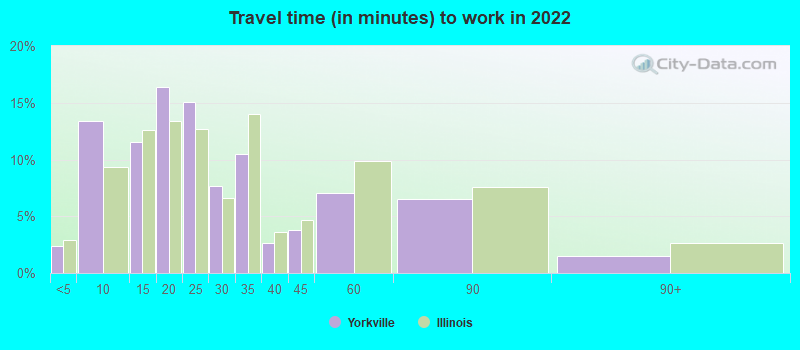
- Mean travel time to work (commute): 31.2 minutes

| Here: | 9.3 |
| Illinois average: | 12.5 |
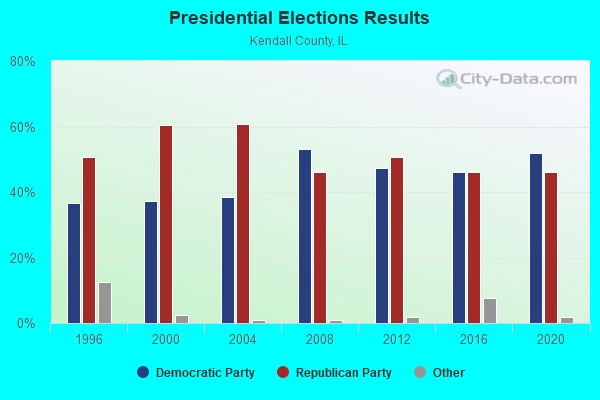
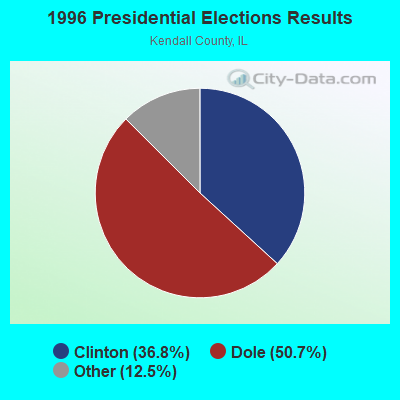
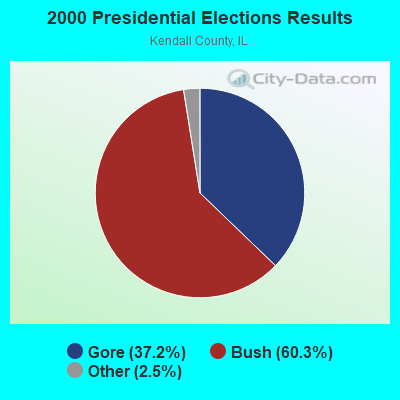
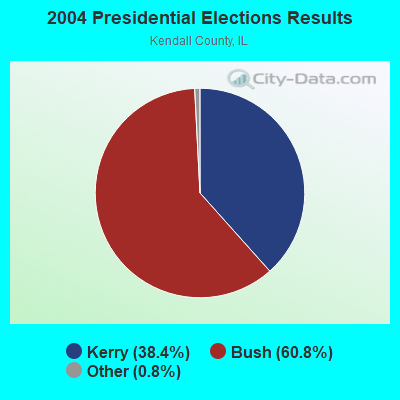
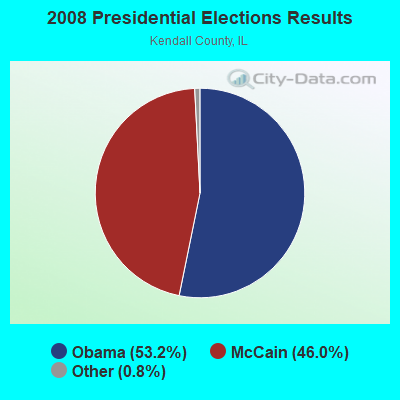
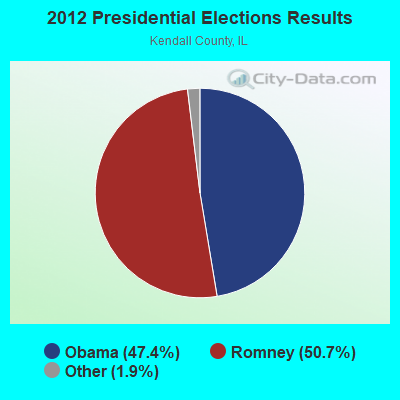
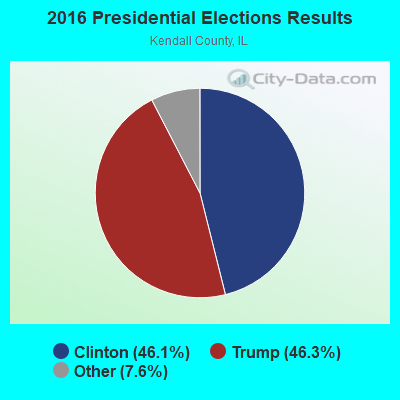
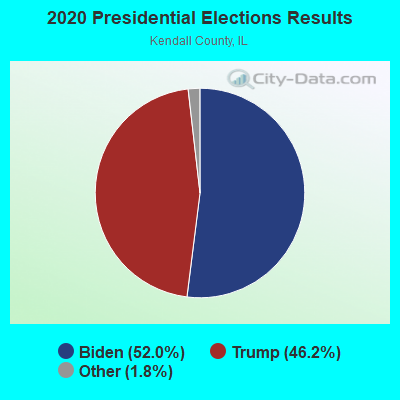
Graphs represent county-level data. Detailed 2008 Election Results
Religion statistics for Yorkville, IL (based on Kendall County data)
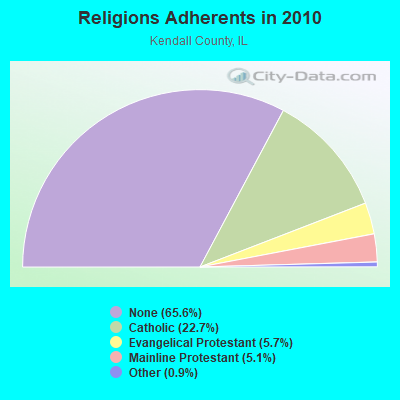
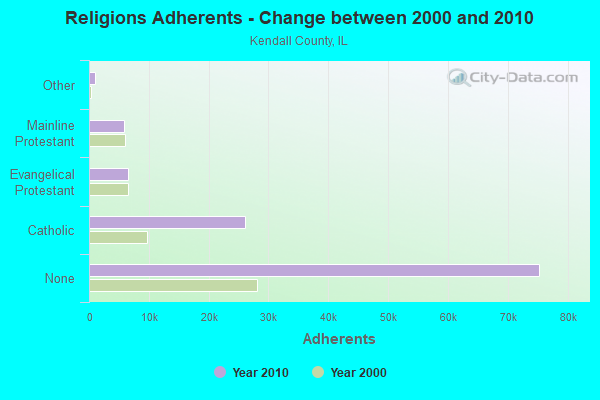
| Religion | Adherents | Congregations |
|---|---|---|
| Catholic | 26,089 | 4 |
| Evangelical Protestant | 6,500 | 31 |
| Mainline Protestant | 5,805 | 16 |
| Other | 1,054 | 4 |
| Orthodox | - | - |
| None | 75,288 | - |
Food Environment Statistics:
| Here: | 0.93 / 10,000 pop. |
| Illinois: | 2.24 / 10,000 pop. |
| This county: | 0.21 / 10,000 pop. |
| Illinois: | 0.08 / 10,000 pop. |
| Kendall County: | 0.21 / 10,000 pop. |
| Illinois: | 0.75 / 10,000 pop. |
| Kendall County: | 1.45 / 10,000 pop. |
| Illinois: | 2.61 / 10,000 pop. |
| This county: | 4.97 / 10,000 pop. |
| Illinois: | 6.86 / 10,000 pop. |
| Here: | 6.5% |
| Illinois: | 8.3% |
| Kendall County: | 25.4% |
| State: | 25.2% |
| Kendall County: | 13.2% |
| Illinois: | 14.5% |
Health and Nutrition:
| Yorkville: | 53.4% |
| Illinois: | 49.5% |
| Yorkville: | 53.2% |
| Illinois: | 47.2% |
| Yorkville: | 28.0 |
| State: | 28.6 |
| This city: | 20.4% |
| Illinois: | 20.5% |
| This city: | 8.0% |
| Illinois: | 10.8% |
| Yorkville: | 6.9 |
| State: | 6.8 |
| This city: | 31.7% |
| Illinois: | 33.4% |
| Yorkville: | 61.6% |
| Illinois: | 56.4% |
| Yorkville: | 81.5% |
| Illinois: | 79.9% |
More about Health and Nutrition of Yorkville, IL Residents
| Local government employment and payroll (March 2022) | |||||
| Function | Full-time employees | Monthly full-time payroll | Average yearly full-time wage | Part-time employees | Monthly part-time payroll |
|---|---|---|---|---|---|
| Police Protection - Officers | 37 | $290,382 | $94,178 | 3 | $800 |
| Parks and Recreation | 16 | $88,483 | $66,362 | 22 | $24,223 |
| Water Supply | 6 | $33,844 | $67,688 | 0 | $0 |
| Streets and Highways | 6 | $37,073 | $74,146 | 0 | $0 |
| Other Government Administration | 6 | $63,339 | $126,678 | 1 | $418 |
| Local Libraries | 5 | $23,750 | $57,000 | 21 | $15,099 |
| Other and Unallocable | 5 | $42,132 | $101,117 | 16 | $21,880 |
| Financial Administration | 5 | $35,831 | $85,994 | 0 | $0 |
| Sewerage | 4 | $21,122 | $63,366 | 0 | $0 |
| Police - Other | 4 | $17,023 | $51,069 | 10 | $8,059 |
| Totals for Government | 94 | $652,981 | $83,359 | 73 | $70,479 |
Yorkville government finances - Expenditure in 2021 (per resident):
- Construction - Central Staff Services: $5,648,000 ($236.96)
Water Utilities: $310,000 ($13.01)
Sewerage: $119,000 ($4.99)
General - Other: $1,000 ($0.04)
- Current Operations - Police Protection: $5,686,000 ($238.56)
Central Staff Services: $4,707,000 ($197.48)
Regular Highways: $2,990,000 ($125.45)
Parks and Recreation: $2,479,000 ($104.01)
Water Utilities: $1,994,000 ($83.66)
General - Other: $924,000 ($38.77)
Libraries: $799,000 ($33.52)
Sewerage: $676,000 ($28.36)
Financial Administration: $513,000 ($21.52)
- General - Interest on Debt: $1,264,000 ($53.03)
- Other Capital Outlay - Central Staff Services: $2,386,000 ($100.10)
Water Utilities: $741,000 ($31.09)
Sewerage: $570,000 ($23.91)
- Total Salaries and Wages: $7,055,000 ($295.99)
Yorkville government finances - Revenue in 2021 (per resident):
- Charges - Other: $3,231,000 ($135.56)
Solid Waste Management: $1,528,000 ($64.11)
Sewerage: $1,425,000 ($59.79)
Parks and Recreation: $363,000 ($15.23)
- Federal Intergovernmental - Other: $1,549,000 ($64.99)
- Local Intergovernmental - Other: $33,000 ($1.38)
- Miscellaneous - General Revenue - Other: $446,000 ($18.71)
Fines and Forfeits: $117,000 ($4.91)
Interest Earnings: $17,000 ($0.71)
- Revenue - Water Utilities: $4,373,000 ($183.47)
- State Intergovernmental - General Local Government Support: $6,244,000 ($261.97)
Highways: $1,387,000 ($58.19)
Other: $87,000 ($3.65)
- Tax - Property: $5,196,000 ($218.00)
General Sales and Gross Receipts: $2,725,000 ($114.33)
Other Selective Sales: $2,073,000 ($86.97)
Other License: $1,475,000 ($61.88)
Public Utilities Sales: $1,010,000 ($42.37)
Yorkville government finances - Debt in 2021 (per resident):
- Long Term Debt - Beginning Outstanding - Unspecified Public Purpose: $39,957,000 ($1676.40)
Outstanding Unspecified Public Purpose: $35,201,000 ($1476.86)
Retired Unspecified Public Purpose: $7,873,000 ($330.31)
Issue, Unspecified Public Purpose: $3,117,000 ($130.77)
Yorkville government finances - Cash and Securities in 2021 (per resident):
- Other Funds - Cash and Securities: $14,787,000 ($620.39)
| Businesses in Yorkville, IL | ||||
| Name | Count | Name | Count | |
|---|---|---|---|---|
| 7-Eleven | 1 | Maurices | 1 | |
| ALDI | 1 | McDonald's | 2 | |
| Ace Hardware | 1 | Menards | 1 | |
| Advance Auto Parts | 1 | New Balance | 1 | |
| AutoZone | 1 | Nike | 3 | |
| Baskin-Robbins | 1 | OfficeMax | 1 | |
| Blockbuster | 1 | Panera Bread | 1 | |
| Burger King | 1 | Penske | 1 | |
| Circle K | 2 | PetSmart | 1 | |
| Curves | 1 | Pizza Hut | 1 | |
| Decora Cabinetry | 1 | Quiznos | 1 | |
| Domino's Pizza | 1 | RadioShack | 1 | |
| Dunkin Donuts | 1 | SAS Shoes | 1 | |
| Famous Footwear | 1 | Sprint Nextel | 1 | |
| FedEx | 2 | Starbucks | 1 | |
| GNC | 1 | Subway | 2 | |
| H&R Block | 1 | Super 8 | 1 | |
| Hilton | 1 | T-Mobile | 1 | |
| Home Depot | 1 | Taco Bell | 1 | |
| Jewel-Osco | 1 | Target | 1 | |
| Jimmy John's | 1 | U-Haul | 2 | |
| KFC | 1 | U.S. Cellular | 1 | |
| Kohl's | 1 | UPS | 3 | |
| Marshalls | 1 | Walgreens | 2 | |
| MasterBrand Cabinets | 4 | Wendy's | 1 | |
Strongest AM radio stations in Yorkville:
- WAUR (930 AM; 4 kW; SANDWICH, IL; Owner: CHRISTIAN BROADCASTING SYSTEM, LTD.)
- WSCR (670 AM; 50 kW; CHICAGO, IL; Owner: INFINITY BROADCASTING OPERATIONS, INC.)
- WYLL (1160 AM; 50 kW; CHICAGO, IL; Owner: SCA LICENSE CORPORATION)
- WMVP (1000 AM; 50 kW; CHICAGO, IL; Owner: ABC, INC.)
- WGN (720 AM; 50 kW; CHICAGO, IL; Owner: WGN CONTINENTAL BROADCASTING CO.)
- WBBM (780 AM; 50 kW; CHICAGO, IL; Owner: INFINITY BROADCASTING OPERATIONS, INC.)
- WLS (890 AM; 50 kW; CHICAGO, IL; Owner: WLS, INC.)
- WTMJ (620 AM; 50 kW; MILWAUKEE, WI; Owner: JOURNAL BROADCAST CORPORATION)
- WVIV (1200 AM; 20 kW; CHICAGO, IL; Owner: WLXX-AM LICENSE CORP.)
- WISN (1130 AM; 50 kW; MILWAUKEE, WI; Owner: CAPSTAR TX LIMITED PARTNERSHIP)
- WMBI (1110 AM; daytime; 5 kW; CHICAGO, IL; Owner: THE MOODY BIBLE INSTITUTE OF CHICAGO)
- WBIG (1280 AM; 1 kW; AURORA, IL; Owner: BIG BROADCASTING COMAPNY, INC.)
- WCSN (820 AM; 5 kW; CHICAGO, IL; Owner: WYPA, INC.)
Strongest FM radio stations in Yorkville:
- WSPY-FM (107.1 FM; PLANO, IL; Owner: NELSON ENTERPRISES, INC.)
- WERV-FM (95.9 FM; AURORA, IL; Owner: NM LICENSING, LLC)
- WJCH (91.9 FM; JOLIET, IL; Owner: FAMILY STATIONS, INC.)
- WCKG (105.9 FM; ELMWOOD PARK, IL; Owner: INFINITY HOLDINGS CORPORATION OF ORLANDO)
- WLIT-FM (93.9 FM; CHICAGO, IL; Owner: AMFM RADIO LICENSES, L.L.C.)
- WJMK (104.3 FM; CHICAGO, IL; Owner: INFINITY BROADCASTING CORP. OF ILLINOIS)
- WNUA (95.5 FM; CHICAGO, IL; Owner: AMFM RADIO LICENSES, L.L.C.)
- WTMX (101.9 FM; SKOKIE, IL; Owner: BONNEVILLE HOLDING COMPANY)
- WBBM-FM (96.3 FM; CHICAGO, IL; Owner: INFINITY BROADCASTING OPERATIONS, INC.)
- WKSC-FM (103.5 FM; CHICAGO, IL; Owner: AMFM RADIO LICENSES, L.L.C.)
- WGCI-FM (107.5 FM; CHICAGO, IL; Owner: AMFM RADIO LICENSES, L.L.C.)
- WFMT (98.7 FM; CHICAGO, IL; Owner: WINDOW TO THE WORLD COMMUNICATIONS)
- WLEY-FM (107.9 FM; AURORA, IL; Owner: WLEY LICENSING, INC.)
- WZZN (94.7 FM; CHICAGO, IL; Owner: ABC CHICAGO FM RADIO,INC.)
- WCCQ (98.3 FM; CREST HILL, IL; Owner: THREE EAGLES OF JOLIET, INC.)
- WBEZ (91.5 FM; CHICAGO, IL; Owner: THE WBEZ ALLIANCE, INC.)
- WKQX (101.1 FM; CHICAGO, IL; Owner: EMMIS RADIO LICENSE CORPORATION)
- WLUP-FM (97.9 FM; CHICAGO, IL; Owner: BONNEVILLE HOLDING COMPANY)
- WNND (100.3 FM; CHICAGO, IL; Owner: BONNEVILLE HOLDING COMPANY)
- WOJO (105.1 FM; EVANSTON, IL; Owner: TICHENOR LICENSE CORPORATION ("TLC"))
TV broadcast stations around Yorkville:
- WSPY-LP (Channel 30; PLANO, IL; Owner: WSPY-TV, INC.)
- WLS-TV (Channel 7; CHICAGO, IL; Owner: WLS TELEVISION, INC.)
- WMAQ-TV (Channel 5; CHICAGO, IL; Owner: NBC SUBSIDIARY (WMAQ-TV), INC.)
- WTTW (Channel 11; CHICAGO, IL; Owner: WINDOW TO THE WORLD COMMUNICATIONS, INC.)
- WGN-TV (Channel 9; CHICAGO, IL; Owner: WGN CONTINENTAL BROADCASTING COMPANY)
- W24AJ (Channel 24; AURORA, IL; Owner: NELSON TV, INC.)
- WGBO-TV (Channel 66; JOLIET, IL; Owner: WGBO LICENSE PARTNERSHIP, G.P.)
- WBBM-TV (Channel 2; CHICAGO, IL; Owner: CBS BROADCASTING INC.)
- WWTO-TV (Channel 35; LASALLE, IL; Owner: TRINITY BROADCASTING NETWORK)
- W34CK (Channel 34; ARLINGTON HEIGHTS, IL; Owner: FIRST UNITED, INC.)
- WPWR-TV (Channel 50; GARY, IN; Owner: FOX TELEVISION STATIONS, INC.)
- WXFT (Channel 60; AURORA, IL; Owner: TELEFUTURA CHICAGO LLC)
- WCIU-TV (Channel 26; CHICAGO, IL; Owner: WCIU-TV LIMITED PARTNERSHIP)
- WCPX (Channel 38; CHICAGO, IL; Owner: PAXSON CHICAGO LICENSE, INC.)
- WFLD (Channel 32; CHICAGO, IL; Owner: FOX TELEVISION STATIONS, INC.)
- W68DO (Channel 68; PALATINE, IL; Owner: TRINITY BROADCASTING NETWORK)
- WFBT-CA (Channel 23; CHICAGO, IL; Owner: CHANNEL 23 LIMITED PARTNERSHIP)
- WSNS-TV (Channel 44; CHICAGO, IL; Owner: TELEMUNDO OF CHICAGO, INC.)
- WJYS (Channel 62; HAMMOND, IN; Owner: JOVON BROADCASTING CORPORATION)
- W54BE (Channel 54; SUGAR GROVE, IL; Owner: WAUBONSEE COMMUNITY COLLEGE)
- WOCH-LP (Channel 28; CHICAGO, IL; Owner: KM LPTV OF CHICAGO-28, L.L.C.)
- WYCC (Channel 20; CHICAGO, IL; Owner: COLLEGE DIST. #508, COUNTY OF COOK)
- WOCK-CA (Channel 13; CHICAGO, IL; Owner: KM LPTV OF CHICAGO-13, L.L.C.)
- W57DN (Channel 57; ELGIN, IL; Owner: TRINITY BROADCASTING NETWORK)
- National Bridge Inventory (NBI) Statistics
- 20Number of bridges
- 184ft / 55.6mTotal length
- $123,000Total costs
- 147,425Total average daily traffic
- 15,579Total average daily truck traffic
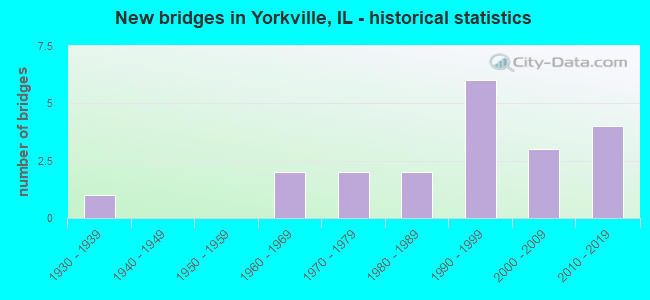
- New bridges - historical statistics
- 11930-1939
- 21960-1969
- 21970-1979
- 21980-1989
- 61990-1999
- 32000-2009
- 42010-2019
FCC Registered Antenna Towers: 137 (See the full list of FCC Registered Antenna Towers)
FCC Registered Commercial Land Mobile Towers: 1 (See the full list of FCC Registered Commercial Land Mobile Towers in Yorkville, IL)
FCC Registered Private Land Mobile Towers: 1 (See the full list of FCC Registered Private Land Mobile Towers)
FCC Registered Broadcast Land Mobile Towers: 12 (See the full list of FCC Registered Broadcast Land Mobile Towers)
FCC Registered Microwave Towers: 28 (See the full list of FCC Registered Microwave Towers in this town)
FCC Registered Paging Towers: 2 (See the full list of FCC Registered Paging Towers)
FCC Registered Amateur Radio Licenses: 80 (See the full list of FCC Registered Amateur Radio Licenses in Yorkville)
FAA Registered Aircraft Manufacturers and Dealers: 2 (See the full list of FAA Registered Manufacturers and Dealers in Yorkville)
FAA Registered Aircraft: 16 (See the full list of FAA Registered Aircraft)
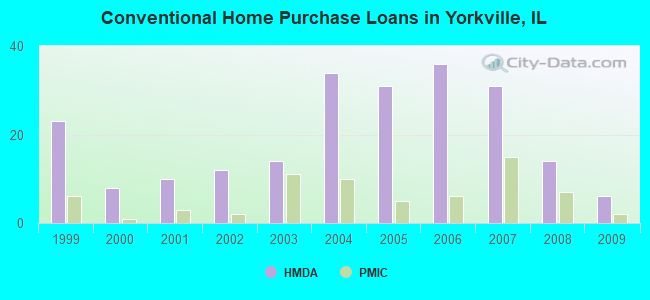
| Home Mortgage Disclosure Act Aggregated Statistics For Year 2009 (Based on 3 partial tracts) | ||||||||||
| A) FHA, FSA/RHS & VA Home Purchase Loans | B) Conventional Home Purchase Loans | C) Refinancings | D) Home Improvement Loans | F) Non-occupant Loans on < 5 Family Dwellings (A B C & D) | ||||||
|---|---|---|---|---|---|---|---|---|---|---|
| Number | Average Value | Number | Average Value | Number | Average Value | Number | Average Value | Number | Average Value | |
| LOANS ORIGINATED | 12 | $197,056 | 6 | $178,107 | 48 | $206,066 | 0 | $0 | 1 | $163,830 |
| APPLICATIONS APPROVED, NOT ACCEPTED | 1 | $225,660 | 0 | $0 | 4 | $206,870 | 0 | $0 | 0 | $0 |
| APPLICATIONS DENIED | 2 | $159,850 | 1 | $148,470 | 14 | $228,445 | 1 | $17,580 | 0 | $0 |
| APPLICATIONS WITHDRAWN | 1 | $290,570 | 1 | $169,870 | 8 | $232,354 | 0 | $0 | 0 | $0 |
| FILES CLOSED FOR INCOMPLETENESS | 0 | $0 | 0 | $0 | 2 | $228,220 | 0 | $0 | 0 | $0 |
Detailed HMDA statistics for the following Tracts: 8904.00
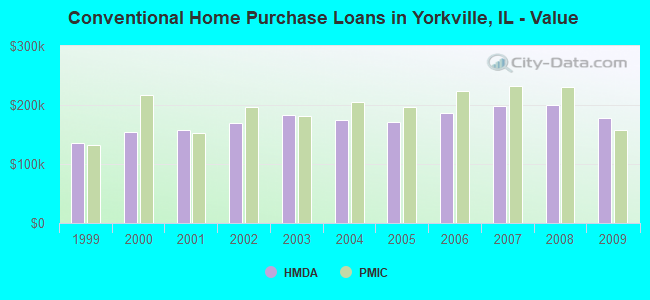
| Private Mortgage Insurance Companies Aggregated Statistics For Year 2009 (Based on 3 partial tracts) | ||||
| A) Conventional Home Purchase Loans | B) Refinancings | |||
|---|---|---|---|---|
| Number | Average Value | Number | Average Value | |
| LOANS ORIGINATED | 2 | $158,255 | 1 | $321,000 |
| APPLICATIONS APPROVED, NOT ACCEPTED | 1 | $189,050 | 1 | $209,620 |
| APPLICATIONS DENIED | 0 | $0 | 0 | $0 |
| APPLICATIONS WITHDRAWN | 0 | $0 | 0 | $0 |
| FILES CLOSED FOR INCOMPLETENESS | 0 | $0 | 0 | $0 |
Detailed PMIC statistics for the following Tracts: 8904.00
2002 - 2018 National Fire Incident Reporting System (NFIRS) incidents
- Fire incident types reported to NFIRS in Yorkville, IL
- 49745.5%Outside Fires
- 43439.7%Structure Fires
- 14613.4%Mobile Property/Vehicle Fires
- 151.4%Other
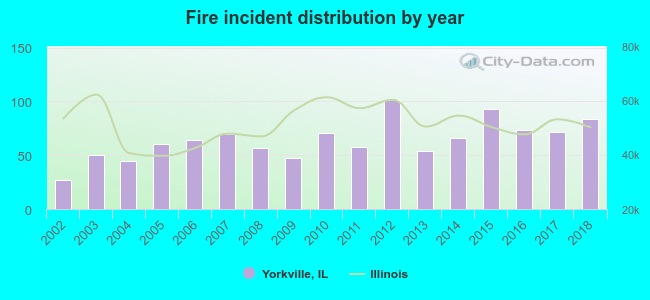 Based on the data from the years 2002 - 2018 the average number of fires per year is 64. The highest number of reported fire incidents - 101 took place in 2012, and the least - 27 in 2002. The data has a rising trend.
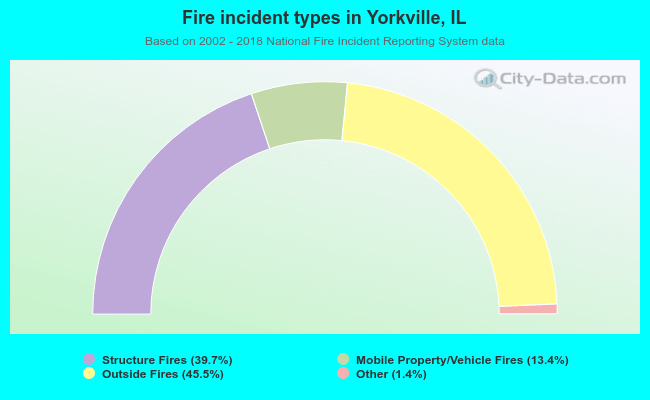 When looking into fire subcategories, the most reports belonged to: Outside Fires (45.5%), and Structure Fires (39.7%).
Fire-safe hotels and motels in Yorkville, Illinois:
- Hampton Inn Yorkville, 310 E Countryside Pkwy, Yorkville, Illinois 60560 , Phone: (630) 553-9805, Fax: (630) 553-9875
- Super 8, 1510 N Bridge St, Yorkville, Illinois 60560 , Phone: (630) 553-1634
| Most common first names in Yorkville, IL among deceased individuals | ||
| Name | Count | Lived (average) |
|---|---|---|
| John | 47 | 76.1 years |
| William | 36 | 74.5 years |
| Robert | 36 | 73.4 years |
| Dorothy | 29 | 82.0 years |
| Mary | 29 | 84.2 years |
| Richard | 24 | 72.7 years |
| Alice | 21 | 83.1 years |
| Helen | 21 | 83.4 years |
| Donald | 20 | 72.0 years |
| Charles | 20 | 74.2 years |
| Most common last names in Yorkville, IL among deceased individuals | ||
| Last name | Count | Lived (average) |
|---|---|---|
| Johnson | 34 | 77.6 years |
| Smith | 16 | 74.5 years |
| Miller | 14 | 76.2 years |
| Merkel | 12 | 79.8 years |
| Leifheit | 10 | 83.3 years |
| Anderson | 10 | 75.5 years |
| Larson | 9 | 82.1 years |
| Walker | 9 | 78.2 years |
| Behrens | 8 | 77.5 years |
| Henne | 8 | 77.4 years |
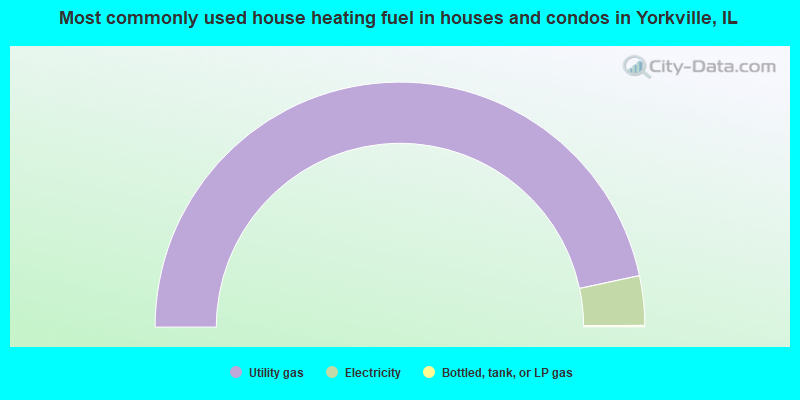
- 93.2%Utility gas
- 6.5%Electricity
- 0.2%Bottled, tank, or LP gas
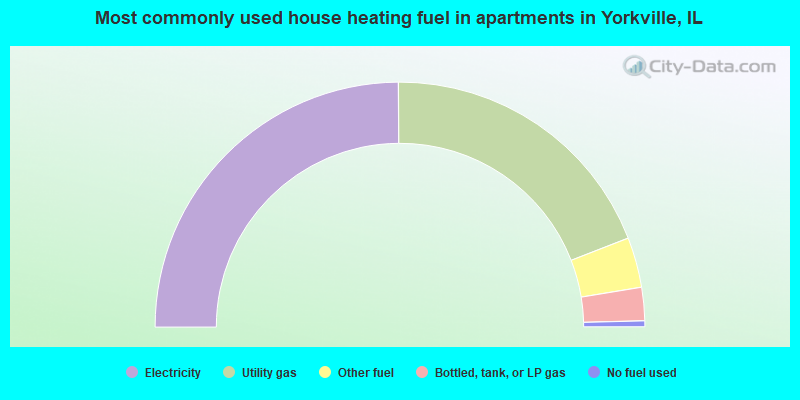
- 49.8%Electricity
- 38.4%Utility gas
- 6.6%Other fuel
- 4.4%Bottled, tank, or LP gas
- 0.8%No fuel used
Yorkville compared to Illinois state average:
- Unemployed percentage significantly below state average.
- Hispanic race population percentage significantly above state average.
- Median age below state average.
- Renting percentage below state average.
- Length of stay since moving in significantly above state average.
- Number of rooms per house above state average.
- House age significantly below state average.
- Number of college students above state average.
- Percentage of population with a bachelor's degree or higher above state average.
Yorkville on our top lists:
- #26 on the list of "Top 101 cities with the largest percentage population increase from 2000 (population 5,000+)"
- #6 on the list of "Top 101 counties with the largest decrease in the number of deaths per 1000 residents 2000-2006 to 2007-2013 (pop. 50,000+)"
- #7 on the list of "Top 101 counties with the lowest number of deaths per 1000 residents 2007-2013 (pop. 50,000+)"
- #17 on the list of "Top 101 counties with the largest number of children under 18 without health insurance coverage in 2000 (pop. 50,000+)"
- #33 on the list of "Top 101 counties with the lowest total withdrawal of fresh water for public supply (pop. 50,000+)"
- #35 on the list of "Top 101 counties with the largest number of people without health insurance coverage in 2000 (pop. 50,000+)"

|
|
Total of 218 patent applications in 2008-2024.