Plainfield, Illinois Submit your own pictures of this village and show them to the world
OSM Map
General Map
Google Map
MSN Map
OSM Map
General Map
Google Map
MSN Map
OSM Map
General Map
Google Map
MSN Map
OSM Map
General Map
Google Map
MSN Map
Please wait while loading the map...
Population in 2022: 46,243 (99% urban, 1% rural). Population change since 2000: +254.7%Males: 23,196 Females: 23,047
March 2022 cost of living index in Plainfield: 101.8 (near average, U.S. average is 100) Percentage of residents living in poverty in 2022: 2.3%for White Non-Hispanic residents , 3.0% for Black residents , 0.3% for Hispanic or Latino residents , 24.3% for American Indian residents , 3.6% for two or more races residents )
Profiles of local businesses
Business Search - 14 Million verified businesses
Data:
Median household income ($)
Median household income (% change since 2000)
Household income diversity
Ratio of average income to average house value (%)
Ratio of average income to average rent
Median household income ($) - White
Median household income ($) - Black or African American
Median household income ($) - Asian
Median household income ($) - Hispanic or Latino
Median household income ($) - American Indian and Alaska Native
Median household income ($) - Multirace
Median household income ($) - Other Race
Median household income for houses/condos with a mortgage ($)
Median household income for apartments without a mortgage ($)
Races - White alone (%)
Races - White alone (% change since 2000)
Races - Black alone (%)
Races - Black alone (% change since 2000)
Races - American Indian alone (%)
Races - American Indian alone (% change since 2000)
Races - Asian alone (%)
Races - Asian alone (% change since 2000)
Races - Hispanic (%)
Races - Hispanic (% change since 2000)
Races - Native Hawaiian and Other Pacific Islander alone (%)
Races - Native Hawaiian and Other Pacific Islander alone (% change since 2000)
Races - Two or more races (%)
Races - Two or more races (% change since 2000)
Races - Other race alone (%)
Races - Other race alone (% change since 2000)
Racial diversity
Unemployment (%)
Unemployment (% change since 2000)
Unemployment (%) - White
Unemployment (%) - Black or African American
Unemployment (%) - Asian
Unemployment (%) - Hispanic or Latino
Unemployment (%) - American Indian and Alaska Native
Unemployment (%) - Multirace
Unemployment (%) - Other Race
Population density (people per square mile)
Population - Males (%)
Population - Females (%)
Population - Males (%) - White
Population - Males (%) - Black or African American
Population - Males (%) - Asian
Population - Males (%) - Hispanic or Latino
Population - Males (%) - American Indian and Alaska Native
Population - Males (%) - Multirace
Population - Males (%) - Other Race
Population - Females (%) - White
Population - Females (%) - Black or African American
Population - Females (%) - Asian
Population - Females (%) - Hispanic or Latino
Population - Females (%) - American Indian and Alaska Native
Population - Females (%) - Multirace
Population - Females (%) - Other Race
Coronavirus confirmed cases (Apr 27, 2024)
Deaths caused by coronavirus (Apr 27, 2024)
Coronavirus confirmed cases (per 100k population) (Apr 27, 2024)
Deaths caused by coronavirus (per 100k population) (Apr 27, 2024)
Daily increase in number of cases (Apr 27, 2024)
Weekly increase in number of cases (Apr 27, 2024)
Cases doubled (in days) (Apr 27, 2024)
Hospitalized patients (Apr 18, 2022)
Negative test results (Apr 18, 2022)
Total test results (Apr 18, 2022)
COVID Vaccine doses distributed (per 100k population) (Sep 19, 2023)
COVID Vaccine doses administered (per 100k population) (Sep 19, 2023)
COVID Vaccine doses distributed (Sep 19, 2023)
COVID Vaccine doses administered (Sep 19, 2023)
Likely homosexual households (%)
Likely homosexual households (% change since 2000)
Likely homosexual households - Lesbian couples (%)
Likely homosexual households - Lesbian couples (% change since 2000)
Likely homosexual households - Gay men (%)
Likely homosexual households - Gay men (% change since 2000)
Cost of living index
Median gross rent ($)
Median contract rent ($)
Median monthly housing costs ($)
Median house or condo value ($)
Median house or condo value ($ change since 2000)
Mean house or condo value by units in structure - 1, detached ($)
Mean house or condo value by units in structure - 1, attached ($)
Mean house or condo value by units in structure - 2 ($)
Mean house or condo value by units in structure by units in structure - 3 or 4 ($)
Mean house or condo value by units in structure - 5 or more ($)
Mean house or condo value by units in structure - Boat, RV, van, etc. ($)
Mean house or condo value by units in structure - Mobile home ($)
Median house or condo value ($) - White
Median house or condo value ($) - Black or African American
Median house or condo value ($) - Asian
Median house or condo value ($) - Hispanic or Latino
Median house or condo value ($) - American Indian and Alaska Native
Median house or condo value ($) - Multirace
Median house or condo value ($) - Other Race
Median resident age
Resident age diversity
Median resident age - Males
Median resident age - Females
Median resident age - White
Median resident age - Black or African American
Median resident age - Asian
Median resident age - Hispanic or Latino
Median resident age - American Indian and Alaska Native
Median resident age - Multirace
Median resident age - Other Race
Median resident age - Males - White
Median resident age - Males - Black or African American
Median resident age - Males - Asian
Median resident age - Males - Hispanic or Latino
Median resident age - Males - American Indian and Alaska Native
Median resident age - Males - Multirace
Median resident age - Males - Other Race
Median resident age - Females - White
Median resident age - Females - Black or African American
Median resident age - Females - Asian
Median resident age - Females - Hispanic or Latino
Median resident age - Females - American Indian and Alaska Native
Median resident age - Females - Multirace
Median resident age - Females - Other Race
Commute - mean travel time to work (minutes)
Travel time to work - Less than 5 minutes (%)
Travel time to work - Less than 5 minutes (% change since 2000)
Travel time to work - 5 to 9 minutes (%)
Travel time to work - 5 to 9 minutes (% change since 2000)
Travel time to work - 10 to 19 minutes (%)
Travel time to work - 10 to 19 minutes (% change since 2000)
Travel time to work - 20 to 29 minutes (%)
Travel time to work - 20 to 29 minutes (% change since 2000)
Travel time to work - 30 to 39 minutes (%)
Travel time to work - 30 to 39 minutes (% change since 2000)
Travel time to work - 40 to 59 minutes (%)
Travel time to work - 40 to 59 minutes (% change since 2000)
Travel time to work - 60 to 89 minutes (%)
Travel time to work - 60 to 89 minutes (% change since 2000)
Travel time to work - 90 or more minutes (%)
Travel time to work - 90 or more minutes (% change since 2000)
Marital status - Never married (%)
Marital status - Now married (%)
Marital status - Separated (%)
Marital status - Widowed (%)
Marital status - Divorced (%)
Median family income ($)
Median family income (% change since 2000)
Median non-family income ($)
Median non-family income (% change since 2000)
Median per capita income ($)
Median per capita income (% change since 2000)
Median family income ($) - White
Median family income ($) - Black or African American
Median family income ($) - Asian
Median family income ($) - Hispanic or Latino
Median family income ($) - American Indian and Alaska Native
Median family income ($) - Multirace
Median family income ($) - Other Race
Median year house/condo built
Median year apartment built
Year house built - Built 2005 or later (%)
Year house built - Built 2000 to 2004 (%)
Year house built - Built 1990 to 1999 (%)
Year house built - Built 1980 to 1989 (%)
Year house built - Built 1970 to 1979 (%)
Year house built - Built 1960 to 1969 (%)
Year house built - Built 1950 to 1959 (%)
Year house built - Built 1940 to 1949 (%)
Year house built - Built 1939 or earlier (%)
Average household size
Household density (households per square mile)
Average household size - White
Average household size - Black or African American
Average household size - Asian
Average household size - Hispanic or Latino
Average household size - American Indian and Alaska Native
Average household size - Multirace
Average household size - Other Race
Occupied housing units (%)
Vacant housing units (%)
Owner occupied housing units (%)
Renter occupied housing units (%)
Vacancy status - For rent (%)
Vacancy status - For sale only (%)
Vacancy status - Rented or sold, not occupied (%)
Vacancy status - For seasonal, recreational, or occasional use (%)
Vacancy status - For migrant workers (%)
Vacancy status - Other vacant (%)
Residents with income below the poverty level (%)
Residents with income below 50% of the poverty level (%)
Children below poverty level (%)
Poor families by family type - Married-couple family (%)
Poor families by family type - Male, no wife present (%)
Poor families by family type - Female, no husband present (%)
Poverty status for native-born residents (%)
Poverty status for foreign-born residents (%)
Poverty among high school graduates not in families (%)
Poverty among people who did not graduate high school not in families (%)
Residents with income below the poverty level (%) - White
Residents with income below the poverty level (%) - Black or African American
Residents with income below the poverty level (%) - Asian
Residents with income below the poverty level (%) - Hispanic or Latino
Residents with income below the poverty level (%) - American Indian and Alaska Native
Residents with income below the poverty level (%) - Multirace
Residents with income below the poverty level (%) - Other Race
Air pollution - Air Quality Index (AQI)
Air pollution - CO
Air pollution - NO2
Air pollution - SO2
Air pollution - Ozone
Air pollution - PM10
Air pollution - PM25
Air pollution - Pb
Crime - Murders per 100,000 population
Crime - Rapes per 100,000 population
Crime - Robberies per 100,000 population
Crime - Assaults per 100,000 population
Crime - Burglaries per 100,000 population
Crime - Thefts per 100,000 population
Crime - Auto thefts per 100,000 population
Crime - Arson per 100,000 population
Crime - City-data.com crime index
Crime - Violent crime index
Crime - Property crime index
Crime - Murders per 100,000 population (5 year average)
Crime - Rapes per 100,000 population (5 year average)
Crime - Robberies per 100,000 population (5 year average)
Crime - Assaults per 100,000 population (5 year average)
Crime - Burglaries per 100,000 population (5 year average)
Crime - Thefts per 100,000 population (5 year average)
Crime - Auto thefts per 100,000 population (5 year average)
Crime - Arson per 100,000 population (5 year average)
Crime - City-data.com crime index (5 year average)
Crime - Violent crime index (5 year average)
Crime - Property crime index (5 year average)
1996 Presidential Elections Results (%) - Democratic Party (Clinton)
1996 Presidential Elections Results (%) - Republican Party (Dole)
1996 Presidential Elections Results (%) - Other
2000 Presidential Elections Results (%) - Democratic Party (Gore)
2000 Presidential Elections Results (%) - Republican Party (Bush)
2000 Presidential Elections Results (%) - Other
2004 Presidential Elections Results (%) - Democratic Party (Kerry)
2004 Presidential Elections Results (%) - Republican Party (Bush)
2004 Presidential Elections Results (%) - Other
2008 Presidential Elections Results (%) - Democratic Party (Obama)
2008 Presidential Elections Results (%) - Republican Party (McCain)
2008 Presidential Elections Results (%) - Other
2012 Presidential Elections Results (%) - Democratic Party (Obama)
2012 Presidential Elections Results (%) - Republican Party (Romney)
2012 Presidential Elections Results (%) - Other
2016 Presidential Elections Results (%) - Democratic Party (Clinton)
2016 Presidential Elections Results (%) - Republican Party (Trump)
2016 Presidential Elections Results (%) - Other
2020 Presidential Elections Results (%) - Democratic Party (Biden)
2020 Presidential Elections Results (%) - Republican Party (Trump)
2020 Presidential Elections Results (%) - Other
Ancestries Reported - Arab (%)
Ancestries Reported - Czech (%)
Ancestries Reported - Danish (%)
Ancestries Reported - Dutch (%)
Ancestries Reported - English (%)
Ancestries Reported - French (%)
Ancestries Reported - French Canadian (%)
Ancestries Reported - German (%)
Ancestries Reported - Greek (%)
Ancestries Reported - Hungarian (%)
Ancestries Reported - Irish (%)
Ancestries Reported - Italian (%)
Ancestries Reported - Lithuanian (%)
Ancestries Reported - Norwegian (%)
Ancestries Reported - Polish (%)
Ancestries Reported - Portuguese (%)
Ancestries Reported - Russian (%)
Ancestries Reported - Scotch-Irish (%)
Ancestries Reported - Scottish (%)
Ancestries Reported - Slovak (%)
Ancestries Reported - Subsaharan African (%)
Ancestries Reported - Swedish (%)
Ancestries Reported - Swiss (%)
Ancestries Reported - Ukrainian (%)
Ancestries Reported - United States (%)
Ancestries Reported - Welsh (%)
Ancestries Reported - West Indian (%)
Ancestries Reported - Other (%)
Educational Attainment - No schooling completed (%)
Educational Attainment - Less than high school (%)
Educational Attainment - High school or equivalent (%)
Educational Attainment - Less than 1 year of college (%)
Educational Attainment - 1 or more years of college (%)
Educational Attainment - Associate degree (%)
Educational Attainment - Bachelor's degree (%)
Educational Attainment - Master's degree (%)
Educational Attainment - Professional school degree (%)
Educational Attainment - Doctorate degree (%)
School Enrollment - Nursery, preschool (%)
School Enrollment - Kindergarten (%)
School Enrollment - Grade 1 to 4 (%)
School Enrollment - Grade 5 to 8 (%)
School Enrollment - Grade 9 to 12 (%)
School Enrollment - College undergrad (%)
School Enrollment - Graduate or professional (%)
School Enrollment - Not enrolled in school (%)
School enrollment - Public schools (%)
School enrollment - Private schools (%)
School enrollment - Not enrolled (%)
Median number of rooms in houses and condos
Median number of rooms in apartments
Housing units lacking complete plumbing facilities (%)
Housing units lacking complete kitchen facilities (%)
Density of houses
Urban houses (%)
Rural houses (%)
Households with people 60 years and over (%)
Households with people 65 years and over (%)
Households with people 75 years and over (%)
Households with one or more nonrelatives (%)
Households with no nonrelatives (%)
Population in households (%)
Family households (%)
Nonfamily households (%)
Population in families (%)
Family households with own children (%)
Median number of bedrooms in owner occupied houses
Mean number of bedrooms in owner occupied houses
Median number of bedrooms in renter occupied houses
Mean number of bedrooms in renter occupied houses
Median number of vehichles in owner occupied houses
Mean number of vehichles in owner occupied houses
Median number of vehichles in renter occupied houses
Mean number of vehichles in renter occupied houses
Mortgage status - with mortgage (%)
Mortgage status - with second mortgage (%)
Mortgage status - with home equity loan (%)
Mortgage status - with both second mortgage and home equity loan (%)
Mortgage status - without a mortgage (%)
Average family size
Average family size - White
Average family size - Black or African American
Average family size - Asian
Average family size - Hispanic or Latino
Average family size - American Indian and Alaska Native
Average family size - Multirace
Average family size - Other Race
Geographical mobility - Same house 1 year ago (%)
Geographical mobility - Moved within same county (%)
Geographical mobility - Moved from different county within same state (%)
Geographical mobility - Moved from different state (%)
Geographical mobility - Moved from abroad (%)
Place of birth - Born in state of residence (%)
Place of birth - Born in other state (%)
Place of birth - Native, outside of US (%)
Place of birth - Foreign born (%)
Housing units in structures - 1, detached (%)
Housing units in structures - 1, attached (%)
Housing units in structures - 2 (%)
Housing units in structures - 3 or 4 (%)
Housing units in structures - 5 to 9 (%)
Housing units in structures - 10 to 19 (%)
Housing units in structures - 20 to 49 (%)
Housing units in structures - 50 or more (%)
Housing units in structures - Mobile home (%)
Housing units in structures - Boat, RV, van, etc. (%)
House/condo owner moved in on average (years ago)
Renter moved in on average (years ago)
Year householder moved into unit - Moved in 1999 to March 2000 (%)
Year householder moved into unit - Moved in 1995 to 1998 (%)
Year householder moved into unit - Moved in 1990 to 1994 (%)
Year householder moved into unit - Moved in 1980 to 1989 (%)
Year householder moved into unit - Moved in 1970 to 1979 (%)
Year householder moved into unit - Moved in 1969 or earlier (%)
Means of transportation to work - Drove car alone (%)
Means of transportation to work - Carpooled (%)
Means of transportation to work - Public transportation (%)
Means of transportation to work - Bus or trolley bus (%)
Means of transportation to work - Streetcar or trolley car (%)
Means of transportation to work - Subway or elevated (%)
Means of transportation to work - Railroad (%)
Means of transportation to work - Ferryboat (%)
Means of transportation to work - Taxicab (%)
Means of transportation to work - Motorcycle (%)
Means of transportation to work - Bicycle (%)
Means of transportation to work - Walked (%)
Means of transportation to work - Other means (%)
Working at home (%)
Industry diversity
Most Common Industries - Agriculture, forestry, fishing and hunting, and mining (%)
Most Common Industries - Agriculture, forestry, fishing and hunting (%)
Most Common Industries - Mining, quarrying, and oil and gas extraction (%)
Most Common Industries - Construction (%)
Most Common Industries - Manufacturing (%)
Most Common Industries - Wholesale trade (%)
Most Common Industries - Retail trade (%)
Most Common Industries - Transportation and warehousing, and utilities (%)
Most Common Industries - Transportation and warehousing (%)
Most Common Industries - Utilities (%)
Most Common Industries - Information (%)
Most Common Industries - Finance and insurance, and real estate and rental and leasing (%)
Most Common Industries - Finance and insurance (%)
Most Common Industries - Real estate and rental and leasing (%)
Most Common Industries - Professional, scientific, and management, and administrative and waste management services (%)
Most Common Industries - Professional, scientific, and technical services (%)
Most Common Industries - Management of companies and enterprises (%)
Most Common Industries - Administrative and support and waste management services (%)
Most Common Industries - Educational services, and health care and social assistance (%)
Most Common Industries - Educational services (%)
Most Common Industries - Health care and social assistance (%)
Most Common Industries - Arts, entertainment, and recreation, and accommodation and food services (%)
Most Common Industries - Arts, entertainment, and recreation (%)
Most Common Industries - Accommodation and food services (%)
Most Common Industries - Other services, except public administration (%)
Most Common Industries - Public administration (%)
Occupation diversity
Most Common Occupations - Management, business, science, and arts occupations (%)
Most Common Occupations - Management, business, and financial occupations (%)
Most Common Occupations - Management occupations (%)
Most Common Occupations - Business and financial operations occupations (%)
Most Common Occupations - Computer, engineering, and science occupations (%)
Most Common Occupations - Computer and mathematical occupations (%)
Most Common Occupations - Architecture and engineering occupations (%)
Most Common Occupations - Life, physical, and social science occupations (%)
Most Common Occupations - Education, legal, community service, arts, and media occupations (%)
Most Common Occupations - Community and social service occupations (%)
Most Common Occupations - Legal occupations (%)
Most Common Occupations - Education, training, and library occupations (%)
Most Common Occupations - Arts, design, entertainment, sports, and media occupations (%)
Most Common Occupations - Healthcare practitioners and technical occupations (%)
Most Common Occupations - Health diagnosing and treating practitioners and other technical occupations (%)
Most Common Occupations - Health technologists and technicians (%)
Most Common Occupations - Service occupations (%)
Most Common Occupations - Healthcare support occupations (%)
Most Common Occupations - Protective service occupations (%)
Most Common Occupations - Fire fighting and prevention, and other protective service workers including supervisors (%)
Most Common Occupations - Law enforcement workers including supervisors (%)
Most Common Occupations - Food preparation and serving related occupations (%)
Most Common Occupations - Building and grounds cleaning and maintenance occupations (%)
Most Common Occupations - Personal care and service occupations (%)
Most Common Occupations - Sales and office occupations (%)
Most Common Occupations - Sales and related occupations (%)
Most Common Occupations - Office and administrative support occupations (%)
Most Common Occupations - Natural resources, construction, and maintenance occupations (%)
Most Common Occupations - Farming, fishing, and forestry occupations (%)
Most Common Occupations - Construction and extraction occupations (%)
Most Common Occupations - Installation, maintenance, and repair occupations (%)
Most Common Occupations - Production, transportation, and material moving occupations (%)
Most Common Occupations - Production occupations (%)
Most Common Occupations - Transportation occupations (%)
Most Common Occupations - Material moving occupations (%)
People in Group quarters - Institutionalized population (%)
People in Group quarters - Correctional institutions (%)
People in Group quarters - Federal prisons and detention centers (%)
People in Group quarters - Halfway houses (%)
People in Group quarters - Local jails and other confinement facilities (including police lockups) (%)
People in Group quarters - Military disciplinary barracks (%)
People in Group quarters - State prisons (%)
People in Group quarters - Other types of correctional institutions (%)
People in Group quarters - Nursing homes (%)
People in Group quarters - Hospitals/wards, hospices, and schools for the handicapped (%)
People in Group quarters - Hospitals/wards and hospices for chronically ill (%)
People in Group quarters - Hospices or homes for chronically ill (%)
People in Group quarters - Military hospitals or wards for chronically ill (%)
People in Group quarters - Other hospitals or wards for chronically ill (%)
People in Group quarters - Hospitals or wards for drug/alcohol abuse (%)
People in Group quarters - Mental (Psychiatric) hospitals or wards (%)
People in Group quarters - Schools, hospitals, or wards for the mentally retarded (%)
People in Group quarters - Schools, hospitals, or wards for the physically handicapped (%)
People in Group quarters - Institutions for the deaf (%)
People in Group quarters - Institutions for the blind (%)
People in Group quarters - Orthopedic wards and institutions for the physically handicapped (%)
People in Group quarters - Wards in general hospitals for patients who have no usual home elsewhere (%)
People in Group quarters - Wards in military hospitals for patients who have no usual home elsewhere (%)
People in Group quarters - Juvenile institutions (%)
People in Group quarters - Long-term care (%)
People in Group quarters - Homes for abused, dependent, and neglected children (%)
People in Group quarters - Residential treatment centers for emotionally disturbed children (%)
People in Group quarters - Training schools for juvenile delinquents (%)
People in Group quarters - Short-term care, detention or diagnostic centers for delinquent children (%)
People in Group quarters - Type of juvenile institution unknown (%)
People in Group quarters - Noninstitutionalized population (%)
People in Group quarters - College dormitories (includes college quarters off campus) (%)
People in Group quarters - Military quarters (%)
People in Group quarters - On base (%)
People in Group quarters - Barracks, unaccompanied personnel housing (UPH), (Enlisted/Officer), ;and similar group living quarters for military personnel (%)
People in Group quarters - Transient quarters for temporary residents (%)
People in Group quarters - Military ships (%)
People in Group quarters - Group homes (%)
People in Group quarters - Homes or halfway houses for drug/alcohol abuse (%)
People in Group quarters - Homes for the mentally ill (%)
People in Group quarters - Homes for the mentally retarded (%)
People in Group quarters - Homes for the physically handicapped (%)
People in Group quarters - Other group homes (%)
People in Group quarters - Religious group quarters (%)
People in Group quarters - Dormitories (%)
People in Group quarters - Agriculture workers' dormitories on farms (%)
People in Group quarters - Job Corps and vocational training facilities (%)
People in Group quarters - Other workers' dormitories (%)
People in Group quarters - Crews of maritime vessels (%)
People in Group quarters - Other nonhousehold living situations (%)
People in Group quarters - Other noninstitutional group quarters (%)
Residents speaking English at home (%)
Residents speaking English at home - Born in the United States (%)
Residents speaking English at home - Native, born elsewhere (%)
Residents speaking English at home - Foreign born (%)
Residents speaking Spanish at home (%)
Residents speaking Spanish at home - Born in the United States (%)
Residents speaking Spanish at home - Native, born elsewhere (%)
Residents speaking Spanish at home - Foreign born (%)
Residents speaking other language at home (%)
Residents speaking other language at home - Born in the United States (%)
Residents speaking other language at home - Native, born elsewhere (%)
Residents speaking other language at home - Foreign born (%)
Class of Workers - Employee of private company (%)
Class of Workers - Self-employed in own incorporated business (%)
Class of Workers - Private not-for-profit wage and salary workers (%)
Class of Workers - Local government workers (%)
Class of Workers - State government workers (%)
Class of Workers - Federal government workers (%)
Class of Workers - Self-employed workers in own not incorporated business and Unpaid family workers (%)
House heating fuel used in houses and condos - Utility gas (%)
House heating fuel used in houses and condos - Bottled, tank, or LP gas (%)
House heating fuel used in houses and condos - Electricity (%)
House heating fuel used in houses and condos - Fuel oil, kerosene, etc. (%)
House heating fuel used in houses and condos - Coal or coke (%)
House heating fuel used in houses and condos - Wood (%)
House heating fuel used in houses and condos - Solar energy (%)
House heating fuel used in houses and condos - Other fuel (%)
House heating fuel used in houses and condos - No fuel used (%)
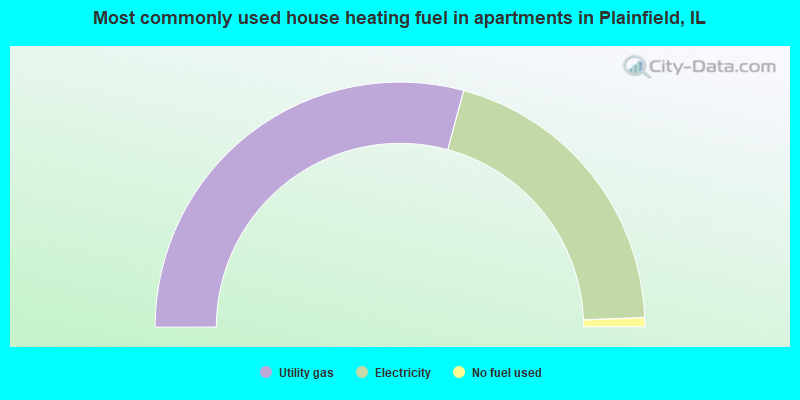
House heating fuel used in apartments - Utility gas (%)
House heating fuel used in apartments - Bottled, tank, or LP gas (%)
House heating fuel used in apartments - Electricity (%)
House heating fuel used in apartments - Fuel oil, kerosene, etc. (%)
House heating fuel used in apartments - Coal or coke (%)
House heating fuel used in apartments - Wood (%)
House heating fuel used in apartments - Solar energy (%)
House heating fuel used in apartments - Other fuel (%)
House heating fuel used in apartments - No fuel used (%)
Armed forces status - In Armed Forces (%)
Armed forces status - Civilian (%)
Armed forces status - Civilian - Veteran (%)
Armed forces status - Civilian - Nonveteran (%)
Fatal accidents locations in years 2005-2021
Fatal accidents locations in 2005
Fatal accidents locations in 2006
Fatal accidents locations in 2007
Fatal accidents locations in 2008
Fatal accidents locations in 2009
Fatal accidents locations in 2010
Fatal accidents locations in 2011
Fatal accidents locations in 2012
Fatal accidents locations in 2013
Fatal accidents locations in 2014
Fatal accidents locations in 2015
Fatal accidents locations in 2016
Fatal accidents locations in 2017
Fatal accidents locations in 2018
Fatal accidents locations in 2019
Fatal accidents locations in 2020
Fatal accidents locations in 2021
Alcohol use - People drinking some alcohol every month (%)
Alcohol use - People not drinking at all (%)
Alcohol use - Average days/month drinking alcohol
Alcohol use - Average drinks/week
Alcohol use - Average days/year people drink much
Audiometry - Average condition of hearing (%)
Audiometry - People that can hear a whisper from across a quiet room (%)
Audiometry - People that can hear normal voice from across a quiet room (%)
Audiometry - Ears ringing, roaring, buzzing (%)
Audiometry - Had a job exposure to loud noise (%)
Audiometry - Had off-work exposure to loud noise (%)
Blood Pressure & Cholesterol - Has high blood pressure (%)
Blood Pressure & Cholesterol - Checking blood pressure at home (%)
Blood Pressure & Cholesterol - Frequently checking blood cholesterol (%)
Blood Pressure & Cholesterol - Has high cholesterol level (%)
Consumer Behavior - Money monthly spent on food at supermarket/grocery store
Consumer Behavior - Money monthly spent on food at other stores
Consumer Behavior - Money monthly spent on eating out
Consumer Behavior - Money monthly spent on carryout/delivered foods
Consumer Behavior - Income spent on food at supermarket/grocery store (%)
Consumer Behavior - Income spent on food at other stores (%)
Consumer Behavior - Income spent on eating out (%)
Consumer Behavior - Income spent on carryout/delivered foods (%)
Current Health Status - General health condition (%)
Current Health Status - Blood donors (%)
Current Health Status - Has blood ever tested for HIV virus (%)
Current Health Status - Left-handed people (%)
Dermatology - People using sunscreen (%)
Diabetes - Diabetics (%)
Diabetes - Had a blood test for high blood sugar (%)
Diabetes - People taking insulin (%)
Diet Behavior & Nutrition - Diet health (%)
Diet Behavior & Nutrition - Milk product consumption (# of products/month)
Diet Behavior & Nutrition - Meals not home prepared (#/week)
Diet Behavior & Nutrition - Meals from fast food or pizza place (#/week)
Diet Behavior & Nutrition - Ready-to-eat foods (#/month)
Diet Behavior & Nutrition - Frozen meals/pizza (#/month)
Drug Use - People that ever used marijuana or hashish (%)
Drug Use - Ever used hard drugs (%)
Drug Use - Ever used any form of cocaine (%)
Drug Use - Ever used heroin (%)
Drug Use - Ever used methamphetamine (%)
Health Insurance - People covered by health insurance (%)
Kidney Conditions-Urology - Avg. # of times urinating at night
Medical Conditions - People with asthma (%)
Medical Conditions - People with anemia (%)
Medical Conditions - People with psoriasis (%)
Medical Conditions - People with overweight (%)
Medical Conditions - Elderly people having difficulties in thinking or remembering (%)
Medical Conditions - People who ever received blood transfusion (%)
Medical Conditions - People having trouble seeing even with glass/contacts (%)
Medical Conditions - People with arthritis (%)
Medical Conditions - People with gout (%)
Medical Conditions - People with congestive heart failure (%)
Medical Conditions - People with coronary heart disease (%)
Medical Conditions - People with angina pectoris (%)
Medical Conditions - People who ever had heart attack (%)
Medical Conditions - People who ever had stroke (%)
Medical Conditions - People with emphysema (%)
Medical Conditions - People with thyroid problem (%)
Medical Conditions - People with chronic bronchitis (%)
Medical Conditions - People with any liver condition (%)
Medical Conditions - People who ever had cancer or malignancy (%)
Mental Health - People who have little interest in doing things (%)
Mental Health - People feeling down, depressed, or hopeless (%)
Mental Health - People who have trouble sleeping or sleeping too much (%)
Mental Health - People feeling tired or having little energy (%)
Mental Health - People with poor appetite or overeating (%)
Mental Health - People feeling bad about themself (%)
Mental Health - People who have trouble concentrating on things (%)
Mental Health - People moving or speaking slowly or too fast (%)
Mental Health - People having thoughts they would be better off dead (%)
Oral Health - Average years since last visit a dentist
Oral Health - People embarrassed because of mouth (%)
Oral Health - People with gum disease (%)
Oral Health - General health of teeth and gums (%)
Oral Health - Average days a week using dental floss/device
Oral Health - Average days a week using mouthwash for dental problem
Oral Health - Average number of teeth
Pesticide Use - Households using pesticides to control insects (%)
Pesticide Use - Households using pesticides to kill weeds (%)
Physical Activity - People doing vigorous-intensity work activities (%)
Physical Activity - People doing moderate-intensity work activities (%)
Physical Activity - People walking or bicycling (%)
Physical Activity - People doing vigorous-intensity recreational activities (%)
Physical Activity - People doing moderate-intensity recreational activities (%)
Physical Activity - Average hours a day doing sedentary activities
Physical Activity - Average hours a day watching TV or videos
Physical Activity - Average hours a day using computer
Physical Functioning - People having limitations keeping them from working (%)
Physical Functioning - People limited in amount of work they can do (%)
Physical Functioning - People that need special equipment to walk (%)
Physical Functioning - People experiencing confusion/memory problems (%)
Physical Functioning - People requiring special healthcare equipment (%)
Prescription Medications - Average number of prescription medicines taking
Preventive Aspirin Use - Adults 40+ taking low-dose aspirin (%)
Reproductive Health - Vaginal deliveries (%)
Reproductive Health - Cesarean deliveries (%)
Reproductive Health - Deliveries resulted in a live birth (%)
Reproductive Health - Pregnancies resulted in a delivery (%)
Reproductive Health - Women breastfeeding newborns (%)
Reproductive Health - Women that had a hysterectomy (%)
Reproductive Health - Women that had both ovaries removed (%)
Reproductive Health - Women that have ever taken birth control pills (%)
Reproductive Health - Women taking birth control pills (%)
Reproductive Health - Women that have ever used Depo-Provera or injectables (%)
Reproductive Health - Women that have ever used female hormones (%)
Sexual Behavior - People 18+ that ever had sex (vaginal, anal, or oral) (%)
Sexual Behavior - Males 18+ that ever had vaginal sex with a woman (%)
Sexual Behavior - Males 18+ that ever performed oral sex on a woman (%)
Sexual Behavior - Males 18+ that ever had anal sex with a woman (%)
Sexual Behavior - Males 18+ that ever had any sex with a man (%)
Sexual Behavior - Females 18+ that ever had vaginal sex with a man (%)
Sexual Behavior - Females 18+ that ever performed oral sex on a man (%)
Sexual Behavior - Females 18+ that ever had anal sex with a man (%)
Sexual Behavior - Females 18+ that ever had any kind of sex with a woman (%)
Sexual Behavior - Average age people first had sex
Sexual Behavior - Average number of female sex partners in lifetime (males 18+)
Sexual Behavior - Average number of female vaginal sex partners in lifetime (males 18+)
Sexual Behavior - Average age people first performed oral sex on a woman (18+)
Sexual Behavior - Average number of woman performed oral sex on in lifetime (18+)
Sexual Behavior - Average number of male sex partners in lifetime (males 18+)
Sexual Behavior - Average number of male anal sex partners in lifetime (males 18+)
Sexual Behavior - Average age people first performed oral sex on a man (18+)
Sexual Behavior - Average number of male oral sex partners in lifetime (18+)
Sexual Behavior - People using protection when performing oral sex (%)
Sexual Behavior - Average number of times people have vaginal or anal sex a year
Sexual Behavior - People having sex without condom (%)
Sexual Behavior - Average number of male sex partners in lifetime (females 18+)
Sexual Behavior - Average number of male vaginal sex partners in lifetime (females 18+)
Sexual Behavior - Average number of female sex partners in lifetime (females 18+)
Sexual Behavior - Circumcised males 18+ (%)
Sleep Disorders - Average hours sleeping at night
Sleep Disorders - People that has trouble sleeping (%)
Smoking-Cigarette Use - People smoking cigarettes (%)
Taste & Smell - People 40+ having problems with smell (%)
Taste & Smell - People 40+ having problems with taste (%)
Taste & Smell - People 40+ that ever had wisdom teeth removed (%)
Taste & Smell - People 40+ that ever had tonsils teeth removed (%)
Taste & Smell - People 40+ that ever had a loss of consciousness because of a head injury (%)
Taste & Smell - People 40+ that ever had a broken nose or other serious injury to face or skull (%)
Taste & Smell - People 40+ that ever had two or more sinus infections (%)
Weight - Average height (inches)
Weight - Average weight (pounds)
Weight - Average BMI
Weight - People that are obese (%)
Weight - People that ever were obese (%)
Weight - People trying to lose weight (%)
According to our research of Illinois and other state lists, there were 31 registered sex offenders living in Plainfield, Illinois as of April 26, 2024 . The ratio of all residents to sex offenders in Plainfield is 1,359 to 1.The ratio of registered sex offenders to all residents in this city is lower than the state average.
Officers per 1,000 residents here:
1.28Illinois average:
3.06
Latest news from Plainfield, IL collected exclusively by city-data.com from local newspapers, TV, and radio stations
Ancestries: German (13.2%), Polish (8.5%), Italian (5.8%), Nigerian (5.5%), Irish (5.3%), American (4.4%).
Current Local Time:
Incorporated on 08/13/1877
Land area: 11.6 square miles.
Population density: 3,982 people per square mile (average).
5,365 residents are foreign born (5.8% Asia , 2.5% Africa , 1.9% Europe , 1.4% Latin America ).
This village:
11.9%Illinois:
14.1%
Median real estate property taxes paid for housing units with mortgages in 2022: $8,984 (2.2%)Median real estate property taxes paid for housing units with no mortgage in 2022: $8,185 (2.1%)
Nearest city with pop. 50,000+: Joliet, IL
Nearest city with pop. 200,000+: Chicago, IL
Nearest cities:
Latitude: 41.62 N, Longitude: 88.20 W
Daytime population change due to commuting: -3,758 (-8.4%)Workers who live and work in this village: 8,103 (34.5%)
Property values in Plainfield, IL
Single-family new house construction building permits:
2022: 419 buildings , average cost: $241,6002021: 356 buildings , average cost: $227,9002020: 256 buildings , average cost: $260,3002019: 202 buildings , average cost: $260,0002018: 180 buildings , average cost: $226,5002017: 144 buildings , average cost: $245,4002016: 143 buildings , average cost: $296,5002015: 139 buildings , average cost: $328,7002014: 163 buildings , average cost: $303,8002013: 136 buildings , average cost: $254,3002012: 104 buildings , average cost: $266,1002011: 88 buildings , average cost: $242,9002010: 59 buildings , average cost: $271,1002009: 66 buildings , average cost: $233,5002008: 164 buildings , average cost: $248,6002007: 400 buildings , average cost: $283,7002006: 998 buildings , average cost: $261,1002005: 1407 buildings , average cost: $266,3002004: 1320 buildings , average cost: $244,8002003: 1449 buildings , average cost: $193,8002002: 947 buildings , average cost: $201,0002001: 627 buildings , average cost: $204,5002000: 602 buildings , average cost: $186,6001999: 772 buildings , average cost: $165,2001998: 528 buildings , average cost: $155,6001997: 229 buildings , average cost: $146,300Unemployment in December 2023:
Population change in the 1990s: +7,754 (+146.7%).
Most common occupations in Plainfield, IL (%)
Both Males Females
Other management occupations, except farmers and farm managers (5.5%)
Sales representatives, services, wholesale and manufacturing (4.9%)
Secretaries and administrative assistants (4.0%)
Retail sales workers, except cashiers (4.0%)
Other sales and related occupations, including supervisors (3.9%)
Computer specialists (3.4%)
Engineers (3.3%)
Other management occupations, except farmers and farm managers (6.9%)
Sales representatives, services, wholesale and manufacturing (6.2%)
Engineers (5.2%)
Electrical equipment mechanics and other installation, maintenance, and repair workers, including supervisors (5.1%)
Computer specialists (5.1%)
Driver/sales workers and truck drivers (4.5%)
Operations specialties managers, except financial managers (3.9%)
Secretaries and administrative assistants (8.8%)
Registered nurses (5.9%)
Preschool, kindergarten, elementary, and middle school teachers (5.4%)
Other office and administrative support workers, including supervisors (4.9%)
Retail sales workers, except cashiers (4.6%)
Other sales and related occupations, including supervisors (4.5%)
Other management occupations, except farmers and farm managers (4.0%)
Tornado activity:
Plainfield-area historical tornado activity is near Illinois state average. It is 58% greater than the overall U.S. average.
On 8/28/1990, a category F5 (max. wind speeds 261-318 mph) tornado 8.6 miles away from the Plainfield village center killed 29 people and injured 350 people and caused between $50,000 and $500,000 in damages.
On 6/13/1976, a category F4 (max. wind speeds 207-260 mph) tornado 11.1 miles away from the village center killed 2 people and injured 23 people and caused between $500,000 and $5,000,000 in damages.
Earthquake activity:
Plainfield-area historical earthquake activity is significantly above Illinois state average. It is 57% greater than the overall U.S. average. On 4/18/2008 at 09:36:59, a magnitude 5.4 (5.1 MB, 4.8 MS, 5.4 MW, 5.2 MW, Class: Moderate, Intensity: VI - VII) earthquake occurred 219.6 miles away from the city center On 6/10/1987 at 23:48:54, a magnitude 5.1 (4.9 MB, 4.4 MS, 4.6 MS, 5.1 LG) earthquake occurred 194.1 miles away from Plainfield center On 4/18/2008 at 09:36:59, a magnitude 5.2 (5.2 MW, Depth: 8.9 mi) earthquake occurred 219.6 miles away from Plainfield center On 6/28/2004 at 06:10:52, a magnitude 4.2 (4.2 MW, Depth: 6.2 mi, Class: Light, Intensity: IV - V) earthquake occurred 37.7 miles away from the city center On 6/18/2002 at 17:37:15, a magnitude 5.0 (4.3 MB, 4.6 MW, 5.0 LG) earthquake occurred 252.1 miles away from the city center On 4/18/2008 at 15:14:16, a magnitude 4.8 (4.5 MB, 4.8 MW, 4.6 MW) earthquake occurred 218.1 miles away from the city center Magnitude types: regional Lg-wave magnitude (LG), body-wave magnitude (MB), surface-wave magnitude (MS), moment magnitude (MW) Natural disasters: The number of natural disasters in Will County (17) is near the US average (15).Major Disasters (Presidential) Declared: 12Emergencies Declared: 4Storms: 9, Floods: 7, Tornadoes: 5, Snowstorms: 2, Winds: 2, Winter Storms: 2, Blizzard: 1, Hurricane: 1, Snow: 1, Other: 1 (Note: some incidents may be assigned to more than one category). Hospitals and medical centers in Plainfield: BETHESDA LUTHERAN-PLAINFIELD (805 EASTERN AVENUE) LAKEWOOD NRSG AND REHAB CENTER (14716 S EASTERN AVENUE)
FMC - PLAINFIELD (2320 MICHAS DRIVE)
ALL STAR HOME HEALTH CARE CORP (13246 SOUTH ROUTE 59, SUITE 220)
WILLOW HOME CARE, LTD (13246 S ROUTE 59, STE 102)
Airports located in Plainfield: Amtrak stations near Plainfield: 10 miles: JOLIET (50 E. JEFFERSON ST.) Services: ticket office, partially wheelchair accessible, enclosed waiting area, public restrooms, public payphones, vending machines, paid short-term parking, paid long-term parking, public transit connection.
12 miles: NAPERVILLE (E. 4TH & ELLSWORTH AVE.) Services: ticket office, partially wheelchair accessible, enclosed waiting area, public restrooms, public payphones, free short-term parking, free long-term parking, call for taxi service, public transit connection.
18 miles: PLANO (MAIN ST. WEST OF CENTER ST.) Colleges/universities with over 2000 students nearest to Plainfield:
Lewis University (about 7 miles; Romeoville, IL ; Full-time enrollment: 5,739)
University of St Francis (about 9 miles; Joliet, IL ; FT enrollment: 2,454)
Joliet Junior College (about 9 miles; Joliet, IL ; FT enrollment: 11,401)
North Central College (about 12 miles; Naperville, IL ; FT enrollment: 2,860)
Aurora University (about 13 miles; Aurora, IL ; FT enrollment: 4,596)
Benedictine University (about 13 miles; Lisle, IL ; FT enrollment: 5,694)
College of DuPage (about 17 miles; Glen Ellyn, IL ; FT enrollment: 18,910)
Public high schools in Plainfield: PLAINFIELD HIGH SCHOOL Students: 2,723, Location: 24120 W FORT BEGGS DR, Grades: 9-12)PLAINFIELD NORTH HIGH SCHOOL Students: 2,472, Location: 12005 S 248TH AVE, Grades: 9-12)PLAINFIELD SOUTH HIGH SCHOOL Students: 2,285, Location: 7800 CATON FARM RD, Grades: 9-12)PLAINFIELD EAST HIGH SCHOOL Students: 838, Location: 12001 NAPERVILLE RD, Grades: 9-12)PLAINFIELD ACADEMY Students: 54, Location: 23930 W LOCKPORT ST, Grades: 7-12)Biggest public elementary/middle schools in Plainfield: TIMBER RIDGE MIDDLE SCHOOL Students: 1,244, Location: 2101 S BRONK RD, Grades: 6-8)CREEKSIDE ELEMENTARY SCHOOL Students: 1,078, Location: 13909 S BUDLER RD, Grades: PK-5)MEADOW VIEW ELEMENTARY SCHOOL Students: 1,009, Location: 2501 MIRAGE AVE, Grades: PK-5)RIVER VIEW ELEMENTARY SCHOOL Students: 934, Location: 2097 S BRONK RD, Grades: PK-5)JOHN F KENNEDY MIDDLE SCH Students: 904, Location: 12350 ESSINGTON RD, Grades: 6-8)CHARLES REED ELEMENTARY SCH Students: 892, Location: 2110 CLUBLANDS PKWY, Grades: PK-5)DRAUDEN POINT MIDDLE SCHOOL Students: 892, Location: 1911 DRAUDEN RD, Grades: 6-8)LAKEWOOD FALLS ELEM SCHOOL Students: 885, Location: 14050 S BUDLER RD, Grades: PK-5)ORENIC INTERMEDIATE SCHOOL Students: 884, Location: 5820 THEODORE DR, Grades: 5-6)WESMERE ELEMENTARY SCHOOL Students: 879, Location: 2001 WESMERE PKWY, Grades: PK-5)Private elementary/middle schools in Plainfield: ST MARY IMMACULATE PARISH SCHOOL Students: 541, Location: 15629 S ROUTE 59, Grades: PK-8)
ELITE CHILDREN'S ACADEMY Students: 93, Location: 23253 W RENWICK RD, Grades: PK-T1)
See full list of schools located in Plainfield Library in Plainfield: PLAINFIELD PUBLIC LIBRARY DISTRICT Operating income: $3,221,386; Location: 15025 SOUTH ILLINOIS STREET; 103,062 books ; 5,393 e-books ; 6,567 audio materials ; 4,331 video materials ; 35 local licensed databases ; 17 state licensed databases ; 3 other licensed databases ; 460 print serial subscriptions )
User-submitted facts and corrections:
There is a new Christian High School Located in Plainfield -- Christ Lutheran Academy -- address is 23756 W. 127th Street, Plainfield, IL 60585 -- phone is 815-254-8770. Grades 9 - 12.
Notable locations in Plainfield: (A) , Plainfield Public Library (B) , Plainfield Village Hall (C) , Plainfield Fire Protection District Station 1 (D) , Plainfield Fire Protection District Station 4 (E) , Plainfield Fire Protection District Headquarters (F) . Display/hide their locations on the map
Shopping Center: (1) . Display/hide its location on the map
Churches in Plainfield include: (A) , First Baptist Church (B) , Peace Lutheran Church (C) , Plainfield United Methodist Church (D) , Plymouth Congregational Church (E) , Sharon United Methodist Church (F) , Servant of Mary Convent (G) . Display/hide their locations on the map
Cemetery: (1) . Display/hide its location on the map
Lakes and reservoirs: (A) , Puddle Pond (B) . Display/hide their locations on the map
Parks in Plainfield include: (1) , Lake Renwick Heron Rookery Nature Preserve (2) , Ottawa Park (3) , Village Green Park (4) , Four Seasons Park (5) . Display/hide their locations on the map
Tourist attractions: (1) , Big Skoobz & Lil Shaggs...Djs For All Occasions (Arcades & Amusements; 13835 Princeton Court) (2) . Display/hide their approximate locations on the map
Birthplace of: Melissa McCarthy - Film actor, Nate Fox - Basketball player, Lisa Chesson - Ice hockey player, Dave Harbour - Football player.
Will County has a predicted average indoor radon screening level between 2 and 4 pCi/L (pico curies per liter) - Moderate Potential Drinking water stations with addresses in Plainfield and their reported violations in the past:
PLAINFIELD TOWNSHIP (Population served: 35, Groundwater):
Past monitoring violations:
10 regular monitoring violations
Drinking water stations with addresses in Plainfield that have no violations reported:
THREE RIVERS CHURCH (Population served: 600, Primary Water Source Type: Groundwater)
SPRINGBROOK COMMUNITY CHURCH (Population served: 406, Primary Water Source Type: Groundwater)
NAPERBROOK GOLF COURSE (Population served: 300, Primary Water Source Type: Groundwater)
NAPERBROOK GOLF COURSE 3 (Population served: 200, Primary Water Source Type: Groundwater)
PLAINFIELD MOBIL (Population served: 200, Primary Water Source Type: Groundwater)
NAPERBROOK GOLF COURSE 2 (Population served: 200, Primary Water Source Type: Groundwater)
FOND DU LAC RECREATION AREA (Population served: 125, Primary Water Source Type: Groundwater)
PLAINFIELD CONGREGATIONAL CHUR (Population served: 75, Primary Water Source Type: Groundwater)
WHEATLAND UNITED PRESBY CHURCH (Address: 11839 S HEGGS RD Population served: 60, Primary Water Source Type: Groundwater)
NORMANTOWN TRAILS (Population served: 50, Primary Water Source Type: Groundwater)
Average household size: This village:
3.3 peopleIllinois:
2.6 people
Percentage of family households: This village:
85.2%Whole state:
65.8%
Percentage of households with unmarried partners: This village:
4.2%Whole state:
6.3%
Likely homosexual households (counted as self-reported same-sex unmarried-partner households)
Lesbian couples: 0.4% of all households Gay men: 0.3% of all households
109 people in nursing facilities/skilled-nursing facilities in 2010people in nursing homes in 2000people in religious group quarters in 2000
Banks with most branches in Plainfield (2011 data):
First Midwest Bank: Route 59 Supermarket Branch, Plainfield South Branch, Plainfield Main Branch. Info updated 2011/12/22: Bank assets: $7,848.0 mil, Deposits: $6,529.2 mil, headquarters in Itasca, IL, positive income , Commercial Lending Specialization, 100 total offices , Holding Company: First Midwest Bancorp, Inc.
BMO Harris Bank National Association: Plainfield Branch, Plainfield Nlsb Branch, Caton Farm Branch. Info updated 2011/07/14: Bank assets: $97,264.0 mil, Deposits: $75,624.6 mil, headquarters in Chicago, IL, positive income , 717 total offices , Holding Company: Bank Of Montreal
TCF National Bank: Plainfield Jewel Branch at 13460 S. Route 59, branch established on 2001/07/18; Route 59/Plainfield Jewel Br #2218 at 2480 Route 59, branch established on 1997/01/30. Info updated 2009/11/23: Bank assets: $19,007.0 mil, Deposits: $12,377.0 mil, headquarters in Sioux Falls, SD, positive income , Commercial Lending Specialization, 441 total offices , Holding Company: Tcf Financial Corporation
PNC Bank, National Association: Caton Farm Branch at 2402 Route 59, branch established on 2003/06/04; Plainfield - Route 59 Branch at 13470 South Route 59, branch established on 2003/06/09. Info updated 2012/03/20: Bank assets: $263,309.6 mil, Deposits: $197,343.0 mil, headquarters in Wilmington, DE, positive income , Commercial Lending Specialization, 3085 total offices , Holding Company: Pnc Financial Services Group, Inc., The
JPMorgan Chase Bank, National Association: Plainfield at 601 North Illinois Street, branch established on 1961/09/14; Rt 59 And 135th St Branch at 13661 S Rt 59, branch established on 2008/10/15. Info updated 2011/11/10: Bank assets: $1,811,678.0 mil, Deposits: $1,190,738.0 mil, headquarters in Columbus, OH, positive income , International Specialization, 5577 total offices , Holding Company: Jpmorgan Chase & Co.
Citizens First National Bank: Plainfield Branch at 14429 South Route 30, branch established on 2000/08/14. Info updated 2007/05/29: Bank assets: $1,031.8 mil, Deposits: $917.3 mil, headquarters in Princeton, IL, negative income in the last year , Commercial Lending Specialization, 20 total offices , Holding Company: Princeton National Bancorp, Inc.
U.S. Bank National Association: Plainfield Meijer Branch at 13521 South Route 59, branch established on 2006/05/15. Info updated 2012/01/30: Bank assets: $330,470.8 mil, Deposits: $236,091.5 mil, headquarters in Cincinnati, OH, positive income , 3121 total offices , Holding Company: U.S. Bancorp
First Community Bank of Plainfield: First Community Bank Of Plainfield at 14150 S Route 30, branch established on 2008/11/03. Info updated 2011/01/06: Bank assets: $130.1 mil, Deposits: $112.1 mil, local headquarters , positive income , Commercial Lending Specialization, 1 total offices , Holding Company: First Community Financial Partners, Inc.
Oxford Bank & Trust: Plainfield Branch at 13440 Route 59, branch established on 2003/02/10. Info updated 2006/11/03: Bank assets: $485.2 mil, Deposits: $442.6 mil, headquarters in Oak Brook, IL, negative income in the last year , Commercial Lending Specialization, 8 total offices , Holding Company: Oxford Financial Corporation
4 other banks with 4 local branches
For population 15 years and over in Plainfield:
Never married: 29.1%Now married: 61.3%Separated: 0.6%Widowed: 3.2%Divorced: 5.8% For population 25 years and over in Plainfield:
High school or higher: 95.5%Bachelor's degree or higher: 53.8%Graduate or professional degree: 18.3%Unemployed: 3.9%Mean travel time to work (commute): 26.3 minutes
Education Gini index (Inequality in education) Here:
9.7Illinois average:
12.5
Religion statistics for Plainfield, IL (based on Will County data)
Religion Adherents Congregations Catholic 212,252 39 Evangelical Protestant 46,404 188 Mainline Protestant 31,313 73 Other 12,574 20 Black Protestant 7,426 16 Orthodox 1,536 6 None 366,055 -
Source: Clifford Grammich, Kirk Hadaway, Richard Houseal, Dale E.Jones, Alexei Krindatch, Richie Stanley and Richard H.Taylor. 2012. 2010 U.S.Religion Census: Religious Congregations & Membership Study. Association of Statisticians of American Religious Bodies. Jones, Dale E., et al. 2002. Congregations and Membership in the United States 2000. Nashville, TN: Glenmary Research Center. Graphs represent county-level data
Food Environment Statistics: Number of grocery stores : 85This county :
1.27 / 10,000 pop.State :
2.24 / 10,000 pop.
Number of supercenters and club stores : 5Here :
0.07 / 10,000 pop.Illinois :
0.08 / 10,000 pop.
Number of convenience stores (no gas) : 32Will County :
0.48 / 10,000 pop.State :
0.75 / 10,000 pop.
Number of convenience stores (with gas) : 122Will County :
1.82 / 10,000 pop.Illinois :
2.61 / 10,000 pop.
Number of full-service restaurants : 286This county :
4.26 / 10,000 pop.Illinois :
6.86 / 10,000 pop.
Adult diabetes rate : This county :
7.7%Illinois :
8.3%
Adult obesity rate : This county :
26.3%Illinois :
25.2%
Low-income preschool obesity rate : Will County :
13.4%Illinois :
14.5%
Health and Nutrition: Healthy diet rate : Plainfield:
53.1%Illinois:
49.5%
Average overall health of teeth and gums : Plainfield:
53.1%Illinois:
47.2%
People feeling badly about themselves : This city:
20.3%Illinois:
20.5%
People not drinking alcohol at all : Average hours sleeping at night : This city:
6.9Illinois:
6.8
Overweight people : Plainfield:
33.0%State:
33.4%
General health condition : Plainfield:
61.2%Illinois:
56.4%
Average condition of hearing : Plainfield:
81.9%Illinois:
79.9%
More about Health and Nutrition of Plainfield, IL Residents
Local government employment and payroll (March 2022)
Function
Full-time employees
Monthly full-time payroll
Average yearly full-time wage
Part-time employees
Monthly part-time payroll
Police Protection - Officers
60 $552,402 $110,480 0 $0 Streets and Highways
20 $141,960 $85,176 0 $0 Police - Other
13 $68,811 $63,518 12 $29,868 Other and Unallocable
10 $106,633 $127,960 5 $6,301 Water Supply
9 $66,642 $88,856 0 $0 Other Government Administration
9 $80,434 $107,245 15 $6,668 Financial Administration
7 $58,966 $101,085 1 $208 Sewerage
4 $30,030 $90,090 0 $0 Judicial and Legal
2 $19,469 $116,814 0 $0 Natural Resources
1 $8,763 $105,156 0 $0
Totals for Government
135 $1,134,109 $100,810 33 $43,046
Plainfield government finances - Expenditure in 2021 (per resident):
Construction - Regular Highways: $1,593,000 ($34.45)
Water Utilities: $553,000 ($11.96)Central Staff Services: $10,000 ($0.22)Current Operations - Police Protection: $12,876,000 ($278.44)
Water Utilities: $11,725,000 ($253.55)Regular Highways: $10,951,000 ($236.81)Central Staff Services: $5,555,000 ($120.13)Solid Waste Management: $2,690,000 ($58.17)General - Other: $1,045,000 ($22.60)General - Interest on Debt: $1,081,000 ($23.38)
Other Capital Outlay - Regular Highways: $4,261,000 ($92.14)
Water Utilities: $3,555,000 ($76.88)Police Protection: $219,000 ($4.74)Central Staff Services: $194,000 ($4.20)Total Salaries and Wages: $13,424,000 ($290.29)
Plainfield government finances - Revenue in 2021 (per resident):
Charges - Sewerage: $6,030,000 ($130.40)
Other: $5,418,000 ($117.16)Solid Waste Management: $4,709,000 ($101.83)Parking Facilities: $3,000 ($0.06)Federal Intergovernmental - Public Welfare: $1,823,000 ($39.42)
Highways: $1,584,000 ($34.25)Local Intergovernmental - Other: $36,000 ($0.78)
Miscellaneous - Fines and Forfeits: $930,000 ($20.11)
General Revenue - Other: $450,000 ($9.73)Interest Earnings: $173,000 ($3.74)Revenue - Water Utilities: $12,168,000 ($263.13)
State Intergovernmental - General Local Government Support: $11,411,000 ($246.76)
Highways: $2,960,000 ($64.01)Public Welfare: $1,000 ($0.02)Tax - Property: $7,992,000 ($172.83)
Other Selective Sales: $4,896,000 ($105.88)General Sales and Gross Receipts: $4,230,000 ($91.47)Public Utilities Sales: $2,802,000 ($60.59)Other License: $1,725,000 ($37.30)
Plainfield government finances - Debt in 2021 (per resident):
Long Term Debt - Beginning Outstanding - Unspecified Public Purpose: $47,945,000 ($1036.81)
Outstanding Unspecified Public Purpose: $36,555,000 ($790.50)Retired Unspecified Public Purpose: $15,783,000 ($341.31)Issue, Unspecified Public Purpose: $4,393,000 ($95.00)
Plainfield government finances - Cash and Securities in 2021 (per resident):
Other Funds - Cash and Securities: $57,963,000 ($1253.44)
6.75% of this county's 2021 resident taxpayers lived in other counties in 2020 ($73,828 average adjusted gross income )
Here:
6.75%Illinois average:
5.09%
0.01% of residents moved from foreign countries ($43 average AGI )Will County:
0.01%Illinois average:
0.01%
Top counties from which taxpayers relocated into this county between 2020 and 2021:
6.85% of this county's 2020 resident taxpayers moved to other counties in 2021 ($78,688 average adjusted gross income )
Here:
6.85%Illinois average:
6.10%
0.01% of residents moved to foreign countries ($42 average AGI )Will County:
0.01%Illinois average:
0.01%
Top counties to which taxpayers relocated from this county between 2020 and 2021:
Businesses in Plainfield, IL
Name Count Name Count
7-Eleven 1 La-Z-Boy 1 ALDI 2 Little Caesars Pizza 1 AT&T 1 MasterBrand Cabinets 1 Ace Hardware 2 Maurices 1 Advance Auto Parts 1 McDonald's 2 Arby's 1 Meijer 1 AutoZone 1 Menards 1 Baskin-Robbins 1 Nike 3 Blockbuster 1 OfficeMax 1 Buffalo Wild Wings 1 Panda Express 1 Burger King 2 Panera Bread 2 CVS 1 Payless 1 Chevrolet 1 Penske 1 Circle K 1 Pizza Hut 1 Cricket Wireless 1 Red Robin 1 Curves 1 Sprint Nextel 2 Dairy Queen 1 Staples 1 DressBarn 1 Starbucks 1 Dressbarn 1 Subway 4 Dunkin Donuts 3 T-Mobile 1 FedEx 10 Taco Bell 1 Firestone Complete Auto Care 1 Target 1 Ford 1 The Room Place 1 GNC 2 U-Haul 2 GameStop 1 UPS 5 H&R Block 2 Verizon Wireless 2 Jewel-Osco 2 Walgreens 3 Jimmy John's 1 Walmart 1 Just Tires 1 Wendy's 1 KFC 1 White Castle 1 Kohl's 2 YMCA 1 LA Fitness 1
Strongest AM radio stations in Plainfield:
WYLL (1160 AM; 50 kW; CHICAGO, IL; Owner: SCA LICENSE CORPORATION)
WMVP (1000 AM; 50 kW; CHICAGO, IL; Owner: ABC, INC.)
WLS (890 AM; 50 kW; CHICAGO, IL; Owner: WLS, INC.)
WSCR (670 AM; 50 kW; CHICAGO, IL; Owner: INFINITY BROADCASTING OPERATIONS, INC.)
WBBM (780 AM; 50 kW; CHICAGO, IL; Owner: INFINITY BROADCASTING OPERATIONS, INC.)
WGN (720 AM; 50 kW; CHICAGO, IL; Owner: WGN CONTINENTAL BROADCASTING CO.)
WAUR (930 AM; 4 kW; SANDWICH, IL; Owner: CHRISTIAN BROADCASTING SYSTEM, LTD.)
WVIV (1200 AM; 20 kW; CHICAGO, IL; Owner: WLXX-AM LICENSE CORP.)
WAGG (610 AM; BIRMINGHAM, AL; Owner: CXR HOLDINGS, INC.)
WTMJ (620 AM; 50 kW; MILWAUKEE, WI; Owner: JOURNAL BROADCAST CORPORATION)
WJOL (1340 AM; 1 kW; JOLIET, IL; Owner: NM LICENSING, LLC)
WMBI (1110 AM; daytime; 5 kW; CHICAGO, IL; Owner: THE MOODY BIBLE INSTITUTE OF CHICAGO)
WISN (1130 AM; 50 kW; MILWAUKEE, WI; Owner: CAPSTAR TX LIMITED PARTNERSHIP)
Strongest FM radio stations in Plainfield:
WERV-FM (95.9 FM; AURORA, IL; Owner: NM LICENSING, LLC)
WJTW (93.5 FM; JOLIET, IL; Owner: NM LICENSING, LLC)
WLEY-FM (107.9 FM; AURORA, IL; Owner: WLEY LICENSING, INC.)
WCCQ (98.3 FM; CREST HILL, IL; Owner: THREE EAGLES OF JOLIET, INC.)
WJCH (91.9 FM; JOLIET, IL; Owner: FAMILY STATIONS, INC.)
WCKG (105.9 FM; ELMWOOD PARK, IL; Owner: INFINITY HOLDINGS CORPORATION OF ORLANDO)
WLIT-FM (93.9 FM; CHICAGO, IL; Owner: AMFM RADIO LICENSES, L.L.C.)
WJMK (104.3 FM; CHICAGO, IL; Owner: INFINITY BROADCASTING CORP. OF ILLINOIS)
WNUA (95.5 FM; CHICAGO, IL; Owner: AMFM RADIO LICENSES, L.L.C.)
WTMX (101.9 FM; SKOKIE, IL; Owner: BONNEVILLE HOLDING COMPANY)
WBBM-FM (96.3 FM; CHICAGO, IL; Owner: INFINITY BROADCASTING OPERATIONS, INC.)
WKSC-FM (103.5 FM; CHICAGO, IL; Owner: AMFM RADIO LICENSES, L.L.C.)
WGCI-FM (107.5 FM; CHICAGO, IL; Owner: AMFM RADIO LICENSES, L.L.C.)
WFMT (98.7 FM; CHICAGO, IL; Owner: WINDOW TO THE WORLD COMMUNICATIONS)
WZZN (94.7 FM; CHICAGO, IL; Owner: ABC CHICAGO FM RADIO,INC.)
WLLI-FM (96.7 FM; JOLIET, IL; Owner: NM LICENSING, LLC)
WBEZ (91.5 FM; CHICAGO, IL; Owner: THE WBEZ ALLIANCE, INC.)
WKQX (101.1 FM; CHICAGO, IL; Owner: EMMIS RADIO LICENSE CORPORATION)
WLUP-FM (97.9 FM; CHICAGO, IL; Owner: BONNEVILLE HOLDING COMPANY)
WNND (100.3 FM; CHICAGO, IL; Owner: BONNEVILLE HOLDING COMPANY)
TV broadcast stations around Plainfield:
WLS-TV (Channel 7; CHICAGO, IL; Owner: WLS TELEVISION, INC.)
WMAQ-TV (Channel 5; CHICAGO, IL; Owner: NBC SUBSIDIARY (WMAQ-TV), INC.)
WTTW (Channel 11; CHICAGO, IL; Owner: WINDOW TO THE WORLD COMMUNICATIONS, INC.)
WGN-TV (Channel 9; CHICAGO, IL; Owner: WGN CONTINENTAL BROADCASTING COMPANY)
WGBO-TV (Channel 66; JOLIET, IL; Owner: WGBO LICENSE PARTNERSHIP, G.P.)
WBBM-TV (Channel 2; CHICAGO, IL; Owner: CBS BROADCASTING INC.)
WPWR-TV (Channel 50; GARY, IN; Owner: FOX TELEVISION STATIONS, INC.)
WXFT (Channel 60; AURORA, IL; Owner: TELEFUTURA CHICAGO LLC)
WCIU-TV (Channel 26; CHICAGO, IL; Owner: WCIU-TV LIMITED PARTNERSHIP)
WCPX (Channel 38; CHICAGO, IL; Owner: PAXSON CHICAGO LICENSE, INC.)
WFLD (Channel 32; CHICAGO, IL; Owner: FOX TELEVISION STATIONS, INC.)
W68DO (Channel 68; PALATINE, IL; Owner: TRINITY BROADCASTING NETWORK)
WFBT-CA (Channel 23; CHICAGO, IL; Owner: CHANNEL 23 LIMITED PARTNERSHIP)
W24AJ (Channel 24; AURORA, IL; Owner: NELSON TV, INC.)
WJYS (Channel 62; HAMMOND, IN; Owner: JOVON BROADCASTING CORPORATION)
WSNS-TV (Channel 44; CHICAGO, IL; Owner: TELEMUNDO OF CHICAGO, INC.)
W34CK (Channel 34; ARLINGTON HEIGHTS, IL; Owner: FIRST UNITED, INC.)
WOCH-LP (Channel 28; CHICAGO, IL; Owner: KM LPTV OF CHICAGO-28, L.L.C.)
WYCC (Channel 20; CHICAGO, IL; Owner: COLLEGE DIST. #508, COUNTY OF COOK)
WOCK-CA (Channel 13; CHICAGO, IL; Owner: KM LPTV OF CHICAGO-13, L.L.C.)
WYIN (Channel 56; GARY, IN; Owner: NORTHWEST INDIANA PUBLIC BROADCASTING, INC.)
WSPY-LP (Channel 30; PLANO, IL; Owner: WSPY-TV, INC.)
WWTO-TV (Channel 35; LASALLE, IL; Owner: TRINITY BROADCASTING NETWORK)
W54AP (Channel 54; BLUE ISLAND, IL; Owner: CATHOLIC VIEWS BROADCASTS, INC.)
W57DN (Channel 57; ELGIN, IL; Owner: TRINITY BROADCASTING NETWORK)
National Bridge Inventory (NBI) Statistics 39 Number of bridges367ft / 112m Total length $3,043,000 Total costs618,600 Total average daily traffic66,916 Total average daily truck traffic
New bridges - historical statistics
1 1900-1909 1 1920-1929 4 1950-1959 1 1960-1969 2 1970-1979 4 1980-1989 9 1990-1999 16 2000-2009 1 2010-2019
See full National Bridge Inventory statistics for Plainfield, IL
Home Mortgage Disclosure Act Aggregated Statistics For Year 2009(Based on 4 partial tracts) A) FHA, FSA/RHS & VA B) Conventional C) Refinancings D) Home Improvement Loans F) Non-occupant Loans on G) Loans On Manufactured Number Average Value Number Average Value Number Average Value Number Average Value Number Average Value Number Average Value
LOANS ORIGINATED 136 $189,258 69 $173,901 574 $201,128 13 $117,238 20 $162,498 1 $133,960 APPLICATIONS APPROVED, NOT ACCEPTED 9 $174,636 6 $182,848 60 $206,800 1 $16,040 3 $149,860 0 $0 APPLICATIONS DENIED 25 $171,972 14 $194,245 187 $216,840 10 $55,689 6 $167,467 0 $0 APPLICATIONS WITHDRAWN 13 $181,442 7 $179,491 108 $208,449 2 $126,395 0 $0 0 $0 FILES CLOSED FOR INCOMPLETENESS 4 $153,748 3 $159,920 51 $213,011 1 $169,430 1 $260,190 0 $0
Aggregated Statistics For Year 2008(Based on 4 partial tracts) A) FHA, FSA/RHS & VA B) Conventional C) Refinancings D) Home Improvement Loans E) Loans on Dwellings For 5+ Families F) Non-occupant Loans on G) Loans On Manufactured Number Average Value Number Average Value Number Average Value Number Average Value Number Average Value Number Average Value Number Average Value
LOANS ORIGINATED 83 $212,195 139 $199,435 373 $207,702 15 $97,494 2 $4,072,805 27 $229,312 0 $0 APPLICATIONS APPROVED, NOT ACCEPTED 6 $192,947 15 $227,016 68 $205,545 5 $45,150 0 $0 2 $149,075 0 $0 APPLICATIONS DENIED 23 $206,742 25 $187,095 256 $225,556 29 $53,292 0 $0 12 $154,246 1 $22,030 APPLICATIONS WITHDRAWN 12 $206,558 18 $213,033 114 $226,220 6 $148,770 0 $0 3 $131,113 0 $0 FILES CLOSED FOR INCOMPLETENESS 3 $227,500 6 $209,123 28 $215,340 2 $40,390 0 $0 2 $143,075 0 $0
Aggregated Statistics For Year 2007(Based on 4 partial tracts) A) FHA, FSA/RHS & VA B) Conventional C) Refinancings D) Home Improvement Loans E) Loans on Dwellings For 5+ Families F) Non-occupant Loans on G) Loans On Manufactured Number Average Value Number Average Value Number Average Value Number Average Value Number Average Value Number Average Value Number Average Value
LOANS ORIGINATED 28 $223,544 375 $192,345 563 $188,438 55 $75,387 1 $563,980 39 $173,450 0 $0 APPLICATIONS APPROVED, NOT ACCEPTED 2 $252,145 43 $188,156 120 $181,092 11 $43,539 0 $0 4 $155,322 0 $0 APPLICATIONS DENIED 6 $232,648 73 $202,274 371 $198,377 64 $77,447 0 $0 19 $193,024 1 $29,650 APPLICATIONS WITHDRAWN 4 $202,310 46 $201,642 157 $207,928 13 $135,892 0 $0 4 $213,955 0 $0 FILES CLOSED FOR INCOMPLETENESS 0 $0 13 $204,497 56 $221,920 2 $46,430 0 $0 1 $197,810 0 $0
Aggregated Statistics For Year 2006(Based on 4 partial tracts) A) FHA, FSA/RHS & VA B) Conventional C) Refinancings D) Home Improvement Loans F) Non-occupant Loans on G) Loans On Manufactured Number Average Value Number Average Value Number Average Value Number Average Value Number Average Value Number Average Value
LOANS ORIGINATED 32 $218,720 691 $175,262 702 $175,632 69 $72,638 59 $170,041 0 $0 APPLICATIONS APPROVED, NOT ACCEPTED 4 $231,702 85 $171,189 129 $168,788 26 $75,076 7 $162,720 0 $0 APPLICATIONS DENIED 4 $257,512 149 $174,159 359 $186,371 67 $66,629 15 $175,413 1 $74,840 APPLICATIONS WITHDRAWN 3 $204,910 71 $191,480 202 $189,987 12 $118,230 9 $167,367 0 $0 FILES CLOSED FOR INCOMPLETENESS 0 $0 16 $218,967 69 $202,326 3 $119,200 1 $229,610 0 $0
Aggregated Statistics For Year 2005(Based on 4 partial tracts) A) FHA, FSA/RHS & VA B) Conventional C) Refinancings D) Home Improvement Loans E) Loans on Dwellings For 5+ Families F) Non-occupant Loans on G) Loans On Manufactured Number Average Value Number Average Value Number Average Value Number Average Value Number Average Value Number Average Value Number Average Value
LOANS ORIGINATED 67 $206,040 932 $172,313 805 $174,583 57 $76,812 0 $0 62 $163,956 2 $40,780 APPLICATIONS APPROVED, NOT ACCEPTED 3 $233,493 99 $163,225 133 $172,401 14 $71,491 0 $0 9 $165,287 0 $0 APPLICATIONS DENIED 10 $202,986 136 $169,380 398 $186,698 54 $47,136 1 $73,850 16 $150,660 0 $0 APPLICATIONS WITHDRAWN 4 $211,350 115 $180,191 263 $200,215 19 $164,079 0 $0 13 $162,489 0 $0 FILES CLOSED FOR INCOMPLETENESS 2 $245,140 25 $173,479 73 $199,360 5 $66,482 0 $0 2 $138,480 0 $0
Aggregated Statistics For Year 2004(Based on 4 partial tracts) A) FHA, FSA/RHS & VA B) Conventional C) Refinancings D) Home Improvement Loans E) Loans on Dwellings For 5+ Families F) Non-occupant Loans on G) Loans On Manufactured Number Average Value Number Average Value Number Average Value Number Average Value Number Average Value Number Average Value Number Average Value
LOANS ORIGINATED 72 $192,623 735 $178,280 747 $170,334 64 $58,197 1 $544,010 56 $165,219 1 $10,950 APPLICATIONS APPROVED, NOT ACCEPTED 6 $200,410 86 $178,591 113 $170,482 13 $52,062 0 $0 6 $142,807 0 $0 APPLICATIONS DENIED 14 $191,898 95 $174,104 352 $167,836 64 $47,458 0 $0 10 $141,516 1 $47,760 APPLICATIONS WITHDRAWN 8 $200,130 61 $186,241 206 $177,749 12 $59,790 0 $0 7 $158,983 0 $0 FILES CLOSED FOR INCOMPLETENESS 3 $201,760 19 $186,291 68 $185,411 8 $62,225 0 $0 2 $95,700 0 $0
Aggregated Statistics For Year 2003(Based on 4 partial tracts) A) FHA, FSA/RHS & VA B) Conventional C) Refinancings D) Home Improvement Loans F) Non-occupant Loans on Number Average Value Number Average Value Number Average Value Number Average Value Number Average Value
LOANS ORIGINATED 142 $176,501 594 $174,134 1,626 $159,022 39 $30,604 46 $133,035 APPLICATIONS APPROVED, NOT ACCEPTED 7 $178,429 54 $182,678 201 $155,641 9 $32,164 3 $125,433 APPLICATIONS DENIED 16 $173,652 57 $169,924 378 $147,210 34 $33,154 9 $147,281 APPLICATIONS WITHDRAWN 11 $165,803 46 $171,257 303 $160,996 6 $38,577 5 $119,184 FILES CLOSED FOR INCOMPLETENESS 2 $199,710 9 $163,738 52 $166,167 3 $63,270 0 $0
Aggregated Statistics For Year 2002(Based on 4 partial tracts) A) FHA, FSA/RHS & VA B) Conventional C) Refinancings D) Home Improvement Loans F) Non-occupant Loans on Number Average Value Number Average Value Number Average Value Number Average Value Number Average Value
LOANS ORIGINATED 152 $169,842 532 $169,201 1,110 $152,976 39 $26,248 23 $135,405 APPLICATIONS APPROVED, NOT ACCEPTED 12 $175,852 49 $170,219 138 $143,867 10 $28,717 1 $193,390 APPLICATIONS DENIED 16 $173,056 48 $154,340 251 $128,363 29 $21,950 4 $111,175 APPLICATIONS WITHDRAWN 9 $170,074 41 $167,949 159 $146,743 6 $28,485 1 $130,300 FILES CLOSED FOR INCOMPLETENESS 3 $167,317 10 $180,128 67 $162,743 2 $15,790 1 $141,510
Aggregated Statistics For Year 2001(Based on 4 partial tracts) A) FHA, FSA/RHS & VA B) Conventional C) Refinancings D) Home Improvement Loans E) Loans on Dwellings For 5+ Families F) Non-occupant Loans on Number Average Value Number Average Value Number Average Value Number Average Value Number Average Value Number Average Value
LOANS ORIGINATED 168 $160,596 454 $154,378 876 $142,410 47 $24,371 1 $477,630 15 $130,731 APPLICATIONS APPROVED, NOT ACCEPTED 27 $160,608 44 $167,337 88 $102,123 13 $24,612 0 $0 2 $124,890 APPLICATIONS DENIED 12 $157,572 28 $180,977 251 $116,856 41 $20,604 0 $0 3 $101,493 APPLICATIONS WITHDRAWN 15 $165,501 32 $171,318 128 $133,479 10 $33,956 0 $0 4 $96,732 FILES CLOSED FOR INCOMPLETENESS 3 $176,697 6 $192,635 40 $134,408 1 $18,020 0 $0 1 $167,150
Aggregated Statistics For Year 2000(Based on 4 partial tracts) A) FHA, FSA/RHS & VA B) Conventional C) Refinancings D) Home Improvement Loans E) Loans on Dwellings For 5+ Families F) Non-occupant Loans on Number Average Value Number Average Value Number Average Value Number Average Value Number Average Value Number Average Value
LOANS ORIGINATED 157 $149,263 428 $145,738 159 $97,944 60 $22,137 2 $108,480 12 $125,868 APPLICATIONS APPROVED, NOT ACCEPTED 17 $152,314 38 $149,194 41 $82,043 17 $26,380 0 $0 1 $90,150 APPLICATIONS DENIED 16 $141,123 39 $147,678 134 $80,408 48 $19,138 0 $0 2 $57,240 APPLICATIONS WITHDRAWN 11 $145,741 31 $148,701 52 $81,967 5 $20,658 0 $0 2 $59,605 FILES CLOSED FOR INCOMPLETENESS 4 $150,588 9 $137,129 24 $136,390 1 $44,480 0 $0 0 $0
Aggregated Statistics For Year 1999(Based on 4 partial tracts) A) FHA, FSA/RHS & VA B) Conventional C) Refinancings D) Home Improvement Loans F) Non-occupant Loans on Number Average Value Number Average Value Number Average Value Number Average Value Number Average Value
LOANS ORIGINATED 152 $144,644 401 $139,002 296 $108,715 63 $20,488 11 $96,099 APPLICATIONS APPROVED, NOT ACCEPTED 8 $148,106 39 $140,665 44 $101,428 12 $20,738 1 $30,640 APPLICATIONS DENIED 14 $143,504 30 $130,448 121 $97,096 40 $23,593 2 $67,670 APPLICATIONS WITHDRAWN 14 $152,135 39 $143,976 64 $109,386 5 $41,364 1 $58,270 FILES CLOSED FOR INCOMPLETENESS 1 $196,760 3 $160,000 28 $125,885 2 $42,225 1 $8,480
Detailed HMDA statistics for the following Tracts:
8804.04
, 8804.05 , 8804.07
Private Mortgage Insurance Companies Aggregated Statistics For Year 2009(Based on 4 partial tracts) A) Conventional B) Refinancings C) Non-occupant Loans on Number Average Value Number Average Value Number Average Value
LOANS ORIGINATED 14 $209,529 16 $235,226 0 $0 APPLICATIONS APPROVED, NOT ACCEPTED 4 $198,092 8 $247,200 0 $0 APPLICATIONS DENIED 3 $182,050 5 $197,004 1 $100,190 APPLICATIONS WITHDRAWN 1 $130,190 1 $268,610 0 $0 FILES CLOSED FOR INCOMPLETENESS 0 $0 1 $189,540 0 $0
Aggregated Statistics For Year 2008(Based on 4 partial tracts) A) Conventional B) Refinancings C) Non-occupant Loans on Number Average Value Number Average Value Number Average Value
LOANS ORIGINATED 60 $224,597 53 $239,637 4 $182,025 APPLICATIONS APPROVED, NOT ACCEPTED 20 $237,896 39 $247,194 1 $231,320 APPLICATIONS DENIED 7 $221,689 6 $229,577 2 $174,650 APPLICATIONS WITHDRAWN 5 $198,814 4 $226,762 0 $0 FILES CLOSED FOR INCOMPLETENESS 2 $183,750 1 $363,560 2 $190,590
Aggregated Statistics For Year 2007(Based on 4 partial tracts) A) Conventional B) Refinancings C) Non-occupant Loans on Number Average Value Number Average Value Number Average Value
LOANS ORIGINATED 117 $234,781 75 $234,946 5 $198,596 APPLICATIONS APPROVED, NOT ACCEPTED 18 $247,708 18 $235,873 1 $136,920 APPLICATIONS DENIED 3 $188,433 1 $182,320 0 $0 APPLICATIONS WITHDRAWN 7 $226,697 3 $227,910 0 $0 FILES CLOSED FOR INCOMPLETENESS 0 $0 0 $0 0 $0
Aggregated Statistics For Year 2006(Based on 4 partial tracts) A) Conventional B) Refinancings C) Non-occupant Loans on Number Average Value Number Average Value Number Average Value
LOANS ORIGINATED 113 $235,835 40 $229,111 3 $241,320 APPLICATIONS APPROVED, NOT ACCEPTED 13 $225,343 11 $216,273 1 $135,550 APPLICATIONS DENIED 1 $126,630 1 $173,440 0 $0 APPLICATIONS WITHDRAWN 4 $246,412 2 $248,615 0 $0 FILES CLOSED FOR INCOMPLETENESS 0 $0 0 $0 0 $0
Aggregated Statistics For Year 2005(Based on 4 partial tracts) A) Conventional B) Refinancings C) Non-occupant Loans on Number Average Value Number Average Value Number Average Value
LOANS ORIGINATED 118 $224,542 65 $206,508 3 $200,040 APPLICATIONS APPROVED, NOT ACCEPTED 20 $219,003 18 $193,469 1 $138,470 APPLICATIONS DENIED 1 $323,320 0 $0 0 $0 APPLICATIONS WITHDRAWN 7 $217,890 5 $198,996 1 $123,400 FILES CLOSED FOR INCOMPLETENESS 0 $0 1 $231,130 0 $0
Aggregated Statistics For Year 2004(Based on 4 partial tracts) A) Conventional B) Refinancings C) Non-occupant Loans on D) Loans On Manufactured Number Average Value Number Average Value Number Average Value Number Average Value
LOANS ORIGINATED 128 $205,869 80 $191,782 5 $158,070 1 $104,840 APPLICATIONS APPROVED, NOT ACCEPTED 19 $211,259 36 $179,396 1 $145,950 0 $0 APPLICATIONS DENIED 3 $217,883 1 $211,630 1 $173,980 0 $0 APPLICATIONS WITHDRAWN 7 $205,404 5 $176,238 0 $0 0 $0 FILES CLOSED FOR INCOMPLETENESS 0 $0 0 $0 0 $0 0 $0
Aggregated Statistics For Year 2003(Based on 4 partial tracts) A) Conventional B) Refinancings C) Non-occupant Loans on Number Average Value Number Average Value Number Average Value
LOANS ORIGINATED 169 $190,340 232 $172,407 8 $148,771 APPLICATIONS APPROVED, NOT ACCEPTED 21 $194,659 57 $175,231 1 $150,580 APPLICATIONS DENIED 2 $230,845 6 $186,233 1 $293,280 APPLICATIONS WITHDRAWN 6 $196,645 14 $183,364 1 $229,290 FILES CLOSED FOR INCOMPLETENESS 0 $0 1 $199,970 0 $0
Aggregated Statistics For Year 2002(Based on 4 partial tracts) A) Conventional B) Refinancings C) Non-occupant Loans on Number Average Value Number Average Value Number Average Value
LOANS ORIGINATED 191 $180,807 183 $170,970 4 $146,480 APPLICATIONS APPROVED, NOT ACCEPTED 27 $178,844 35 $162,325 1 $95,610 APPLICATIONS DENIED 3 $166,133 4 $184,010 0 $0 APPLICATIONS WITHDRAWN 6 $164,027 13 $172,919 2 $179,595 FILES CLOSED FOR INCOMPLETENESS 1 $150,400 1 $217,720 0 $0
Aggregated Statistics For Year 2001(Based on 4 partial tracts) A) Conventional B) Refinancings C) Non-occupant Loans on Number Average Value Number Average Value Number Average Value
LOANS ORIGINATED 204 $170,287 147 $161,332 4 $119,870 APPLICATIONS APPROVED, NOT ACCEPTED 26 $163,281 21 $158,000 1 $120,660 APPLICATIONS DENIED 7 $158,410 6 $168,152 0 $0 APPLICATIONS WITHDRAWN 6 $180,448 5 $185,690 0 $0 FILES CLOSED FOR INCOMPLETENESS 1 $91,330 1 $71,350 0 $0
Aggregated Statistics For Year 2000(Based on 4 partial tracts) A) Conventional B) Refinancings C) Non-occupant Loans on Number Average Value Number Average Value Number Average Value
LOANS ORIGINATED 158 $167,233 19 $146,678 1 $104,670 APPLICATIONS APPROVED, NOT ACCEPTED 20 $157,582 4 $142,598 0 $0 APPLICATIONS DENIED 3 $152,017 1 $265,170 0 $0 APPLICATIONS WITHDRAWN 5 $150,904 1 $187,880 0 $0 FILES CLOSED FOR INCOMPLETENESS 1 $194,670 0 $0 0 $0
Aggregated Statistics For Year 1999(Based on 4 partial tracts) A) Conventional B) Refinancings C) Non-occupant Loans on Number Average Value Number Average Value Number Average Value
LOANS ORIGINATED 163 $150,152 69 $145,299 1 $134,760 APPLICATIONS APPROVED, NOT ACCEPTED 21 $144,054 10 $138,088 0 $0 APPLICATIONS DENIED 5 $135,734 2 $168,250 0 $0 APPLICATIONS WITHDRAWN 6 $162,165 2 $145,310 0 $0 FILES CLOSED FOR INCOMPLETENESS 1 $140,110 0 $0 0 $0
Detailed PMIC statistics for the following Tracts:
8804.04
, 8804.05 , 8804.07
Most common first names in Plainfield, IL among deceased individuals Name Count Lived (average)
Robert 102 73.7 years John 100 74.6 years Mary 90 81.1 years William 70 73.6 years Joseph 67 77.9 years Helen 62 81.8 years Edward 59 76.8 years James 52 73.2 years George 52 75.2 years Richard 49 69.1 years
Most common last names in Plainfield, IL among deceased individuals Last name Count Lived (average)
Smith 39 75.1 years Anderson 21 75.2 years Brown 18 80.4 years Johnson 18 75.2 years Miller 17 71.1 years Thompson 13 76.9 years Davis 12 77.1 years Patterson 11 77.8 years Lambert 10 81.7 years Sullivan 10 76.0 years
Plainfield compared to Illinois state average:
Median household income above state average. Median house value above state average. Unemployed percentage significantly below state average. Black race population percentage above state average. Median age below state average. Foreign-born population percentage significantly above state average. Renting percentage significantly below state average. Length of stay since moving in above state average. Number of rooms per house above state average. House age significantly below state average. Number of college students above state average. Percentage of population with a bachelor's degree or higher above state average. Plainfield on our top lists :
#17 on the list of "Top 101 cities with the largest percentage population increase from 2000 (population 5,000+)"
#49 on the list of "Top 100 cities with highest median household income and median resident age less than 35"
#65 on the list of "Top 101 cities with the most residents born in Pakistan (population 500+)"
#7 on the list of "Top 101 counties with the lowest percentage of residents relocating from foreign countries between 2010 and 2011"
#10 on the list of "Top 101 counties with the highest percentage of residents that drank alcohol in the past 30 days"
#18 on the list of "Top 101 counties with the largest increase in the number of infant deaths per 1000 residents 2000-2006 to 2007-2013 (pop. 50,000+)"
#19 on the list of "Top 101 counties with the largest decrease in the number of births per 1000 residents 2000-2006 to 2007-2013 (pop 50,000+)"
#48 on the list of "Top 101 counties with the lowest surface withdrawal of fresh water for public supply (pop. 50,000+)"
Top Patent Applicants
Robert T. Thurman (44)
Philippe Sartori (36)
Bruce A. Keiser (23)
Gregory L. Kuffel (23)
Chongxi Yu (17)
Steven Michael Schennum (16)
Anirudha V. Sumant (15)
Larry Mitchell Grela (15)
Peter E. Reed (14)
Ramasubramanian Anand (13)
Total of 986 patent applications in 2008-2024.

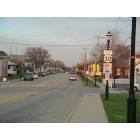
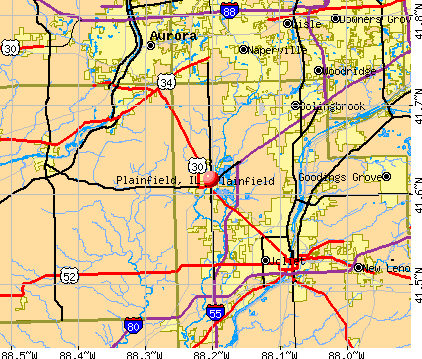


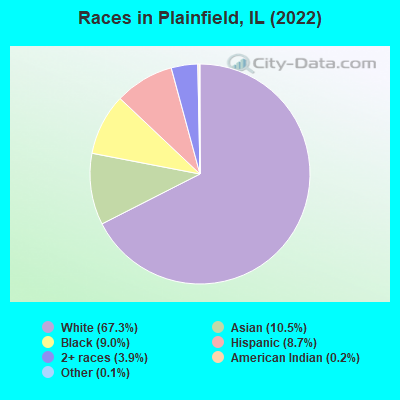
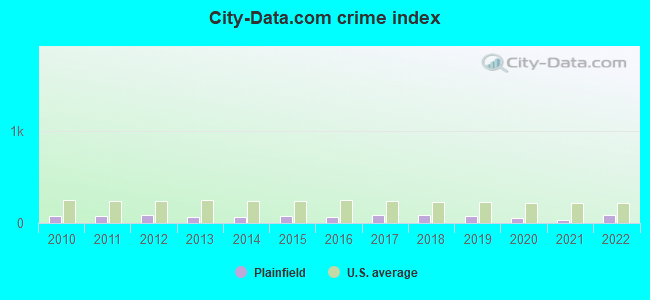
 Recent articles from our blog. Our writers, many of them Ph.D. graduates or candidates, create easy-to-read articles on a wide variety of topics.

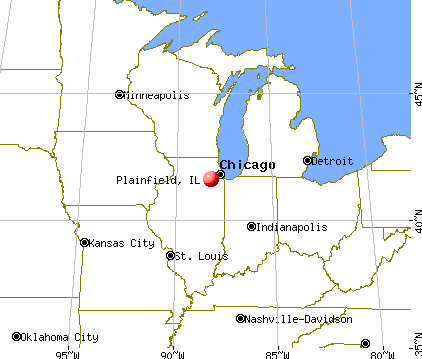
 (7.6 miles
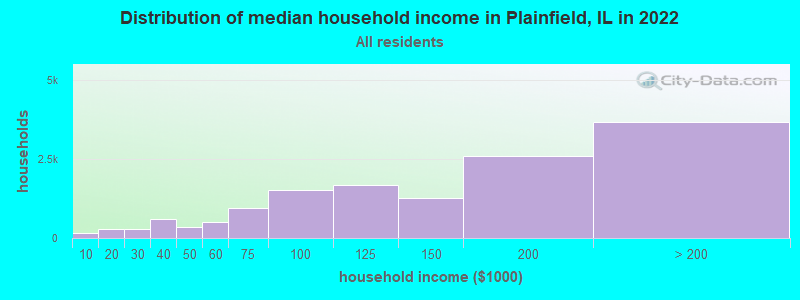
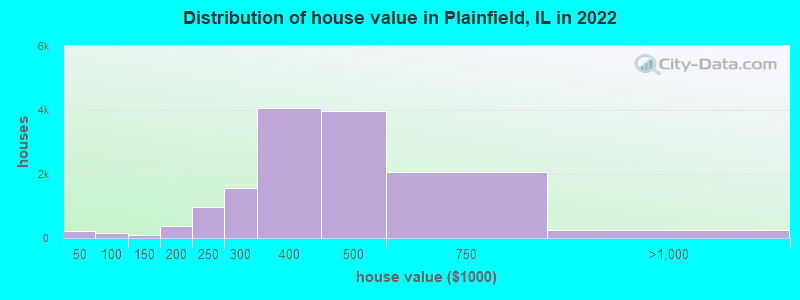
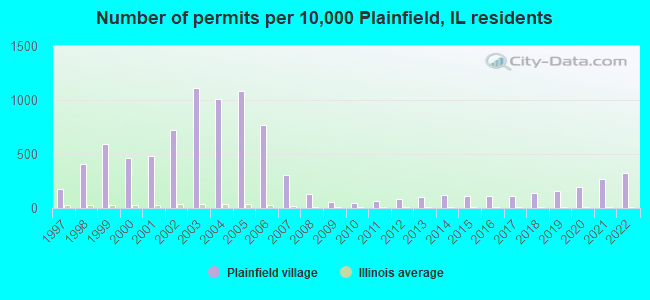
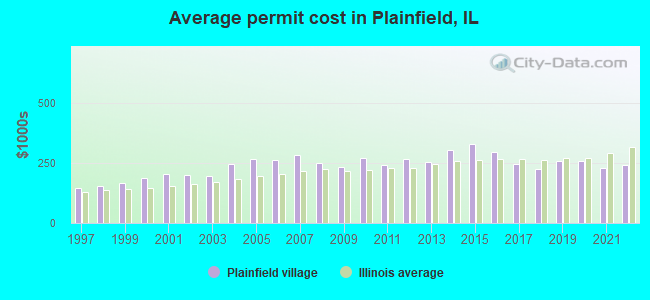
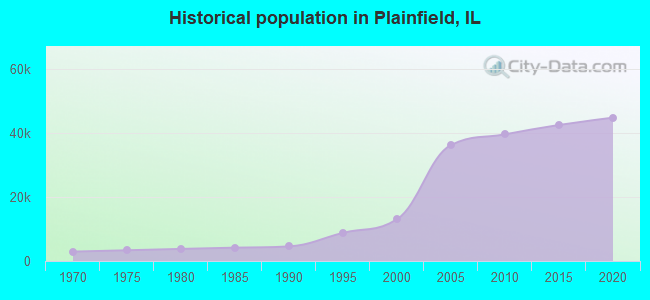

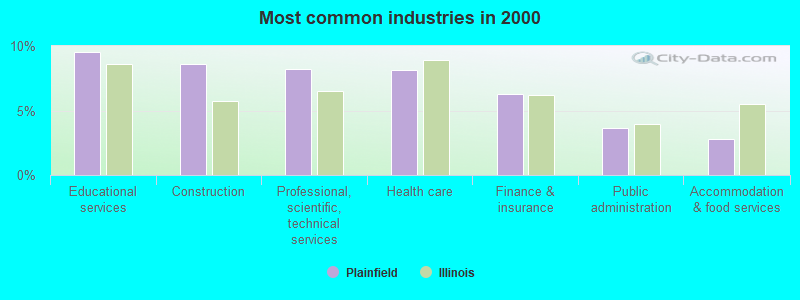
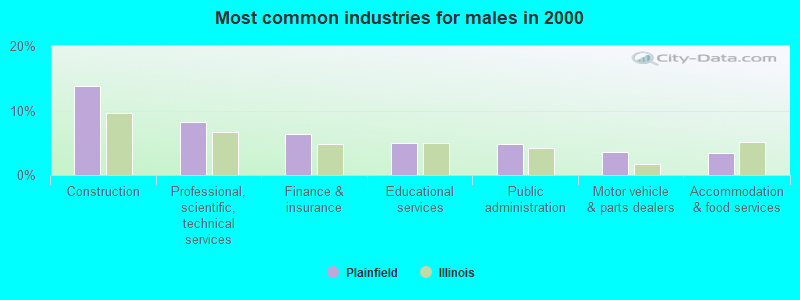
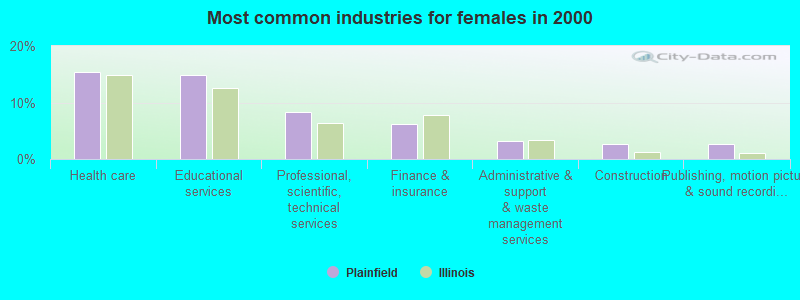
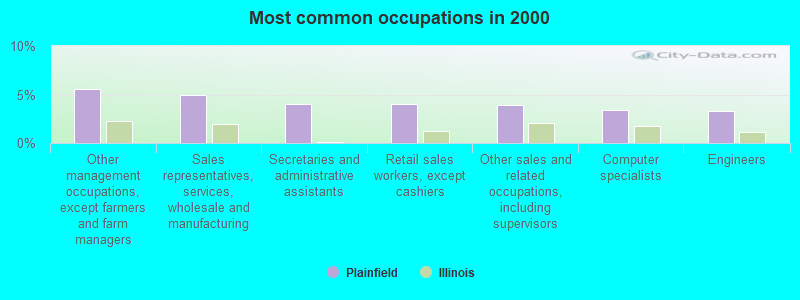
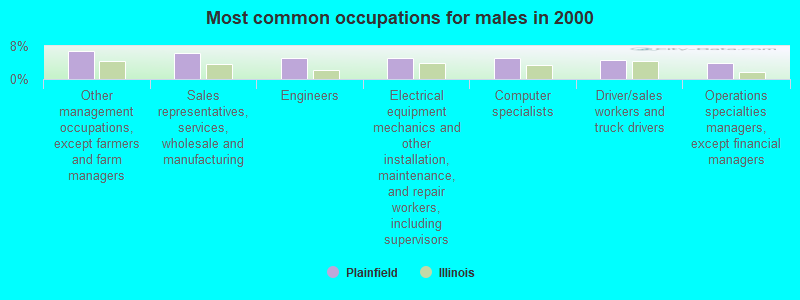
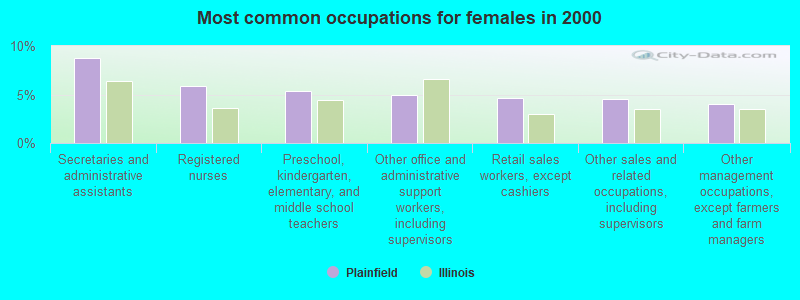
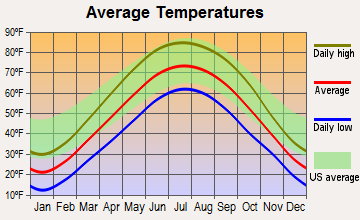
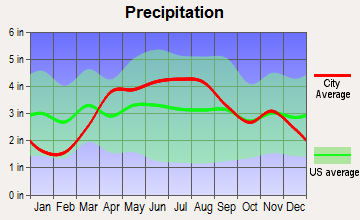
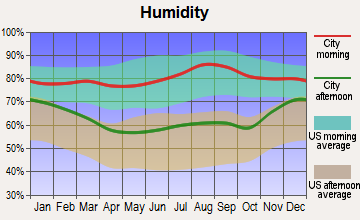
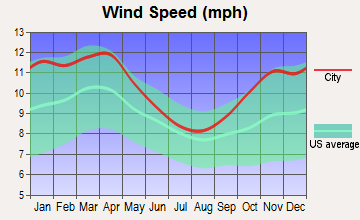
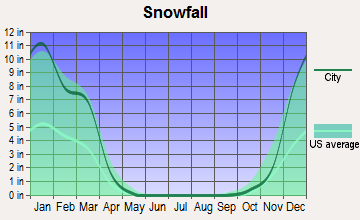
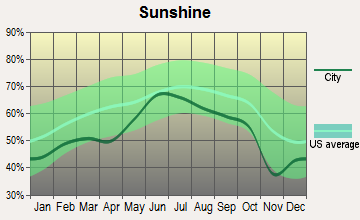
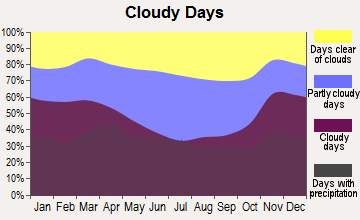
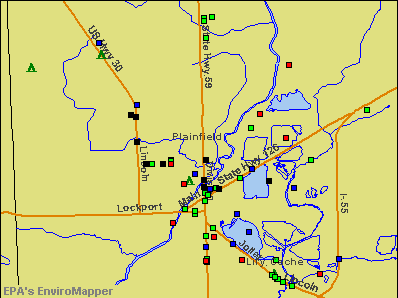

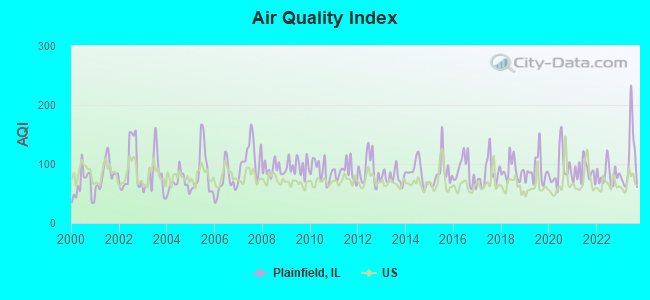
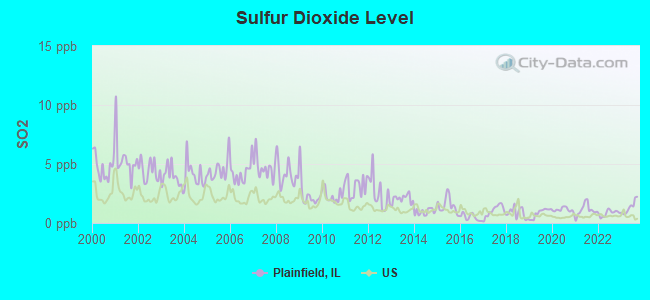
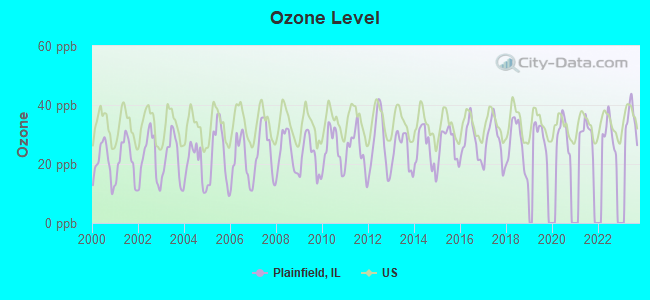
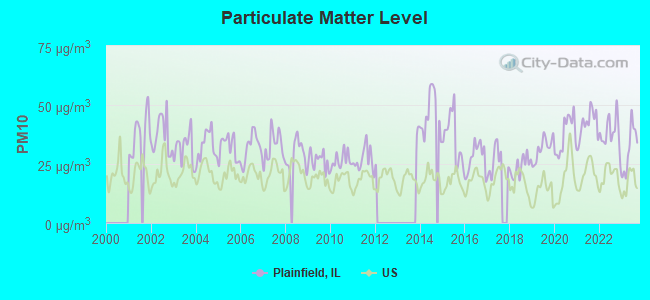
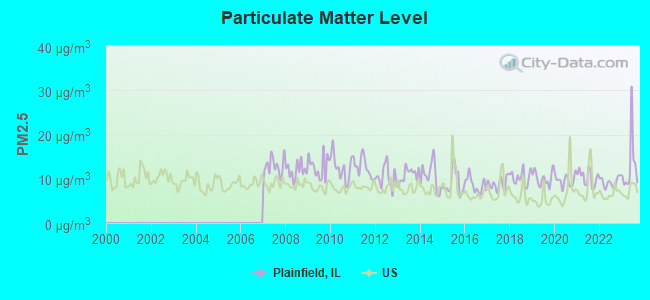
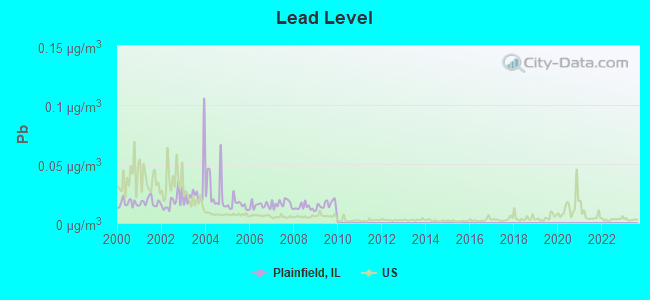
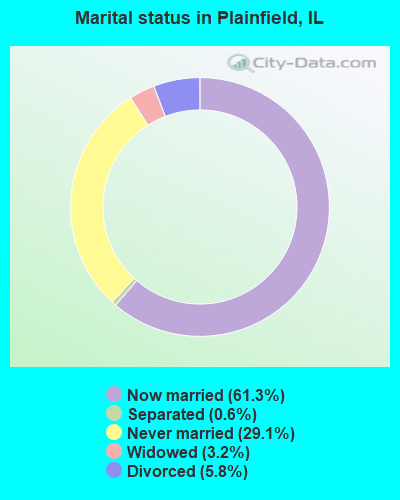
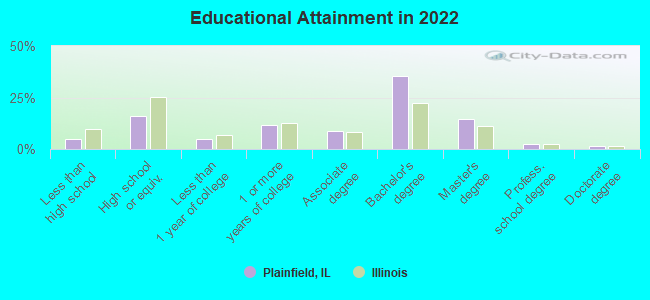

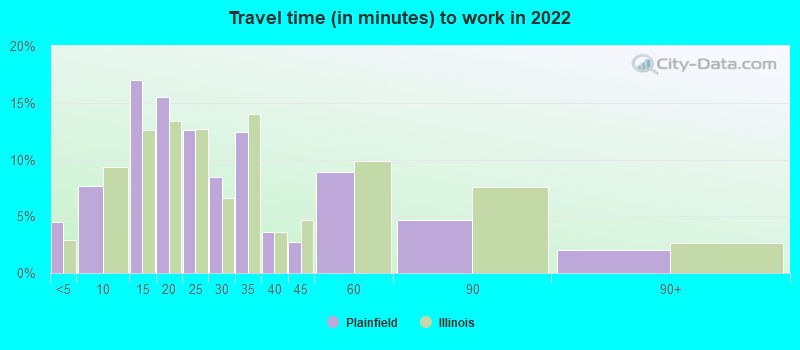
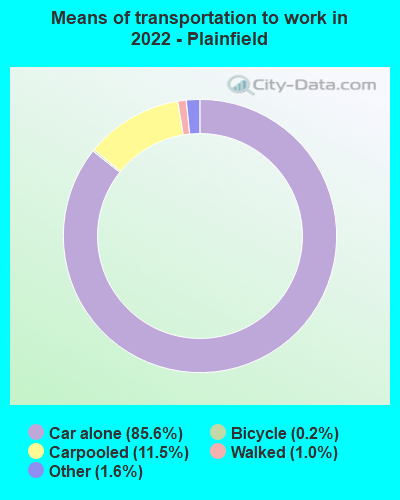
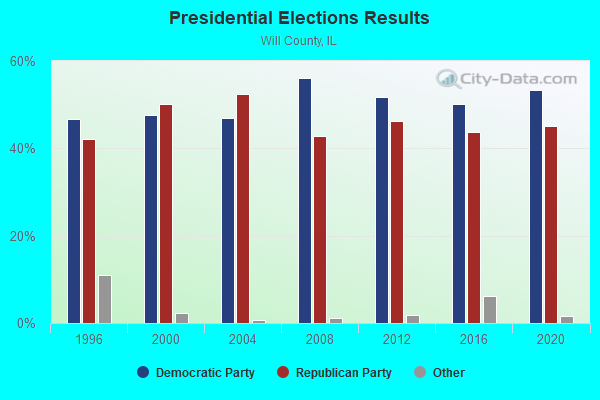
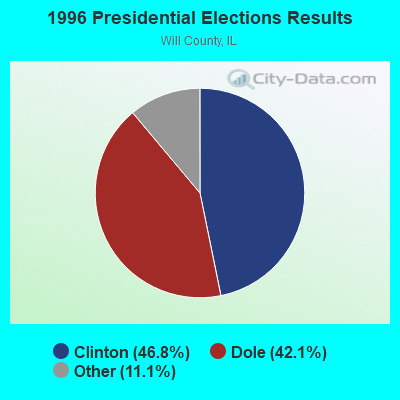
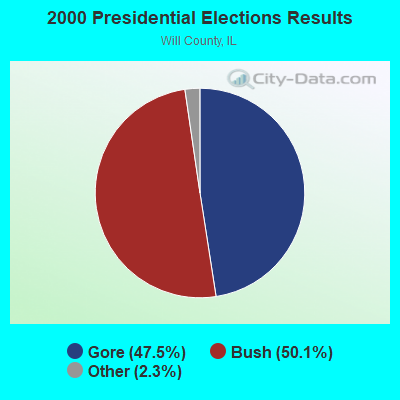
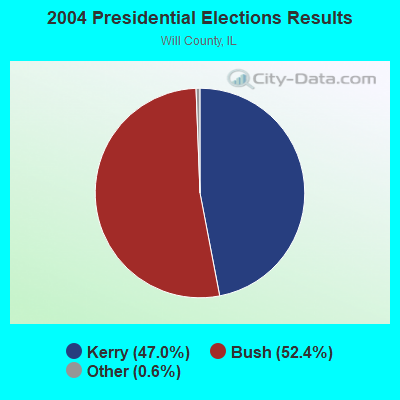
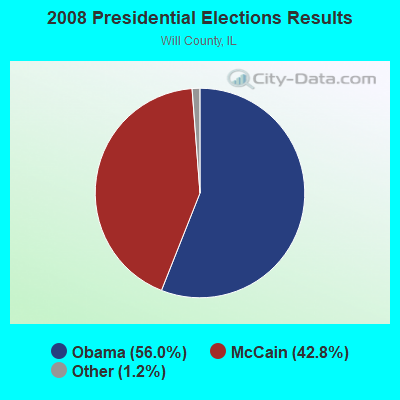
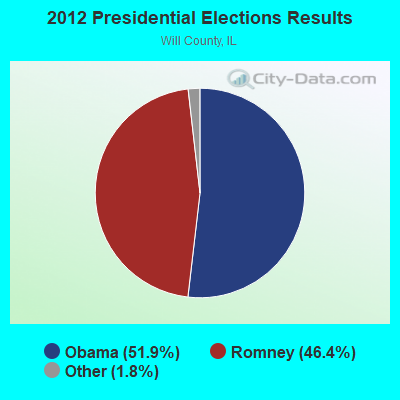
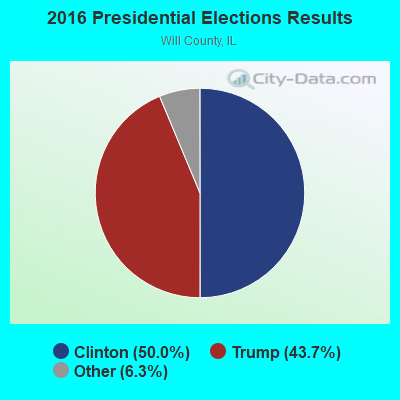
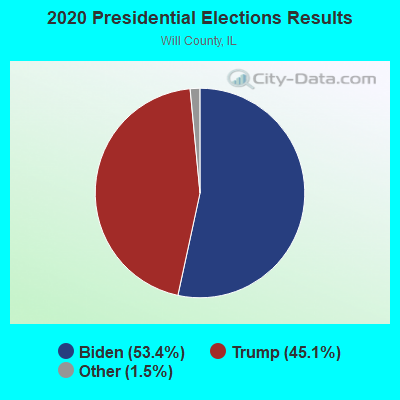
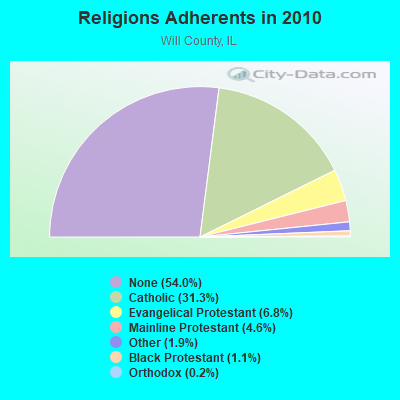
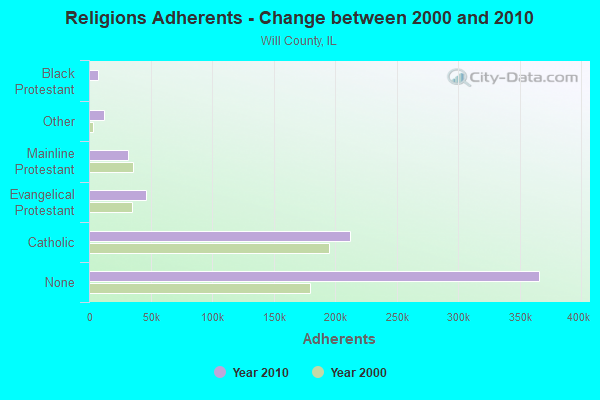
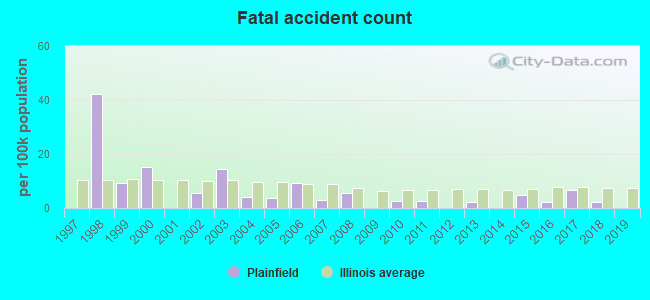
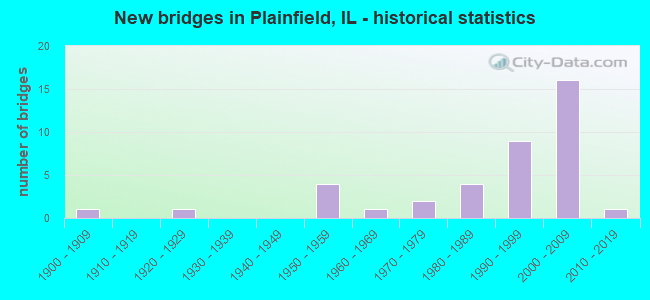
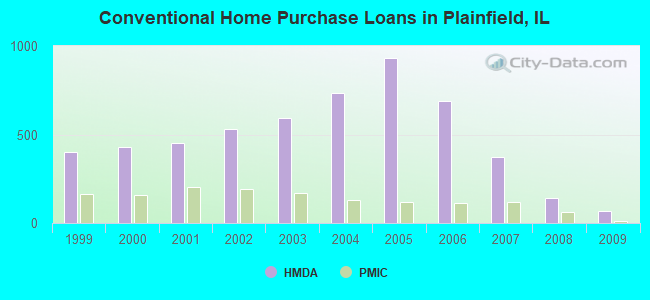
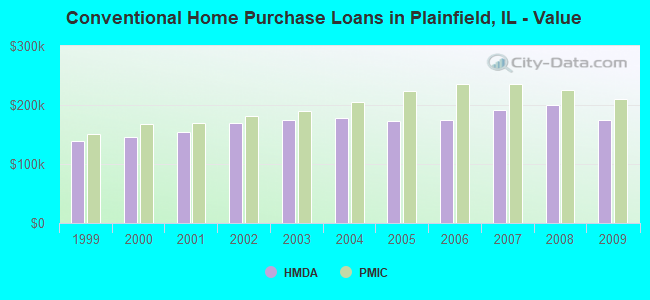
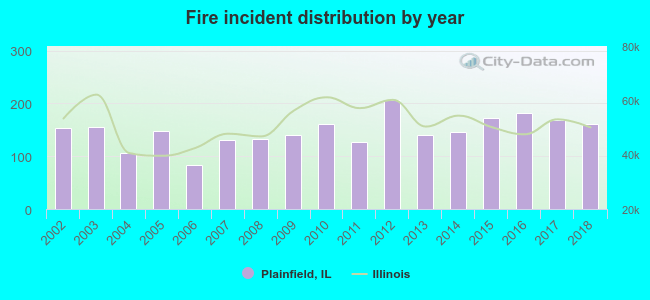 Based on the data from the years 2002 - 2018 the average number of fire incidents per year is 148. The highest number of reported fire incidents - 206 took place in 2012, and the least - 83 in 2006. The data has an increasing trend.
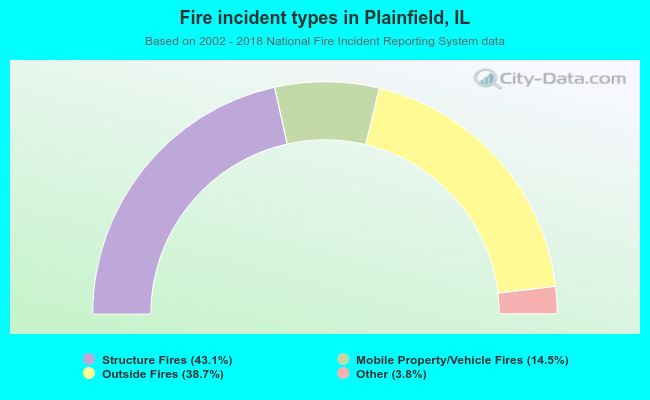 When looking into fire subcategories, the most reports belonged to: Structure Fires (43.1%), and Outside Fires (38.7%).