Mokena, Illinois
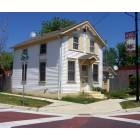
Mokena: Old Home on Front St. in Downtown Mokena
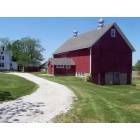
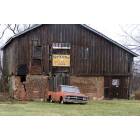
Mokena: farm donated to the village for preservation
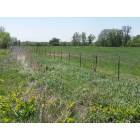
Mokena: Open space in Mokena
Mokena: Downtown Mokena

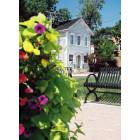
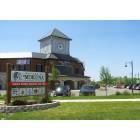
Mokena: Jill Booth Botanic Garden
Mokena: Rural Will County

Mokena: Jill Booth Garden
Mokena: entering mokena from the north on Wolf Rd
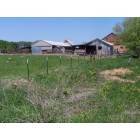
Mokena: an animal farm on townline road in Mokena
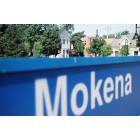
Mokena: Downtown Mokena Metra Station
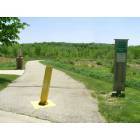
Mokena: Hickory creek bike trail off St. Francis Rd
- see
13
more - add
your
Submit your own pictures of this village and show them to the world
- OSM Map
- General Map
- Google Map
- MSN Map

Population change since 2000: +35.5%
| Males: 9,874 | |
| Females: 9,892 |
| Median resident age: | 43.7 years |
| Illinois median age: | 39.1 years |
Zip codes: 60448.
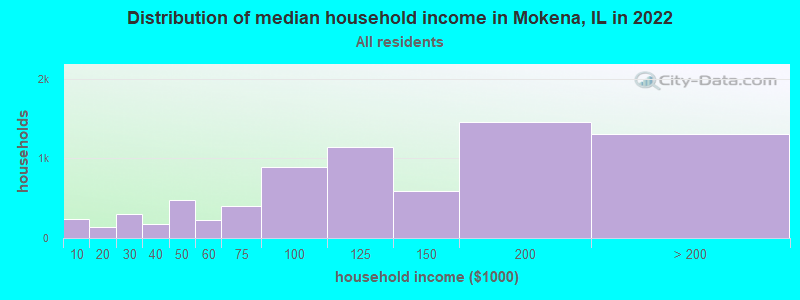
| Mokena: | $113,970 |
| IL: | $76,708 |
Estimated per capita income in 2022: $51,395 (it was $26,737 in 2000)
Mokena village income, earnings, and wages data
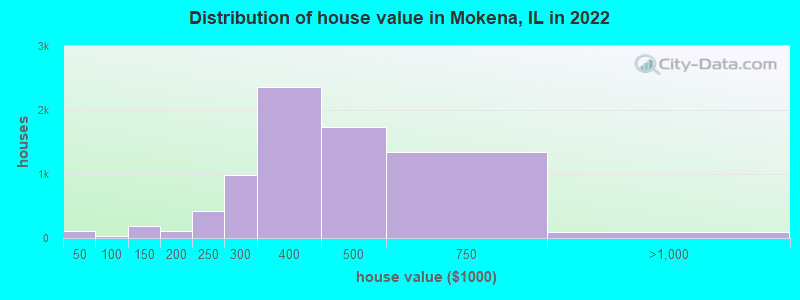
Estimated median house or condo value in 2022: $391,722 (it was $211,300 in 2000)
| Mokena: | $391,722 |
| IL: | $251,600 |
Mean prices in 2022: all housing units: $406,014; detached houses: $443,119; townhouses or other attached units: $307,495; in 3-to-4-unit structures: $197,772; in 5-or-more-unit structures: $142,557
Median gross rent in 2022: $1,370.
(4.5% for White Non-Hispanic residents, 3.9% for Black residents, 9.0% for Hispanic or Latino residents, 18.6% for other race residents, 3.9% for two or more races residents)
Detailed information about poverty and poor residents in Mokena, IL


Compare current foreclosures in Mokena, IL:
| Photo | Address | Area | Beds / Baths | Price | Details |
|---|---|---|---|---|---|

|
#1
W Huntington Ct
Mokena, IL 60448
|
1,358 sq. feet
|
3 baths 3 beds |
show details | |

|
#2
S Hunt Club Dr
Mokena, IL 60448
|
2,995 sq. feet
|
5 baths - beds |
show details | |

|
#3
Tahoe Ln
Mokena, IL 60448
|
- sq. feet
|
- baths - beds |
show details | |

|
#4
Hummingbird Ct
Mokena, IL 60448
|
- sq. feet
|
- baths - beds |
show details | |

|
#5
Hummingbird Ln
Mokena, IL 60448
|
- sq. feet
|
- baths - beds |
show details | |

|
#6
Crystal Creek Dr
Mokena, IL 60448
|
- sq. feet
|
- baths - beds |
show details | |

|
#7
Pheasant Ct
Mokena, IL 60448
|
- sq. feet
|
- baths - beds |
show details | |

|
#8
179th St
Mokena, IL 60448
|
- sq. feet
|
- baths - beds |
show details | |

|
#9
Weber Rd Apt 1
Mokena, IL 60448
|
- sq. feet
|
- baths - beds |
show details | |

|
#10
S Hunt Club Dr
Mokena, IL 60448
|
- sq. feet
|
- baths - beds |
show details |
| Photo | Address | Area | Beds / Baths | Price | Details |
|---|---|---|---|---|---|

|
#11
Tramore Ln
Mokena, IL 60448
|
- sq. feet
|
- baths - beds |
show details | |

|
#12
1st St Apt 1s
Mokena, IL 60448
|
- sq. feet
|
- baths - beds |
show details | |

|
#13
Wolf Rd
Mokena, IL 60448
|
- sq. feet
|
- baths - beds |
show details | |

|
#14
E Brightway Dr
Mokena, IL 60448
|
- sq. feet
|
- baths - beds |
show details | |

|
#15
Hummingbird Ln
Mokena, IL 60448
|
- sq. feet
|
- baths - beds |
show details | |

|
#16
Sage Brush Ln
Mokena, IL 60448
|
- sq. feet
|
- baths - beds |
show details | |

|
#17
Leila Dr
Mokena, IL 60448
|
- sq. feet
|
- baths - beds |
show details | |

|
#18
S Foxhound Ln
Mokena, IL 60448
|
- sq. feet
|
- baths - beds |
show details | |

|
#19
Lakeview Way
Mokena, IL 60448
|
- sq. feet
|
- baths - beds |
show details | |

|
#20
Redwood Ln
Mokena, IL 60448
|
- sq. feet
|
- baths - beds |
show details |
| Photo | Address | Area | Beds / Baths | Price | Details |
|---|---|---|---|---|---|

|
#21
Leila Dr
Mokena, IL 60448
|
- sq. feet
|
- baths - beds |
show details | |

|
#22
Foxglove Ln
Mokena, IL 60448
|
- sq. feet
|
- baths - beds |
show details | |

|
#23
Kluth Dr
Mokena, IL 60448
|
- sq. feet
|
- baths - beds |
show details | |

|
#24
Therese Ln
Mokena, IL 60448
|
- sq. feet
|
- baths - beds |
show details | |

|
#25
Bryant Rd
Mokena, IL 60448
|
- sq. feet
|
- baths - beds |
show details | |

|
#26
Lindsay Ln
Mokena, IL 60448
|
- sq. feet
|
- baths - beds |
show details | |

|
#27
Hickory St
Mokena, IL 60448
|
- sq. feet
|
- baths - beds |
show details | |

|
#28
1st St
Mokena, IL 60448
|
- sq. feet
|
- baths - beds |
show details | |

|
#29
Pheasant Ln
Mokena, IL 60448
|
- sq. feet
|
- baths - beds |
show details | |

|
#30
Buckingham Dr
Mokena, IL 60448
|
- sq. feet
|
- baths - beds |
show details |
| Photo | Address | Area | Beds / Baths | Price | Details |
|---|---|---|---|---|---|

|
#31
Blackthorne Ridge Dr
Mokena, IL 60448
|
- sq. feet
|
- baths - beds |
show details | |

|
#32
Revere Rd
Mokena, IL 60448
|
- sq. feet
|
- baths - beds |
show details | |

|
#33
3rd St
Mokena, IL 60448
|
- sq. feet
|
- baths - beds |
show details | |

|
#34
Front St
Mokena, IL 60448
|
- sq. feet
|
- baths - beds |
show details | |

|
#35
S Hunt Club Dr
Mokena, IL 60448
|
- sq. feet
|
- baths - beds |
show details | |

|
#36
Wolf Rd Apt 2
Mokena, IL 60448
|
- sq. feet
|
- baths - beds |
show details | |

|
#37
Pine St
Mokena, IL 60448
|
- sq. feet
|
- baths - beds |
show details | |

|
#38
Mcgovney St
Mokena, IL 60448
|
- sq. feet
|
- baths - beds |
show details | |

|
Check over 1 million property listings on Foreclosure.com!
|
browse all offers | |||


- 17,36687.3%White alone
- 9774.9%Hispanic
- 5792.9%Two or more races
- 2791.4%Black alone
- 2361.2%Asian alone
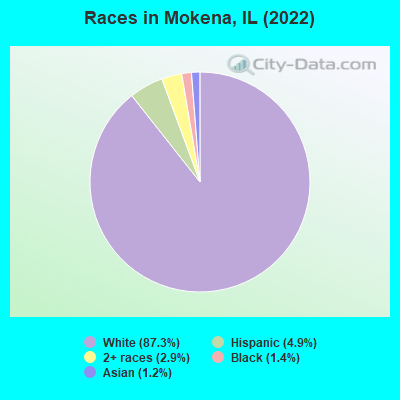
Races in Mokena detailed stats: ancestries, foreign born residents, place of birth
According to our research of Illinois and other state lists, there were 12 registered sex offenders living in Mokena, Illinois as of April 27, 2024.
The ratio of all residents to sex offenders in Mokena is 1,663 to 1.
The ratio of registered sex offenders to all residents in this city is lower than the state average.
Type |
2009 |
2010 |
2011 |
2012 |
2013 |
2014 |
2015 |
2016 |
2017 |
2018 |
2019 |
2020 |
2021 |
2022 |
|---|---|---|---|---|---|---|---|---|---|---|---|---|---|---|
| Murders (per 100,000) | 1 (5.0) | 1 (5.3) | 0 (0.0) | 0 (0.0) | 0 (0.0) | 0 (0.0) | 0 (0.0) | 0 (0.0) | 0 (0.0) | 0 (0.0) | 0 (0.0) | 0 (0.0) | 0 (0.0) | 0 (0.0) |
| Rapes (per 100,000) | 0 (0.0) | 4 (21.3) | 3 (16.0) | 1 (5.3) | 0 (0.0) | 0 (0.0) | 4 (20.4) | 2 (9.9) | 4 (19.7) | 2 (9.8) | 3 (14.6) | 2 (9.8) | 0 (0.0) | 3 (15.1) |
| Robberies (per 100,000) | 1 (5.0) | 1 (5.3) | 2 (10.6) | 4 (21.2) | 5 (26.1) | 3 (15.6) | 3 (15.3) | 0 (0.0) | 2 (9.8) | 4 (19.5) | 3 (14.6) | 6 (29.5) | 0 (0.0) | 3 (15.1) |
| Assaults (per 100,000) | 10 (50.5) | 6 (32.0) | 4 (21.3) | 6 (31.8) | 5 (26.1) | 5 (25.9) | 7 (35.7) | 3 (14.9) | 8 (39.4) | 5 (24.4) | 10 (48.6) | 8 (39.4) | 2 (9.9) | 5 (25.2) |
| Burglaries (per 100,000) | 23 (116.1) | 20 (106.7) | 22 (117.0) | 45 (238.6) | 28 (146.4) | 22 (114.2) | 23 (117.2) | 22 (109.1) | 20 (98.4) | 31 (151.2) | 30 (145.8) | 29 (142.6) | 10 (49.5) | 22 (110.9) |
| Thefts (per 100,000) | 254 (1,282) | 184 (981.9) | 184 (978.9) | 165 (874.7) | 146 (763.2) | 170 (882.2) | 211 (1,076) | 232 (1,151) | 267 (1,314) | 240 (1,170) | 241 (1,171) | 171 (841.1) | 21 (104.0) | 121 (610.2) |
| Auto thefts (per 100,000) | 16 (80.7) | 10 (53.4) | 11 (58.5) | 7 (37.1) | 4 (20.9) | 10 (51.9) | 4 (20.4) | 7 (34.7) | 12 (59.1) | 24 (117.0) | 32 (155.5) | 19 (93.5) | 7 (34.7) | 12 (60.5) |
| Arson (per 100,000) | 1 (5.0) | 5 (26.7) | 1 (5.3) | 10 (53.0) | 7 (36.6) | 7 (36.3) | 1 (5.1) | 0 (0.0) | 0 (0.0) | 0 (0.0) | 0 (0.0) | 0 (0.0) | 0 (0.0) | 0 (0.0) |
| City-Data.com crime index | 87.6 | 86.8 | 72.2 | 71.6 | 55.5 | 57.3 | 80.9 | 67.4 | 90.7 | 85.3 | 95.3 | 75.7 | 12.4 | 58.7 |
The City-Data.com crime index weighs serious crimes and violent crimes more heavily. Higher means more crime, U.S. average is 246.1. It adjusts for the number of visitors and daily workers commuting into cities.
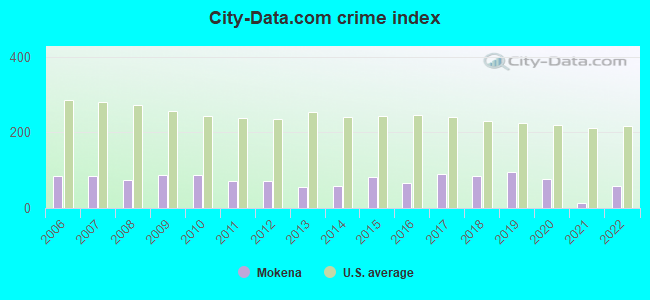
Crime rate in Mokena detailed stats: murders, rapes, robberies, assaults, burglaries, thefts, arson
Full-time law enforcement employees in 2021, including police officers: 34 (31 officers - 28 male; 3 female).
| Officers per 1,000 residents here: | 1.54 |
| Illinois average: | 2.84 |
 Recent articles from our blog. Our writers, many of them Ph.D. graduates or candidates, create easy-to-read articles on a wide variety of topics.


Latest news from Mokena, IL collected exclusively by city-data.com from local newspapers, TV, and radio stations
Ancestries: Polish (19.9%), Irish (18.4%), German (12.2%), Italian (7.5%), Dutch (6.9%), American (6.0%).
Current Local Time: CST time zone
Incorporated on 05/22/1890
Elevation: 706 feet
Land area: 6.00 square miles.
Population density: 3,297 people per square mile (average).
458 residents are foreign born (1.1% Europe, 0.7% Asia, 0.5% Latin America).
| This village: | 2.3% |
| Illinois: | 14.1% |
Median real estate property taxes paid for housing units with mortgages in 2022: $8,384 (2.1%)
Median real estate property taxes paid for housing units with no mortgage in 2022: $8,253 (2.1%)
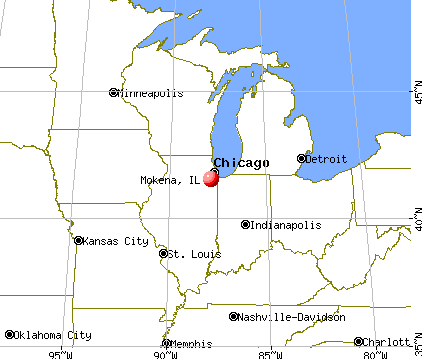
Nearest city with pop. 50,000+: Orland Park, IL  (5.5 miles , pop. 51,077).
Nearest city with pop. 200,000+: Chicago, IL (23.5 miles , pop. 2,896,016).
Nearest cities:
), )Latitude: 41.53 N, Longitude: 87.88 W
Daytime population change due to commuting: +2 (+0.0%)
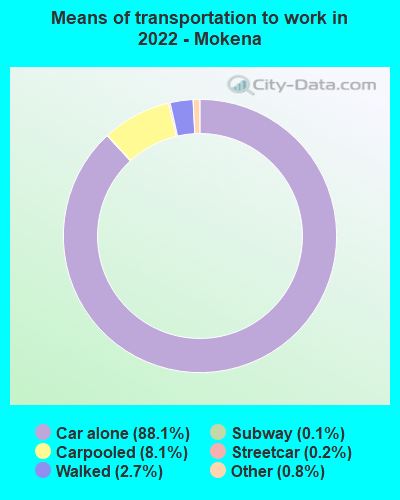
Workers who live and work in this village: 3,121 (28.5%)
Area code: 708
Property values in Mokena, IL
Mokena, Illinois accommodation & food services, waste management - Economy and Business Data
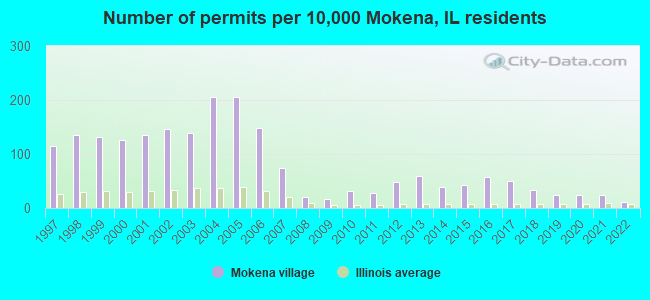
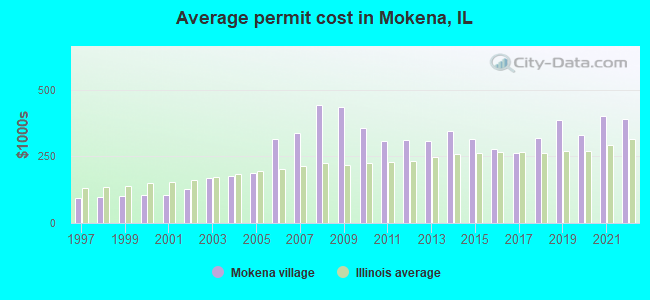
Single-family new house construction building permits:
- 2022: 18 buildings, average cost: $391,300
- 2021: 37 buildings, average cost: $401,800
- 2020: 35 buildings, average cost: $327,900
- 2019: 35 buildings, average cost: $386,900
- 2018: 50 buildings, average cost: $316,500
- 2017: 73 buildings, average cost: $262,400
- 2016: 85 buildings, average cost: $278,400
- 2015: 62 buildings, average cost: $313,700
- 2014: 55 buildings, average cost: $346,400
- 2013: 86 buildings, average cost: $306,400
- 2012: 71 buildings, average cost: $309,700
- 2011: 41 buildings, average cost: $307,100
- 2010: 45 buildings, average cost: $355,000
- 2009: 25 buildings, average cost: $432,800
- 2008: 31 buildings, average cost: $442,100
- 2007: 110 buildings, average cost: $335,600
- 2006: 218 buildings, average cost: $316,200
- 2005: 299 buildings, average cost: $187,400
- 2004: 299 buildings, average cost: $174,600
- 2003: 202 buildings, average cost: $169,000
- 2002: 214 buildings, average cost: $126,000
- 2001: 199 buildings, average cost: $104,800
- 2000: 184 buildings, average cost: $105,300
- 1999: 191 buildings, average cost: $100,800
- 1998: 198 buildings, average cost: $97,400
- 1997: 166 buildings, average cost: $93,100
| Here: | 4.0% |
| Illinois: | 4.2% |
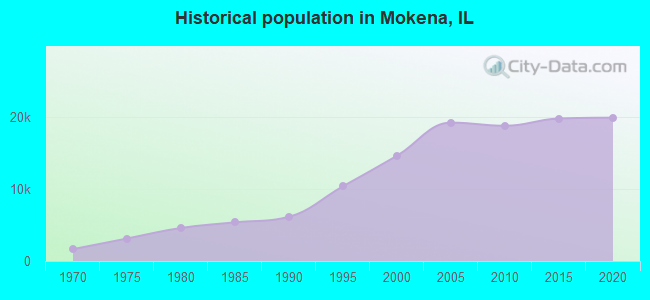
Population change in the 1990s: +7,632 (+109.8%).
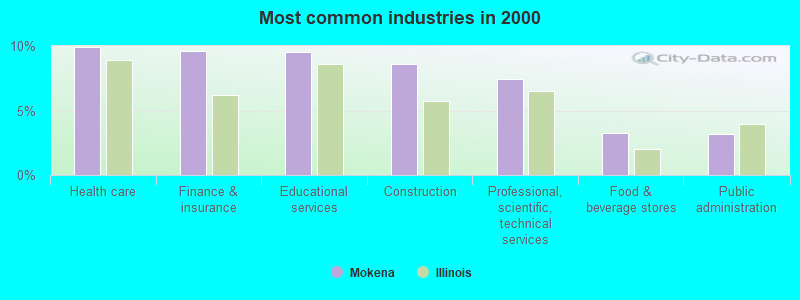
- Health care (9.9%)
- Finance & insurance (9.6%)
- Educational services (9.6%)
- Construction (8.6%)
- Professional, scientific, technical services (7.5%)
- Food & beverage stores (3.3%)
- Public administration (3.2%)
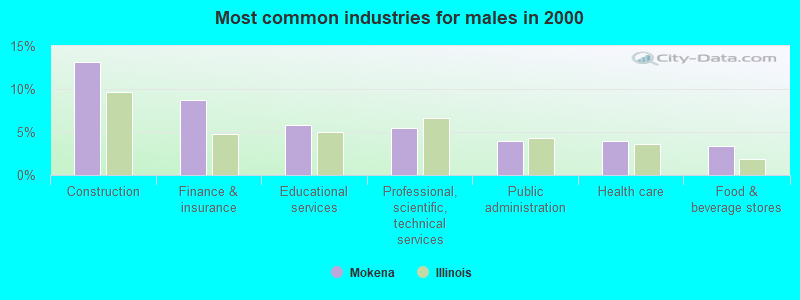
- Construction (13.2%)
- Finance & insurance (8.7%)
- Educational services (5.8%)
- Professional, scientific, technical services (5.4%)
- Public administration (3.9%)
- Health care (3.9%)
- Food & beverage stores (3.4%)
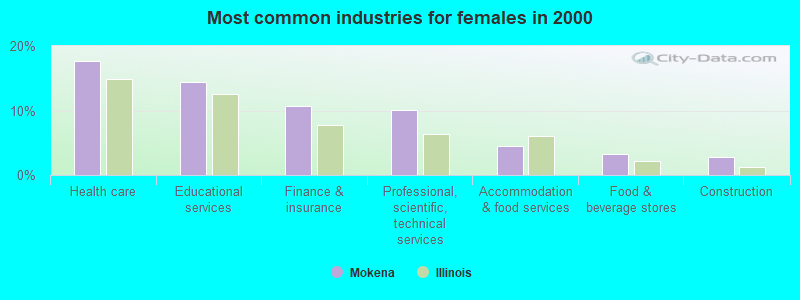
- Health care (17.7%)
- Educational services (14.4%)
- Finance & insurance (10.7%)
- Professional, scientific, technical services (10.1%)
- Accommodation & food services (4.5%)
- Food & beverage stores (3.2%)
- Construction (2.7%)
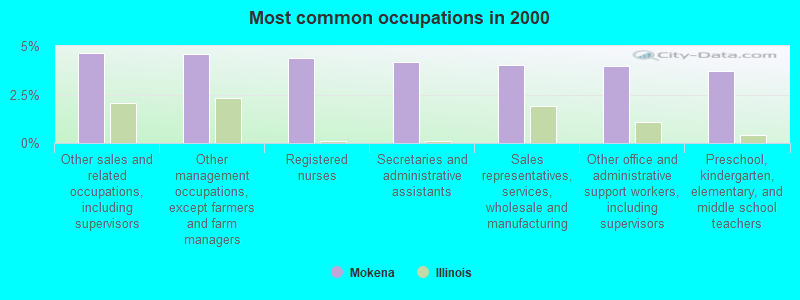
- Other sales and related occupations, including supervisors (4.6%)
- Other management occupations, except farmers and farm managers (4.6%)
- Registered nurses (4.4%)
- Secretaries and administrative assistants (4.1%)
- Sales representatives, services, wholesale and manufacturing (4.0%)
- Other office and administrative support workers, including supervisors (4.0%)
- Preschool, kindergarten, elementary, and middle school teachers (3.7%)
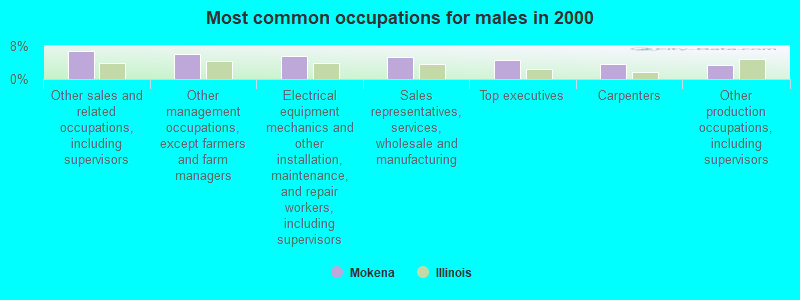
- Other sales and related occupations, including supervisors (6.9%)
- Other management occupations, except farmers and farm managers (6.0%)
- Electrical equipment mechanics and other installation, maintenance, and repair workers, including supervisors (5.6%)
- Sales representatives, services, wholesale and manufacturing (5.4%)
- Top executives (4.6%)
- Carpenters (3.6%)
- Other production occupations, including supervisors (3.5%)
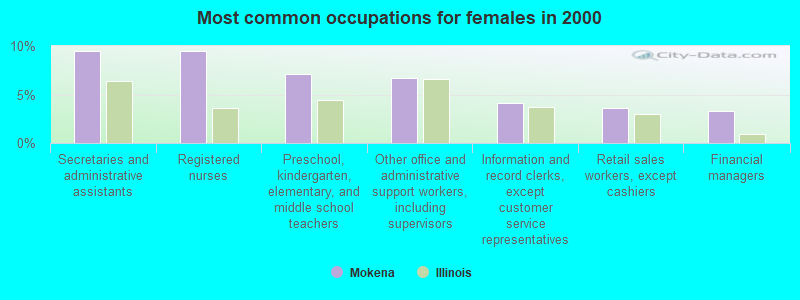
- Secretaries and administrative assistants (9.5%)
- Registered nurses (9.5%)
- Preschool, kindergarten, elementary, and middle school teachers (7.1%)
- Other office and administrative support workers, including supervisors (6.7%)
- Information and record clerks, except customer service representatives (4.1%)
- Retail sales workers, except cashiers (3.6%)
- Financial managers (3.3%)
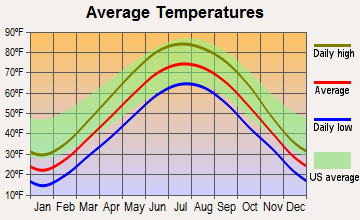
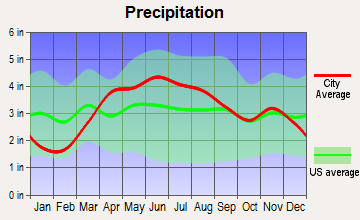
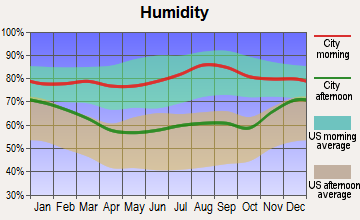
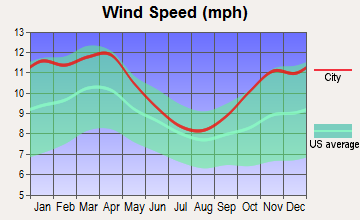
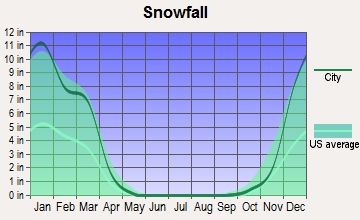
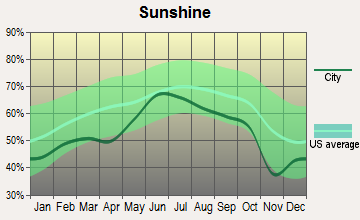
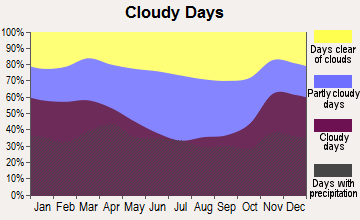
Average climate in Mokena, Illinois
Based on data reported by over 4,000 weather stations
|
|


(lower is better)
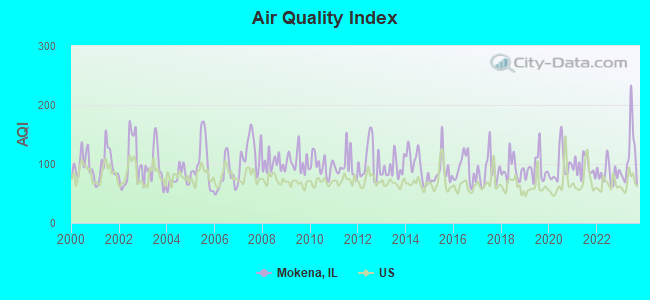
Air Quality Index (AQI) level in 2023 was 113. This is significantly worse than average.
| City: | 113 |
| U.S.: | 73 |
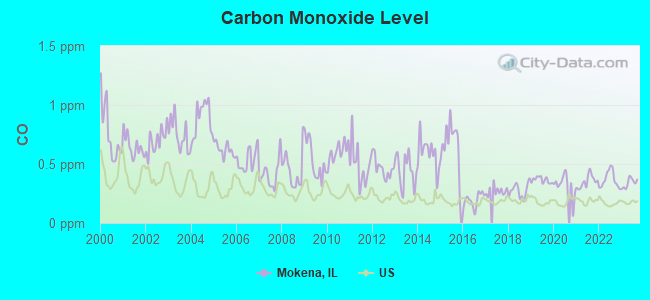
Carbon Monoxide (CO) [ppm] level in 2023 was 0.339. This is worse than average. Closest monitor was 10.1 miles away from the city center.
| City: | 0.339 |
| U.S.: | 0.251 |
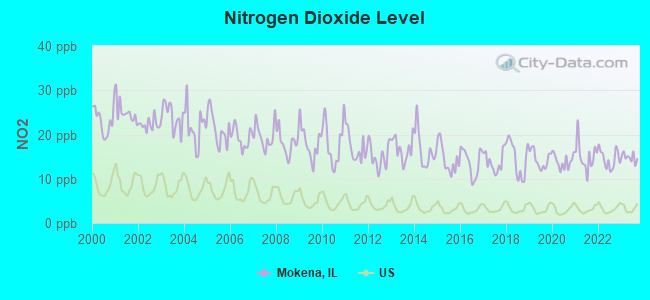
Nitrogen Dioxide (NO2) [ppb] level in 2023 was 14.8. This is significantly worse than average. Closest monitor was 9.5 miles away from the city center.
| City: | 14.8 |
| U.S.: | 5.1 |
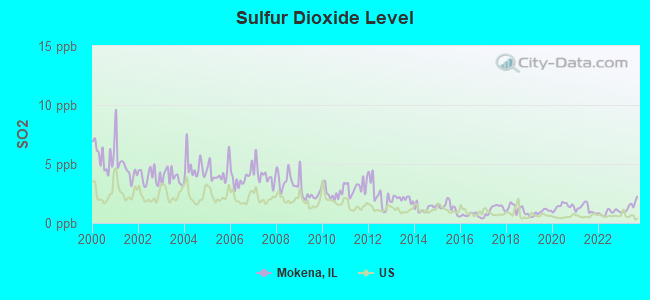
Sulfur Dioxide (SO2) [ppb] level in 2023 was 1.39. This is about average. Closest monitor was 9.5 miles away from the city center.
| City: | 1.39 |
| U.S.: | 1.51 |
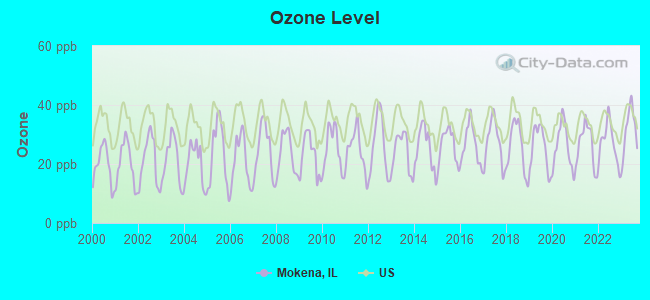
Ozone [ppb] level in 2023 was 31.6. This is about average. Closest monitor was 9.7 miles away from the city center.
| City: | 31.6 |
| U.S.: | 33.3 |
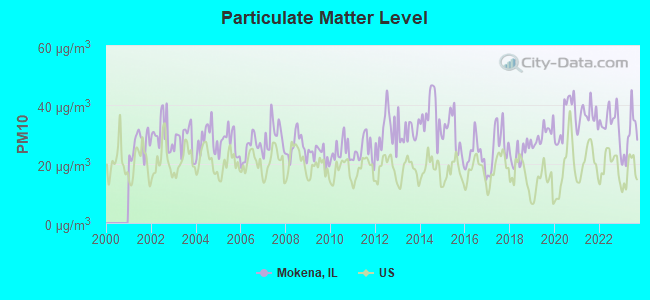
Particulate Matter (PM10) [µg/m3] level in 2023 was 29.3. This is significantly worse than average. Closest monitor was 10.0 miles away from the city center.
| City: | 29.3 |
| U.S.: | 19.2 |
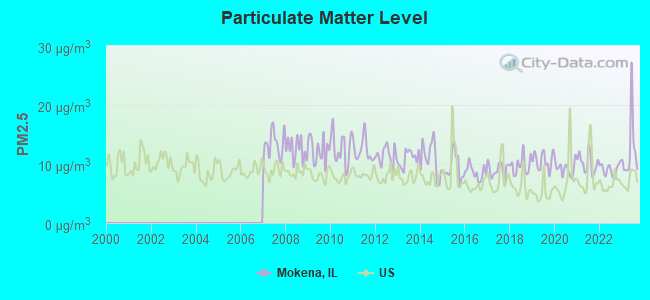
Particulate Matter (PM2.5) [µg/m3] level in 2023 was 12.2. This is significantly worse than average. Closest monitor was 12.0 miles away from the city center.
| City: | 12.2 |
| U.S.: | 8.1 |
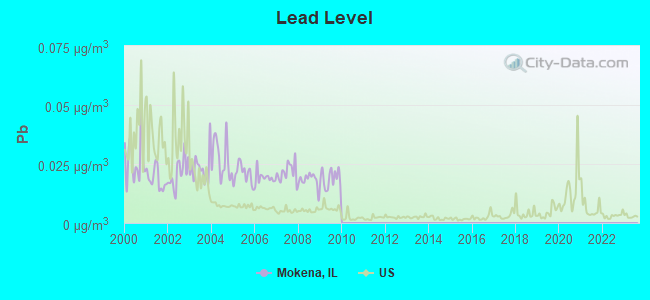
Lead (Pb) [µg/m3] level in 2009 was 0.0188. This is significantly worse than average. Closest monitor was 0.4 miles away from the city center.
| City: | 0.0188 |
| U.S.: | 0.0093 |
Tornado activity:
Mokena-area historical tornado activity is near Illinois state average. It is 62% greater than the overall U.S. average.
On 8/28/1990, a category F5 (max. wind speeds 261-318 mph) tornado 11.6 miles away from the Mokena village center killed 29 people and injured 350 people and caused between $50,000 and $500,000 in damages.
On 4/21/1967, a category F4 (max. wind speeds 207-260 mph) tornado 9.7 miles away from the village center killed 33 people and injured 500 people and caused between $5,000,000 and $50,000,000 in damages.
Earthquake activity:
Mokena-area historical earthquake activity is significantly above Illinois state average. It is 51% greater than the overall U.S. average.On 4/18/2008 at 09:36:59, a magnitude 5.4 (5.1 MB, 4.8 MS, 5.4 MW, 5.2 MW, Class: Moderate, Intensity: VI - VII) earthquake occurred 213.2 miles away from the city center
On 6/10/1987 at 23:48:54, a magnitude 5.1 (4.9 MB, 4.4 MS, 4.6 MS, 5.1 LG) earthquake occurred 187.7 miles away from Mokena center
On 4/18/2008 at 09:36:59, a magnitude 5.2 (5.2 MW, Depth: 8.9 mi) earthquake occurred 213.2 miles away from the city center
On 6/28/2004 at 06:10:52, a magnitude 4.2 (4.2 MW, Depth: 6.2 mi, Class: Light, Intensity: IV - V) earthquake occurred 53.3 miles away from Mokena center
On 6/18/2002 at 17:37:15, a magnitude 5.0 (4.3 MB, 4.6 MW, 5.0 LG) earthquake occurred 245.4 miles away from the city center
On 4/18/2008 at 15:14:16, a magnitude 4.8 (4.5 MB, 4.8 MW, 4.6 MW) earthquake occurred 211.5 miles away from the city center
Magnitude types: regional Lg-wave magnitude (LG), body-wave magnitude (MB), surface-wave magnitude (MS), moment magnitude (MW)
Natural disasters:
The number of natural disasters in Will County (17) is near the US average (15).Major Disasters (Presidential) Declared: 12
Emergencies Declared: 4
Causes of natural disasters: Storms: 9, Floods: 7, Tornadoes: 5, Snowstorms: 2, Winds: 2, Winter Storms: 2, Blizzard: 1, Hurricane: 1, Snow: 1, Other: 1 (Note: some incidents may be assigned to more than one category).

Hospitals and medical centers in Mokena:
Other hospitals and medical centers near Mokena:
- FRANKFORT TERRACE NURSING CTR (Nursing Home, about 3 miles away; FRANKFORT, IL)
- MIDWEST HOME HEALTH CARE OF FRANKFORT, LLC (Home Health Center, about 4 miles away; FRANKFORT, IL)
- EBENEZER HOME HEALTH SERVICE, LLC (Home Health Center, about 4 miles away; TINLEY PARK, IL)
- ORLAND PARK SURGICAL CENTER (Hospital, about 4 miles away; ORLAND PARK, IL)
- W A HOWE DEVELOPMENTAL CENTER (Hospital, about 5 miles away; TINLEY PARK, IL)
- W A HOWE #31 PINE HALL (Nursing Home, about 5 miles away; TINLEY PARK, IL)
- ALDEN ORLAND PARK REHAB AND HCC (Nursing Home, about 5 miles away; ORLAND PARK, IL)
Amtrak stations near Mokena:
- 11 miles: JOLIET (50 E. JEFFERSON ST.) . Services: ticket office, partially wheelchair accessible, enclosed waiting area, public restrooms, public payphones, vending machines, paid short-term parking, paid long-term parking, public transit connection.
- 11 miles: HOMEWOOD (181 1ST ST. & PARK AVE.) . Services: ticket office, enclosed waiting area, public restrooms, public payphones, paid short-term parking, paid long-term parking, public transit connection.
- 19 miles: SUMMIT (ARCHER & CENTER AVE.) . Services: public payphones, free short-term parking, free long-term parking, call for taxi service, public transit connection.
Colleges/universities with over 2000 students nearest to Mokena:
- Governors State University (about 11 miles; University Park, IL; Full-time enrollment: 4,043)
- Moraine Valley Community College (about 12 miles; Palos Hills, IL; FT enrollment: 12,008)
- University of St Francis (about 12 miles; Joliet, IL; FT enrollment: 2,454)
- Lewis University (about 12 miles; Romeoville, IL; FT enrollment: 5,739)
- Prairie State College (about 13 miles; Chicago Heights, IL; FT enrollment: 4,050)
- South Suburban College (about 15 miles; South Holland, IL; FT enrollment: 3,972)
- Saint Xavier University (about 15 miles; Chicago, IL; FT enrollment: 3,576)
Public elementary/middle schools in Mokena:
- MOKENA ELEM SCHOOL (Students: 878, Location: 11244 WILLOW CREST LN, Grades: PK-3)
- MOKENA JR HIGH SCHOOL (Students: 824, Location: 19815 KIRKSTONE WAY, Grades: 6-8)
- MOKENA INTERMEDIATE SCHOOL (Students: 510, Location: 11331 195TH ST, Grades: 4-5)
- ARBURY HILLS ELEM SCHOOL (Students: 355, Location: 19651 BEECHNUT DR, Grades: 1-4)
Private elementary/middle schools in Mokena:
- ST MARY ELEMENTARY SCHOOL (Students: 471, Location: 11409 195TH ST, Grades: KG-8)
- NOONAN ELEMENTARY ACADEMY (Students: 390, Location: 19131 HENRY DR, Grades: PK-8)
Library in Mokena:
Points of interest:
Notable locations in Mokena: 80th Avenue Industrial Park (A), Corporate Corridors (B), Normal Towers Industrial Park (C), Mokena Community Public Library (D), Mokena Fire Protection District Station 1 (E). Display/hide their locations on the map
Shopping Center: Hickory Creek Shopping Center (1). Display/hide its location on the map
Churches in Mokena include: Grace Fellowship Church (A), Saint John's United Church (B). Display/hide their locations on the map
Cemeteries: Saint Marys Cemetery (1), Pioneer Cemetery (2). Display/hide their locations on the map
Reservoir: Gun Club Lake (A). Display/hide its location on the map
Parks in Mokena include: Willowview Park (1), Heght Park (2), Hickory Creek County Forest Preserve (3). Display/hide their locations on the map
Tourist attraction: Bammo-Zig-Zammo (10945 1st Street) (1). Display/hide its approximate location on the map
Hotel: Chicago/Mokena/Frankfort Super 8 Motel (9485 W 191st St) (1). Display/hide its approximate location on the map
Court: Court Time Inc (8501 West 191st Street) (1). Display/hide its approximate location on the map
Birthplace of: Jason Guida - Martial artist, James Augustine - College basketball player (Illinois Fighting Illini).
Drinking water stations with addresses in Mokena and their reported violations in the past:
MARLEY COMMUNITY CHURCH (Population served: 174, Groundwater):Past monitoring violations:
- One regular monitoring violation
Drinking water stations with addresses in Mokena that have no violations reported:
- NEW LENOX DISCOUNT PANTRY (Population served: 200, Primary Water Source Type: Groundwater)
- WILLOW RUN GOLF COURSE (Population served: 120, Primary Water Source Type: Groundwater)
- MARLEY OAKS ASSISTED LIVING (Population served: 25, Primary Water Source Type: Groundwater)
- FRANKFORT SPORTSMAN CLUB INC (Population served: 25, Primary Water Source Type: Groundwater)
| This village: | 3.0 people |
| Illinois: | 2.6 people |
| This village: | 80.5% |
| Whole state: | 65.8% |
| This village: | 4.1% |
| Whole state: | 6.3% |
Likely homosexual households (counted as self-reported same-sex unmarried-partner households)
- Lesbian couples: 0.2% of all households
- Gay men: 0.2% of all households
Banks with most branches in Mokena (2011 data):
- First Midwest Bank: Mokena Branch at 19648 La Grange Road, branch established on 1989/12/26; Mokena Branch at 11210 West Lincoln Highway, branch established on 2003/08/04. Info updated 2011/12/22: Bank assets: $7,848.0 mil, Deposits: $6,529.2 mil, headquarters in Itasca, IL, positive income, Commercial Lending Specialization, 100 total offices, Holding Company: First Midwest Bancorp, Inc.
- JPMorgan Chase Bank, National Association: Mokena Branch at 11124 Front Street, branch established on 1961/01/01; Mokena Market Place Branch at 11205 Lincoln Hwy, branch established on 2009/03/17. Info updated 2011/11/10: Bank assets: $1,811,678.0 mil, Deposits: $1,190,738.0 mil, headquarters in Columbus, OH, positive income, International Specialization, 5577 total offices, Holding Company: Jpmorgan Chase & Co.
- Bridgeview Bank Group: Mokena Branch at 19031 Old Lagrange Road, branch established on 1997/12/03. Info updated 2011/03/16: Bank assets: $1,295.3 mil, Deposits: $1,172.3 mil, headquarters in Bridgeview, IL, negative income in the last year, Commercial Lending Specialization, 19 total offices, Holding Company: Bridgeview Bancorp, Inc.
- Fifth Third Bank: Mokena Facility at 19201 La Grange Road, branch established on 1990/09/24. Info updated 2009/10/05: Bank assets: $114,540.4 mil, Deposits: $89,689.1 mil, headquarters in Cincinnati, OH, positive income, Commercial Lending Specialization, 1378 total offices, Holding Company: Fifth Third Bancorp
- Great Lakes Bank, National Association: Mokena Main Branch at 9697 West 191st Street, branch established on 1997/05/05. Info updated 2007/12/05: Bank assets: $627.2 mil, Deposits: $501.8 mil, headquarters in Blue Island, IL, positive income, Commercial Lending Specialization, 8 total offices, Holding Company: Great Lakes Financial Resources, Inc. Employee Stock Ownership Plan
- State Bank of Illinois: Mokena Branch at 11100 Front Street, branch established on 1909/01/08. Info updated 2006/11/03: Bank assets: $185.5 mil, Deposits: $166.7 mil, headquarters in West Chicago, IL, negative income in the last year, Commercial Lending Specialization, 4 total offices, Holding Company: F.N.b.c. Of La Grange, Inc.
- Archer Bank: Mokena Branch at 19806 S. Wolf Rd. Unit 101, branch established on 2007/03/29. Info updated 2010/04/21: Bank assets: $577.8 mil, Deposits: $525.4 mil, headquarters in Chicago, IL, negative income in the last year, Commercial Lending Specialization, 20 total offices, Holding Company: Metropolitan Bank Group, Inc.
- Old Plank Trail Community Bank, National Association: Mokena Office Branch at 20012 Wolf Road, branch established on 2006/05/22. Info updated 2007/12/20: Bank assets: $320.0 mil, Deposits: $286.7 mil, headquarters in New Lenox, IL, positive income, Commercial Lending Specialization, 3 total offices, Holding Company: Wintrust Financial Corporation
- First National Bank of Illinois: Mokena Branch at 19860 S. Lagrange Rd, branch established on 1998/12/07. Info updated 2006/11/03: Bank assets: $376.2 mil, Deposits: $333.5 mil, headquarters in Lansing, IL, positive income, Commercial Lending Specialization, 8 total offices, Holding Company: First Lansing Bancorp, Inc.
For population 15 years and over in Mokena:
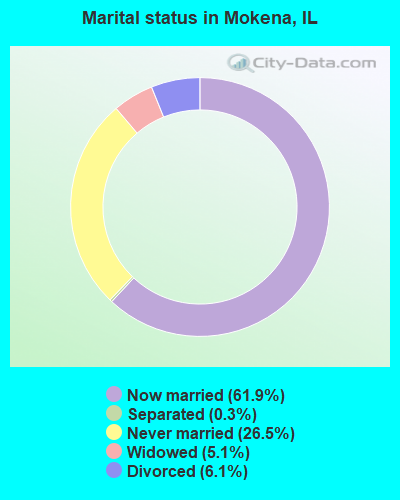
- Never married: 26.5%
- Now married: 61.9%
- Separated: 0.3%
- Widowed: 5.1%
- Divorced: 6.1%
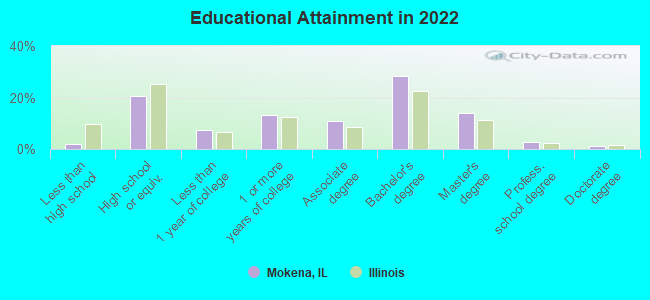
For population 25 years and over in Mokena:
- High school or higher: 98.0%
- Bachelor's degree or higher: 45.9%
- Graduate or professional degree: 17.5%
- Unemployed: 3.5%
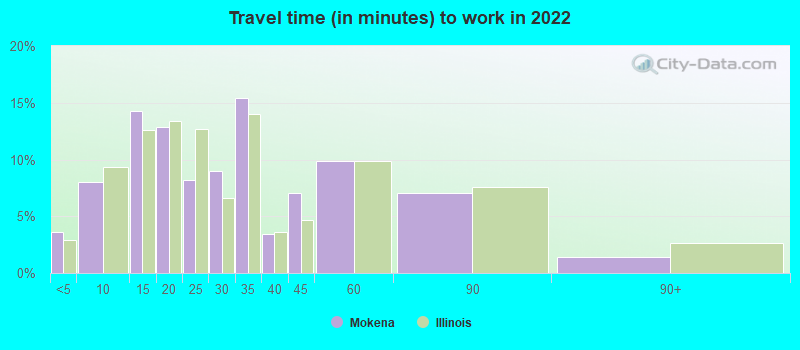
- Mean travel time to work (commute): 26.0 minutes
| Here: | 9.0 |
| Illinois average: | 12.5 |
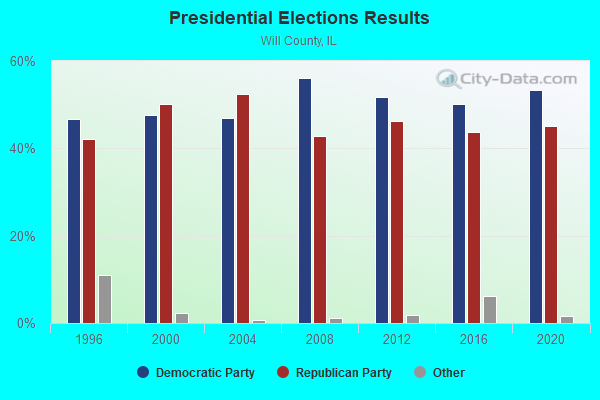
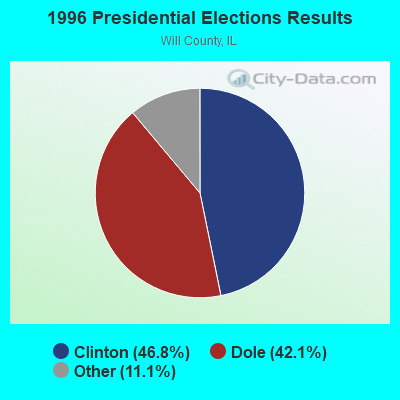
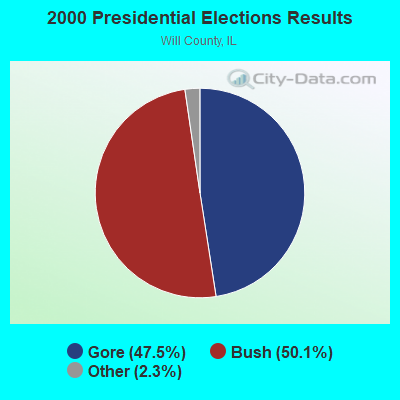
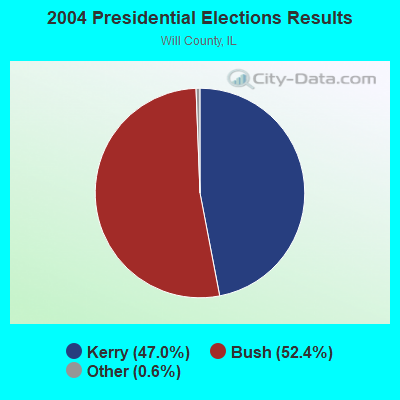
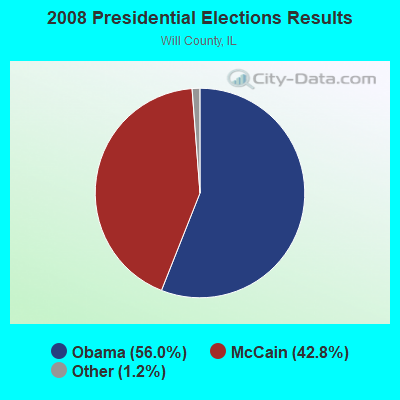
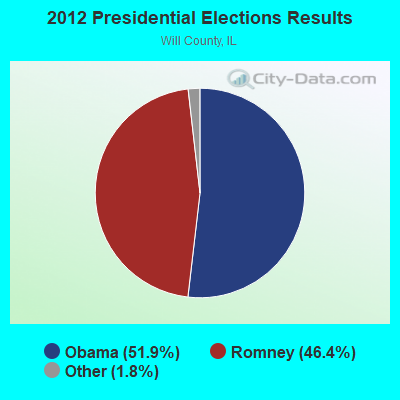
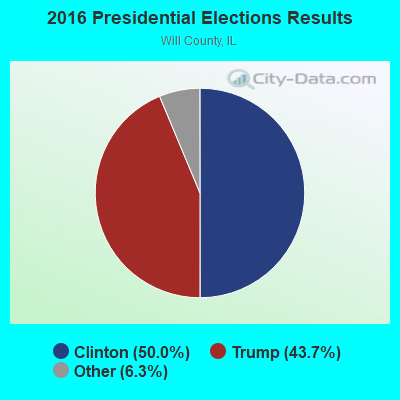
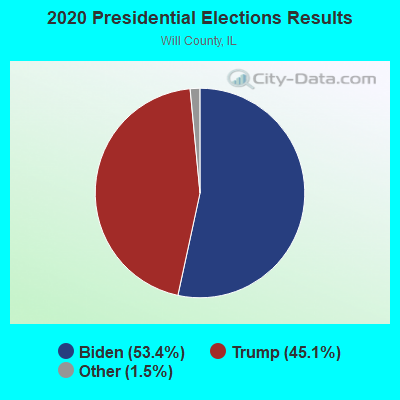
Graphs represent county-level data. Detailed 2008 Election Results
Religion statistics for Mokena, IL (based on Will County data)
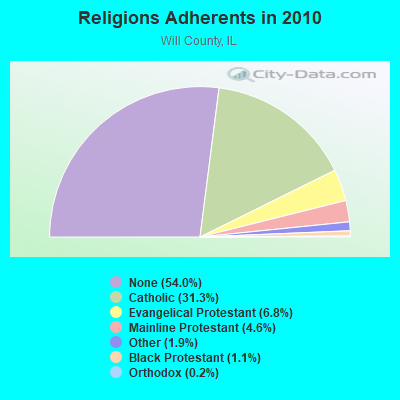
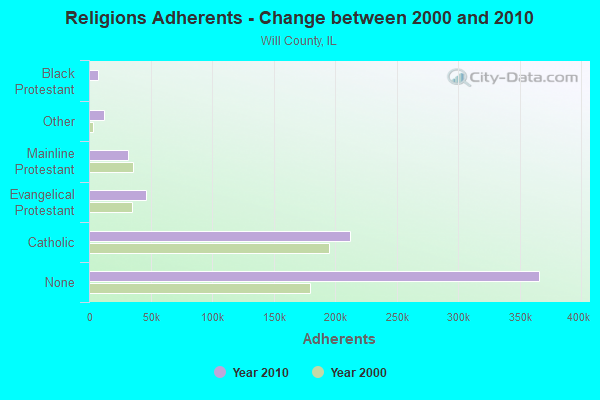
| Religion | Adherents | Congregations |
|---|---|---|
| Catholic | 212,252 | 39 |
| Evangelical Protestant | 46,404 | 188 |
| Mainline Protestant | 31,313 | 73 |
| Other | 12,574 | 20 |
| Black Protestant | 7,426 | 16 |
| Orthodox | 1,536 | 6 |
| None | 366,055 | - |
Food Environment Statistics:
| Will County: | 1.27 / 10,000 pop. |
| Illinois: | 2.24 / 10,000 pop. |
| Will County: | 0.07 / 10,000 pop. |
| Illinois: | 0.08 / 10,000 pop. |
| Will County: | 0.48 / 10,000 pop. |
| Illinois: | 0.75 / 10,000 pop. |
| Will County: | 1.82 / 10,000 pop. |
| Illinois: | 2.61 / 10,000 pop. |
| Will County: | 4.26 / 10,000 pop. |
| State: | 6.86 / 10,000 pop. |
| This county: | 7.7% |
| State: | 8.3% |
| This county: | 26.3% |
| State: | 25.2% |
| This county: | 13.4% |
| Illinois: | 14.5% |
Health and Nutrition:
| Mokena: | 55.0% |
| State: | 49.5% |
| Mokena: | 55.8% |
| Illinois: | 47.2% |
| Mokena: | 28.0 |
| Illinois: | 28.6 |
| Mokena: | 19.9% |
| State: | 20.5% |
| Mokena: | 7.7% |
| Illinois: | 10.8% |
| Mokena: | 6.9 |
| Illinois: | 6.8 |
| Here: | 32.8% |
| Illinois: | 33.4% |
| Mokena: | 62.7% |
| Illinois: | 56.4% |
| This city: | 82.2% |
| Illinois: | 79.9% |
More about Health and Nutrition of Mokena, IL Residents
| Local government employment and payroll (March 2022) | |||||
| Function | Full-time employees | Monthly full-time payroll | Average yearly full-time wage | Part-time employees | Monthly part-time payroll |
|---|---|---|---|---|---|
| Police Protection - Officers | 27 | $269,071 | $119,587 | 0 | $0 |
| Other Government Administration | 12 | $81,335 | $81,335 | 1 | $1,718 |
| Police - Other | 11 | $67,344 | $73,466 | 6 | $13,706 |
| Streets and Highways | 11 | $86,340 | $94,189 | 1 | $809 |
| Financial Administration | 8 | $60,048 | $90,072 | 2 | $3,164 |
| Other and Unallocable | 7 | $48,923 | $83,868 | 1 | $1,928 |
| Water Supply | 5 | $37,047 | $88,913 | 0 | $0 |
| Sewerage | 3 | $23,778 | $95,112 | 0 | $0 |
| Totals for Government | 84 | $673,886 | $96,269 | 11 | $21,325 |
Mokena government finances - Expenditure in 2017 (per resident):
- Construction - Regular Highways: $75,000 ($3.79)
- Current Operations - Water Utilities: $6,644,000 ($336.13)
Police Protection: $4,874,000 ($246.59)
Central Staff Services: $2,564,000 ($129.72)
Regular Highways: $1,733,000 ($87.68)
Solid Waste Management: $1,355,000 ($68.55)
General - Other: $713,000 ($36.07)
Parking Facilities: $242,000 ($12.24)
- General - Interest on Debt: $175,000 ($8.85)
- Intergovernmental to Local - Other - General - Other: $3,185,000 ($161.14)
- Other Capital Outlay - Regular Highways: $1,506,000 ($76.19)
Water Utilities: $919,000 ($46.49)
Central Staff Services: $545,000 ($27.57)
Sewerage: $186,000 ($9.41)
- Total Salaries and Wages: $6,385,000 ($323.03)
Mokena government finances - Revenue in 2017 (per resident):
- Charges - Solid Waste Management: $1,349,000 ($68.25)
Parking Facilities: $327,000 ($16.54)
- Miscellaneous - General Revenue - Other: $1,075,000 ($54.39)
Fines and Forfeits: $123,000 ($6.22)
Interest Earnings: $117,000 ($5.92)
- Revenue - Water Utilities: $7,962,000 ($402.81)
- State Intergovernmental - General Local Government Support: $9,785,000 ($495.04)
Highways: $498,000 ($25.19)
Other: $141,000 ($7.13)
- Tax - Property: $2,591,000 ($131.08)
Other License: $927,000 ($46.90)
Other Selective Sales: $47,000 ($2.38)
Mokena government finances - Debt in 2017 (per resident):
- Long Term Debt - Beginning Outstanding - Unspecified Public Purpose: $6,738,000 ($340.89)
Outstanding Unspecified Public Purpose: $5,870,000 ($296.97)
Retired Unspecified Public Purpose: $868,000 ($43.91)
Mokena government finances - Cash and Securities in 2017 (per resident):
- Other Funds - Cash and Securities: $25,823,000 ($1306.44)
6.75% of this county's 2021 resident taxpayers lived in other counties in 2020 ($73,828 average adjusted gross income)
| Here: | 6.75% |
| Illinois average: | 5.09% |
0.01% of residents moved from foreign countries ($43 average AGI)
Will County: 0.01% Illinois average: 0.01%
Top counties from which taxpayers relocated into this county between 2020 and 2021:
| from Cook County, IL | |
| from DuPage County, IL | |
| from Kendall County, IL |
6.85% of this county's 2020 resident taxpayers moved to other counties in 2021 ($78,688 average adjusted gross income)
| Here: | 6.85% |
| Illinois average: | 6.10% |
0.01% of residents moved to foreign countries ($42 average AGI)
Will County: 0.01% Illinois average: 0.01%
Top counties to which taxpayers relocated from this county between 2020 and 2021:
| to Cook County, IL | |
| to DuPage County, IL | |
| to Kendall County, IL |
| Businesses in Mokena, IL | ||||
| Name | Count | Name | Count | |
|---|---|---|---|---|
| 7-Eleven | 1 | Jones New York | 1 | |
| AT&T | 1 | KFC | 1 | |
| Ace Hardware | 1 | MasterBrand Cabinets | 13 | |
| Advance Auto Parts | 1 | Penske | 1 | |
| Applebee's | 1 | PetSmart | 1 | |
| Ashley Furniture | 1 | Sephora | 1 | |
| Baskin-Robbins | 2 | Sprint Nextel | 1 | |
| CVS | 2 | Subway | 2 | |
| Circle K | 1 | Super 8 | 1 | |
| Curves | 1 | T-Mobile | 1 | |
| Dairy Queen | 1 | U-Haul | 2 | |
| Dennys | 1 | UPS | 8 | |
| Domino's Pizza | 1 | Vans | 1 | |
| Dunkin Donuts | 2 | Walgreens | 1 | |
| FedEx | 5 | Wendy's | 1 | |
| Firestone Complete Auto Care | 1 | White Castle | 1 | |
| JCPenney | 1 | |||
Strongest AM radio stations in Mokena:
- WLS (890 AM; 50 kW; CHICAGO, IL; Owner: WLS, INC.)
- WYLL (1160 AM; 50 kW; CHICAGO, IL; Owner: SCA LICENSE CORPORATION)
- WMVP (1000 AM; 50 kW; CHICAGO, IL; Owner: ABC, INC.)
- WSCR (670 AM; 50 kW; CHICAGO, IL; Owner: INFINITY BROADCASTING OPERATIONS, INC.)
- WVIV (1200 AM; 20 kW; CHICAGO, IL; Owner: WLXX-AM LICENSE CORP.)
- WBBM (780 AM; 50 kW; CHICAGO, IL; Owner: INFINITY BROADCASTING OPERATIONS, INC.)
- WGN (720 AM; 50 kW; CHICAGO, IL; Owner: WGN CONTINENTAL BROADCASTING CO.)
- WRDZ (1300 AM; 4 kW; LA GRANGE, IL; Owner: ABC, INC.)
- WAGG (610 AM; BIRMINGHAM, AL; Owner: CXR HOLDINGS, INC.)
- WNTD (950 AM; 5 kW; CHICAGO, IL; Owner: RADIO UNICA OF CHICAGO LICENSE CORP.)
- WIND (560 AM; 5 kW; CHICAGO, IL; Owner: TICHENOR LICENSE CORPORATION ("TLC"))
- WNWI (1080 AM; 3 kW; OAK LAWN, IL; Owner: BIRACH BROADCASTING CORPORATION)
- WGCI (1390 AM; 5 kW; CHICAGO, IL; Owner: AMFM RADIO LICENSES, L.L.C.)
Strongest FM radio stations in Mokena:
- WCKG (105.9 FM; ELMWOOD PARK, IL; Owner: INFINITY HOLDINGS CORPORATION OF ORLANDO)
- WLIT-FM (93.9 FM; CHICAGO, IL; Owner: AMFM RADIO LICENSES, L.L.C.)
- WJMK (104.3 FM; CHICAGO, IL; Owner: INFINITY BROADCASTING CORP. OF ILLINOIS)
- WNUA (95.5 FM; CHICAGO, IL; Owner: AMFM RADIO LICENSES, L.L.C.)
- WTMX (101.9 FM; SKOKIE, IL; Owner: BONNEVILLE HOLDING COMPANY)
- WBBM-FM (96.3 FM; CHICAGO, IL; Owner: INFINITY BROADCASTING OPERATIONS, INC.)
- WKSC-FM (103.5 FM; CHICAGO, IL; Owner: AMFM RADIO LICENSES, L.L.C.)
- WFMT (98.7 FM; CHICAGO, IL; Owner: WINDOW TO THE WORLD COMMUNICATIONS)
- WZZN (94.7 FM; CHICAGO, IL; Owner: ABC CHICAGO FM RADIO,INC.)
- WGCI-FM (107.5 FM; CHICAGO, IL; Owner: AMFM RADIO LICENSES, L.L.C.)
- WJTW (93.5 FM; JOLIET, IL; Owner: NM LICENSING, LLC)
- WBEZ (91.5 FM; CHICAGO, IL; Owner: THE WBEZ ALLIANCE, INC.)
- WKQX (101.1 FM; CHICAGO, IL; Owner: EMMIS RADIO LICENSE CORPORATION)
- WLUP-FM (97.9 FM; CHICAGO, IL; Owner: BONNEVILLE HOLDING COMPANY)
- WNND (100.3 FM; CHICAGO, IL; Owner: BONNEVILLE HOLDING COMPANY)
- WOJO (105.1 FM; EVANSTON, IL; Owner: TICHENOR LICENSE CORPORATION ("TLC"))
- WUSN (99.5 FM; CHICAGO, IL; Owner: INFINITY BROADCASTING CORPORATION OF CHICAGO)
- WVAZ (102.7 FM; OAK PARK, IL; Owner: AMFM RADIO LICENSES, L.L.C.)
- WDRV (97.1 FM; CHICAGO, IL; Owner: BONNEVILLE HOLDING COMPANY)
- WXRT-FM (93.1 FM; CHICAGO, IL; Owner: INFINITY BROADCASTING OPERATIONS, INC.)
TV broadcast stations around Mokena:
- W54AP (Channel 54; BLUE ISLAND, IL; Owner: CATHOLIC VIEWS BROADCASTS, INC.)
- WLS-TV (Channel 7; CHICAGO, IL; Owner: WLS TELEVISION, INC.)
- WMAQ-TV (Channel 5; CHICAGO, IL; Owner: NBC SUBSIDIARY (WMAQ-TV), INC.)
- WTTW (Channel 11; CHICAGO, IL; Owner: WINDOW TO THE WORLD COMMUNICATIONS, INC.)
- WGN-TV (Channel 9; CHICAGO, IL; Owner: WGN CONTINENTAL BROADCASTING COMPANY)
- WGBO-TV (Channel 66; JOLIET, IL; Owner: WGBO LICENSE PARTNERSHIP, G.P.)
- WBBM-TV (Channel 2; CHICAGO, IL; Owner: CBS BROADCASTING INC.)
- WPWR-TV (Channel 50; GARY, IN; Owner: FOX TELEVISION STATIONS, INC.)
- WXFT (Channel 60; AURORA, IL; Owner: TELEFUTURA CHICAGO LLC)
- WCIU-TV (Channel 26; CHICAGO, IL; Owner: WCIU-TV LIMITED PARTNERSHIP)
- WCPX (Channel 38; CHICAGO, IL; Owner: PAXSON CHICAGO LICENSE, INC.)
- WFLD (Channel 32; CHICAGO, IL; Owner: FOX TELEVISION STATIONS, INC.)
- WYIN (Channel 56; GARY, IN; Owner: NORTHWEST INDIANA PUBLIC BROADCASTING, INC.)
- W68DO (Channel 68; PALATINE, IL; Owner: TRINITY BROADCASTING NETWORK)
- WFBT-CA (Channel 23; CHICAGO, IL; Owner: CHANNEL 23 LIMITED PARTNERSHIP)
- WJYS (Channel 62; HAMMOND, IN; Owner: JOVON BROADCASTING CORPORATION)
- WSNS-TV (Channel 44; CHICAGO, IL; Owner: TELEMUNDO OF CHICAGO, INC.)
- WOCH-LP (Channel 28; CHICAGO, IL; Owner: KM LPTV OF CHICAGO-28, L.L.C.)
- WYCC (Channel 20; CHICAGO, IL; Owner: COLLEGE DIST. #508, COUNTY OF COOK)
- WOCK-CA (Channel 13; CHICAGO, IL; Owner: KM LPTV OF CHICAGO-13, L.L.C.)
- W34CK (Channel 34; ARLINGTON HEIGHTS, IL; Owner: FIRST UNITED, INC.)
- W24AJ (Channel 24; AURORA, IL; Owner: NELSON TV, INC.)
- National Bridge Inventory (NBI) Statistics
- 22Number of bridges
- 194ft / 59.0mTotal length
- $1,643,000Total costs
- 543,750Total average daily traffic
- 73,568Total average daily truck traffic
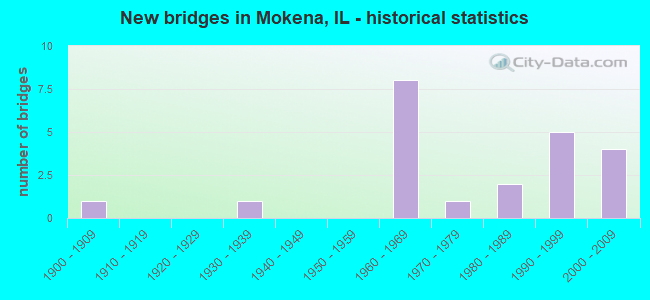
- New bridges - historical statistics
- 11900-1909
- 11930-1939
- 81960-1969
- 11970-1979
- 21980-1989
- 51990-1999
- 42000-2009
FCC Registered Antenna Towers: 48 (See the full list of FCC Registered Antenna Towers)
FCC Registered Private Land Mobile Towers: 6 (See the full list of FCC Registered Private Land Mobile Towers in Mokena, IL)
FCC Registered Broadcast Land Mobile Towers: 12 (See the full list of FCC Registered Broadcast Land Mobile Towers)
FCC Registered Microwave Towers: 23 (See the full list of FCC Registered Microwave Towers in this town)
FCC Registered Paging Towers: 6 (See the full list of FCC Registered Paging Towers)
FCC Registered Amateur Radio Licenses: 87 (See the full list of FCC Registered Amateur Radio Licenses in Mokena)
FAA Registered Aircraft: 17 (See the full list of FAA Registered Aircraft in Mokena)
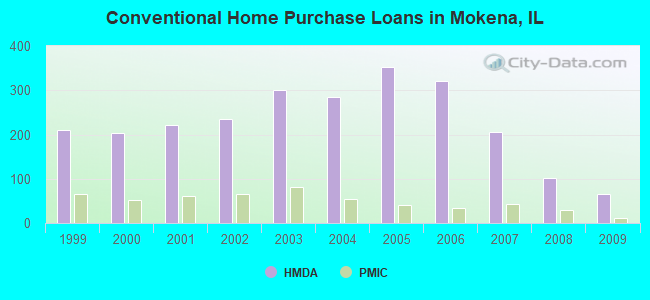
| Home Mortgage Disclosure Act Aggregated Statistics For Year 2009 (Based on 4 partial tracts) | ||||||||||||
| A) FHA, FSA/RHS & VA Home Purchase Loans | B) Conventional Home Purchase Loans | C) Refinancings | D) Home Improvement Loans | F) Non-occupant Loans on < 5 Family Dwellings (A B C & D) | G) Loans On Manufactured Home Dwelling (A B C & D) | |||||||
|---|---|---|---|---|---|---|---|---|---|---|---|---|
| Number | Average Value | Number | Average Value | Number | Average Value | Number | Average Value | Number | Average Value | Number | Average Value | |
| LOANS ORIGINATED | 34 | $226,813 | 66 | $253,238 | 542 | $222,070 | 15 | $139,581 | 8 | $307,349 | 1 | $261,350 |
| APPLICATIONS APPROVED, NOT ACCEPTED | 1 | $79,840 | 5 | $299,958 | 35 | $234,870 | 1 | $79,370 | 1 | $120,230 | 0 | $0 |
| APPLICATIONS DENIED | 4 | $183,760 | 7 | $268,129 | 111 | $242,360 | 6 | $65,640 | 3 | $152,257 | 0 | $0 |
| APPLICATIONS WITHDRAWN | 1 | $342,050 | 4 | $225,805 | 62 | $221,702 | 1 | $127,000 | 1 | $184,610 | 0 | $0 |
| FILES CLOSED FOR INCOMPLETENESS | 0 | $0 | 2 | $228,655 | 25 | $241,450 | 0 | $0 | 0 | $0 | 0 | $0 |
Detailed HMDA statistics for the following Tracts: 8835.01 , 8835.02, 8835.03
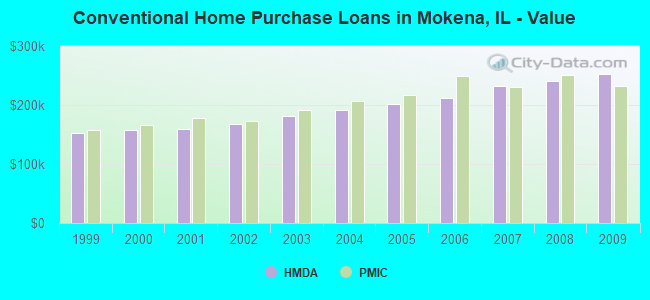
| Private Mortgage Insurance Companies Aggregated Statistics For Year 2009 (Based on 4 partial tracts) | ||||
| A) Conventional Home Purchase Loans | B) Refinancings | |||
|---|---|---|---|---|
| Number | Average Value | Number | Average Value | |
| LOANS ORIGINATED | 11 | $232,556 | 10 | $295,619 |
| APPLICATIONS APPROVED, NOT ACCEPTED | 4 | $249,790 | 6 | $309,732 |
| APPLICATIONS DENIED | 3 | $243,570 | 6 | $258,885 |
| APPLICATIONS WITHDRAWN | 3 | $260,067 | 2 | $186,210 |
| FILES CLOSED FOR INCOMPLETENESS | 0 | $0 | 0 | $0 |
Detailed PMIC statistics for the following Tracts: 8835.01 , 8835.02, 8835.03
2002 - 2018 National Fire Incident Reporting System (NFIRS) incidents
- Fire incident types reported to NFIRS in Mokena, IL
- 36240.9%Structure Fires
- 36040.6%Outside Fires
- 14616.5%Mobile Property/Vehicle Fires
- 182.0%Other
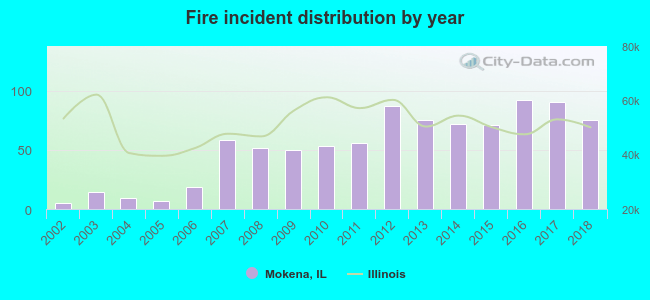 According to the data from the years 2002 - 2018 the average number of fires per year is 52. The highest number of reported fires - 92 took place in 2016, and the least - 5 in 2002. The data has a rising trend.
 When looking into fire subcategories, the most reports belonged to: Structure Fires (40.9%), and Outside Fires (40.6%).
| Most common first names in Mokena, IL among deceased individuals | ||
| Name | Count | Lived (average) |
|---|---|---|
| John | 73 | 73.2 years |
| William | 60 | 73.8 years |
| Mary | 57 | 78.3 years |
| Edward | 41 | 75.1 years |
| Robert | 39 | 71.0 years |
| Charles | 35 | 77.6 years |
| George | 35 | 76.4 years |
| Helen | 29 | 80.8 years |
| Margaret | 28 | 80.6 years |
| Joseph | 28 | 76.3 years |
| Most common last names in Mokena, IL among deceased individuals | ||
| Last name | Count | Lived (average) |
|---|---|---|
| Miller | 15 | 67.8 years |
| Johnson | 13 | 73.9 years |
| Yunker | 12 | 82.4 years |
| Lauffer | 11 | 83.5 years |
| Peterson | 9 | 79.0 years |
| Wilson | 9 | 78.5 years |
| Weber | 9 | 83.1 years |
| Smith | 7 | 71.3 years |
| White | 7 | 75.4 years |
| Kohl | 7 | 84.8 years |
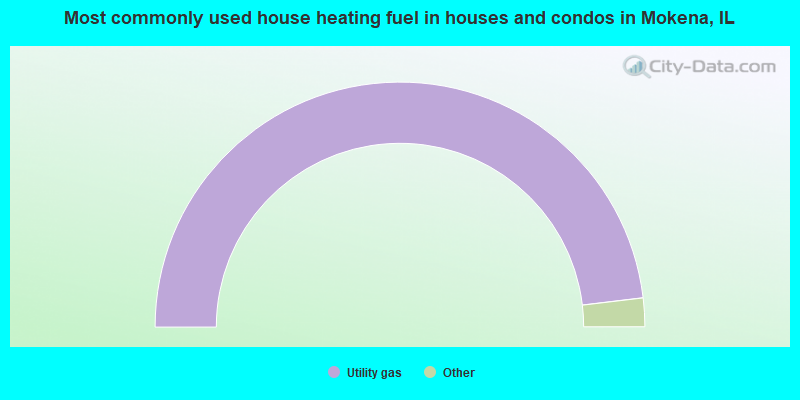
- 96.2%Utility gas
- 3.4%Electricity
- 0.2%Bottled, tank, or LP gas
- 0.1%Wood
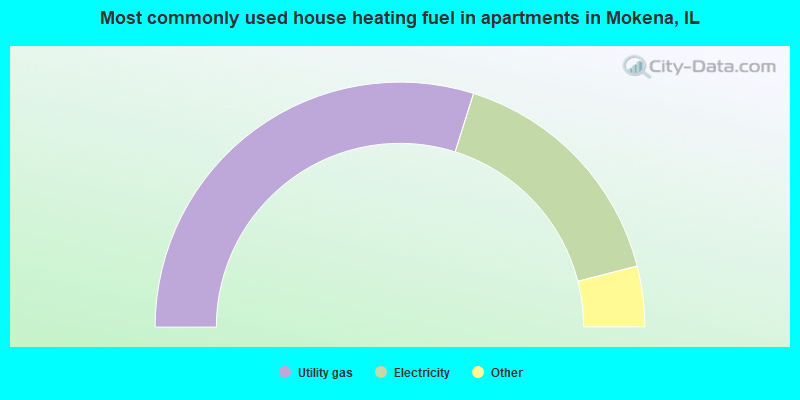
- 59.8%Utility gas
- 32.3%Electricity
- 3.2%Wood
- 2.7%Bottled, tank, or LP gas
- 2.0%No fuel used
Mokena compared to Illinois state average:
- Median house value above state average.
- Unemployed percentage significantly below state average.
- Black race population percentage significantly below state average.
- Hispanic race population percentage below state average.
- Foreign-born population percentage significantly below state average.
- Renting percentage significantly below state average.
- Length of stay since moving in significantly above state average.
- Number of rooms per house above state average.
- House age significantly below state average.
- Percentage of population with a bachelor's degree or higher above state average.

|
|
Total of 186 patent applications in 2008-2024.