Estimated zip code population in 2022: 24,287 Zip code population in 2010: 24,423 Zip code population in 2000: 19,476
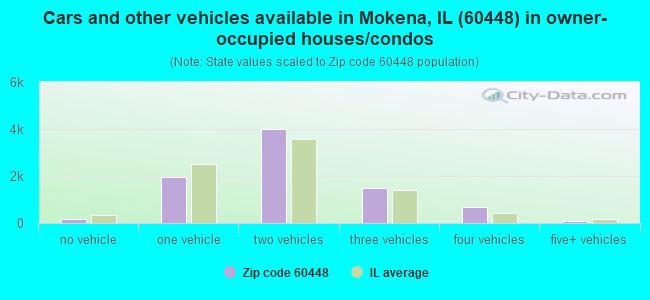
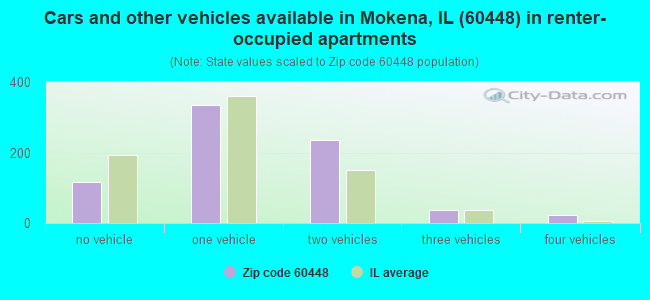
Houses and condos: 9,378 Renter-occupied apartments: 758
% of renters here:
8%
State:
33%
March 2022 cost of living index in zip code 60448: 100.7 (near average, U.S. average is 100)
Land area: 18.1 sq. mi. Water area: 0.0 sq. mi.
Population density: 1,338 people per square mile
(low).
OSM Map
General Map
Google Map
MSN Map
OSM Map
General Map
Google Map
MSN Map
OSM Map
General Map
Google Map
MSN Map
OSM Map
General Map
Google Map
MSN Map
Please wait while loading the map...
Real estate property taxes paid for housing units in 2022:
This zip code:
2.1% ($7,918)
Illinois:
2.0% ($4,912)
Median real estate property taxes paid for housing units with mortgages in 2022: $7,814 (2.1%) Median real estate property taxes paid for housing units with no mortgage in 2022: $8,068 (2.1%)
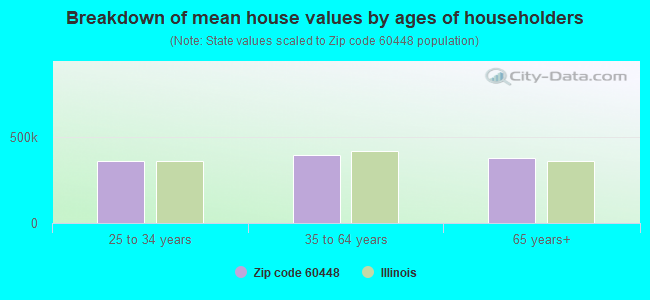
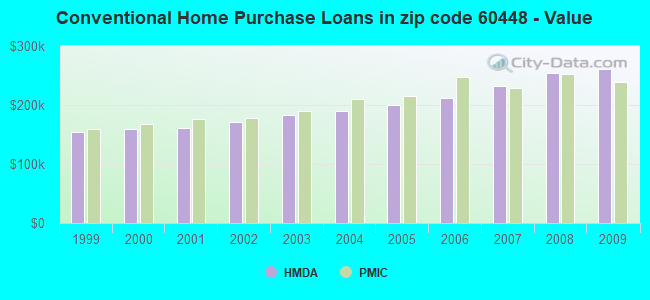
Estimated median house/condo value in 2022: $379,768
60448:
$379,768
Illinois:
$251,600
According to our research of Illinois and other state lists, there were 11 registered sex offenders living in 60448 zip code as of April 27, 2024. The ratio of all residents to sex offenders in zip code 60448 is 2,361 to 1. The ratio of registered sex offenders to all residents in this zip code is much lower than the state average.
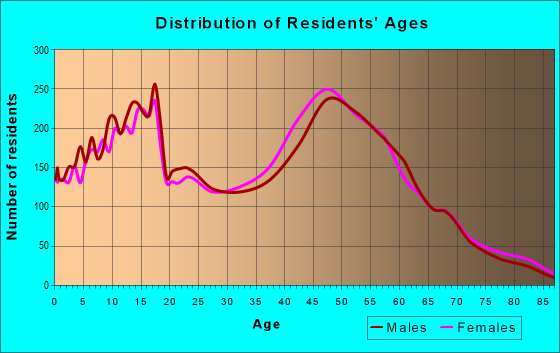
Median resident age:
This zip code:
43.1 years
Illinois median age:
39.1 years
Average household size:
This zip code:
2.6 people
Illinois:
2.4 people
Averages for the 2020 tax year for zip code 60448, filed in 2021:
Average Adjusted Gross Income (AGI) in 2020: $108,471 (Individual Income Tax Returns)
Here:
$108,471
State:
$82,626
Salary/wage: $88,984 (reported on 80.6% of returns)
Here:
$88,984
State:
$66,640
(% of AGI for various income ranges: 1084.1% for AGIs below $25k, 3273.2% for AGIs $25k-50k, 5827.9% for AGIs $50k-75k, 8093.3% for AGIs $75k-100k, 16845.3% for AGIs $100k-200k, 64080.9% for AGIs over 200k)
Taxable interest for individuals: $2,520 (reported on 40.2% of returns)
This zip code:
$2,520
Illinois:
$2,376
(% of AGI for various income ranges: 24.6% for AGIs below $25k, 43.2% for AGIs $25k-50k, 77.7% for AGIs $50k-75k, 81.4% for AGIs $75k-100k, 138.6% for AGIs $100k-200k, 1285.7% for AGIs over 200k)
Ordinary dividends: $5,211 (reported on 33.4% of returns)
Here:
$5,211
State:
$9,061
(% of AGI for various income ranges: 47.2% for AGIs below $25k, 75.8% for AGIs $25k-50k, 102.5% for AGIs $50k-75k, 140.4% for AGIs $75k-100k, 296.1% for AGIs $100k-200k, 2052.8% for AGIs over 200k)
Net capital gain/loss in AGI: +$16,678 (reported on 29.3% of returns)
Here:
+$16,678
State:
+$31,684
(% of AGI for various income ranges: 16.1% for AGIs below $25k, 33.9% for AGIs $25k-50k, 85.1% for AGIs $50k-75k, 179.3% for AGIs $75k-100k, 407.5% for AGIs $100k-200k, 8920.9% for AGIs over 200k)
Profit/loss from business: +$17,626 (reported on 13.8% of returns)
Here:
+$17,626
State:
+$12,175
(% of AGI for various income ranges: 101.4% for AGIs below $25k, 172.9% for AGIs $25k-50k, 179.4% for AGIs $50k-75k, 170.5% for AGIs $75k-100k, 353.4% for AGIs $100k-200k, 2733.8% for AGIs over 200k)
Taxable individual retirement arrangement distribution: $21,134 (reported on 13.2% of returns)
60448:
$21,134
Illinois:
$21,613
(% of AGI for various income ranges: 89.5% for AGIs below $25k, 201.9% for AGIs $25k-50k, 299.6% for AGIs $50k-75k, 460.5% for AGIs $75k-100k, 684.2% for AGIs $100k-200k, 1608.6% for AGIs over 200k)
Self-employed (Keogh) retirement plans: $26,962 (reported on 0.6% of returns)
60448:
$26,962
Illinois:
$30,962
(% of AGI for various income ranges: 19.5% for AGIs $100k-200k, 305.2% for AGIs over 200k)
Total itemized deductions: $29,337 (reported on 15.0% of returns)
Here:
$29,337
State:
$34,948
(% of AGI for various income ranges: 124.3% for AGIs below $25k, 212.2% for AGIs $25k-50k, 427.1% for AGIs $50k-75k, 672.3% for AGIs $75k-100k, 893.1% for AGIs $100k-200k, 3698.1% for AGIs over 200k)
Charity contributions: $7,405 (reported on 12.7% of returns)
Here:
$7,405
State:
$13,122
(% of AGI for various income ranges: 6.1% for AGIs below $25k, 19.4% for AGIs $25k-50k, 47.1% for AGIs $50k-75k, 79.4% for AGIs $75k-100k, 158.9% for AGIs $100k-200k, 1250.0% for AGIs over 200k)
Taxes paid: $9,080 (reported on 14.9% of returns)
60448:
$9,080
State:
$8,563
(% of AGI for various income ranges: 31.2% for AGIs below $25k, 61.1% for AGIs $25k-50k, 156.4% for AGIs $50k-75k, 270.5% for AGIs $75k-100k, 298.3% for AGIs $100k-200k, 934.1% for AGIs over 200k)
Earned income credit: $1,806 (reported on 5.4% of returns)
Here:
$1,806
State:
$2,311
(% of AGI for various income ranges: 35.0% for AGIs below $25k, 32.7% for AGIs $25k-50k)
Percentage of individuals using paid preparers for their 2020 taxes: 92.9%
Here:
93%
State:
93%
(% for various income ranges: 90.8% for AGIs below $25k, 93.2% for AGIs $25k-50k, 92.9% for AGIs $50k-75k, 93.4% for AGIs $75k-100k, 93.8% for AGIs $100k-200k, 94.1% for AGIs over 200k)
Averages for the 2012 tax year for zip code 60448, filed in 2013:
Average Adjusted Gross Income (AGI) in 2012: $85,731 (Individual Income Tax Returns)
Here:
$85,731
State:
$68,058
Salary/wage: $72,490 (reported on 86.2% of returns)
Here:
$72,490
State:
$55,396
(% of AGI for various income ranges: 76.1% for AGIs below $25k, 72.7% for AGIs $25k-50k, 73.2% for AGIs $50k-75k, 76.1% for AGIs $75k-100k, 82.0% for AGIs $100k-200k, 61.4% for AGIs over 200k)
Taxable interest for individuals: $1,893 (reported on 44.0% of returns)
This zip code:
$1,893
Illinois:
$1,969
(% of AGI for various income ranges: 1.5% for AGIs below $25k, 0.8% for AGIs $25k-50k, 0.7% for AGIs $50k-75k, 0.5% for AGIs $75k-100k, 0.5% for AGIs $100k-200k, 1.7% for AGIs over 200k)
Ordinary dividends: $4,904 (reported on 31.1% of returns)
Here:
$4,904
State:
$7,786
(% of AGI for various income ranges: 2.2% for AGIs below $25k, 2.1% for AGIs $25k-50k, 1.1% for AGIs $50k-75k, 1.3% for AGIs $75k-100k, 1.0% for AGIs $100k-200k, 2.9% for AGIs over 200k)
Net capital gain/loss in AGI: +$8,834 (reported on 23.5% of returns)
Here:
+$8,834
State:
+$22,183
(% of AGI for various income ranges: 0.2% for AGIs $25k-50k, 0.3% for AGIs $50k-75k, 0.4% for AGIs $75k-100k, 0.6% for AGIs $100k-200k, 6.5% for AGIs over 200k)
Profit/loss from business: +$16,844 (reported on 13.1% of returns)
Here:
+$16,844
State:
+$12,903
(% of AGI for various income ranges: 6.1% for AGIs below $25k, 3.5% for AGIs $25k-50k, 2.1% for AGIs $50k-75k, 2.3% for AGIs $75k-100k, 1.9% for AGIs $100k-200k, 2.9% for AGIs over 200k)
Taxable individual retirement arrangement distribution: $18,018 (reported on 12.6% of returns)
60448:
$18,018
Illinois:
$17,929
(% of AGI for various income ranges: 4.1% for AGIs below $25k, 3.6% for AGIs $25k-50k, 4.1% for AGIs $50k-75k, 3.2% for AGIs $75k-100k, 2.5% for AGIs $100k-200k, 1.8% for AGIs over 200k)
Self-employment retirement plans: $15,210 (reported on 0.8% of returns)
60448:
$15,210
Illinois:
$24,666
(% of AGI for various income ranges: 0.2% for AGIs $50k-75k, 0.1% for AGIs $100k-200k, 0.3% for AGIs over 200k)
Total itemized deductions: $27,112 (20% of AGI, reported on 54.3% of returns)
Here:
$27,112
State:
$26,433
Here:
20.2% of AGI
State:
19.2% of AGI
(% of AGI for various income ranges: 16.1% for AGIs below $25k, 17.7% for AGIs $25k-50k, 20.0% for AGIs $50k-75k, 21.0% for AGIs $75k-100k, 18.9% for AGIs $100k-200k, 13.2% for AGIs over 200k)
Charity contributions: $3,081 (reported on 48.6% of returns)
Here:
$3,081
State:
$4,525
(% of AGI for various income ranges: 0.9% for AGIs below $25k, 1.5% for AGIs $25k-50k, 1.5% for AGIs $50k-75k, 1.9% for AGIs $75k-100k, 1.8% for AGIs $100k-200k, 1.9% for AGIs over 200k)
Taxes paid: $13,393 (reported on 54.2% of returns)
60448:
$13,393
State:
$11,968
(% of AGI for various income ranges: 6.0% for AGIs below $25k, 7.1% for AGIs $25k-50k, 8.7% for AGIs $50k-75k, 9.5% for AGIs $75k-100k, 9.6% for AGIs $100k-200k, 7.4% for AGIs over 200k)
Earned income credit: $1,837 (reported on 6.7% of returns)
Here:
$1,837
State:
$2,349
(% of AGI for various income ranges: 2.9% for AGIs below $25k, 0.6% for AGIs $25k-50k)
Percentage of individuals using paid preparers for their 2012 taxes: 59.3%
Here:
59%
State:
57%
(% for various income ranges: 49.6% for AGIs below $25k, 57.0% for AGIs $25k-50k, 61.9% for AGIs $50k-75k, 66.4% for AGIs $75k-100k, 64.6% for AGIs $100k-200k, 75.0% for AGIs over 200k)
Averages for the 2004 tax year for zip code 60448, filed in 2005:
Average Adjusted Gross Income (AGI) in 2004: $70,701 (Individual Income Tax Returns)
Here:
$70,701
State:
$54,625
Salary/wage: $60,124 (reported on 88.5% of returns)
Here:
$60,124
State:
$46,811
(% of AGI for various income ranges: 124.6% for AGIs below $10k, 71.4% for AGIs $10k-25k, 78.2% for AGIs $25k-50k, 82.6% for AGIs $50k-75k, 86.3% for AGIs $75k-100k, 68.8% for AGIs over 100k)
Taxable interest for individuals: $1,400 (reported on 60.9% of returns)
This zip code:
$1,400
Illinois:
$2,101
(% of AGI for various income ranges: 7.0% for AGIs below $10k, 3.1% for AGIs $10k-25k, 1.9% for AGIs $25k-50k, 1.1% for AGIs $50k-75k, 0.8% for AGIs $75k-100k, 1.0% for AGIs over 100k)
Taxable dividends: $2,046 (reported on 33.7% of returns)
Here:
$2,046
State:
$4,306
(% of AGI for various income ranges: 3.2% for AGIs below $10k, 1.8% for AGIs $10k-25k, 1.1% for AGIs $25k-50k, 0.7% for AGIs $50k-75k, 0.7% for AGIs $75k-100k, 1.0% for AGIs over 100k)
Net capital gain/loss: +$18,627 (reported on 26.1% of returns)
Here:
+$18,627
State:
+$17,321
(% of AGI for various income ranges: -4.1% for AGIs below $10k, 0.6% for AGIs $10k-25k, 0.5% for AGIs $25k-50k, 0.6% for AGIs $50k-75k, 0.4% for AGIs $75k-100k, 12.1% for AGIs over 100k)
Profit/loss from business: +$16,748 (reported on 12.8% of returns)
Here:
+$16,748
State:
+$11,771
(% of AGI for various income ranges: 3.4% for AGIs below $10k, 5.1% for AGIs $10k-25k, 3.2% for AGIs $25k-50k, 3.0% for AGIs $50k-75k, 2.3% for AGIs $75k-100k, 3.1% for AGIs over 100k)
IRA payment deduction: $3,283 (reported on 3.4% of returns)
60448:
$3,283
Illinois:
$3,087
(% of AGI for various income ranges: 0.2% for AGIs $10k-25k, 0.3% for AGIs $25k-50k, 0.2% for AGIs $50k-75k, 0.2% for AGIs $75k-100k, 0.1% for AGIs over 100k)
Self-employed pension: $13,343 (reported on 1.0% of returns)
Here:
$13,343
Illinois:
$16,965
(% of AGI for various income ranges: 0.1% for AGIs $25k-50k, 0.1% for AGIs $50k-75k, 0.1% for AGIs $75k-100k, 0.3% for AGIs over 100k)
Total itemized deductions: $20,483 (19% of AGI, reported on 54.8% of returns)
Here:
$20,483
State:
$20,239
Here:
19.2% of AGI
State:
19.5% of AGI
(% of AGI for various income ranges: 14.6% for AGIs below $10k, 16.4% for AGIs $10k-25k, 17.5% for AGIs $25k-50k, 20.7% for AGIs $50k-75k, 19.6% for AGIs $75k-100k, 13.2% for AGIs over 100k)
Charity contributions deductions: $2,723 (2% of AGI, reported on 51.7% of returns)
Here:
$2,723
State:
$3,719
Here:
2.5% of AGI
State:
3.4% of AGI
(% of AGI for various income ranges: 0.6% for AGIs below $10k, 1.2% for AGIs $10k-25k, 1.6% for AGIs $25k-50k, 2.1% for AGIs $50k-75k, 2.2% for AGIs $75k-100k, 2.0% for AGIs over 100k)
Total tax: $11,717 (reported on 82.0% of returns)
60448:
$11,717
State:
$9,882
(% of AGI for various income ranges: 3.0% for AGIs below $10k, 4.7% for AGIs $10k-25k, 7.6% for AGIs $25k-50k, 8.6% for AGIs $50k-75k, 9.5% for AGIs $75k-100k, 17.8% for AGIs over 100k)
Earned income credit: $1,463 (reported on 4.7% of returns)
Here:
$1,463
State:
$1,788
Percentage of individuals using paid preparers for their 2004 taxes: 59.5%
Here:
59%
State:
61%
(% for various income ranges: 43.9% for AGIs below $10k, 54.8% for AGIs $10k-25k, 60.2% for AGIs $25k-50k, 67.5% for AGIs $50k-75k, 65.7% for AGIs $75k-100k, 65.9% for AGIs over 100k)
Likely homosexual households (counted as self-reported same-sex unmarried-partner households)
Lesbian couples: 0.1% of all households
Gay men: 0.0% of all households
Household received Food Stamps/SNAP in the past 12 months: 179 Household did not receive Food Stamps/SNAP in the past 12 months: 8,845
Women who had a birth in the past 12 months: 252 (242 now married, 8 unmarried) Women who did not have a birth in the past 12 months: 4,817 (2,220 now married, 2,585 unmarried)
Housing units in zip code 60448 with a mortgage: 6,022 (547 second mortgage, 507 both second mortgage and home equity loan) Houses without a mortgage: 115
Median monthly owner costs for units with a mortgage: $2,277 Median monthly owner costs for units without a mortgage: $1,136
Residents with income below the poverty level in 2022:
This zip code:
4.3%
Whole state:
11.9%
Residents with income below 50% of the poverty level in 2022:
This zip code:
1.8%
Whole state:
5.7%
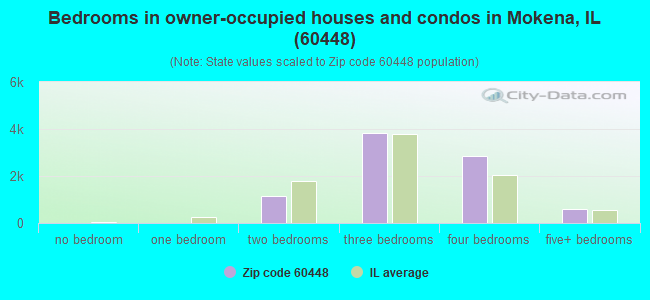
Median number of rooms in houses and condos:
Here:
7.3
State:
6.4
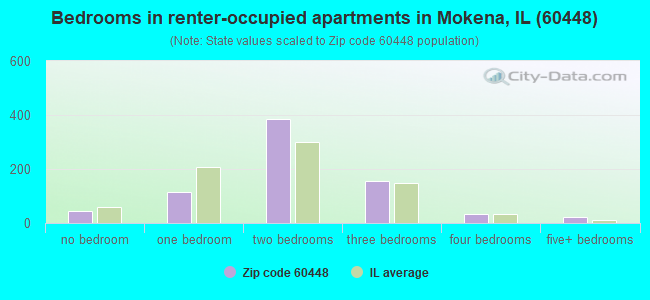
Median number of rooms in apartments:
Here:
4.2
State:
4.1
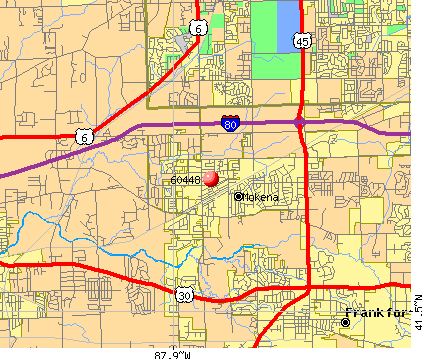
Notable locations in this zip code not listed on our city pages
Notable locations in zip code 60448: Willow Run Golf Course (A), 80th Avenue Industrial Park (B), Corporate Corridors (C), Normal Towers Industrial Park (D), Mokena Crossings Business Park (E), Oliveri Business Park (F), Mokena Community Public Library (G), Mokena Fire Protection District Station 2 (H), New Lenox Fire Protection District Station 4 (I), Mokena Fire Protection District Station 1 (J). Display/hide their locations on the map
Churches in zip code 60448 include: Grace Fellowship Church (A), Mokena United Methodist Church (B), Saint John's United Church (C), Mokena Church (D). Display/hide their locations on the map
Parks in zip code 60448 include: Willowview Park (1), Van Horne Woods Forest Preserve (2), Haley Park (3), Heght Park (4), Hickory Creek County Forest Preserve (5), Mokena Park (6). Display/hide their locations on the map
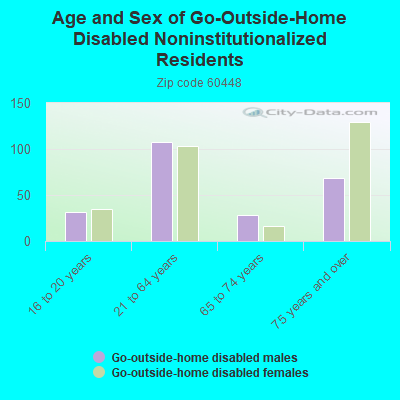
In group quarters: 18 (-1 institutionalized population)
Size of family households: 2,905 2-persons, 1,937 3-persons, 1,377 4-persons, 486 5-persons, 216 6-persons, 52 7-or-more-persons
Size of nonfamily households: 1,800 1-person, 315 2-persons, 26 3-persons
4,203 married couples with children.
715 single-parent households (229 men, 486 women).
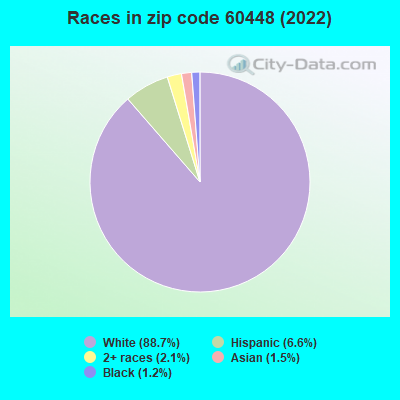
94.9% of residents of 60448 zip code speak English at home.
1.7% of residents speak Spanish at home (98% very well, 2% well).
1.5% of residents speak other Indo-European language at home (68% very well, 18% well, 15% not well).
1.2% of residents speak Asian or Pacific Island language at home (57% very well, 30% well, 13% not at all).
0.1% of residents speak other language at home (100% very well).
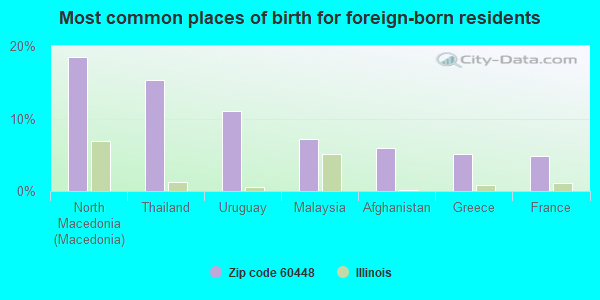
Foreign born population: 642 (2.6%) (81.3% of them are naturalized citizens)
This zip code:
2.6%
Whole state:
14.4%
18%North Macedonia (Macedonia)
15%Thailand
11%Uruguay
7%Malaysia
6%Afghanistan
5%Greece
5%France
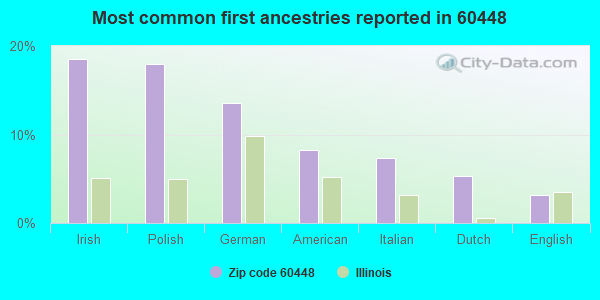
18%Irish
18%Polish
14%German
8%American
7%Italian
5%Dutch
3%English
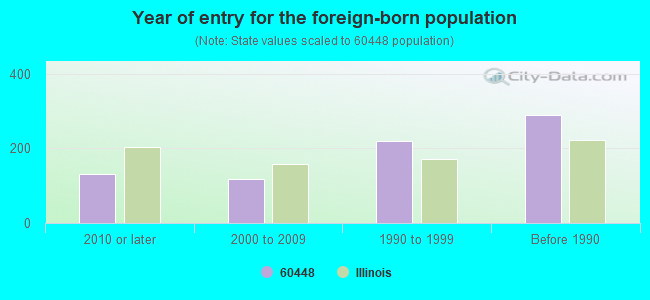
Year of entry for the foreign-born population
1322010 or later
1172000 to 2009
2191990 to 1999
289Before 1990
Major facilities with environmental interests located in this zip code:
A&M CARTAGE (8300 W 191ST ST in MOKENA, IL)
STATE MASTER (Illinois EPA Project) - HAZARDOUS WASTE PROGRAM STATE MASTER (Illinois EPA Project) - National Pollutant Discharge Elimination System Permit ENFORCEMENT/COMPLIANCE ACTIVITY (Integrated Compliance Information System) FORMAL ENFORCEMENT ACTION (Integrated Compliance Information System) National Pollutant Discharge Elimination System NON-MAJOR (Tracking pollutant discharge elimination systems) - permit Small Quantity Generators, between 100 kg and 1000 kg of hazardous waste/month (Resource Conservation and Recovery Act (tracking hazardous waste)) - notification Business SIC classification: TRUCKING, EXCEPT LOCAL Organizations: A & M CARTAGE (CONTACT/OWNER)
, BADALI AUGUST D (CONTACT/OWNER)
Alternative names: A & M CARTAGE OF TINLEY PARK INC
OZINGA ILLINOIS RMC INC (18825 OLD LAGRANGE RD. in MOKENA, IL)
STATE MASTER (Illinois EPA Project) - AIR PROGRAM, SOLID WASTE PROGRAM, National Pollutant Discharge Elimination System Permit AIR MINOR (AIRS/AFS) CRITERIA AND HAZARDOUS AIR POLLUTANT INVENTORY (Inventory of air pollution sources) National Pollutant Discharge Elimination System NON-MAJOR (Tracking pollutant discharge elimination systems) - permit TRI REPORTER (Tracking of toxic chemicals releasing facilities) Business SIC classification: READY-MIXED CONCRETE Business NAICS classification: READY-MIX CONCRETE MANUFACTURING. Organizations: ILLINOIS OZINGA PLANTS (CONTACT/OWNER)
Alternative names: IL OZINGA PLANTS-MOKENA, OZINGA brothers, OZINGA ILLINOIS READY MIX, OZINGA IL RMC - MOKENA
MOBIL PIPE LINE CO (10915 W. 183RD. in MOKENA, IL)
STATE MASTER (Illinois EPA Project) - SOLID WASTE PROGRAM, HAZARDOUS WASTE PROGRAM, AIR PROGRAM AIR MAJOR (AIRS/AFS) CRITERIA AND HAZARDOUS AIR POLLUTANT INVENTORY (Inventory of air pollution sources) (Resource Conservation and Recovery Act (tracking hazardous waste)) Business SIC classification: CRUDE PETROLEUM PIPELINES Business NAICS classification: PIPELINE TRANSPORTATION OF CRUDE OIL. Organizations: MOBIL PIPELINE CO (CONTACT/OWNER)
Alternative names: MOBIL PIPE LINE CO MOKENA STA
SAFETY-KLEEN CORP. (9626-9631 WEST 194TH ST. in MOKENA, IL)
AIR MINOR (AIRS/AFS) National Pollutant Discharge Elimination System NON-MAJOR (Tracking pollutant discharge elimination systems) - permit Large Quantity Generators, more that 1000 kg of hazardous waste/month (Resource Conservation and Recovery Act (tracking hazardous waste)) - notification TRANSPORTER (Resource Conservation and Recovery Act (tracking hazardous waste)) - notification TSD (Resource Conservation and Recovery Act (tracking hazardous waste)) - notification Business SIC classification: BUSINESS SERVICES Business NAICS classification: PLASTICS PIPE AND PIPE FITTING MANUFACTURING. Organizations: SAFETY KLEEN CORP ELGIN IL (CONTACT/OPERATOR)
Alternative names: SAFETY KLEEN CORP 5 034 05
NU WAY DISPOSAL SERVICE INC (19008 S WOLF RD in MOKENA, IL)
STATE MASTER (Illinois EPA Project) - SOLID WASTE PROGRAM, HAZARDOUS WASTE PROGRAM Large Quantity Generators, more that 1000 kg of hazardous waste/month (Resource Conservation and Recovery Act (tracking hazardous waste)) - notification TRANSPORTER (Resource Conservation and Recovery Act (tracking hazardous waste)) - notification
AMOCO OIL CO (9545 W 191ST ST in MOKENA, IL)
STATE MASTER (Illinois EPA Project) - SOLID WASTE PROGRAM, HAZARDOUS WASTE PROGRAM, AIR PROGRAM AIR MINOR (AIRS/AFS) Conditionally Exempt Small Quantity Generators, less than 100 kg/month of hazardous waste (Resource Conservation and Recovery Act (tracking hazardous waste)) - notification Business SIC classification: GASOLINE SERVICE STATIONS Organizations: AMOCO DIRECT RETAIL OPERATIONS (CONTACT/OWNER)
Alternative names: AMOCO ACA MGMT SVCS, BP AMOCO CORPORATION STATION #3803
MOKENA WALL PAPER CO (19806 WOLF RD in MOKENA, IL)
STATE MASTER (Illinois EPA Project) - SOLID WASTE PROGRAM, HAZARDOUS WASTE PROGRAM, AIR PROGRAM AIR MINOR (AIRS/AFS) Conditionally Exempt Small Quantity Generators, less than 100 kg/month of hazardous waste (Resource Conservation and Recovery Act (tracking hazardous waste)) - notification Business SIC classification: CONVERTED PAPER AND PAPERBOARD PRODUCTS
CHICAP PIPELINE CO (18401 S. WOLF RD. in MOKENA, IL)
STATE MASTER (Illinois EPA Project) - AIR PROGRAM AIR MINOR (AIRS/AFS) CRITERIA AND HAZARDOUS AIR POLLUTANT INVENTORY (Inventory of air pollution sources) Business SIC classification: CRUDE PETROLEUM PIPELINES Alternative names: CHICAP UNOCAL PIPELINE COMPANY
HYDRO-TEK ENVIRONMENTAL SYSTEMS (8501 WEST 191ST STREET, UNIT 4 in MOKENA, IL)
STATE MASTER (Illinois EPA Project) - AIR PROGRAM AIR MINOR (AIRS/AFS) CRITERIA AND HAZARDOUS AIR POLLUTANT INVENTORY (Inventory of air pollution sources) Business SIC classification: INDUSTRIAL MACHINERY AND EQUIPMENT
MOKENA STP (11400 191ST STREET in MOKENA, IL)
STATE MASTER (Illinois EPA Project) - National Pollutant Discharge Elimination System Permit National Pollutant Discharge Elimination System MAJOR (Tracking pollutant discharge elimination systems) - permit National Pollutant Discharge Elimination System NON-MAJOR (Tracking pollutant discharge elimination systems) - permit Business SIC classification: SEWERAGE SYSTEMS Alternative names: MOKENA SEWAGE TREATMENT PLANT, MOKENA STP, VILLAGE OF
KENDALL COUNTY CONCRETE CRUSHING INC (9550 187TH ST in MOKENA, IL)
STATE MASTER (Illinois EPA Project) - AIR PROGRAM AIR MINOR (AIRS/AFS) CRITERIA AND HAZARDOUS AIR POLLUTANT INVENTORY (Inventory of air pollution sources) Business SIC classification: NONCLASSIFIABLE ESTABLISHMENTS
LAIDLAW TRANSIT INC (9631 W 194TH PL in MOKENA, IL)
STATE MASTER (Illinois EPA Project) - SOLID WASTE PROGRAM, HAZARDOUS WASTE PROGRAM (Resource Conservation and Recovery Act (tracking hazardous waste)) Organizations: RAM INVESTMENT (CONTACT/OWNER)
LEWIS EXCAVATING & TRUCKING (49 FLORENCE RD. in MOKENA, IL)
STATE MASTER (Illinois EPA Project) - National Pollutant Discharge Elimination System Permit National Pollutant Discharge Elimination System NON-MAJOR (Tracking pollutant discharge elimination systems) - permit
Housing units lacking complete plumbing facilities: 0.3% Housing units lacking complete kitchen facilities: 0.6%
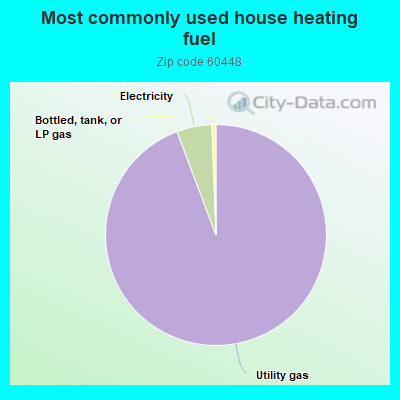
93.8%Utility gas
5.1%Electricity
0.6%Bottled, tank, or LP gas
Population in 1990: 12,324. Population change in the 1990s: +7,152 (+58.0%).
Place of birth for U.S.-born residents:
This state: 20,998
Northeast: 359
Midwest: 1,447
South: 330
West: 295
63% of the 60448 zip code residents lived in the same house 5 years ago. Out of people who lived in different houses, 31% lived in this county. Out of people who lived in different counties, 50% lived in Illinois.
95% of the 60448 zip code residents lived in the same house 1 year ago. Out of people who lived in different houses, 64% moved from this county. Out of people who lived in different houses, 22% moved from different county within same state. Out of people who lived in different houses, 12% moved from different state. Out of people who lived in different houses, 2% moved from abroad.
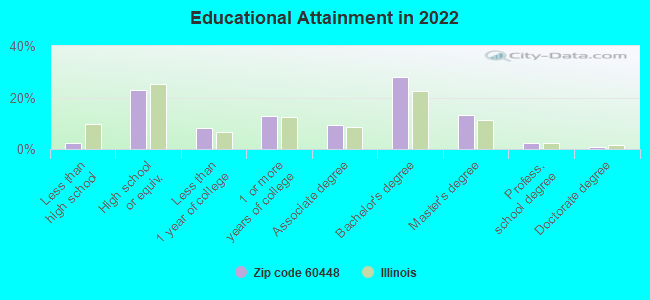
Private vs. public school enrollment:
Students in private schools in grades 1 to 8 (elementary and middle school): 184
Here:
8.4%
Illinois:
13.3%
Students in private schools in grades 9 to 12 (high school): 216
Here:
14.3%
Illinois:
9.9%
Students in private undergraduate colleges: 572
Here:
52.2%
Illinois:
27.4%
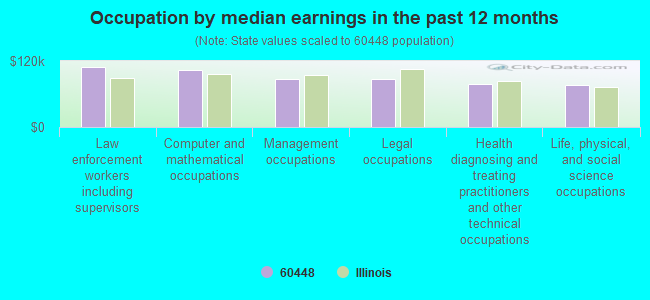
Occupation by median earnings in the past 12 months ($)
109,445Law enforcement workers including supervisors
103,054Computer and mathematical occupations
87,064Management occupations
86,963Legal occupations
78,058Health diagnosing and treating practitioners and other technical occupations
76,378Life, physical, and social science occupations
Companies with federal contracts located in this zip code (MOKENA, IL):
NORTH CENTRAL CRANE & EXCAVATO (19149 SOUTH BLACKHAWK PARK; small business) : $2,370,099 in 16 contractsfrom 2000 to 2004
Contracts for Cranes and Crane-Shovels, Miscellaneous Construction Equipment, Miscellaneous Materials Handling Equipment, Maintenance, Repair and Rebuilding of Equipment -- Service and Trade Equipment, and moreby U.S. Army Corps of Engineers - civil program financing only, Army Signed by year:2000: $75,002; 2001: $4,893; 2002: $2,298,921; 2003: -$8,717; 2004: $0; 2005: $0; 2006: $0.
Biggest contracts:
$2,249,343 with U.S. Army Corps of Engineers - civil program financing only for Cranes and Crane-Shovels. Signed on 2002-09-20. Completion date: 2003-12-09.
$47,988 with U.S. Army Corps of Engineers - civil program financing only for Miscellaneous Construction Equipment. Signed on 2000-06-07. Completion date: 2000-07-31.
$27,014 with U.S. Army Corps of Engineers - civil program financing only for Miscellaneous Materials Handling Equipment. Signed on 2000-05-03. Completion date: 2000-06-13.
$25,746 with U.S. Army Corps of Engineers - civil program financing only for Maintenance, Repair and Rebuilding of Equipment -- Service and Trade Equipment. Signed on 2002-04-24. Completion date: 2002-05-13.
AMERICAN WELDING & GAS SUPPLY, (18971 S. WOLF ROAD; small business)
$25,753 with Army for Valves, Nonpowered. Signed on 2000-01-24. Completion date: 2000-03-03.
NEW LENOX PAVING, INC (14047 W MAPLE RD US HWY 6; small business) : $24,840 in 3 contractsin 2005
$12,020 with Army for Miscellaneous Construction Materials. Signed on 2005-09-09. Completion date: 2005-08-24.
$12,020 with U.S. Army Corps of Engineers - civil program financing only for Miscellaneous Construction Materials. Signed on 2005-09-09. Completion date: 2005-08-24.
$800 with Army for Maintenance, Repair or Alteration of Real Property -- Highways, Roads, Streets, Bridges, and Railways (includes resurfacing). Signed on 2005-11-28. Completion date: 2005-08-24.
INNOVATIVE DOCUMENT SOLUTIONS, (19657 S LA GRANGE RD; small business)
$11,897 with Army for Miscellaneous Office Machines. Signed on 2003-01-16. Completion date: 2003-01-31.
SUPERHEAT FGH SERVICES, INC (10201 191ST ST BLDG 1; small business)
$5,000 with Air Force for ADP Software. Signed on 2005-04-08. Completion date: 2005-05-08.
SPECIFIC PRESS BRAKE DIES, INC (9439 ENTERPRISE DR; small business)
$2,856 with Army for Hand Tools, Nonedged, Nonpowered. Signed on 2005-07-22. Completion date: 2005-08-05.
Top industries in this zip code by the number of employees in 2005:
2002 - 2018 National Fire Incident Reporting System (NFIRS) incidents
Based on the data from the years 2002 - 2018 the average number of fires per year is 63. The highest number of reported fire incidents - 93 took place in 2017, and the least - 11 in 2004. The data has a declining trend.
When looking into fire subcategories, the most reports belonged to: Outside Fires (45.7%), and Structure Fires (33.7%).
Fire incident types reported to NFIRS in Zip Code 60448


 Nearest zip codes: 60487, 60467, 60451, 60423, 60491, 60462.


 Based on the data from the years 2002 - 2018 the average number of fires per year is 63. The highest number of reported fire incidents - 93 took place in 2017, and the least - 11 in 2004. The data has a declining trend.
 When looking into fire subcategories, the most reports belonged to: Outside Fires (45.7%), and Structure Fires (33.7%).