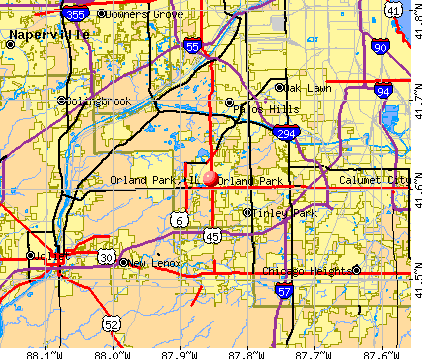
Orland Park, Illinois

Orland Park: City Hall
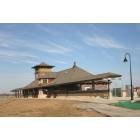
Orland Park: Completed Orland Park Metra Train Station - 143rd St. & SW Highway
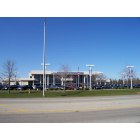
Orland Park: The Mercedes-Benz of Orland Park dealership.
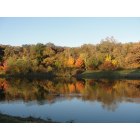
Orland Park: Fall Morning on Ravinia - October 2010
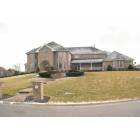
Orland Park: An Orland Park home
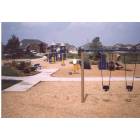
Orland Park: Orland Woods Park
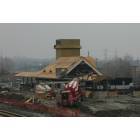
Orland Park: New Orland Park Metra Train Station - 143rd St. & SW Highway
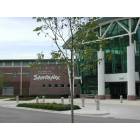
Orland Park: Sportsplex
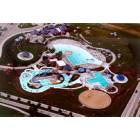
Orland Park: Orland Park Aquatic Center
- add
your
Submit your own pictures of this village and show them to the world
- OSM Map
- General Map
- Google Map
- MSN Map
Population change since 2000: +12.6%
 |
| Males: 29,269 | |
| Females: 28,242 |
| Median resident age: | 47.3 years |
| Illinois median age: | 39.1 years |
Zip codes: 60464.
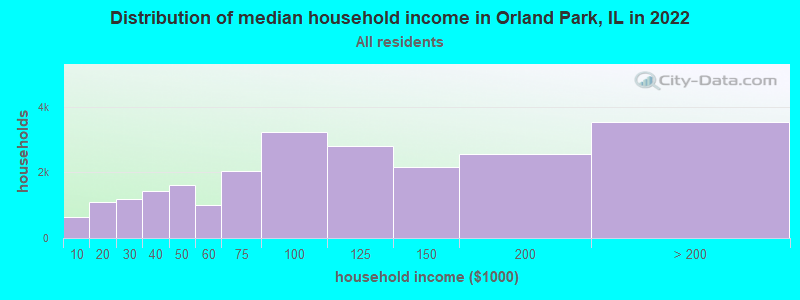
| Orland Park: | $95,286 |
| IL: | $76,708 |
Estimated per capita income in 2022: $49,915 (it was $30,467 in 2000)
Orland Park village income, earnings, and wages data
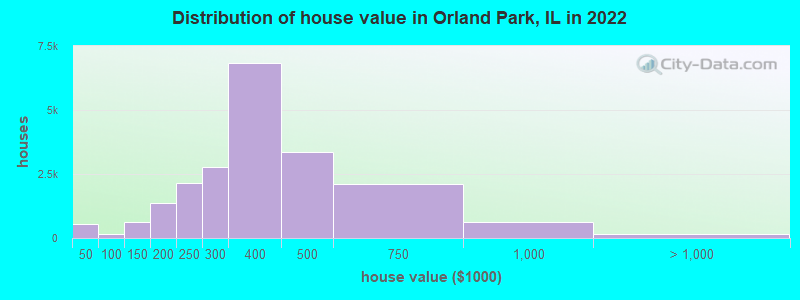
Estimated median house or condo value in 2022: $346,656 (it was $196,700 in 2000)
| Orland Park: | $346,656 |
| IL: | $251,600 |
Mean prices in 2022: all housing units: $394,527; detached houses: $459,116; townhouses or other attached units: $299,838; in 2-unit structures: $420,686; in 3-to-4-unit structures: $210,067; in 5-or-more-unit structures: $241,869
Median gross rent in 2022: $1,389.
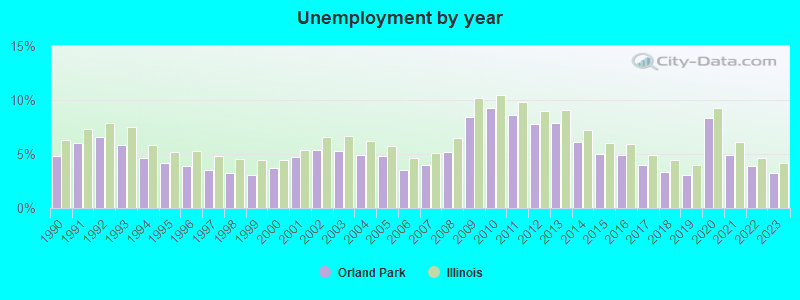
(4.9% for White Non-Hispanic residents, 5.8% for Black residents, 7.9% for Hispanic or Latino residents, 8.1% for other race residents, 7.5% for two or more races residents)
Detailed information about poverty and poor residents in Orland Park, IL


Compare current foreclosures in Orland Park, IL:
| Photo | Address | Area | Beds / Baths | Price | Details |
|---|---|---|---|---|---|

|
#1
W 135th St
Orland Park, IL 60462
|
3,639 sq. feet
|
4 baths 5 beds |
$560,500
|
show details |

|
#2
Catherine Dr
Orland Park, IL 60462
|
2,716 sq. feet
|
2 baths 4 beds |
show details | |

|
#3
Binford Dr
Orland Park, IL 60462
|
3,374 sq. feet
|
2 baths 4 beds |
show details | |

|
#4
Fir St
Orland Park, IL 60462
|
1,146 sq. feet
|
2 baths 4 beds |
show details | |

|
#5
Kilrea Dr
Orland Park, IL 60462
|
- sq. feet
|
2 baths 2 beds |
show details | |

|
#6
Ashley Dr
Orland Park, IL 60462
|
2,079 sq. feet
|
2 baths - beds |
show details | |

|
#7
Merion Dr
Orland Park, IL 60462
|
2,728 sq. feet
|
2 baths - beds |
show details | |

|
#8
Wheeler Dr
Orland Park, IL 60462
|
1,535 sq. feet
|
1 baths - beds |
show details | |

|
#9
S 83rd Ave
Orland Park, IL 60462
|
1,150 sq. feet
|
1 baths - beds |
show details | |

|
#10
W 140th St
Orland Park, IL 60462
|
1,791 sq. feet
|
2 baths - beds |
show details |
| Photo | Address | Area | Beds / Baths | Price | Details |
|---|---|---|---|---|---|

|
#11
Fountain Hill Dr
Orland Park, IL 60467
|
2,776 sq. feet
|
2 baths - beds |
show details | |

|
#12
Silver Ct
Orland Park, IL 60462
|
2,371 sq. feet
|
2 baths - beds |
show details | |

|
#13
Quail Hollow Dr Apt 205
Orland Park, IL 60462
|
- sq. feet
|
- baths - beds |
show details | |

|
#14
Fairway Dr
Orland Park, IL 60462
|
988 sq. feet
|
1 baths - beds |
show details | |

|
#15
Pineview Ct
Orland Park, IL 60467
|
1,910 sq. feet
|
2 baths - beds |
show details | |

|
#16
Ruggles Ct
Orland Park, IL 60467
|
1,770 sq. feet
|
2 baths - beds |
show details | |

|
#17
Highgate Ct
Orland Park, IL 60462
|
2,478 sq. feet
|
2 baths - beds |
show details | |

|
#18
Orchid Ln
Orland Park, IL 60462
|
1,830 sq. feet
|
2 baths - beds |
show details | |

|
#19
Eynsford Dr
Orland Park, IL 60462
|
1,926 sq. feet
|
2 baths - beds |
show details | |

|
#20
Brookshire Dr
Orland Park, IL 60467
|
1,515 sq. feet
|
2 baths - beds |
show details |
| Photo | Address | Area | Beds / Baths | Price | Details |
|---|---|---|---|---|---|

|
#21
Maple Ave
Orland Park, IL 60462
|
1,574 sq. feet
|
3 baths - beds |
show details | |

|
#22
Sherwood Dr
Orland Park, IL 60462
|
1,242 sq. feet
|
2 baths - beds |
show details | |

|
#23
Brookfield Cir
Orland Park, IL 60467
|
2,516 sq. feet
|
2 baths - beds |
show details | |

|
#24
Wheeler Dr
Orland Park, IL 60462
|
2,111 sq. feet
|
2 baths - beds |
show details | |

|
#25
Binford Dr
Orland Park, IL 60462
|
2,254 sq. feet
|
2 baths - beds |
show details | |

|
#26
Silver Lake Dr
Orland Park, IL 60462
|
3,509 sq. feet
|
3 baths - beds |
show details | |

|
#27
Chesterfield Ln
Orland Park, IL 60462
|
1,545 sq. feet
|
1 baths - beds |
show details | |

|
#28
W 141st St
Orland Park, IL 60462
|
1,321 sq. feet
|
2 baths - beds |
show details | |

|
#29
Calypso Ln
Orland Park, IL 60462
|
1,827 sq. feet
|
2 baths - beds |
show details | |

|
#30
Lincolnshire Dr
Orland Park, IL 60462
|
2,260 sq. feet
|
2 baths - beds |
show details |
| Photo | Address | Area | Beds / Baths | Price | Details |
|---|---|---|---|---|---|

|
#31
Crooked Creek Ct
Orland Park, IL 60467
|
2,177 sq. feet
|
2 baths - beds |
show details | |

|
#32
S 87th Pl
Orland Park, IL 60462
|
3,875 sq. feet
|
2 baths - beds |
show details | |

|
#33
Glenview Dr
Orland Park, IL 60467
|
1,469 sq. feet
|
1 baths - beds |
show details | |

|
#34
Dolorosa Dr
Orland Park, IL 60467
|
2,019 sq. feet
|
3 baths - beds |
show details | |

|
#35
Emerson Dr
Orland Park, IL 60467
|
2,265 sq. feet
|
2 baths - beds |
show details | |

|
#36
W 135th St
Orland Park, IL 60462
|
1,479 sq. feet
|
1 baths - beds |
show details | |

|
#37
Teebrook Dr
Orland Park, IL 60462
|
1,765 sq. feet
|
2 baths - beds |
show details | |

|
#38
Seminole Ct
Orland Park, IL 60462
|
2,933 sq. feet
|
3 baths - beds |
show details | |

|
#39
Flamingo Cir
Orland Park, IL 60462
|
3,348 sq. feet
|
2 baths - beds |
show details | |

|
#40
Teebrook Dr
Orland Park, IL 60462
|
2,439 sq. feet
|
2 baths - beds |
show details |
| Photo | Address | Area | Beds / Baths | Price | Details |
|---|---|---|---|---|---|

|
#41
Teebrook Dr
Orland Park, IL 60462
|
1,628 sq. feet
|
2 baths - beds |
show details | |

|
#42
Flamingo Cir
Orland Park, IL 60462
|
2,679 sq. feet
|
2 baths - beds |
show details | |

|
#43
Teebrook Dr
Orland Park, IL 60462
|
1,632 sq. feet
|
2 baths - beds |
show details | |

|
#44
2nd Ave
Orland Park, IL 60462
|
- sq. feet
|
- baths - beds |
show details | |

|
#45
W 179th St
Orland Park, IL 60467
|
- sq. feet
|
- baths - beds |
show details | |

|
#46
Crystal Creek Dr Apt 1a
Orland Park, IL 60462
|
- sq. feet
|
- baths - beds |
show details | |

|
#47
S 70th Ct
Orland Park, IL 60462
|
- sq. feet
|
- baths - beds |
show details | |

|
#48
107th Ave Ste 1
Orland Park, IL 60467
|
- sq. feet
|
- baths - beds |
show details | |

|
#49
Treetop Dr Apt 1w
Orland Park, IL 60462
|
- sq. feet
|
- baths - beds |
show details | |

|
Check over 1 million property listings on Foreclosure.com!
|
browse all offers | |||


- 44,57678.1%White alone
- 5,6069.8%Hispanic
- 3,1405.5%Asian alone
- 2,2944.0%Black alone
- 6971.2%Two or more races
- 1650.3%Other race alone
- 710.1%Native Hawaiian and Other
Pacific Islander alone
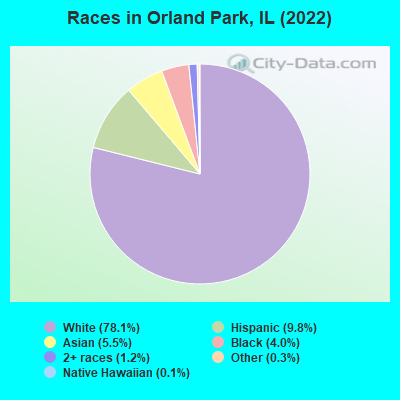
Races in Orland Park detailed stats: ancestries, foreign born residents, place of birth
According to our research of Illinois and other state lists, there were 15 registered sex offenders living in Orland Park, Illinois as of April 27, 2024.
The ratio of all residents to sex offenders in Orland Park is 3,889 to 1.
The ratio of registered sex offenders to all residents in this city is much lower than the state average.
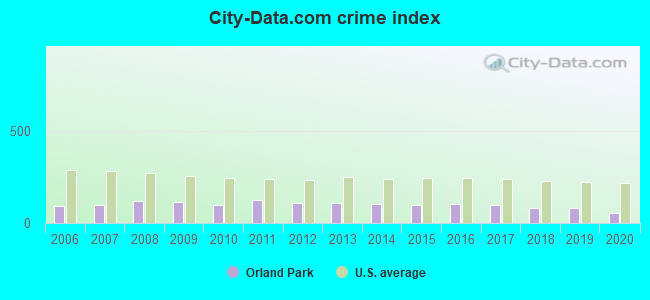
The City-Data.com crime index weighs serious crimes and violent crimes more heavily. Higher means more crime, U.S. average is 246.1. It adjusts for the number of visitors and daily workers commuting into cities.
- means the value is smaller than the state average.- means the value is about the same as the state average.
- means the value is bigger than the state average.
Crime rate in Orland Park detailed stats: murders, rapes, robberies, assaults, burglaries, thefts, arson
Full-time law enforcement employees in 2020, including police officers: 128 (98 officers - 91 male; 7 female).
| Officers per 1,000 residents here: | 1.69 |
| Illinois average: | 3.04 |
 Recent articles from our blog. Our writers, many of them Ph.D. graduates or candidates, create easy-to-read articles on a wide variety of topics.

 | Commute Time Hammond to Orland Park (10 replies) |
| Orland Park to Chicago Downtown commuters? (26 replies) |
| North suburbs vs West suburbs vs South suburbs (107 replies) |
| Gifted or Private Non-religious schools in Orland Park area? (7 replies) |
| Differences between Tinley Park and Orland Park (55 replies) |
| Oak Lawn, Midlothian, Palos [Insert Noun Here], Worth (16 replies) |
Latest news from Orland Park, IL collected exclusively by city-data.com from local newspapers, TV, and radio stations
Ancestries: Polish (15.6%), Irish (12.0%), Italian (8.3%), American (5.8%), German (5.2%), Palestinian (4.8%).
Current Local Time: CST time zone
Incorporated on 08/15/1894
Elevation: 700 feet
Land area: 19.1 square miles.
Population density: 3,005 people per square mile (average).
8,476 residents are foreign born (6.4% Asia, 6.2% Europe).
| This village: | 14.9% |
| Illinois: | 14.1% |
Median real estate property taxes paid for housing units with mortgages in 2022: $7,039 (2.0%)
Median real estate property taxes paid for housing units with no mortgage in 2022: $6,326 (1.9%)
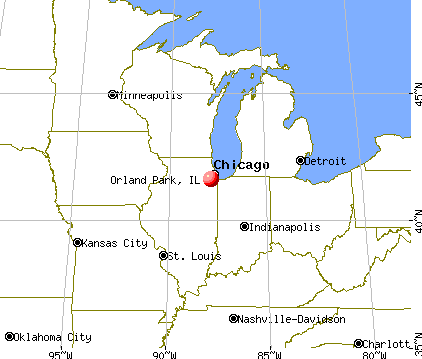
Nearest city with pop. 200,000+: Chicago, IL  (18.2 miles , pop. 2,896,016).
Nearest cities:
), ), ), Latitude: 41.61 N, Longitude: 87.85 W
Daytime population change due to commuting: -1,820 (-3.2%)
Workers who live and work in this village: 7,898 (28.7%)
Area code commonly used in this area: 708

Orland Park tourist attractions:
Orland Park, Illinois accommodation & food services, waste management - Economy and Business Data
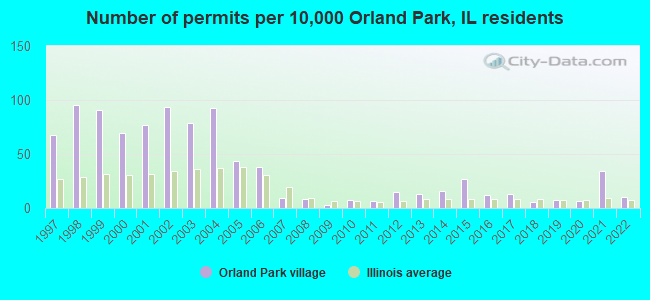
Single-family new house construction building permits:
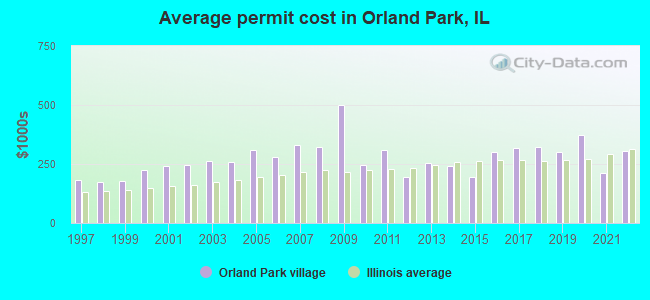
- 2022: 51 buildings, average cost: $306,600
- 2021: 174 buildings, average cost: $209,500
- 2020: 34 buildings, average cost: $373,600
- 2019: 39 buildings, average cost: $302,000
- 2018: 29 buildings, average cost: $320,200
- 2017: 64 buildings, average cost: $316,600
- 2016: 62 buildings, average cost: $299,600
- 2015: 139 buildings, average cost: $195,400
- 2014: 81 buildings, average cost: $241,200
- 2013: 68 buildings, average cost: $254,100
- 2012: 76 buildings, average cost: $195,800
- 2011: 34 buildings, average cost: $310,300
- 2010: 38 buildings, average cost: $245,500
- 2009: 13 buildings, average cost: $498,800
- 2008: 44 buildings, average cost: $323,800
- 2007: 45 buildings, average cost: $329,900
- 2006: 196 buildings, average cost: $278,800
- 2005: 221 buildings, average cost: $310,700
- 2004: 475 buildings, average cost: $258,300
- 2003: 403 buildings, average cost: $260,500
- 2002: 477 buildings, average cost: $244,500
- 2001: 391 buildings, average cost: $239,500
- 2000: 357 buildings, average cost: $222,900
- 1999: 464 buildings, average cost: $180,000
- 1998: 488 buildings, average cost: $173,700
- 1997: 344 buildings, average cost: $181,800
| Here: | 3.2% |
| Illinois: | 4.2% |
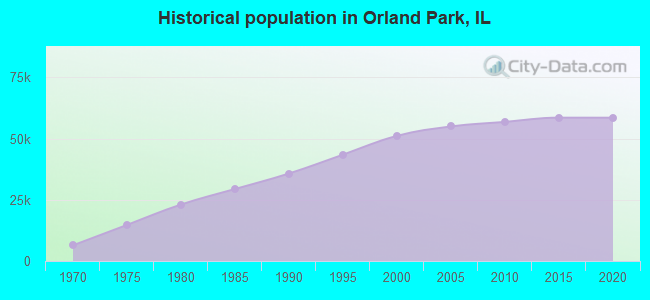
Population change in the 1990s: +13,237 (+35.0%).
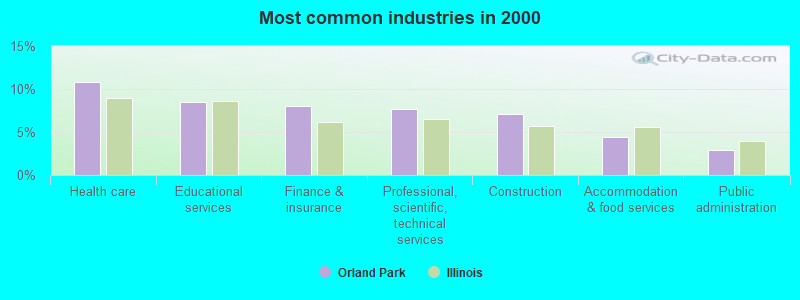
- Health care (10.8%)
- Educational services (8.5%)
- Finance & insurance (8.0%)
- Professional, scientific, technical services (7.7%)
- Construction (7.0%)
- Accommodation & food services (4.5%)
- Public administration (2.9%)
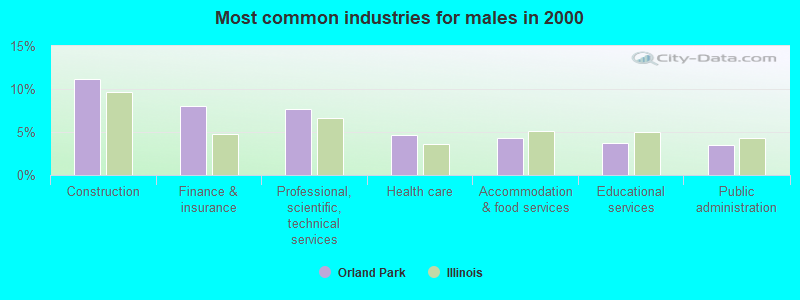
- Construction (11.1%)
- Finance & insurance (8.0%)
- Professional, scientific, technical services (7.6%)
- Health care (4.6%)
- Accommodation & food services (4.4%)
- Educational services (3.8%)
- Public administration (3.5%)
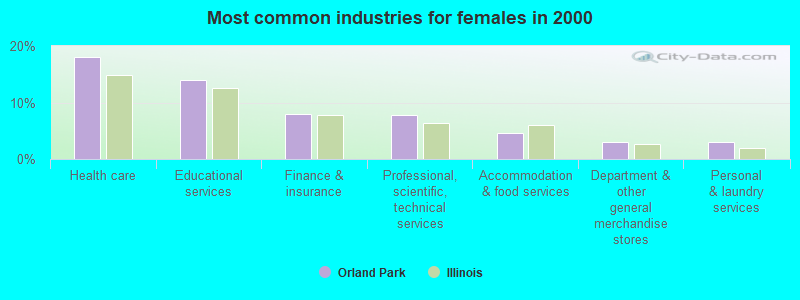
- Health care (18.0%)
- Educational services (14.1%)
- Finance & insurance (8.0%)
- Professional, scientific, technical services (7.8%)
- Accommodation & food services (4.6%)
- Department & other general merchandise stores (2.9%)
- Personal & laundry services (2.9%)
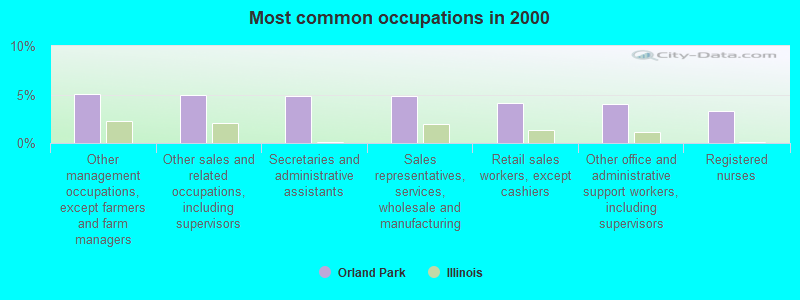
- Other management occupations, except farmers and farm managers (5.1%)
- Other sales and related occupations, including supervisors (5.0%)
- Secretaries and administrative assistants (4.8%)
- Sales representatives, services, wholesale and manufacturing (4.8%)
- Retail sales workers, except cashiers (4.2%)
- Other office and administrative support workers, including supervisors (4.1%)
- Registered nurses (3.3%)
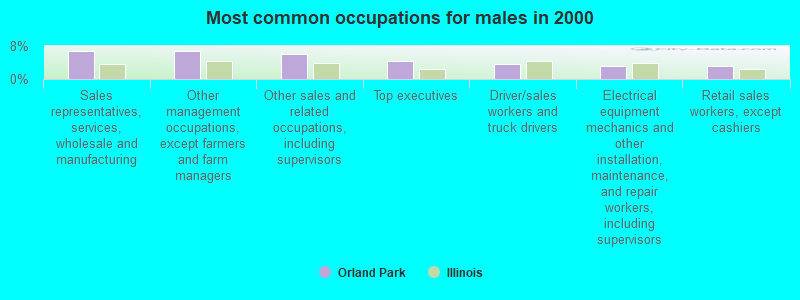
- Sales representatives, services, wholesale and manufacturing (6.8%)
- Other management occupations, except farmers and farm managers (6.7%)
- Other sales and related occupations, including supervisors (6.2%)
- Top executives (4.4%)
- Driver/sales workers and truck drivers (3.6%)
- Electrical equipment mechanics and other installation, maintenance, and repair workers, including supervisors (3.2%)
- Retail sales workers, except cashiers (3.0%)

- Secretaries and administrative assistants (10.0%)
- Other office and administrative support workers, including supervisors (6.8%)
- Registered nurses (6.7%)
- Retail sales workers, except cashiers (5.5%)
- Preschool, kindergarten, elementary, and middle school teachers (5.0%)
- Information and record clerks, except customer service representatives (3.9%)
- Other sales and related occupations, including supervisors (3.6%)
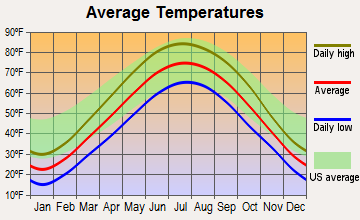
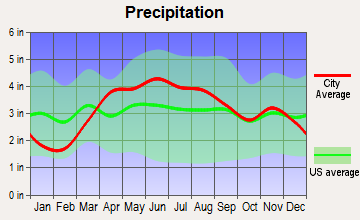
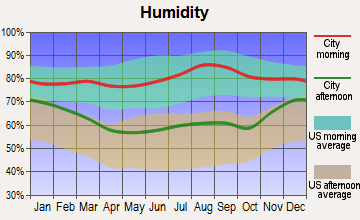
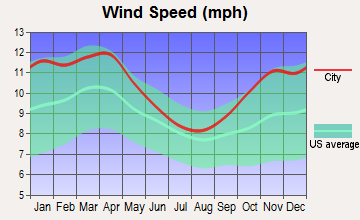
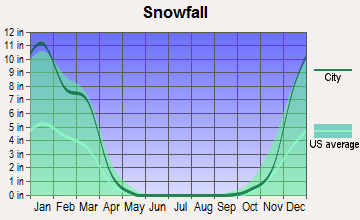
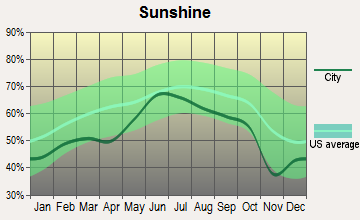
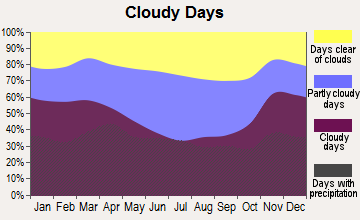
Average climate in Orland Park, Illinois
Based on data reported by over 4,000 weather stations
|
|

(lower is better)
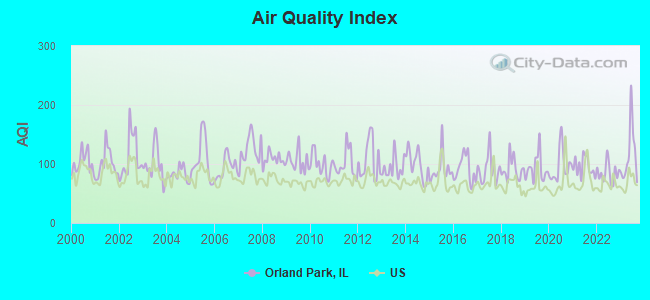
Air Quality Index (AQI) level in 2023 was 115. This is significantly worse than average.
| City: | 115 |
| U.S.: | 73 |
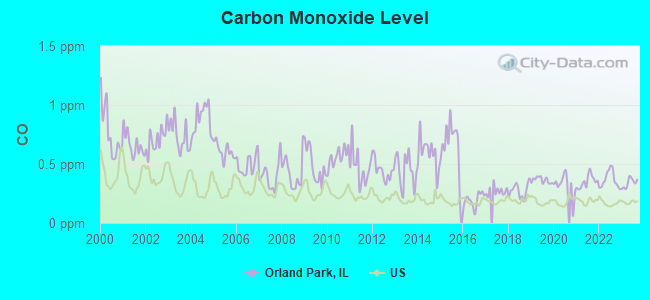
Carbon Monoxide (CO) [ppm] level in 2023 was 0.339. This is worse than average. Closest monitor was 11.3 miles away from the city center.
| City: | 0.339 |
| U.S.: | 0.251 |
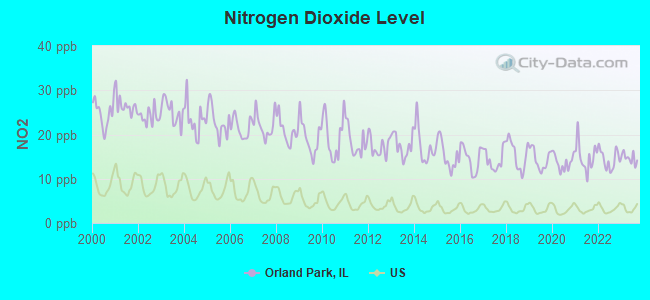
Nitrogen Dioxide (NO2) [ppb] level in 2023 was 14.7. This is significantly worse than average. Closest monitor was 7.5 miles away from the city center.
| City: | 14.7 |
| U.S.: | 5.1 |
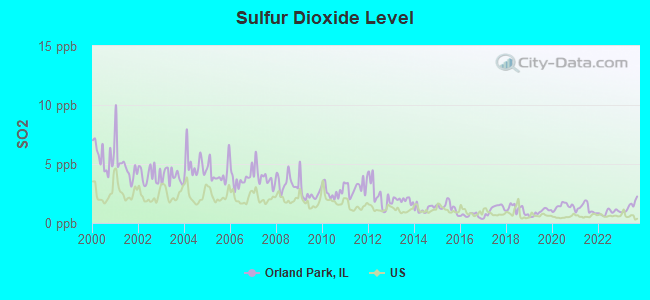
Sulfur Dioxide (SO2) [ppb] level in 2023 was 1.41. This is about average. Closest monitor was 8.1 miles away from the city center.
| City: | 1.41 |
| U.S.: | 1.51 |
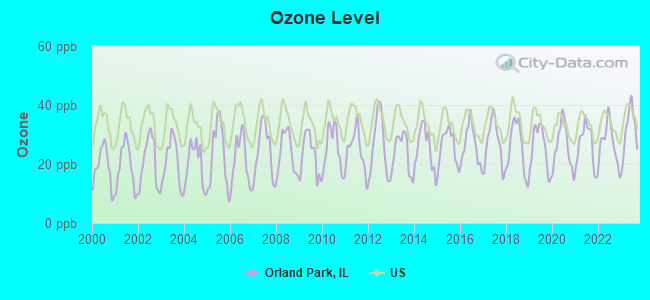
Ozone [ppb] level in 2023 was 31.5. This is about average. Closest monitor was 7.5 miles away from the city center.
| City: | 31.5 |
| U.S.: | 33.3 |
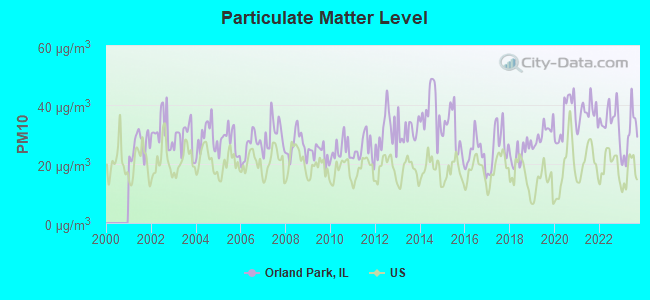
Particulate Matter (PM10) [µg/m3] level in 2023 was 29.7. This is significantly worse than average. Closest monitor was 7.2 miles away from the city center.
| City: | 29.7 |
| U.S.: | 19.2 |
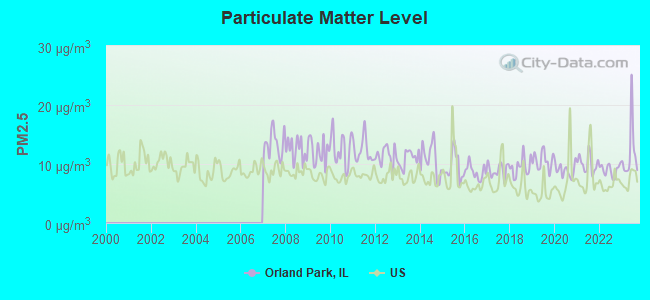
Particulate Matter (PM2.5) [µg/m3] level in 2023 was 11.8. This is significantly worse than average. Closest monitor was 7.5 miles away from the city center.
| City: | 11.8 |
| U.S.: | 8.1 |
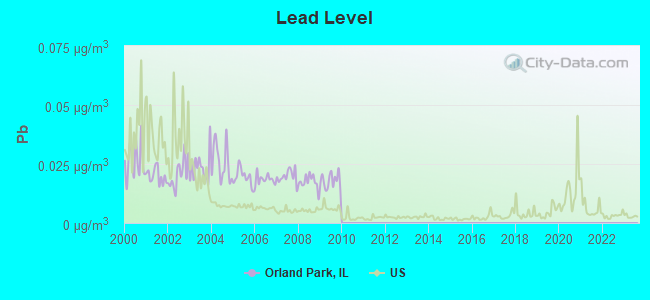
Lead (Pb) [µg/m3] level in 2009 was 0.0179. This is significantly worse than average. Closest monitor was 2.6 miles away from the city center.
| City: | 0.0179 |
| U.S.: | 0.0093 |
Tornado activity:
Orland Park-area historical tornado activity is near Illinois state average. It is 59% greater than the overall U.S. average.
On 8/28/1990, a category F5 (max. wind speeds 261-318 mph) tornado 14.2 miles away from the Orland Park village center killed 29 people and injured 350 people and caused between $50,000 and $500,000 in damages.
On 4/21/1967, a category F4 (max. wind speeds 207-260 mph) tornado 4.2 miles away from the village center killed 33 people and injured 500 people and caused between $5,000,000 and $50,000,000 in damages.
Earthquake activity:
Orland Park-area historical earthquake activity is significantly above Illinois state average. It is 48% greater than the overall U.S. average.On 4/18/2008 at 09:36:59, a magnitude 5.4 (5.1 MB, 4.8 MS, 5.4 MW, 5.2 MW, Class: Moderate, Intensity: VI - VII) earthquake occurred 218.5 miles away from the city center
On 6/10/1987 at 23:48:54, a magnitude 5.1 (4.9 MB, 4.4 MS, 4.6 MS, 5.1 LG) earthquake occurred 193.0 miles away from Orland Park center
On 4/18/2008 at 09:36:59, a magnitude 5.2 (5.2 MW, Depth: 8.9 mi) earthquake occurred 218.6 miles away from Orland Park center
On 6/28/2004 at 06:10:52, a magnitude 4.2 (4.2 MW, Depth: 6.2 mi, Class: Light, Intensity: IV - V) earthquake occurred 55.1 miles away from Orland Park center
On 6/18/2002 at 17:37:15, a magnitude 5.0 (4.3 MB, 4.6 MW, 5.0 LG) earthquake occurred 250.7 miles away from Orland Park center
On 4/18/2008 at 15:14:16, a magnitude 4.8 (4.5 MB, 4.8 MW, 4.6 MW) earthquake occurred 216.9 miles away from the city center
Magnitude types: regional Lg-wave magnitude (LG), body-wave magnitude (MB), surface-wave magnitude (MS), moment magnitude (MW)
Natural disasters:
The number of natural disasters in Cook County (20) is greater than the US average (15).Major Disasters (Presidential) Declared: 15
Emergencies Declared: 4
Causes of natural disasters: Floods: 13, Storms: 12, Tornadoes: 3, Snowstorms: 2, Winter Storms: 2, Blizzard: 1, Hurricane: 1, Snow: 1, Wind: 1, Other: 1 (Note: some incidents may be assigned to more than one category).
Main business address for: ANDREW CORP (DRAWING AND INSULATING NONFERROUS WIRE).
Hospitals in Orland Park:
Nursing Homes in Orland Park:
- ALDEN ORLAND PARK REHAB AND HCC (16450 SOUTH 97TH AVENUE)
- LEXINGTON OF ORLAND PARK (14601 SOUTH JOHN HUMPHREY DR)
- SMITH CROSSING (10501 EMILIE LANE)
Dialysis Facilities in Orland Park:
Home Health Centers in Orland Park:
- A2Z HEALTHCARE SERVICES, LLC (15343 70TH COURT)
- ATNT HOME CARE, INC (10719 WINTERSET DRIVE)
- CARING ANGELS HOME HEALTH SERVICES, INC (62 ORLAND SQUARE DRIVE, STE 001)
- DISTINCT HOME HEALTH CARE, LLC (14475 JOHN HUMPHREY DR, STE H)
- HAVE A HEART HEALTH CARE, LTD (18319 DISTINCTIVE DRIVE)
- STEADFAST HOME CARE HEALTH SERVICES, INC (9411 PLYMOUTH COURT)
Amtrak stations near Orland Park:
- 11 miles: HOMEWOOD (181 1ST ST. & PARK AVE.) . Services: ticket office, enclosed waiting area, public restrooms, public payphones, paid short-term parking, paid long-term parking, public transit connection.
- 13 miles: SUMMIT (ARCHER & CENTER AVE.) . Services: public payphones, free short-term parking, free long-term parking, call for taxi service, public transit connection.
- 14 miles: JOLIET (50 E. JEFFERSON ST.) . Services: ticket office, partially wheelchair accessible, enclosed waiting area, public restrooms, public payphones, vending machines, paid short-term parking, paid long-term parking, public transit connection.
College/University in Orland Park:
Colleges/universities with over 2000 students nearest to Orland Park:
- Moraine Valley Community College (about 6 miles; Palos Hills, IL; Full-time enrollment: 12,008)
- Saint Xavier University (about 10 miles; Chicago, IL; FT enrollment: 3,576)
- Lewis University (about 12 miles; Romeoville, IL; FT enrollment: 5,739)
- City Colleges of Chicago-Richard J Daley College (about 13 miles; Chicago, IL; FT enrollment: 7,497)
- South Suburban College (about 13 miles; South Holland, IL; FT enrollment: 3,972)
- Prairie State College (about 13 miles; Chicago Heights, IL; FT enrollment: 4,050)
- Governors State University (about 14 miles; University Park, IL; FT enrollment: 4,043)
Public high school in Orland Park:
- CARL SANDBURG HIGH SCHOOL (Students: 3,758, Location: 13300 S LA GRANGE RD, Grades: 9-12)
Biggest public elementary/middle schools in Orland Park:
- CENTURY JUNIOR HIGH SCHOOL (Students: 837, Location: 10801 W 159TH ST, Grades: 6-8)
- JERLING JUNIOR HIGH SCHOOL (Students: 768, Location: 8851 W 151ST ST, Grades: 6-8)
- MEADOW RIDGE SCHOOL (Students: 706, Location: 10959 W 159TH ST, Grades: 3-5)
- ORLAND JR HIGH SCHOOL (Students: 545, Location: 14855 WEST AVE, Grades: 6-8)
- CENTENNIAL SCHOOL (Students: 540, Location: 14101 CREEK CROSSING DR, Grades: PK-3)
- FERNWAY PARK ELEM SCHOOL (Students: 522, Location: 16600 S 88TH AVE, Grades: PK-5)
- PRAIRIE ELEM SCHOOL (Students: 491, Location: 14200 S 82ND AVE, Grades: KG-3)
- ORLAND CENTER SCHOOL (Students: 474, Location: 9407 W 151ST ST, Grades: PK-2)
- HIGH POINT ELEM SCHOOL (Students: 460, Location: 14825 WEST AVE, Grades: 3-5)
- ORLAND PARK ELEM SCHOOL (Students: 389, Location: 9960 W 143RD ST, Grades: PK-3)
Private elementary/middle schools in Orland Park:
Library in Orland Park:
- ORLAND PARK PUBLIC LIBRARY (Operating income: $3,923,463; Location: 14921 SOUTH RAVINIA AVENUE; 164,587 books; 3,457 e-books; 11,583 audio materials; 8,764 video materials; 15 local licensed databases; 3 state licensed databases; 9 other licensed databases; 424 print serial subscriptions; 4 electronic serial subscriptions)
User-submitted facts and corrections:
- www.OrlandMemorialParkCemetery web site is now operationsl 153rd and West Ave. Orland Park, Il. 60462
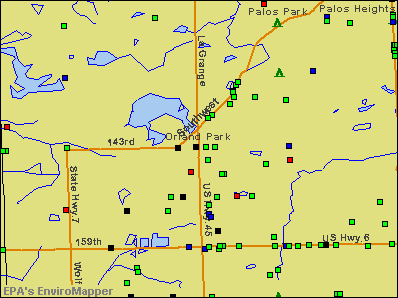
Points of interest:
Notable locations in Orland Park: White Mountain Golf Course (A), Silver Lake Country Club (B), Doogan Park Library (C), Orland Park Public Library (D), Robert Davidson Center (E), Orland Township Office (F), Orland Park Village Center (G), Orland Fire Protection District Station 2 (H), Orland Fire Protection District Station 1 (I), Orland Fire Protection District Training Center (J), Orland Fire Protection District Station 6 (K), Orland Fire Protection District Station 5 (L), Orland Fire Protection District Station 3 (M). Display/hide their locations on the map
Shopping Centers: Orland Square Mall Shopping Center (1), Orland Park Shopping Plaza Shopping Center (2), Lakeview Plaza Shopping Center (3), Orland Greens Shopping Center (4), Orland Square Village Shopping Center (5), Park Pointe Plaza Shopping Center (6), Regent Plaza Shopping Center (7), Village Green Shopping Center (8), Main Place Mall Shopping Center (9). Display/hide their locations on the map
Main business address in Orland Park: ANDREW CORP (A). Display/hide its location on the map
Churches in Orland Park include: All Saints Lutheran Church (A), Orland Park United Methodist Church (B), Saint Michael's Church (C), Christ Evangelical Lutheran Church (D), Covenant Orthodox Presbyterian Church (E), Orland Park Christian Reformed Church (F), Salem Baptist Church (G), Calvary Reformed Church (H). Display/hide their locations on the map
Cemeteries: Orland Park Cemetery (1), Old German Methodist Cemetery (2), Cooper Cemetery (3). Display/hide their locations on the map
Parks in Orland Park include: Bill Young Park (1), Cameno Real Park (2), Dogwood Park (3), Pulte Park (4), Helen Park (5), Liberty Park (6), Park Hill Park (7), Village Square Park (8), Discovery Park (9). Display/hide their locations on the map
Hotels: Essence Suites (14455 South La Grange Road) (1), Best Buy (15854 South La Grange Road) (2). Display/hide their approximate locations on the map
Birthplace of: Bryan Jurynec - Ice hockey player, Pat Fitzgerald - College football player, T. J. Tynan - Ice hockey player.
Drinking water stations with addresses in Orland Park and their reported violations in the past:
LAKE LETTA RV PARK (Serves FL, Population served: 60, Groundwater):Past health violations:JORDANS PUB (Population served: 25, Groundwater):Past monitoring violations:
- MCL, Monthly (TCR) - In NOV-2005, Contaminant: Coliform. Follow-up actions: St Public Notif requested (OCT-25-2005), St Public Notif received (OCT-25-2005)
- One minor monitoring violation
Past monitoring violations:SHELL FOOD MART (118257) (Population served: 25, Groundwater):
- One routine major monitoring violation
- One regular monitoring violation
Past monitoring violations:VISTA MOTEL (Population served: 25, Groundwater):
- One routine major monitoring violation
- One regular monitoring violation
Past monitoring violations:
- One routine major monitoring violation
- One regular monitoring violation
Drinking water stations with addresses in Orland Park that have no violations reported:
- KLADIS GARDEN CENTER INC (Population served: 25, Primary Water Source Type: Groundwater)
| This village: | 2.6 people |
| Illinois: | 2.6 people |
| This village: | 72.2% |
| Whole state: | 65.8% |
| This village: | 3.2% |
| Whole state: | 6.3% |
Likely homosexual households (counted as self-reported same-sex unmarried-partner households)
- Lesbian couples: 0.2% of all households
- Gay men: 0.2% of all households
People in group quarters in Orland Park in 2010:
- 451 people in nursing facilities/skilled-nursing facilities
- 5 people in group homes intended for adults
- 5 people in residential treatment centers for adults
- 3 people in other noninstitutional facilities
People in group quarters in Orland Park in 2000:
- 411 people in nursing homes
- 18 people in other group homes
- 8 people in homes for the mentally retarded
Banks with most branches in Orland Park (2011 data):
- Marquette Bank: 9612 West 143rd Street Branch, Wolf Road Branch, Orland Park Branch, 9533 West 143rd Street Branch, West 151st Street Branch, Call Center. Info updated 2006/11/15: Bank assets: $1,703.1 mil, Deposits: $1,439.1 mil, headquarters in Chicago, IL, positive income, Commercial Lending Specialization, 27 total offices, Holding Company: Marquette National Corporation
- BMO Harris Bank National Association: Orland Park Branch, Orland Park Wolf Road Branch, Orland Park Branch, 143rd Street Branch. Info updated 2011/07/14: Bank assets: $97,264.0 mil, Deposits: $75,624.6 mil, headquarters in Chicago, IL, positive income, 717 total offices, Holding Company: Bank Of Montreal
- JPMorgan Chase Bank, National Association: Orland Park Harlem Bkg. Ctr. Branch, Orland Park - Marley Creek Square Br, Orland Park Lagrange Branch, Orland Park Southmoor Branch. Info updated 2011/11/10: Bank assets: $1,811,678.0 mil, Deposits: $1,190,738.0 mil, headquarters in Columbus, OH, positive income, International Specialization, 5577 total offices, Holding Company: Jpmorgan Chase & Co.
- Fifth Third Bank: Orland Square Mall Branch, Orland West Branch, Orland Park Branch. Info updated 2009/10/05: Bank assets: $114,540.4 mil, Deposits: $89,689.1 mil, headquarters in Cincinnati, OH, positive income, Commercial Lending Specialization, 1378 total offices, Holding Company: Fifth Third Bancorp
- TCF National Bank: Jewel-179th/ Wolf Branch, Orland Park Branch #2115, Orland Park Jewell Branch. Info updated 2009/11/23: Bank assets: $19,007.0 mil, Deposits: $12,377.0 mil, headquarters in Sioux Falls, SD, positive income, Commercial Lending Specialization, 441 total offices, Holding Company: Tcf Financial Corporation
- PNC Bank, National Association: Orland Park Place Branch at 15411 S La Grange Road, branch established on 2005/10/03; Orlando Park West Branch at 11051 West 179th St Street, branch established on 2006/11/29. Info updated 2012/03/20: Bank assets: $263,309.6 mil, Deposits: $197,343.0 mil, headquarters in Wilmington, DE, positive income, Commercial Lending Specialization, 3085 total offices, Holding Company: Pnc Financial Services Group, Inc., The
- A J Smith Federal Savings Bank: 8000 W 159th St Branch at 8000 West 159th Street, branch established on 1988/06/30; Orland Park Branch at 11275 West 143rd Street, branch established on 2002/12/31. Info updated 2011/07/21: Bank assets: $239.8 mil, Deposits: $183.8 mil, headquarters in Midlothian, IL, negative income in the last year, Mortgage Lending Specialization, 3 total offices
- RBS Citizens, National Association: Will-Cook Facility at 11901 West 143rd Street, branch established on 1996/02/21; Orland Park at 9520 West 147th Street, branch established on 1889/01/01. Info updated 2007/09/19: Bank assets: $106,940.6 mil, Deposits: $75,690.2 mil, headquarters in Providence, RI, positive income, 1135 total offices, Holding Company: Uk Financial Investments Limited
- First Midwest Bank: 180th Street Branch at 11155 180th Street, branch established on 2003/12/05; Orland Park Branch at 11200 W. 143rd Street, branch established on 1989/03/15. Info updated 2011/12/22: Bank assets: $7,848.0 mil, Deposits: $6,529.2 mil, headquarters in Itasca, IL, positive income, Commercial Lending Specialization, 100 total offices, Holding Company: First Midwest Bancorp, Inc.
- 13 other banks with 13 local branches
For population 15 years and over in Orland Park:
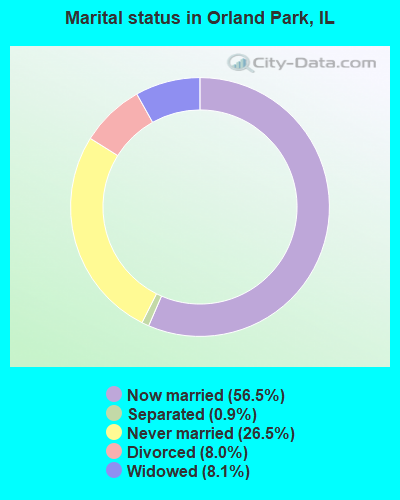
- Never married: 26.5%
- Now married: 56.5%
- Separated: 0.9%
- Widowed: 8.1%
- Divorced: 8.0%
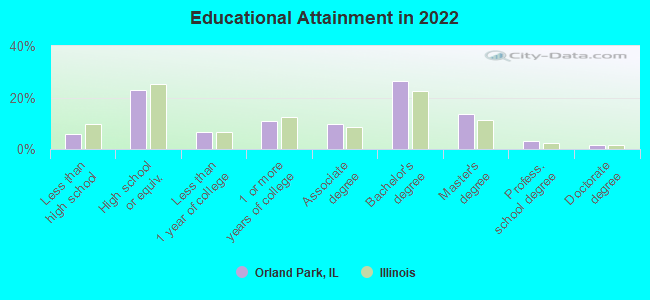
For population 25 years and over in Orland Park:
- High school or higher: 94.2%
- Bachelor's degree or higher: 43.2%
- Graduate or professional degree: 17.6%
- Unemployed: 2.4%
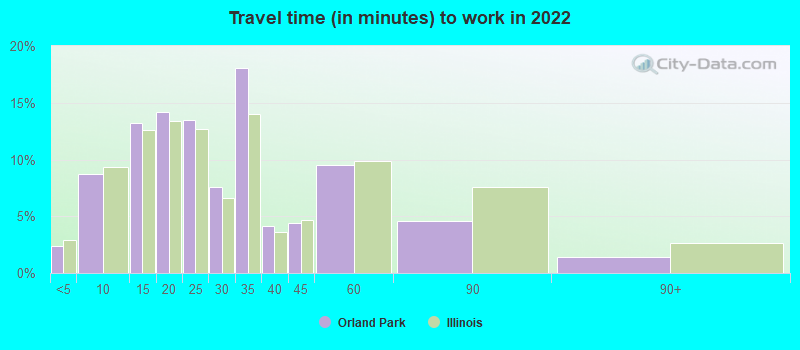
- Mean travel time to work (commute): 27.1 minutes
| Here: | 10.8 |
| Illinois average: | 12.5 |


Graphs represent county-level data. Detailed 2008 Election Results
Religion statistics for Orland Park, IL (based on Cook County data)


| Religion | Adherents | Congregations |
|---|---|---|
| Catholic | 1,947,223 | 376 |
| Evangelical Protestant | 432,975 | 1,484 |
| Other | 312,636 | 403 |
| Mainline Protestant | 202,114 | 630 |
| Black Protestant | 148,895 | 395 |
| Orthodox | 53,276 | 66 |
| None | 2,097,556 | - |
Food Environment Statistics:
| Cook County: | 2.77 / 10,000 pop. |
| State: | 2.24 / 10,000 pop. |
| This county: | 0.04 / 10,000 pop. |
| State: | 0.08 / 10,000 pop. |
| Cook County: | 0.93 / 10,000 pop. |
| State: | 0.75 / 10,000 pop. |
| Here: | 1.53 / 10,000 pop. |
| Illinois: | 2.61 / 10,000 pop. |
| Cook County: | 6.67 / 10,000 pop. |
| State: | 6.86 / 10,000 pop. |
| Cook County: | 8.4% |
| State: | 8.3% |
| This county: | 23.5% |
| Illinois: | 25.2% |
| Cook County: | 16.3% |
| State: | 14.5% |
Health and Nutrition:
| Orland Park: | 53.0% |
| Illinois: | 49.5% |
| Orland Park: | 50.8% |
| Illinois: | 47.2% |
| This city: | 28.4 |
| Illinois: | 28.6 |
| Orland Park: | 19.9% |
| State: | 20.5% |
| This city: | 9.9% |
| Illinois: | 10.8% |
| Orland Park: | 6.9 |
| State: | 6.8 |
| This city: | 35.1% |
| Illinois: | 33.4% |
| Here: | 58.5% |
| Illinois: | 56.4% |
| This city: | 78.2% |
| State: | 79.9% |
More about Health and Nutrition of Orland Park, IL Residents
| Local government employment and payroll (March 2022) | |||||
| Function | Full-time employees | Monthly full-time payroll | Average yearly full-time wage | Part-time employees | Monthly part-time payroll |
|---|---|---|---|---|---|
| Police Protection - Officers | 100 | $940,645 | $112,877 | 12 | $25,021 |
| Local Libraries | 31 | $185,764 | $71,909 | 47 | $73,136 |
| Parks and Recreation | 28 | $192,970 | $82,701 | 169 | $145,394 |
| Other and Unallocable | 28 | $194,433 | $83,328 | 16 | $23,900 |
| Streets and Highways | 25 | $176,105 | $84,530 | 2 | $1,740 |
| Water Supply | 19 | $139,618 | $88,180 | 1 | $949 |
| Other Government Administration | 18 | $144,430 | $96,287 | 7 | $13,359 |
| Housing and Community Development (Local) | 18 | $137,935 | $91,957 | 3 | $8,295 |
| Financial Administration | 14 | $93,622 | $80,247 | 12 | $20,188 |
| Police - Other | 13 | $66,938 | $61,789 | 46 | $52,766 |
| Transit | 0 | $0 | 1 | $479 | |
| Sewerage | 0 | $0 | 1 | $1,036 | |
| Totals for Government | 294 | $2,272,462 | $92,754 | 317 | $366,262 |
Orland Park government finances - Expenditure in 2021 (per resident):
- Construction - Regular Highways: $8,110,000 ($141.02)
Water Utilities: $3,937,000 ($68.46)
Sewerage: $2,125,000 ($36.95)
General - Other: $1,462,000 ($25.42)
Parks and Recreation: $940,000 ($16.34)
Central Staff Services: $239,000 ($4.16)
- Current Operations - Police Protection: $22,738,000 ($395.37)
Water Utilities: $17,984,000 ($312.71)
Parks and Recreation: $11,315,000 ($196.74)
General - Other: $8,265,000 ($143.71)
Central Staff Services: $8,041,000 ($139.82)
Solid Waste Management: $6,300,000 ($109.54)
General Public Buildings: $4,024,000 ($69.97)
Regular Highways: $3,094,000 ($53.80)
Financial Administration: $1,703,000 ($29.61)
Protective Inspection and Regulation - Other: $1,008,000 ($17.53)
Parking Facilities: $257,000 ($4.47)
- General - Interest on Debt: $1,423,000 ($24.74)
- Intergovernmental to Local - Other - General - Other: $1,307,000 ($22.73)
- Other Capital Outlay - Water Utilities: $2,268,000 ($39.44)
Parks and Recreation: $1,123,000 ($19.53)
Regular Highways: $660,000 ($11.48)
Police Protection: $640,000 ($11.13)
Central Staff Services: $230,000 ($4.00)
Sewerage: $99,000 ($1.72)
- Total Salaries and Wages: $29,412,000 ($511.42)
Orland Park government finances - Revenue in 2021 (per resident):
- Charges - Solid Waste Management: $6,300,000 ($109.54)
Other: $4,117,000 ($71.59)
Parks and Recreation: $3,947,000 ($68.63)
Parking Facilities: $70,000 ($1.22)
- Federal Intergovernmental - Public Welfare: $1,497,000 ($26.03)
- Miscellaneous - General Revenue - Other: $2,987,000 ($51.94)
Interest Earnings: $1,561,000 ($27.14)
Fines and Forfeits: $885,000 ($15.39)
- Revenue - Water Utilities: $25,453,000 ($442.58)
- State Intergovernmental - General Local Government Support: $37,267,000 ($648.00)
Highways: $3,589,000 ($62.41)
Other: $1,255,000 ($21.82)
Public Welfare: $15,000 ($0.26)
- Tax - Property: $14,944,000 ($259.85)
Other License: $1,907,000 ($33.16)
Public Utilities Sales: $1,164,000 ($20.24)
Other Selective Sales: $180,000 ($3.13)
Orland Park government finances - Debt in 2021 (per resident):
- Long Term Debt - Outstanding Unspecified Public Purpose: $73,528,000 ($1278.50)
Beginning Outstanding - Unspecified Public Purpose: $66,156,000 ($1150.32)
Issue, Unspecified Public Purpose: $14,148,000 ($246.01)
Retired Unspecified Public Purpose: $6,776,000 ($117.82)
Orland Park government finances - Cash and Securities in 2021 (per resident):
- Other Funds - Cash and Securities: $80,260,000 ($1395.56)
3.53% of this county's 2021 resident taxpayers lived in other counties in 2020 ($82,405 average adjusted gross income)
| Here: | 3.53% |
| Illinois average: | 5.09% |
0.01% of residents moved from foreign countries ($114 average AGI)
Cook County: 0.01% Illinois average: 0.01%
Top counties from which taxpayers relocated into this county between 2020 and 2021:
| from DuPage County, IL | |
| from Lake County, IL | |
| from Will County, IL |
5.44% of this county's 2020 resident taxpayers moved to other counties in 2021 ($120,340 average adjusted gross income)
| Here: | 5.44% |
| Illinois average: | 6.10% |
0.01% of residents moved to foreign countries ($140 average AGI)
Cook County: 0.01% Illinois average: 0.01%
Top counties to which taxpayers relocated from this county between 2020 and 2021:
| to DuPage County, IL | |
| to Will County, IL | |
| to Lake County, IL |
| Businesses in Orland Park, IL | ||||
| Name | Count | Name | Count | |
|---|---|---|---|---|
| 7-Eleven | 2 | Journeys | 2 | |
| ALDI | 1 | Justice | 2 | |
| ALDO | 1 | KFC | 1 | |
| AT&T | 1 | Kincaid | 1 | |
| Abercrombie & Fitch | 1 | Kohl's | 1 | |
| Abercrombie Kids | 1 | La-Z-Boy | 2 | |
| Advance Auto Parts | 1 | Lane Bryant | 1 | |
| Aeropostale | 1 | Lane Furniture | 4 | |
| American Eagle Outfitters | 1 | LensCrafters | 1 | |
| Ann Taylor | 2 | Lowe's | 1 | |
| Apple Store | 1 | Macy's | 1 | |
| AutoZone | 1 | Marshalls | 1 | |
| BMW | 1 | MasterBrand Cabinets | 4 | |
| Bakers | 1 | McDonald's | 3 | |
| Bakers Square | 2 | Meijer | 1 | |
| Banana Republic | 1 | Men's Wearhouse | 3 | |
| Barnes & Noble | 1 | Motherhood Maternity | 3 | |
| Baskin-Robbins | 4 | New Balance | 5 | |
| Bath & Body Works | 1 | New York & Co | 1 | |
| Bed Bath & Beyond | 1 | Nike | 10 | |
| Brookstone | 1 | Nissan | 1 | |
| Budget Car Rental | 1 | Nordstrom | 1 | |
| Buffalo Wild Wings | 1 | Office Depot | 1 | |
| Burger King | 1 | Old Navy | 1 | |
| CVS | 1 | Olive Garden | 1 | |
| Cache | 1 | Outback | 1 | |
| Carson Pirie Scott | 2 | Outback Steakhouse | 1 | |
| Casual Male XL | 1 | Pac Sun | 1 | |
| Catherines | 1 | Panda Express | 3 | |
| Charlotte Russe | 1 | Panera Bread | 3 | |
| Chick-Fil-A | 1 | Papa John's Pizza | 1 | |
| Chico's | 1 | Payless | 2 | |
| Chipotle | 1 | Penske | 1 | |
| Cinnabon | 1 | Pier 1 Imports | 1 | |
| Cold Stone Creamery | 1 | Pizza Hut | 1 | |
| Coldwater Creek | 1 | Plato's Closet | 1 | |
| Comfort Inn | 1 | Pottery Barn | 1 | |
| Costco | 1 | Qdoba Mexican Grill | 1 | |
| Cricket Wireless | 1 | Quiznos | 1 | |
| Dairy Queen | 1 | Red Lobster | 1 | |
| Dennys | 1 | Red Robin | 1 | |
| Discount Tire | 1 | Ruby Tuesday | 1 | |
| Domino's Pizza | 1 | SAS Shoes | 1 | |
| DressBarn | 1 | Safeway | 1 | |
| Dressbarn | 1 | Sears | 3 | |
| Dunkin Donuts | 4 | Sephora | 1 | |
| Eddie Bauer | 1 | Spencer Gifts | 1 | |
| Ethan Allen | 1 | Sprint Nextel | 3 | |
| Express | 1 | Staples | 1 | |
| Famous Footwear | 1 | Starbucks | 6 | |
| FedEx | 12 | Subway | 6 | |
| Finish Line | 1 | T-Mobile | 1 | |
| Firestone Complete Auto Care | 1 | T.G.I. Driday's | 1 | |
| Ford | 1 | Taco Bell | 1 | |
| Forever 21 | 1 | Talbots | 1 | |
| GNC | 1 | Target | 1 | |
| GameStop | 2 | The Athlete's Foot | 1 | |
| Gap | 1 | The Limited | 1 | |
| Goodwill | 1 | The Room Place | 1 | |
| Gymboree | 1 | Torrid | 1 | |
| H&M | 1 | Toys"R"Us | 2 | |
| H&R Block | 3 | Trader Joe's | 1 | |
| Home Depot | 1 | U-Haul | 3 | |
| Honda | 1 | UPS | 17 | |
| Hot Topic | 1 | Value City Furniture | 1 | |
| Houlihan's | 1 | Vans | 5 | |
| IHOP | 1 | Verizon Wireless | 3 | |
| J. Jill | 1 | Victoria's Secret | 2 | |
| J.Crew | 1 | Volkswagen | 1 | |
| JCPenney | 1 | Vons | 1 | |
| Jamba Juice | 1 | Walgreens | 4 | |
| Jewel-Osco | 2 | Wendy's | 1 | |
| Jimmy John's | 1 | Wet Seal | 1 | |
| JoS. A. Bank | 1 | White Castle | 1 | |
| Jones New York | 3 | |||
Strongest AM radio stations in Orland Park:
- WLS (890 AM; 50 kW; CHICAGO, IL; Owner: WLS, INC.)
- WYLL (1160 AM; 50 kW; CHICAGO, IL; Owner: SCA LICENSE CORPORATION)
- WMVP (1000 AM; 50 kW; CHICAGO, IL; Owner: ABC, INC.)
- WVIV (1200 AM; 20 kW; CHICAGO, IL; Owner: WLXX-AM LICENSE CORP.)
- WSCR (670 AM; 50 kW; CHICAGO, IL; Owner: INFINITY BROADCASTING OPERATIONS, INC.)
- WRDZ (1300 AM; 4 kW; LA GRANGE, IL; Owner: ABC, INC.)
- WBBM (780 AM; 50 kW; CHICAGO, IL; Owner: INFINITY BROADCASTING OPERATIONS, INC.)
- WGN (720 AM; 50 kW; CHICAGO, IL; Owner: WGN CONTINENTAL BROADCASTING CO.)
- WGCI (1390 AM; 5 kW; CHICAGO, IL; Owner: AMFM RADIO LICENSES, L.L.C.)
- WNWI (1080 AM; 3 kW; OAK LAWN, IL; Owner: BIRACH BROADCASTING CORPORATION)
- WNTD (950 AM; 5 kW; CHICAGO, IL; Owner: RADIO UNICA OF CHICAGO LICENSE CORP.)
- WIND (560 AM; 5 kW; CHICAGO, IL; Owner: TICHENOR LICENSE CORPORATION ("TLC"))
- WTMJ (620 AM; 50 kW; MILWAUKEE, WI; Owner: JOURNAL BROADCAST CORPORATION)
Strongest FM radio stations in Orland Park:
- WCKG (105.9 FM; ELMWOOD PARK, IL; Owner: INFINITY HOLDINGS CORPORATION OF ORLANDO)
- WLIT-FM (93.9 FM; CHICAGO, IL; Owner: AMFM RADIO LICENSES, L.L.C.)
- WJMK (104.3 FM; CHICAGO, IL; Owner: INFINITY BROADCASTING CORP. OF ILLINOIS)
- WNUA (95.5 FM; CHICAGO, IL; Owner: AMFM RADIO LICENSES, L.L.C.)
- WTMX (101.9 FM; SKOKIE, IL; Owner: BONNEVILLE HOLDING COMPANY)
- WBBM-FM (96.3 FM; CHICAGO, IL; Owner: INFINITY BROADCASTING OPERATIONS, INC.)
- WKSC-FM (103.5 FM; CHICAGO, IL; Owner: AMFM RADIO LICENSES, L.L.C.)
- WFMT (98.7 FM; CHICAGO, IL; Owner: WINDOW TO THE WORLD COMMUNICATIONS)
- WZZN (94.7 FM; CHICAGO, IL; Owner: ABC CHICAGO FM RADIO,INC.)
- WGCI-FM (107.5 FM; CHICAGO, IL; Owner: AMFM RADIO LICENSES, L.L.C.)
- WBEZ (91.5 FM; CHICAGO, IL; Owner: THE WBEZ ALLIANCE, INC.)
- WKQX (101.1 FM; CHICAGO, IL; Owner: EMMIS RADIO LICENSE CORPORATION)
- WLUP-FM (97.9 FM; CHICAGO, IL; Owner: BONNEVILLE HOLDING COMPANY)
- WNND (100.3 FM; CHICAGO, IL; Owner: BONNEVILLE HOLDING COMPANY)
- WOJO (105.1 FM; EVANSTON, IL; Owner: TICHENOR LICENSE CORPORATION ("TLC"))
- WUSN (99.5 FM; CHICAGO, IL; Owner: INFINITY BROADCASTING CORPORATION OF CHICAGO)
- WVAZ (102.7 FM; OAK PARK, IL; Owner: AMFM RADIO LICENSES, L.L.C.)
- WDRV (97.1 FM; CHICAGO, IL; Owner: BONNEVILLE HOLDING COMPANY)
- WXRT-FM (93.1 FM; CHICAGO, IL; Owner: INFINITY BROADCASTING OPERATIONS, INC.)
- WLEY-FM (107.9 FM; AURORA, IL; Owner: WLEY LICENSING, INC.)
TV broadcast stations around Orland Park:
- W54AP (Channel 54; BLUE ISLAND, IL; Owner: CATHOLIC VIEWS BROADCASTS, INC.)
- WLS-TV (Channel 7; CHICAGO, IL; Owner: WLS TELEVISION, INC.)
- WMAQ-TV (Channel 5; CHICAGO, IL; Owner: NBC SUBSIDIARY (WMAQ-TV), INC.)
- WTTW (Channel 11; CHICAGO, IL; Owner: WINDOW TO THE WORLD COMMUNICATIONS, INC.)
- WGN-TV (Channel 9; CHICAGO, IL; Owner: WGN CONTINENTAL BROADCASTING COMPANY)
- WGBO-TV (Channel 66; JOLIET, IL; Owner: WGBO LICENSE PARTNERSHIP, G.P.)
- WBBM-TV (Channel 2; CHICAGO, IL; Owner: CBS BROADCASTING INC.)
- WPWR-TV (Channel 50; GARY, IN; Owner: FOX TELEVISION STATIONS, INC.)
- WXFT (Channel 60; AURORA, IL; Owner: TELEFUTURA CHICAGO LLC)
- WCIU-TV (Channel 26; CHICAGO, IL; Owner: WCIU-TV LIMITED PARTNERSHIP)
- WCPX (Channel 38; CHICAGO, IL; Owner: PAXSON CHICAGO LICENSE, INC.)
- WFLD (Channel 32; CHICAGO, IL; Owner: FOX TELEVISION STATIONS, INC.)
- W68DO (Channel 68; PALATINE, IL; Owner: TRINITY BROADCASTING NETWORK)
- WFBT-CA (Channel 23; CHICAGO, IL; Owner: CHANNEL 23 LIMITED PARTNERSHIP)
- WJYS (Channel 62; HAMMOND, IN; Owner: JOVON BROADCASTING CORPORATION)
- WSNS-TV (Channel 44; CHICAGO, IL; Owner: TELEMUNDO OF CHICAGO, INC.)
- WOCH-LP (Channel 28; CHICAGO, IL; Owner: KM LPTV OF CHICAGO-28, L.L.C.)
- WYCC (Channel 20; CHICAGO, IL; Owner: COLLEGE DIST. #508, COUNTY OF COOK)
- WOCK-CA (Channel 13; CHICAGO, IL; Owner: KM LPTV OF CHICAGO-13, L.L.C.)
- WYIN (Channel 56; GARY, IN; Owner: NORTHWEST INDIANA PUBLIC BROADCASTING, INC.)
- W34CK (Channel 34; ARLINGTON HEIGHTS, IL; Owner: FIRST UNITED, INC.)
- W64CQ (Channel 64; ARLINGTON HEIGHTS, IL; Owner: TRINITY BROADCASTING NETWORK)
- W24AJ (Channel 24; AURORA, IL; Owner: NELSON TV, INC.)
- National Bridge Inventory (NBI) Statistics
- 14Number of bridges
- 62ft / 19.4mTotal length
- 137,375Total average daily traffic
- 5,250Total average daily truck traffic
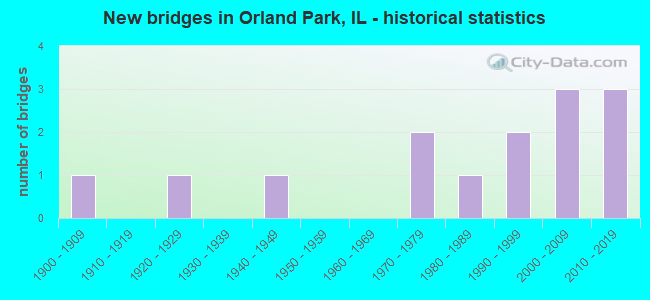
- New bridges - historical statistics
- 11900-1909
- 11920-1929
- 11940-1949
- 21970-1979
- 11980-1989
- 21990-1999
- 32000-2009
- 32010-2019
FCC Registered Private Land Mobile Towers: 2 (See the full list of FCC Registered Private Land Mobile Towers in Orland Park, IL)
FCC Registered Broadcast Land Mobile Towers: 23 (See the full list of FCC Registered Broadcast Land Mobile Towers)
FCC Registered Microwave Towers: 64 (See the full list of FCC Registered Microwave Towers in this town)
FCC Registered Paging Towers: 3 (See the full list of FCC Registered Paging Towers)
FCC Registered Amateur Radio Licenses: 200 (See the full list of FCC Registered Amateur Radio Licenses in Orland Park)
FAA Registered Aircraft Manufacturers and Dealers: 1 (See the full list of FAA Registered Manufacturers and Dealers in Orland Park)
FAA Registered Aircraft: 36 (See the full list of FAA Registered Aircraft)
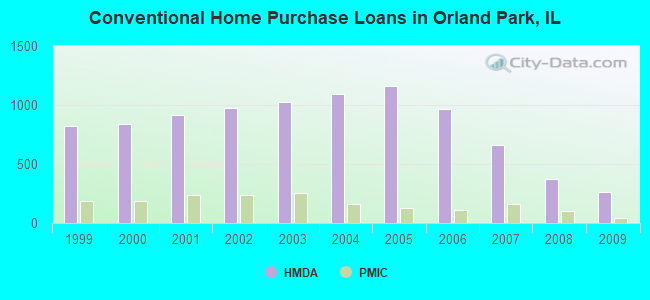
| Home Mortgage Disclosure Act Aggregated Statistics For Year 2009 (Based on 1 full and 11 partial tracts) | ||||||||||||||
| A) FHA, FSA/RHS & VA Home Purchase Loans | B) Conventional Home Purchase Loans | C) Refinancings | D) Home Improvement Loans | E) Loans on Dwellings For 5+ Families | F) Non-occupant Loans on < 5 Family Dwellings (A B C & D) | G) Loans On Manufactured Home Dwelling (A B C & D) | ||||||||
|---|---|---|---|---|---|---|---|---|---|---|---|---|---|---|
| Number | Average Value | Number | Average Value | Number | Average Value | Number | Average Value | Number | Average Value | Number | Average Value | Number | Average Value | |
| LOANS ORIGINATED | 136 | $211,763 | 261 | $209,013 | 1,739 | $217,850 | 60 | $146,960 | 2 | $201,960 | 19 | $187,586 | 6 | $217,630 |
| APPLICATIONS APPROVED, NOT ACCEPTED | 6 | $231,623 | 13 | $285,053 | 135 | $230,022 | 10 | $51,178 | 0 | $0 | 1 | $159,210 | 0 | $0 |
| APPLICATIONS DENIED | 20 | $201,110 | 31 | $272,087 | 376 | $250,396 | 21 | $86,196 | 0 | $0 | 20 | $243,559 | 1 | $3,770 |
| APPLICATIONS WITHDRAWN | 6 | $264,777 | 23 | $216,027 | 209 | $233,801 | 4 | $196,478 | 0 | $0 | 7 | $225,717 | 0 | $0 |
| FILES CLOSED FOR INCOMPLETENESS | 3 | $267,643 | 8 | $269,041 | 81 | $230,683 | 5 | $34,254 | 0 | $0 | 3 | $216,360 | 0 | $0 |
Detailed mortgage data for all 11 tracts in Orland Park, IL
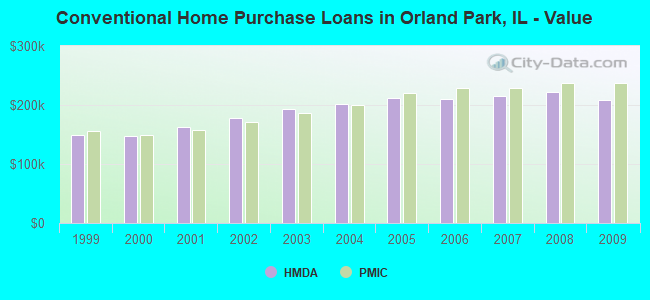
| Private Mortgage Insurance Companies Aggregated Statistics For Year 2009 (Based on 1 full and 11 partial tracts) | ||||
| A) Conventional Home Purchase Loans | B) Refinancings | |||
|---|---|---|---|---|
| Number | Average Value | Number | Average Value | |
| LOANS ORIGINATED | 45 | $237,774 | 30 | $258,691 |
| APPLICATIONS APPROVED, NOT ACCEPTED | 10 | $221,230 | 15 | $254,968 |
| APPLICATIONS DENIED | 11 | $188,239 | 17 | $280,779 |
| APPLICATIONS WITHDRAWN | 5 | $188,522 | 7 | $231,547 |
| FILES CLOSED FOR INCOMPLETENESS | 1 | $193,320 | 2 | $260,230 |
2002 - 2018 National Fire Incident Reporting System (NFIRS) incidents
- Fire incident types reported to NFIRS in Orland Park, IL
- 1,04651.9%Structure Fires
- 74737.1%Outside Fires
- 1859.2%Mobile Property/Vehicle Fires
- 361.8%Other
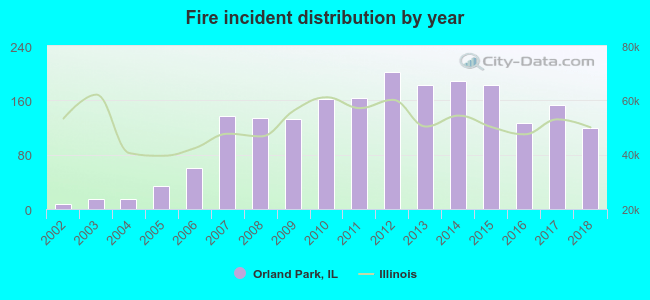 According to the data from the years 2002 - 2018 the average number of fire incidents per year is 118. The highest number of fires - 202 took place in 2012, and the least - 7 in 2002. The data has a growing trend.
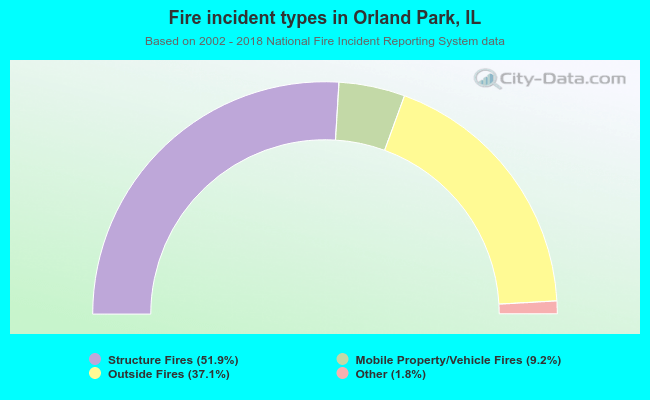 When looking into fire subcategories, the most reports belonged to: Structure Fires (51.9%), and Outside Fires (37.1%).
| Most common first names in Orland Park, IL among deceased individuals | ||
| Name | Count | Lived (average) |
|---|---|---|
| John | 353 | 75.7 years |
| Mary | 286 | 82.1 years |
| William | 209 | 74.6 years |
| Joseph | 192 | 76.1 years |
| Robert | 181 | 72.7 years |
| Helen | 180 | 82.8 years |
| Edward | 157 | 78.0 years |
| Frank | 125 | 80.1 years |
| James | 124 | 74.3 years |
| Anna | 120 | 84.6 years |
| Most common last names in Orland Park, IL among deceased individuals | ||
| Last name | Count | Lived (average) |
|---|---|---|
| Smith | 48 | 78.2 years |
| Johnson | 43 | 75.6 years |
| Anderson | 24 | 78.2 years |
| Miller | 24 | 79.9 years |
| Murphy | 22 | 76.4 years |
| Oconnor | 22 | 72.7 years |
| Brown | 22 | 79.1 years |
| Wagner | 20 | 77.7 years |
| Peterson | 20 | 80.2 years |
| Novak | 18 | 73.7 years |
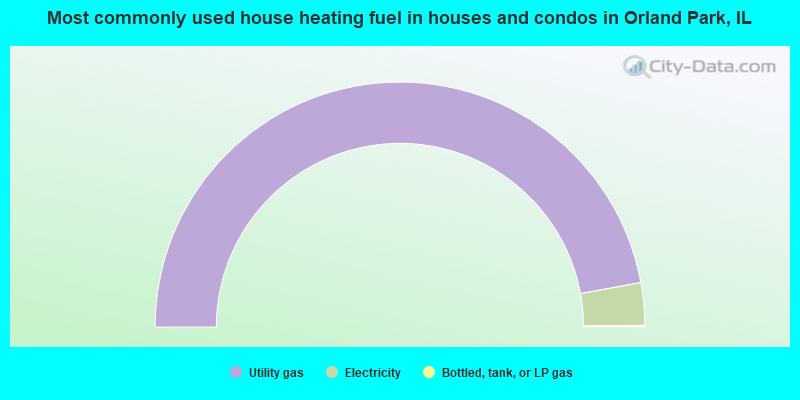
- 94.2%Utility gas
- 5.6%Electricity
- 0.2%Bottled, tank, or LP gas
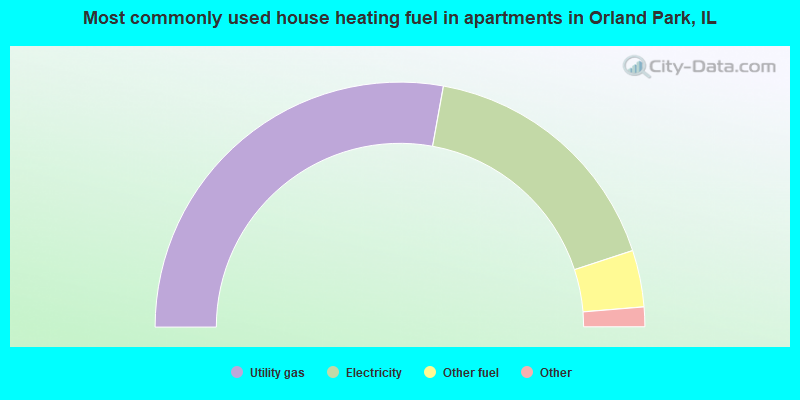
- 55.7%Utility gas
- 34.2%Electricity
- 7.5%Other fuel
- 1.4%No fuel used
- 1.1%Bottled, tank, or LP gas
Orland Park compared to Illinois state average:
- Unemployed percentage significantly below state average.
- Black race population percentage significantly below state average.
- Median age above state average.
- Renting percentage significantly below state average.
- Length of stay since moving in significantly above state average.
- House age below state average.
- Percentage of population with a bachelor's degree or higher above state average.
Orland Park on our top lists:
- #3 on the list of "Top 100 high-educated but low-earning cities (pop. 50,000+)"
- #4 on the list of "Top 101 cities with the lowest number of burglaries per 100,000 residents (population 50,000+)"
- #6 on the list of "Top 101 cities with the lowest number of robberies per 100,000 residents (population 50,000+)"
- #8 on the list of "Top 101 cities with the lowest number of rapes per 100,000 residents (population 50,000+)"
- #10 on the list of "Top 101 cities with the lowest number of assaults per 100,000 residents (population 50,000+)"
- #10 on the list of "Top 101 cities with the lowest number of auto thefts per 100,000 residents (population 50,000+)"
- #19 on the list of "Top 101 cities with the smallest city-data.com crime index per police officer (population 50,000+)"
- #20 on the list of "Top 100 cities with oldest residents (pop. 50,000+)"
- #20 on the list of "Top 101 cities with largest percentage of males in occupations: sales and related occupations (population 50,000+)"
- #20 on the list of "Top 101 cities with largest percentage of males in industries: management of companies and enterprises (population 50,000+)"
- #21 on the list of "Top 101 cities with the smallest percentage of unmarried partner households (population 50,000+)"
- #26 on the list of "Top 101 cities with largest percentage of females in occupations: health diagnosing and treating practitioners and other technical occupations (population 50,000+)"
- #37 on the list of "Top 101 cities with the smallest percentage of likely homosexual households (counted as self-reported same-sex unmarried-partner households) (population 50,000+)"
- #37 on the list of "Top 101 cities with the largest city-data.com crime index decrease from 2011 to 2012 (population 50,000+)"
- #39 on the list of "Top 101 cities with largest percentage of males in occupations: health diagnosing and treating practitioners and other technical occupations (population 50,000+)"
- #39 on the list of "Top 101 cities with largest percentage of males in industries: finance and insurance (population 50,000+)"
- #40 on the list of "Top 101 cities with the lowest city-data.com crime index (population 50,000+)"
- #48 on the list of "Top 100 safest cities (lowest city-data.com crime index) (pop. 50,000+)"
- #49 on the list of "Top 101 cities with the most people born in the same U.S. state as the city (population 50,000+)"
- #52 on the list of "Top 101 cities with the least people below the poverty level (population 50,000+)"
- #62 (60464) on the list of "Top 101 zip codes with the largest percentage of Lithuanian first ancestries"
- #1 on the list of "Top 101 counties with the most Black Protestant congregations"
- #1 on the list of "Top 101 counties with the most Catholic congregations"
- #1 on the list of "Top 101 counties with the highest surface withdrawal of fresh water for public supply"
- #2 on the list of "Top 101 counties with the most Black Protestant adherents"
- #2 on the list of "Top 101 counties with the most Orthodox congregations (pop. 50,000+)"

|
|
Total of 473 patent applications in 2008-2024.