Orland Park: Fire Incidents, Illinois (IL)
Where are fire incidents reported in Orland Park, IL
Something went wrong! Please refresh the page.
| Fire incidents reported | |
|---|---|
| Sreet name | Count |
| LA GRANGE RD | 322 |
| 159TH ST | 264 |
| 143RD ST | 144 |
| RAVINIA AVE | 116 |
| WOLF RD | 108 |
| 151ST ST | 88 |
| HARLEM AVE | 86 |
| ORLAN BROOK DR | 72 |
| 94TH AVE | 56 |
| LIBERTY SQUARE CI | 54 |
| ORLAND SQUARE DR | 52 |
| 179TH ST | 40 |
| 151ST | 36 |
| WEST AVE | 36 |
| 153RD ST | 34 |
| 80TH AVE | 34 |
| WHEELER DR | 34 |
| 157TH ST | 32 |
| ORLAND PARK PL | 32 |
| 88TH AVE | 30 |
| KOCH CT | 30 |
| 108TH AVE | 28 |
| 97TH AVE | 28 |
| BROOK HILL DR | 28 |
| 167TH ST | 26 |
| EL CAMENO REAL DR | 26 |
| 139TH ST | 22 |
| JOHN HUMPHREY DR | 22 |
| 140TH ST | 20 |
| HIGHLAND AVE | 20 |
| Other | 94 |
2002 - 2018 National Fire Incident Reporting System (NFIRS) incidents
- Incident types reported to NFIRS in Orland Park, IL
- 22,80459.5%Rescue & EMS
- 5,21113.6%False Alarm
- 4,32311.3%Service Call
- 2,2735.9%Hazardous Condition
- 2,0145.3%Fire
- 1,6234.2%Good Intent Call
- Fire incident types reported to NFIRS in Orland Park, IL
- 1,04651.9%Structure Fires
- 74737.1%Outside Fires
- 1859.2%Mobile Property/Vehicle Fires
- 361.8%Other
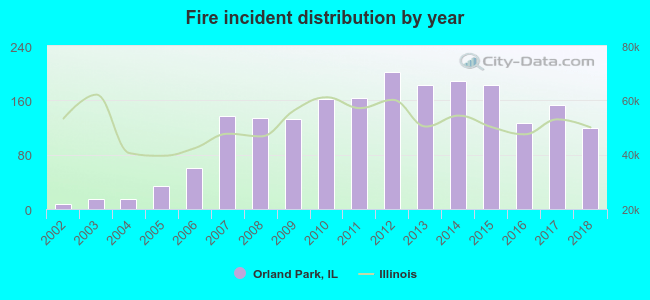 According to the data from the years 2002 - 2018 the average number of fire incidents per year is 118. The highest number of reported fire incidents - 202 took place in 2012, and the least - 7 in 2002. The data has a growing trend.
The average number of yearly fire incidents per 10k residents in Orland Park, IL compared to nearest cities:
(Note: Based on data for the last 3 years, including only cities with population 5,000 and above)
| Orland Park: | 22.6 |
| Orland Hills: | 24.7 |
| Tinley Park: | 26.4 |
| Homer Glen: | 31.7 |
| Palos Heights: | 34.7 |
| Oak Forest: | 31.2 |
| Mokena: | 44.2 |
| Crestwood: | 51.7 |
| Worth: | 50.1 |
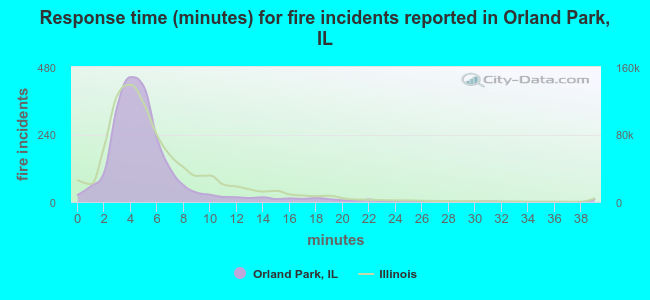 The median response time based on all reported fire incidents is 5 minutes. This is about the same as the state median value.
The median response time in Orland Park, IL compared to nearest cities:
(Note: Based on data for all years, including only cities with at least 500 fire incidents)
| Orland Park: | 5 minutes |
| Tinley Park: | 6 minutes |
| Palos Park: | 5 minutes |
| Homer Glen: | 6 minutes |
| Palos Heights: | 6 minutes |
| Oak Forest: | 5 minutes |
| Mokena: | 6 minutes |
| Crestwood: | 4 minutes |
| Worth: | 4 minutes |
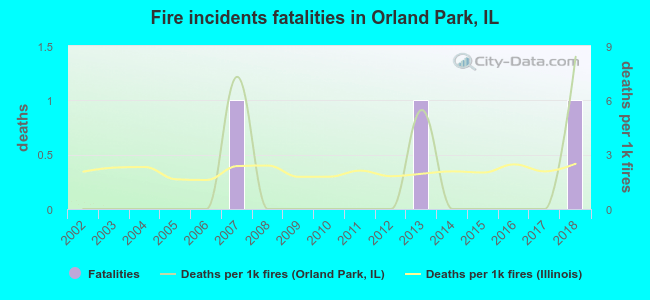 Based on the data from the years 2002 - 2018 the average number of fire-related yearly deaths is 0. The highest number of reported deaths - 1 took place in 2007, and the lowest - 0 in 2002. The data has an increasing trend.
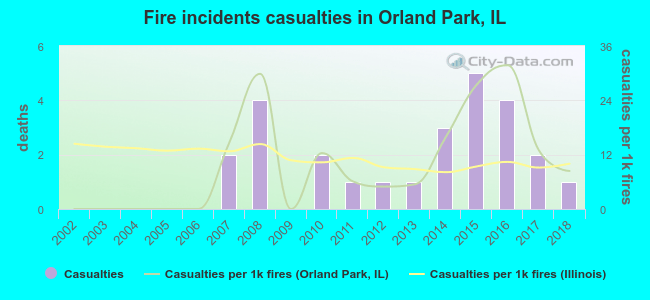 According to the reports from the years 2002 - 2018 the average number of fire-related casualties per year is 2. The highest number of casualties - 5 took place in 2015, and the lowest - 0 in 2002. The data has an increasing trend.
The average number of injuries per 1,000 fire incidents is 10. This indicator was the highest - 32 in 2016, and the lowest 0 in 2002. The trend for casualties per 1,000 fire incidents is growing. Compared to the Illinois value the number of casualties per 1,000 fires is about the same.
According to the reports from the years 2002 - 2018 the average number of fire-related casualties per year is 2. The highest number of casualties - 5 took place in 2015, and the lowest - 0 in 2002. The data has an increasing trend.
The average number of injuries per 1,000 fire incidents is 10. This indicator was the highest - 32 in 2016, and the lowest 0 in 2002. The trend for casualties per 1,000 fire incidents is growing. Compared to the Illinois value the number of casualties per 1,000 fires is about the same.Casualties per 1,000 incidents in Orland Park, IL compared to nearest cities:
(Note: Based on data for all years, including only cities with at least 500 fire incidents)
| Orland Park: | 12.9 |
| Tinley Park: | 4.7 |
| Palos Park: | 1.9 |
| Homer Glen: | 8.4 |
| Palos Heights: | 7.2 |
| Oak Forest: | 11.3 |
| Mokena: | 3.4 |
| Crestwood: | 64.6 |
| Worth: | 3.8 |
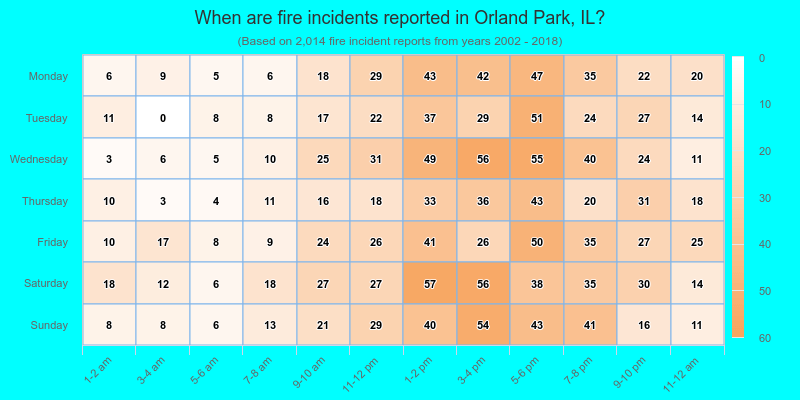
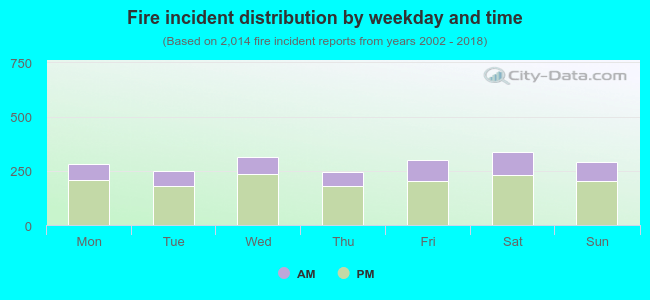 28.2% incidents where reported in the morning and 71.8% in the evening. The most fires (16.8%) took place on Saturday, and the least (12.1%) on Thursday.
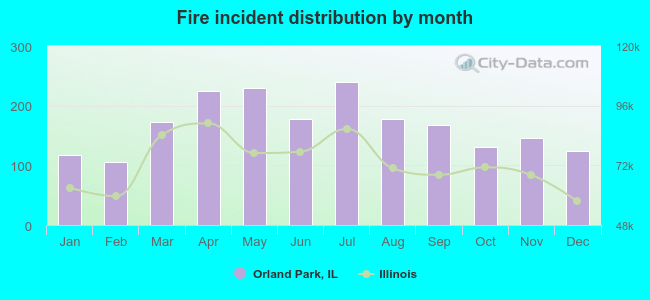 According to the 2,014 incident reports from years 2002 - 2018 most fires (11.9%) took place during July, and the least (5.3%) in February.
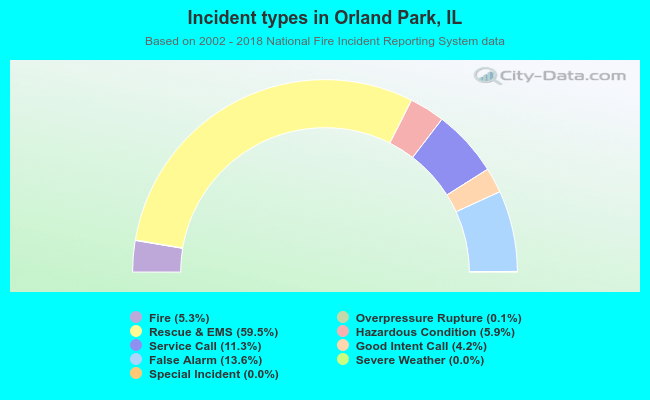 Out of all 38,310 cases reported during the years 2002 - 2018, the most belonged to the categories: Rescue & EMS (59.5%), False Alarm (13.6%), and Service Call (11.3%).
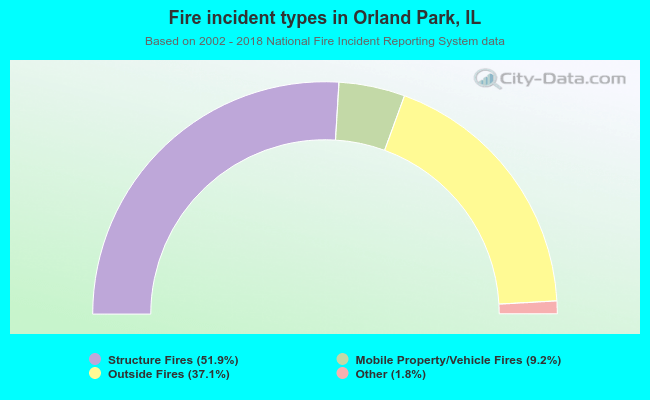 When looking into fire subcategories, the most reports belonged to: Structure Fires (51.9%), and Outside Fires (37.1%).