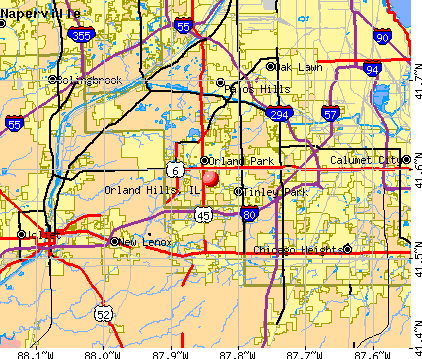
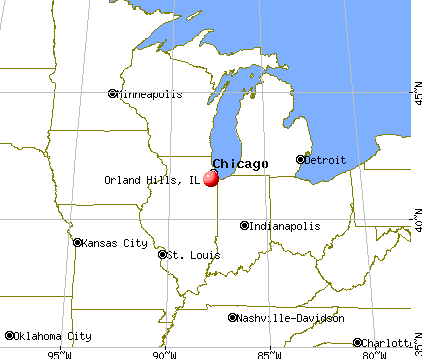
Orland Hills, Illinois
Submit your own pictures of this village and show them to the world
- OSM Map
- General Map
- Google Map
- MSN Map
Population change since 2000: -2.0%
 |
| Males: 3,578 | |
| Females: 3,064 |
| Median resident age: | 35.2 years |
| Illinois median age: | 39.1 years |
Zip codes: 60477.
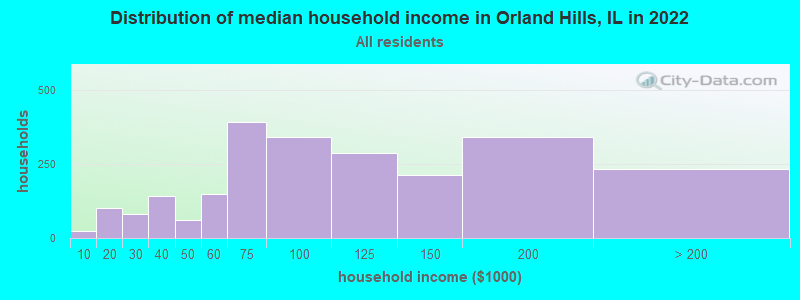
| Orland Hills: | $90,848 |
| IL: | $76,708 |
Estimated per capita income in 2022: $37,991 (it was $21,415 in 2000)
Orland Hills village income, earnings, and wages data
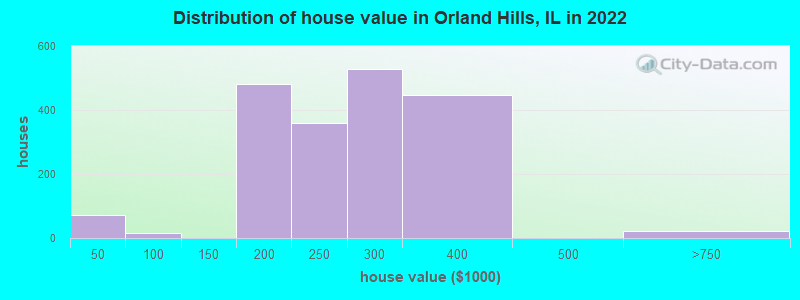
Estimated median house or condo value in 2022: $251,731 (it was $157,000 in 2000)
| Orland Hills: | $251,731 |
| IL: | $251,600 |
Mean prices in 2022: all housing units: $282,302; detached houses: $281,527; townhouses or other attached units: $347,364; in 5-or-more-unit structures: $186,452
Median gross rent in 2022: $1,360.
(4.1% for White Non-Hispanic residents, 33.8% for Black residents, 2.4% for Hispanic or Latino residents, 3.8% for two or more races residents)
Detailed information about poverty and poor residents in Orland Hills, IL
Compare current foreclosures near Orland Hills, IL:
| Photo | Address | Area | Beds / Baths | Price | Details |
|---|---|---|---|---|---|

|
#1
Richton Rd
Steger, IL 60475
|
1,400 sq. feet
|
1 baths 3 beds |
$209,900
|
show details |

|
#2
S Wood St
Chicago, IL 60620
|
899 sq. feet
|
1 baths 4 beds |
$93,600
|
show details |

|
#3
S Normal Ave
Chicago, IL 60628
|
989 sq. feet
|
1 baths 3 beds |
$154,375
|
show details |

|
#4
Oxford Rd
Bolingbrook, IL 60440
|
1,672 sq. feet
|
2 baths 4 beds |
$152,000
|
show details |

|
#5
186th St
Lansing, IL 60438
|
2,177 sq. feet
|
1 baths 4 beds |
$95,000
|
show details |

|
#6
S Kensington Ave
La Grange, IL 60525
|
4,128 sq. feet
|
3 baths 4 beds |
$814,400
|
show details |

|
#7
S Union Ave
Chicago, IL 60620
|
1,920 sq. feet
|
2 baths 4 beds |
$75,000
|
show details |

|
#8
Lincoln Ave
Dolton, IL 60419
|
1,966 sq. feet
|
2 baths 3 beds |
$77,500
|
show details |

|
#9
S Honore St
Chicago, IL 60636
|
1,232 sq. feet
|
2 baths 4 beds |
$79,000
|
show details |

|
#10
S Ingleside Ave
Chicago, IL 60628
|
1,584 sq. feet
|
2 baths 3 beds |
$131,750
|
show details |
| Photo | Address | Area | Beds / Baths | Price | Details |
|---|---|---|---|---|---|

|
#11
S Clyde Ave
Chicago, IL 60617
|
1,100 sq. feet
|
2 baths 3 beds |
$149,900
|
show details |

|
#12
Idlewild Dr
Country Club Hills, IL 60478
|
1,300 sq. feet
|
1 baths 3 beds |
$279,900
|
show details |

|
#13
176th Pl
Lansing, IL 60438
|
1,511 sq. feet
|
1 baths 2 beds |
$187,200
|
show details |

|
#14
W 63rd St
Chicago, IL 60638
|
1,250 sq. feet
|
2 baths 4 beds |
$395,000
|
show details |

|
#15
S 87th Ave
Justice, IL 60458
|
2,725 sq. feet
|
3 baths 4 beds |
$585,000
|
show details |

|
#16
N Bruce Ln Apt 311
Glenwood, IL 60425
|
1,000 sq. feet
|
2 baths 2 beds |
$185,000
|
show details |

|
#17
Marquette Ave
Calumet City, IL 60409
|
1,316 sq. feet
|
1 baths 3 beds |
$144,000
|
show details |

|
#18
Prairie Ave
Calumet City, IL 60409
|
2,841 sq. feet
|
2 baths 6 beds |
$159,500
|
show details |

|
#19
W 100th Pl
Chicago, IL 60628
|
971 sq. feet
|
1 baths 2 beds |
$233,000
|
show details |

|
#20
145th St
Midlothian, IL 60445
|
2,000 sq. feet
|
1 baths 3 beds |
$199,900
|
show details |
| Photo | Address | Area | Beds / Baths | Price | Details |
|---|---|---|---|---|---|

|
#21
S King Dr
Chicago, IL 60619
|
880 sq. feet
|
1 baths 2 beds |
$89,400
|
show details |

|
#22
W 108th St Apt D
Chicago, IL 60643
|
1,300 sq. feet
|
2 baths 3 beds |
$150,000
|
show details |

|
#23
W Arquilla Dr
Palos Heights, IL 60463
|
1,780 sq. feet
|
2 baths 2 beds |
$309,000
|
show details |

|
#24
Dorchester Ave
Dolton, IL 60419
|
925 sq. feet
|
1 baths 3 beds |
$86,100
|
show details |

|
#25
S Calumet Ave
Chicago, IL 60619
|
1,302 sq. feet
|
1 baths 5 beds |
$114,400
|
show details |

|
#26
S Perry Ave
Chicago, IL 60628
|
1,248 sq. feet
|
1 baths 3 beds |
$104,000
|
show details |

|
#27
Wisconsin St
Joliet, IL 60432
|
832 sq. feet
|
1 baths 2 beds |
$199,900
|
show details |

|
#28
S Ada St
Chicago, IL 60636
|
2,619 sq. feet
|
2 baths 6 beds |
$244,400
|
show details |

|
#29
W Margaret St
Monee, IL 60449
|
1,680 sq. feet
|
2 baths 4 beds |
$287,000
|
show details |

|
#30
Raymond Ave
Brookfield, IL 60513
|
1,020 sq. feet
|
1 baths 2 beds |
$239,200
|
show details |
| Photo | Address | Area | Beds / Baths | Price | Details |
|---|---|---|---|---|---|

|
#31
Hellenic Dr
Olympia Fields, IL 60461
|
4,000 sq. feet
|
3 baths 4 beds |
$495,000
|
show details |

|
#32
Finch Ave
Harvey, IL 60426
|
1,108 sq. feet
|
2 baths 3 beds |
$225,000
|
show details |

|
#33
W 106th St
Chicago, IL 60643
|
1,212 sq. feet
|
3 baths 5 beds |
$244,900
|
show details |

|
#34
Peoria St
Steger, IL 60475
|
616 sq. feet
|
1 baths 2 beds |
$85,000
|
show details |

|
#35
Tarpon Ct
Homewood, IL 60430
|
1,800 sq. feet
|
3 baths 4 beds |
$355,000
|
show details |

|
#36
S Main St
Hometown, IL 60456
|
744 sq. feet
|
1 baths 2 beds |
$175,000
|
show details |

|
#37
S Calumet Ave
Chicago, IL 60628
|
3,690 sq. feet
|
3 baths 6 beds |
$275,000
|
show details |

|
#38
S Yale Ave
Chicago, IL 60628
|
1,608 sq. feet
|
2 baths 3 beds |
$270,000
|
show details |

|
#39
Devonshire Dr
Joliet, IL 60435
|
1,860 sq. feet
|
2 baths 3 beds |
$335,000
|
show details |

|
#40
Greenwood Rd Apt B210
Dolton, IL 60419
|
900 sq. feet
|
1 baths 2 beds |
$89,000
|
show details |
| Photo | Address | Area | Beds / Baths | Price | Details |
|---|---|---|---|---|---|

|
#41
S Bennett Ave
Chicago, IL 60617
|
1,052 sq. feet
|
1 baths 3 beds |
$278,000
|
show details |

|
#42
W 58th St
Chicago, IL 60629
|
- sq. feet
|
1 baths 3 beds |
$150,800
|
show details |

|
#43
S Iris Ct
Monee, IL 60449
|
- sq. feet
|
2 baths 4 beds |
$324,900
|
show details |

|
#44
Willard St
Joliet, IL 60432
|
- sq. feet
|
2 baths 3 beds |
$109,200
|
show details |

|
#45
Colligan St
Manhattan, IL 60442
|
- sq. feet
|
1 baths 2 beds |
$211,500
|
show details |

|
#46
S Winchester Ave
Chicago, IL 60636
|
- sq. feet
|
2 baths 4 beds |
$72,800
|
show details |

|
#47
E 93rd St
Chicago, IL 60619
|
- sq. feet
|
3 baths 3 beds |
$215,500
|
show details |

|
#48
S Charles St
Chicago, IL 60643
|
- sq. feet
|
4 baths 6 beds |
$369,900
|
show details |

|
#49
S Cicero Ave Apt 2c
Oak Lawn, IL 60453
|
1,200 sq. feet
|
1 baths 2 beds |
show details | |

|
Check over 1 million property listings on Foreclosure.com!
|
browse all offers | |||


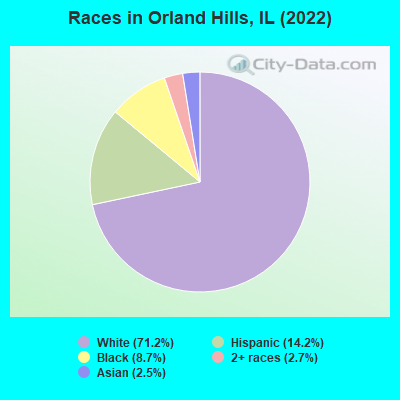
- 4,76171.2%White alone
- 95314.2%Hispanic
- 5808.7%Black alone
- 1802.7%Two or more races
- 1702.5%Asian alone
Races in Orland Hills detailed stats: ancestries, foreign born residents, place of birth
According to our research of Illinois and other state lists, there were 2 registered sex offenders living in Orland Hills, Illinois as of April 27, 2024.
The ratio of all residents to sex offenders in Orland Hills is 3,604 to 1.
The ratio of registered sex offenders to all residents in this city is much lower than the state average.
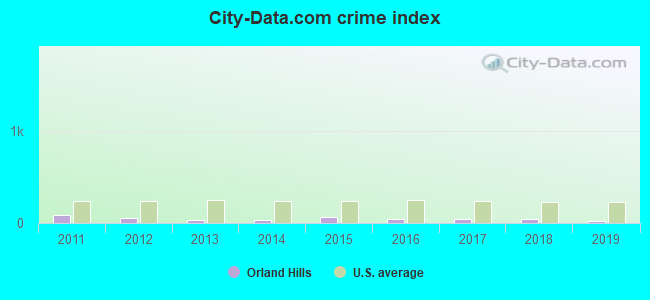
Type |
2011 |
2012 |
2013 |
2014 |
2015 |
2016 |
2017 |
2018 |
2019 |
|---|---|---|---|---|---|---|---|---|---|
| Murders (per 100,000) | 0 (0.0) | 0 (0.0) | 0 (0.0) | 0 (0.0) | 0 (0.0) | 0 (0.0) | 0 (0.0) | 0 (0.0) | 0 (0.0) |
| Rapes (per 100,000) | 0 (0.0) | 0 (0.0) | 0 (0.0) | 0 (0.0) | 0 (0.0) | 0 (0.0) | 0 (0.0) | 0 (0.0) | 0 (0.0) |
| Robberies (per 100,000) | 1 (13.9) | 1 (13.9) | 2 (27.7) | 2 (27.4) | 1 (13.7) | 0 (0.0) | 1 (13.9) | 1 (14.0) | 0 (0.0) |
| Assaults (per 100,000) | 6 (83.7) | 4 (55.7) | 0 (0.0) | 1 (13.7) | 5 (68.6) | 4 (55.1) | 2 (27.9) | 4 (56.0) | 1 (14.2) |
| Burglaries (per 100,000) | 7 (97.6) | 7 (97.5) | 5 (69.2) | 3 (41.1) | 7 (96.0) | 5 (68.9) | 0 (0.0) | 3 (42.0) | 0 (0.0) |
| Thefts (per 100,000) | 96 (1,339) | 64 (891.0) | 35 (484.6) | 33 (451.6) | 70 (960.0) | 40 (551.3) | 57 (794.1) | 38 (532.0) | 23 (325.5) |
| Auto thefts (per 100,000) | 4 (55.8) | 1 (13.9) | 1 (13.8) | 1 (13.7) | 0 (0.0) | 1 (13.8) | 0 (0.0) | 5 (70.0) | 2 (28.3) |
| Arson (per 100,000) | 0 (0.0) | 0 (0.0) | 1 (13.8) | 0 (0.0) | 0 (0.0) | 0 (0.0) | 0 (0.0) | 0 (0.0) | 0 (0.0) |
| City-Data.com crime index | 85.8 | 58.9 | 33.6 | 33.0 | 62.9 | 39.0 | 41.5 | 45.2 | 18.1 |
The City-Data.com crime index weighs serious crimes and violent crimes more heavily. Higher means more crime, U.S. average is 246.1. It adjusts for the number of visitors and daily workers commuting into cities.
Crime rate in Orland Hills detailed stats: murders, rapes, robberies, assaults, burglaries, thefts, arson
Full-time law enforcement employees in 2019, including police officers: 10 (10 officers - 10 male; 0 female).
| Officers per 1,000 residents here: | 1.42 |
| Illinois average: | 3.06 |
 Recent articles from our blog. Our writers, many of them Ph.D. graduates or candidates, create easy-to-read articles on a wide variety of topics.

 | Suburbs that are obscure or little-known (240 replies) |
| Suburbs of Suburbs (32 replies) |
| Affordable, liberal suburbs of Chicago? (56 replies) |
| Commute to Harvey IL (20 replies) |
| what are the bad south suburbs of chicago (90 replies) |
| Relative Safety in South Suburbs (7 replies) |
Latest news from Orland Hills, IL collected exclusively by city-data.com from local newspapers, TV, and radio stations
Ancestries: Palestinian (15.2%), Irish (8.2%), American (6.1%), Polish (6.1%), German (5.8%), Jordanian (5.3%).
Current Local Time: CST time zone
Incorporated on 02/02/1962
Elevation: 720 feet
Land area: 1.09 square miles.
Population density: 6,092 people per square mile (high).
1,105 residents are foreign born (10.1% Asia, 3.4% Latin America, 1.9% Europe).
| This village: | 16.5% |
| Illinois: | 14.1% |
Median real estate property taxes paid for housing units with mortgages in 2022: $5,235 (2.1%)
Median real estate property taxes paid for housing units with no mortgage in 2022: $5,917 (2.3%)
Nearest city with pop. 50,000+: Orland Park, IL  (1.7 miles , pop. 51,077).
Nearest city with pop. 200,000+: Chicago, IL (19.3 miles , pop. 2,896,016).
Nearest cities:
), ), Latitude: 41.59 N, Longitude: 87.84 W
Daytime population change due to commuting: -2,316 (-34.6%)
Workers who live and work in this village: 580 (15.8%)
Area code commonly used in this area: 708
Orland Hills, Illinois accommodation & food services, waste management - Economy and Business Data
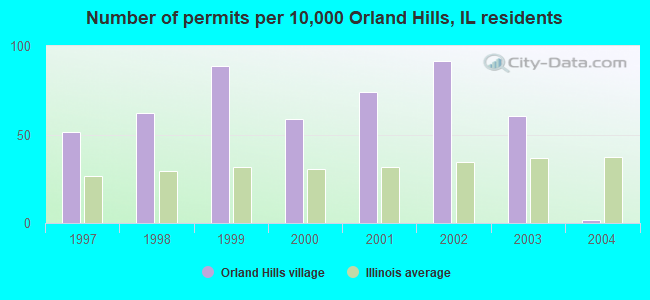
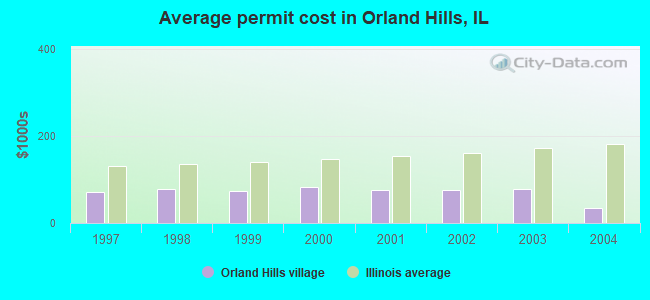
Single-family new house construction building permits:
- 2004: 1 building, cost: $35,000
- 2003: 41 buildings, average cost: $78,700
- 2002: 62 buildings, average cost: $75,500
- 2001: 50 buildings, average cost: $75,900
- 2000: 40 buildings, average cost: $81,500
- 1999: 60 buildings, average cost: $73,400
- 1998: 42 buildings, average cost: $78,400
- 1997: 35 buildings, average cost: $72,200
| Here: | 4.0% |
| Illinois: | 4.2% |
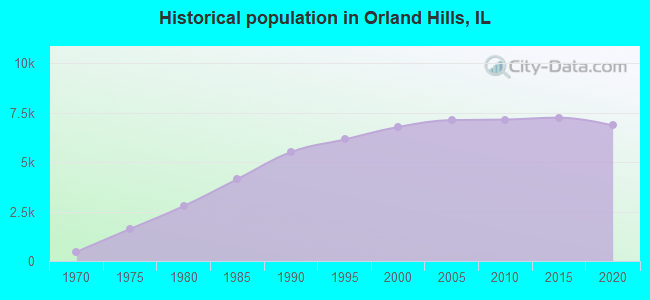
Population change in the 1990s: +1,321 (+24.2%).
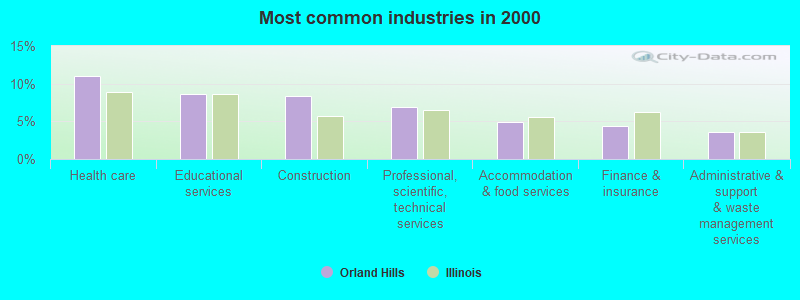
- Health care (11.0%)
- Educational services (8.6%)
- Construction (8.3%)
- Professional, scientific, technical services (6.9%)
- Accommodation & food services (4.9%)
- Finance & insurance (4.3%)
- Administrative & support & waste management services (3.6%)
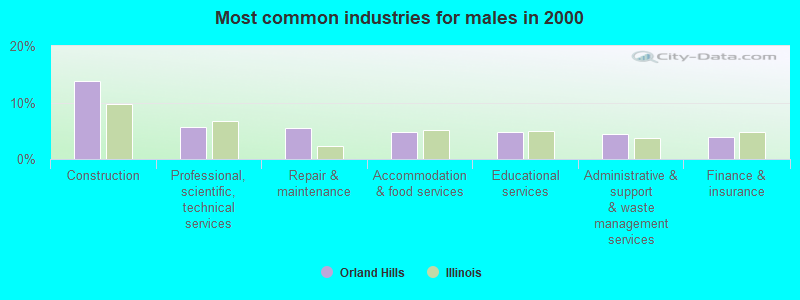
- Construction (13.9%)
- Professional, scientific, technical services (5.7%)
- Repair & maintenance (5.5%)
- Accommodation & food services (4.8%)
- Educational services (4.7%)
- Administrative & support & waste management services (4.5%)
- Finance & insurance (3.9%)
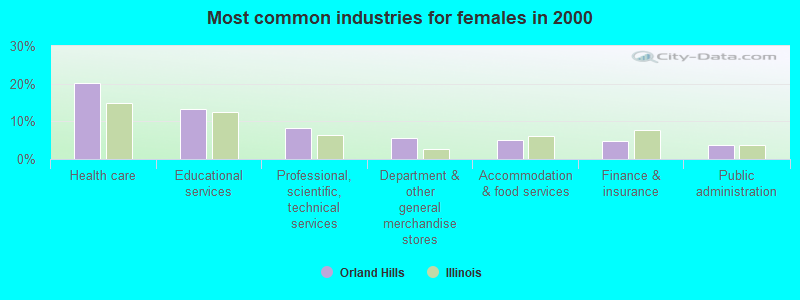
- Health care (20.2%)
- Educational services (13.3%)
- Professional, scientific, technical services (8.3%)
- Department & other general merchandise stores (5.7%)
- Accommodation & food services (5.0%)
- Finance & insurance (4.8%)
- Public administration (3.7%)
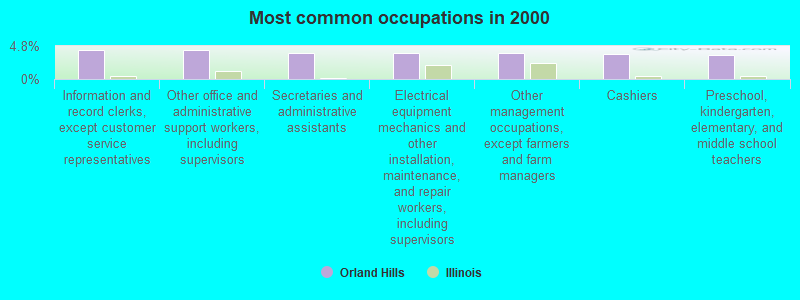
- Information and record clerks, except customer service representatives (4.2%)
- Other office and administrative support workers, including supervisors (4.2%)
- Secretaries and administrative assistants (3.8%)
- Electrical equipment mechanics and other installation, maintenance, and repair workers, including supervisors (3.8%)
- Other management occupations, except farmers and farm managers (3.7%)
- Cashiers (3.6%)
- Preschool, kindergarten, elementary, and middle school teachers (3.4%)
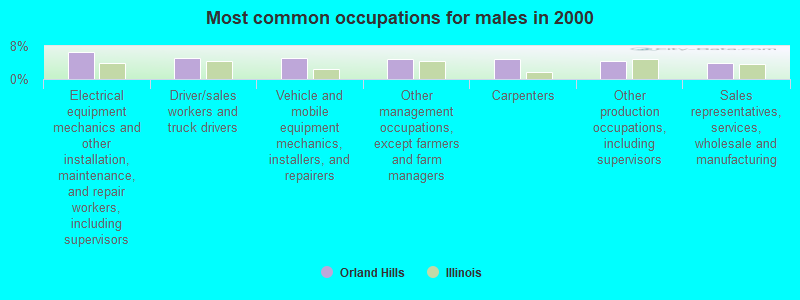
- Electrical equipment mechanics and other installation, maintenance, and repair workers, including supervisors (6.4%)
- Driver/sales workers and truck drivers (5.2%)
- Vehicle and mobile equipment mechanics, installers, and repairers (5.1%)
- Other management occupations, except farmers and farm managers (4.8%)
- Carpenters (4.7%)
- Other production occupations, including supervisors (4.3%)
- Sales representatives, services, wholesale and manufacturing (3.8%)
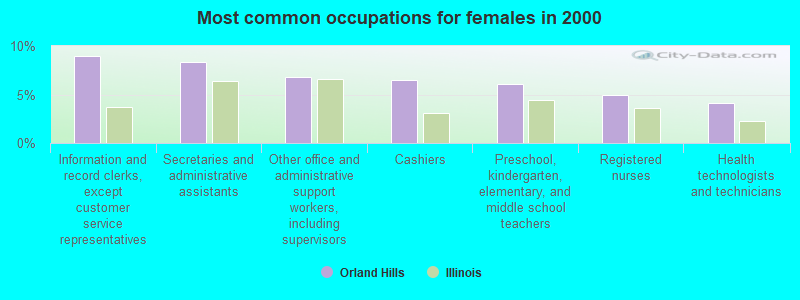
- Information and record clerks, except customer service representatives (9.0%)
- Secretaries and administrative assistants (8.4%)
- Other office and administrative support workers, including supervisors (6.8%)
- Cashiers (6.5%)
- Preschool, kindergarten, elementary, and middle school teachers (6.1%)
- Registered nurses (5.0%)
- Health technologists and technicians (4.1%)
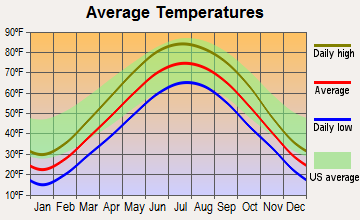
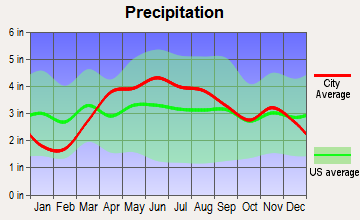
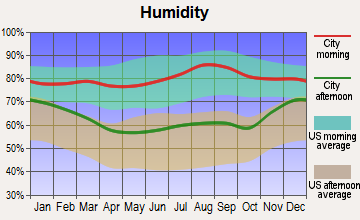
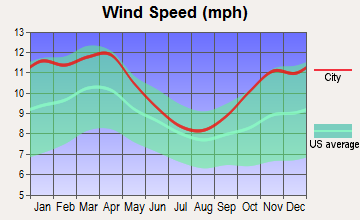
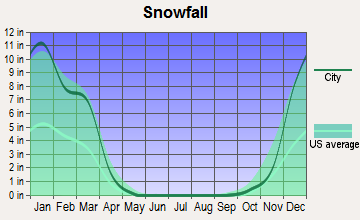
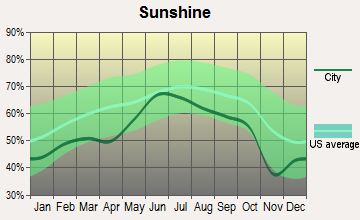
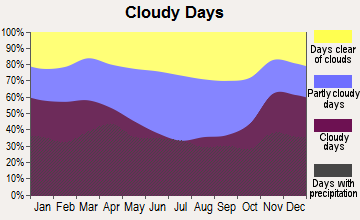
Average climate in Orland Hills, Illinois
Based on data reported by over 4,000 weather stations
(lower is better)
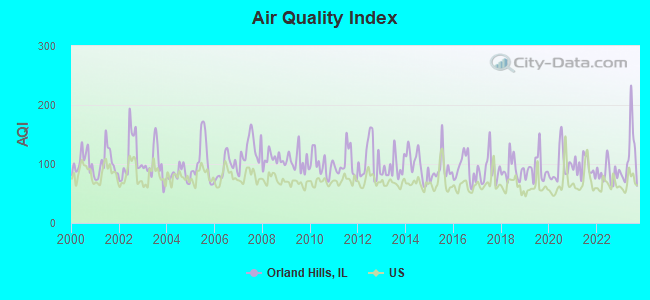
Air Quality Index (AQI) level in 2023 was 113. This is significantly worse than average.
| City: | 113 |
| U.S.: | 73 |
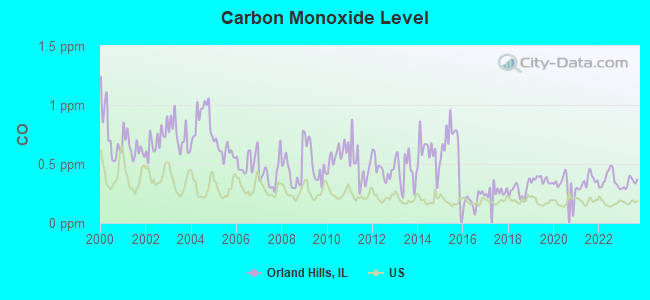
Carbon Monoxide (CO) [ppm] level in 2023 was 0.339. This is worse than average. Closest monitor was 11.4 miles away from the city center.
| City: | 0.339 |
| U.S.: | 0.251 |
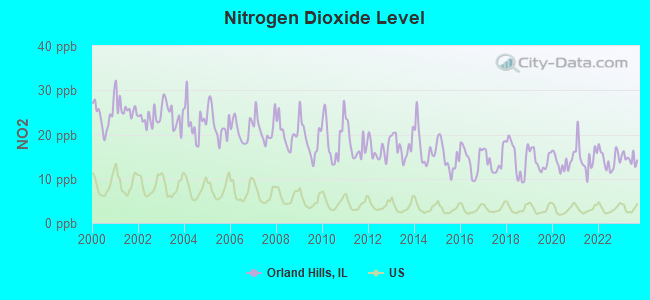
Nitrogen Dioxide (NO2) [ppb] level in 2023 was 14.6. This is significantly worse than average. Closest monitor was 8.0 miles away from the city center.
| City: | 14.6 |
| U.S.: | 5.1 |
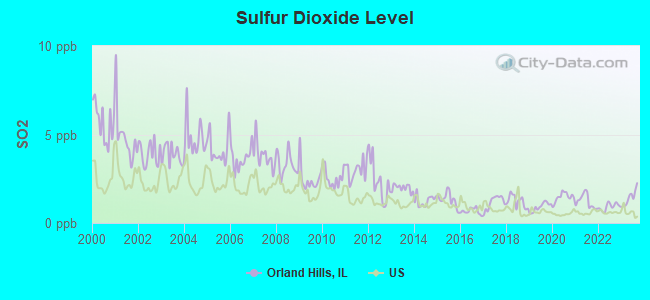
Sulfur Dioxide (SO2) [ppb] level in 2023 was 1.41. This is about average. Closest monitor was 8.2 miles away from the city center.
| City: | 1.41 |
| U.S.: | 1.51 |
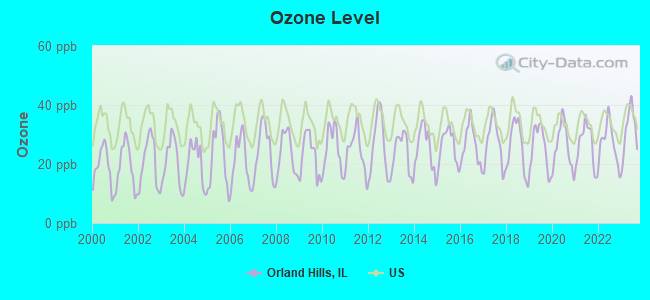
Ozone [ppb] level in 2023 was 31.5. This is about average. Closest monitor was 8.0 miles away from the city center.
| City: | 31.5 |
| U.S.: | 33.3 |
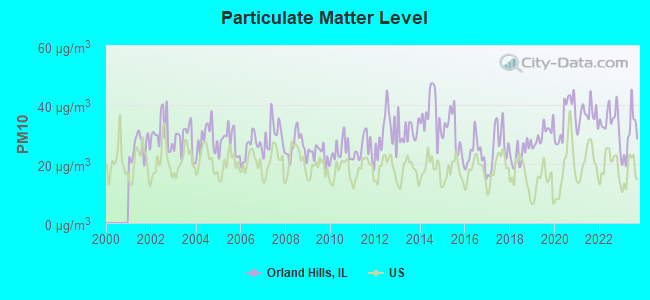
Particulate Matter (PM10) [µg/m3] level in 2023 was 29.4. This is significantly worse than average. Closest monitor was 6.7 miles away from the city center.
| City: | 29.4 |
| U.S.: | 19.2 |
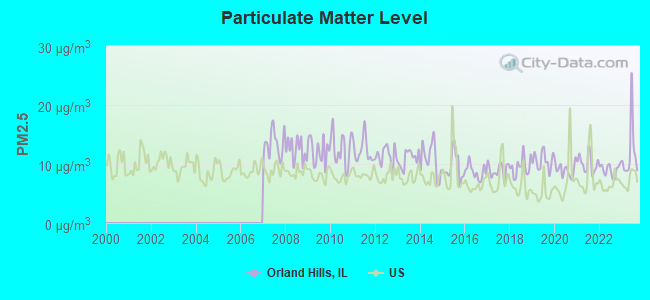
Particulate Matter (PM2.5) [µg/m3] level in 2023 was 11.9. This is significantly worse than average. Closest monitor was 8.0 miles away from the city center.
| City: | 11.9 |
| U.S.: | 8.1 |
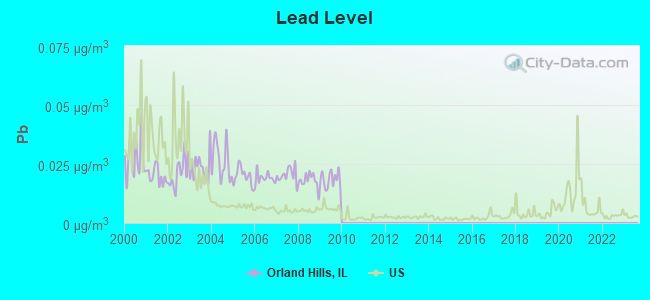
Lead (Pb) [µg/m3] level in 2009 was 0.0184. This is significantly worse than average. Closest monitor was 4.2 miles away from the city center.
| City: | 0.0184 |
| U.S.: | 0.0093 |
Tornado activity:
Orland Hills-area historical tornado activity is near Illinois state average. It is 60% greater than the overall U.S. average.
On 8/28/1990, a category F5 (max. wind speeds 261-318 mph) tornado 14.2 miles away from the Orland Hills village center killed 29 people and injured 350 people and caused between $50,000 and $500,000 in damages.
On 4/21/1967, a category F4 (max. wind speeds 207-260 mph) tornado 5.6 miles away from the village center killed 33 people and injured 500 people and caused between $5,000,000 and $50,000,000 in damages.
Earthquake activity:
Orland Hills-area historical earthquake activity is significantly above Illinois state average. It is 48% greater than the overall U.S. average.On 4/18/2008 at 09:36:59, a magnitude 5.4 (5.1 MB, 4.8 MS, 5.4 MW, 5.2 MW, Class: Moderate, Intensity: VI - VII) earthquake occurred 217.0 miles away from Orland Hills center
On 6/10/1987 at 23:48:54, a magnitude 5.1 (4.9 MB, 4.4 MS, 4.6 MS, 5.1 LG) earthquake occurred 191.5 miles away from Orland Hills center
On 4/18/2008 at 09:36:59, a magnitude 5.2 (5.2 MW, Depth: 8.9 mi) earthquake occurred 217.0 miles away from the city center
On 6/28/2004 at 06:10:52, a magnitude 4.2 (4.2 MW, Depth: 6.2 mi, Class: Light, Intensity: IV - V) earthquake occurred 55.6 miles away from the city center
On 6/18/2002 at 17:37:15, a magnitude 5.0 (4.3 MB, 4.6 MW, 5.0 LG) earthquake occurred 249.1 miles away from Orland Hills center
On 4/18/2008 at 15:14:16, a magnitude 4.8 (4.5 MB, 4.8 MW, 4.6 MW) earthquake occurred 215.3 miles away from Orland Hills center
Magnitude types: regional Lg-wave magnitude (LG), body-wave magnitude (MB), surface-wave magnitude (MS), moment magnitude (MW)
Natural disasters:
The number of natural disasters in Cook County (20) is greater than the US average (15).Major Disasters (Presidential) Declared: 15
Emergencies Declared: 4
Causes of natural disasters: Floods: 13, Storms: 12, Tornadoes: 3, Snowstorms: 2, Winter Storms: 2, Blizzard: 1, Hurricane: 1, Snow: 1, Wind: 1, Other: 1 (Note: some incidents may be assigned to more than one category).
Hospitals and medical centers near Orland Hills:
- ALDEN ORLAND PARK REHAB AND HCC (Nursing Home, about 1 miles away; ORLAND PARK, IL)
- ORLAND PARK SURGICAL CENTER (Hospital, about 1 miles away; ORLAND PARK, IL)
- FMC - ORLAND PARK (Dialysis Facility, about 1 miles away; ORLAND PARK, IL)
- CARING ANGELS HOME HEALTH SERVICES, INC (Home Health Center, about 3 miles away; ORLAND PARK, IL)
- INGALLS SAME DAY SURGERY (Hospital, about 3 miles away; TINLEY PARK, IL)
- MEDPRO HEALTH PROVIDERS (Home Health Center, about 3 miles away; TINLEY PARK, IL)
- UNICARE HOME HEALTH SERVICES, INC (Home Health Center, about 3 miles away; TINLEY PARK, IL)
Amtrak stations near Orland Hills:
- 10 miles: HOMEWOOD (181 1ST ST. & PARK AVE.) . Services: ticket office, enclosed waiting area, public restrooms, public payphones, paid short-term parking, paid long-term parking, public transit connection.
- 14 miles: JOLIET (50 E. JEFFERSON ST.) . Services: ticket office, partially wheelchair accessible, enclosed waiting area, public restrooms, public payphones, vending machines, paid short-term parking, paid long-term parking, public transit connection.
- 15 miles: SUMMIT (ARCHER & CENTER AVE.) . Services: public payphones, free short-term parking, free long-term parking, call for taxi service, public transit connection.
Colleges/universities with over 2000 students nearest to Orland Hills:
- Moraine Valley Community College (about 8 miles; Palos Hills, IL; Full-time enrollment: 12,008)
- Saint Xavier University (about 11 miles; Chicago, IL; FT enrollment: 3,576)
- Prairie State College (about 12 miles; Chicago Heights, IL; FT enrollment: 4,050)
- South Suburban College (about 12 miles; South Holland, IL; FT enrollment: 3,972)
- Governors State University (about 12 miles; University Park, IL; FT enrollment: 4,043)
- Lewis University (about 13 miles; Romeoville, IL; FT enrollment: 5,739)
- City Colleges of Chicago-Richard J Daley College (about 14 miles; Chicago, IL; FT enrollment: 7,497)
Public high school in Orland Hills:
- VICTOR J ANDREW HIGH SCHOOL (Students: 2,575, Location: 9001 171ST ST, Grades: 9-12)
Private elementary/middle schools in Orland Hills:
Points of interest:
Notable location: Orland Fire Protection District Station 4 (A). Display/hide its location on the map
Shopping Center: Orland Towne Center Shopping Center (1). Display/hide its location on the map
Park in Orland Hills: Kelly Park (1). Display/hide its location on the map
Birthplace of: Tim Regan - Major League Soccer player (MetroStars, born: Jun 27, 1981).
| This village: | 3.0 people |
| Illinois: | 2.6 people |
| This village: | 78.2% |
| Whole state: | 65.8% |
| This village: | 4.4% |
| Whole state: | 6.3% |
Likely homosexual households (counted as self-reported same-sex unmarried-partner households)
- Lesbian couples: 0.3% of all households
- Gay men: 0.1% of all households
Banks with branches in Orland Hills (2011 data):
- RBS Citizens, National Association: Orland Hills at 8811 West 159th Street, branch established on 1988/05/13. Info updated 2007/09/19: Bank assets: $106,940.6 mil, Deposits: $75,690.2 mil, headquarters in Providence, RI, positive income, 1135 total offices, Holding Company: Uk Financial Investments Limited
- Woodforest National Bank: Orland Hills Il Walmart Branch at 9245 West 159th Street, branch established on 2009/03/18. Info updated 2011/05/10: Bank assets: $3,488.9 mil, Deposits: $3,097.6 mil, headquarters in Houston, TX, positive income, Commercial Lending Specialization, 766 total offices, Holding Company: Woodforest Financial Group Employee Stock Ownership Plan (With 401(K) Provisions)
- MB Financial Bank, National Association: Orland Hills Branch at 9101 West 159th Street, branch established on 1989/02/03. Info updated 2010/04/27: Bank assets: $9,792.4 mil, Deposits: $7,757.4 mil, headquarters in Chicago, IL, positive income, Commercial Lending Specialization, 93 total offices, Holding Company: Mb Financial, Inc
For population 15 years and over in Orland Hills:
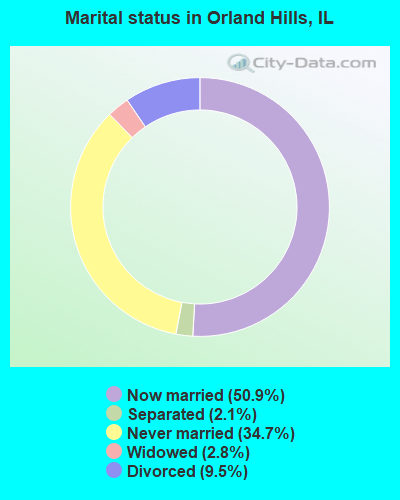
- Never married: 34.7%
- Now married: 50.9%
- Separated: 2.1%
- Widowed: 2.8%
- Divorced: 9.5%
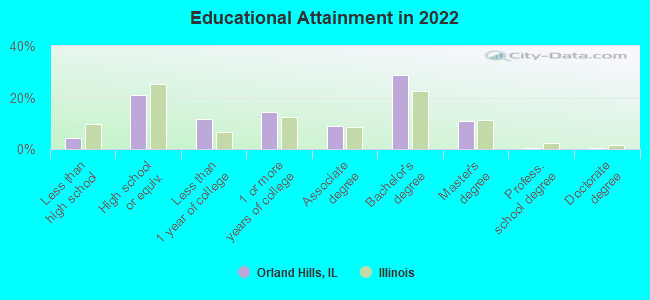
For population 25 years and over in Orland Hills:
- High school or higher: 95.4%
- Bachelor's degree or higher: 38.5%
- Graduate or professional degree: 10.8%
- Unemployed: 3.3%
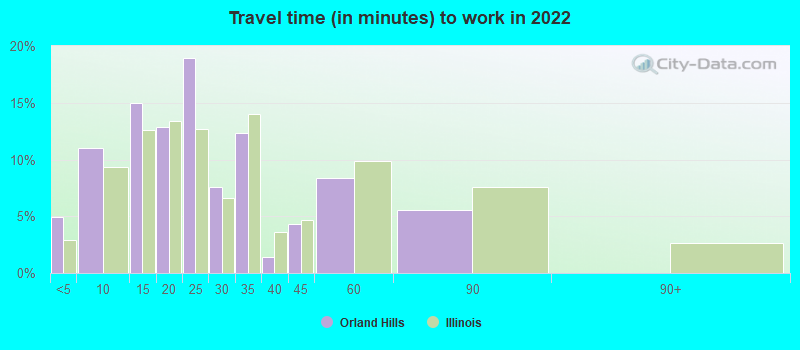
- Mean travel time to work (commute): 27.7 minutes
| Here: | 8.6 |
| Illinois average: | 12.5 |


Graphs represent county-level data. Detailed 2008 Election Results
Religion statistics for Orland Hills, IL (based on Cook County data)


| Religion | Adherents | Congregations |
|---|---|---|
| Catholic | 1,947,223 | 376 |
| Evangelical Protestant | 432,975 | 1,484 |
| Other | 312,636 | 403 |
| Mainline Protestant | 202,114 | 630 |
| Black Protestant | 148,895 | 395 |
| Orthodox | 53,276 | 66 |
| None | 2,097,556 | - |
Food Environment Statistics:
| Here: | 2.77 / 10,000 pop. |
| Illinois: | 2.24 / 10,000 pop. |
| Cook County: | 0.04 / 10,000 pop. |
| State: | 0.08 / 10,000 pop. |
| Here: | 0.93 / 10,000 pop. |
| State: | 0.75 / 10,000 pop. |
| Here: | 1.53 / 10,000 pop. |
| State: | 2.61 / 10,000 pop. |
| Cook County: | 6.67 / 10,000 pop. |
| Illinois: | 6.86 / 10,000 pop. |
| This county: | 8.4% |
| Illinois: | 8.3% |
| Cook County: | 23.5% |
| State: | 25.2% |
| Cook County: | 16.3% |
| Illinois: | 14.5% |
Health and Nutrition:
| Orland Hills: | 51.4% |
| State: | 49.5% |
| Orland Hills: | 51.6% |
| Illinois: | 47.2% |
| This city: | 28.4 |
| Illinois: | 28.6 |
| This city: | 21.3% |
| Illinois: | 20.5% |
| This city: | 9.2% |
| Illinois: | 10.8% |
| This city: | 6.8 |
| Illinois: | 6.8 |
| Orland Hills: | 32.5% |
| State: | 33.4% |
| Here: | 60.4% |
| Illinois: | 56.4% |
| Here: | 82.6% |
| Illinois: | 79.9% |
More about Health and Nutrition of Orland Hills, IL Residents
| Local government employment and payroll (March 2022) | |||||
| Function | Full-time employees | Monthly full-time payroll | Average yearly full-time wage | Part-time employees | Monthly part-time payroll |
|---|---|---|---|---|---|
| Police Protection - Officers | 11 | $99,629 | $108,686 | 37 | $52,561 |
| Financial Administration | 3 | $17,217 | $68,868 | 1 | $341 |
| Parks and Recreation | 3 | $16,403 | $65,612 | 9 | $7,015 |
| Other Government Administration | 2 | $13,473 | $80,838 | 8 | $2,500 |
| Streets and Highways | 2 | $13,471 | $80,826 | 6 | $8,840 |
| Transit | 1 | $3,189 | $38,268 | 0 | $0 |
| Totals for Government | 22 | $163,383 | $89,118 | 61 | $71,257 |
Orland Hills government finances - Expenditure in 2017 (per resident):
- Construction - Regular Highways: $224,000 ($33.72)
- Current Operations - Police Protection: $2,409,000 ($362.69)
Financial Administration: $1,154,000 ($173.74)
Regular Highways: $796,000 ($119.84)
Parks and Recreation: $549,000 ($82.66)
General - Other: $195,000 ($29.36)
Protective Inspection and Regulation - Other: $162,000 ($24.39)
- General - Interest on Debt: $10,000 ($1.51)
- Other Capital Outlay - Central Staff Services: $29,000 ($4.37)
- Total Salaries and Wages: $2,410,000 ($362.84)
Orland Hills government finances - Revenue in 2017 (per resident):
- Charges - Other: $622,000 ($93.65)
Housing and Community Development: $123,000 ($18.52)
Parks and Recreation: $100,000 ($15.06)
- Miscellaneous - Fines and Forfeits: $404,000 ($60.83)
General Revenue - Other: $205,000 ($30.86)
Interest Earnings: $4,000 ($0.60)
- State Intergovernmental - General Local Government Support: $2,772,000 ($417.34)
Highways: $181,000 ($27.25)
- Tax - Property: $573,000 ($86.27)
Other Selective Sales: $270,000 ($40.65)
Other License: $176,000 ($26.50)
Public Utilities Sales: $128,000 ($19.27)
Orland Hills government finances - Debt in 2017 (per resident):
- Long Term Debt - Outstanding Unspecified Public Purpose: $168,000 ($25.29)
Beginning Outstanding - Unspecified Public Purpose: $135,000 ($20.33)
Issue, Unspecified Public Purpose: $32,000 ($4.82)
Orland Hills government finances - Cash and Securities in 2017 (per resident):
- Other Funds - Cash and Securities: $1,019,000 ($153.42)
3.53% of this county's 2021 resident taxpayers lived in other counties in 2020 ($82,405 average adjusted gross income)
| Here: | 3.53% |
| Illinois average: | 5.09% |
0.01% of residents moved from foreign countries ($114 average AGI)
Cook County: 0.01% Illinois average: 0.01%
Top counties from which taxpayers relocated into this county between 2020 and 2021:
| from DuPage County, IL | |
| from Lake County, IL | |
| from Will County, IL |
5.44% of this county's 2020 resident taxpayers moved to other counties in 2021 ($120,340 average adjusted gross income)
| Here: | 5.44% |
| Illinois average: | 6.10% |
0.01% of residents moved to foreign countries ($140 average AGI)
Cook County: 0.01% Illinois average: 0.01%
Top counties to which taxpayers relocated from this county between 2020 and 2021:
| to DuPage County, IL | |
| to Will County, IL | |
| to Lake County, IL |
| Businesses in Orland Hills, IL | ||||
| Name | Count | Name | Count | |
|---|---|---|---|---|
| ALDI | 1 | PetSmart | 1 | |
| Ace Hardware | 1 | Subway | 3 | |
| Burger King | 1 | Taco Bell | 1 | |
| Fashion Bug | 1 | Walmart | 1 | |
| FedEx | 1 | Wendy's | 1 | |
| OfficeMax | 1 | |||
Strongest AM radio stations in Orland Hills:
- WLS (890 AM; 50 kW; CHICAGO, IL; Owner: WLS, INC.)
- WYLL (1160 AM; 50 kW; CHICAGO, IL; Owner: SCA LICENSE CORPORATION)
- WMVP (1000 AM; 50 kW; CHICAGO, IL; Owner: ABC, INC.)
- WVIV (1200 AM; 20 kW; CHICAGO, IL; Owner: WLXX-AM LICENSE CORP.)
- WSCR (670 AM; 50 kW; CHICAGO, IL; Owner: INFINITY BROADCASTING OPERATIONS, INC.)
- WBBM (780 AM; 50 kW; CHICAGO, IL; Owner: INFINITY BROADCASTING OPERATIONS, INC.)
- WGN (720 AM; 50 kW; CHICAGO, IL; Owner: WGN CONTINENTAL BROADCASTING CO.)
- WRDZ (1300 AM; 4 kW; LA GRANGE, IL; Owner: ABC, INC.)
- WNWI (1080 AM; 3 kW; OAK LAWN, IL; Owner: BIRACH BROADCASTING CORPORATION)
- WGCI (1390 AM; 5 kW; CHICAGO, IL; Owner: AMFM RADIO LICENSES, L.L.C.)
- WNTD (950 AM; 5 kW; CHICAGO, IL; Owner: RADIO UNICA OF CHICAGO LICENSE CORP.)
- WIND (560 AM; 5 kW; CHICAGO, IL; Owner: TICHENOR LICENSE CORPORATION ("TLC"))
- WTMJ (620 AM; 50 kW; MILWAUKEE, WI; Owner: JOURNAL BROADCAST CORPORATION)
Strongest FM radio stations in Orland Hills:
- WCKG (105.9 FM; ELMWOOD PARK, IL; Owner: INFINITY HOLDINGS CORPORATION OF ORLANDO)
- WLIT-FM (93.9 FM; CHICAGO, IL; Owner: AMFM RADIO LICENSES, L.L.C.)
- WJMK (104.3 FM; CHICAGO, IL; Owner: INFINITY BROADCASTING CORP. OF ILLINOIS)
- WNUA (95.5 FM; CHICAGO, IL; Owner: AMFM RADIO LICENSES, L.L.C.)
- WTMX (101.9 FM; SKOKIE, IL; Owner: BONNEVILLE HOLDING COMPANY)
- WBBM-FM (96.3 FM; CHICAGO, IL; Owner: INFINITY BROADCASTING OPERATIONS, INC.)
- WKSC-FM (103.5 FM; CHICAGO, IL; Owner: AMFM RADIO LICENSES, L.L.C.)
- WFMT (98.7 FM; CHICAGO, IL; Owner: WINDOW TO THE WORLD COMMUNICATIONS)
- WZZN (94.7 FM; CHICAGO, IL; Owner: ABC CHICAGO FM RADIO,INC.)
- WGCI-FM (107.5 FM; CHICAGO, IL; Owner: AMFM RADIO LICENSES, L.L.C.)
- WBEZ (91.5 FM; CHICAGO, IL; Owner: THE WBEZ ALLIANCE, INC.)
- WKQX (101.1 FM; CHICAGO, IL; Owner: EMMIS RADIO LICENSE CORPORATION)
- WLUP-FM (97.9 FM; CHICAGO, IL; Owner: BONNEVILLE HOLDING COMPANY)
- WNND (100.3 FM; CHICAGO, IL; Owner: BONNEVILLE HOLDING COMPANY)
- WOJO (105.1 FM; EVANSTON, IL; Owner: TICHENOR LICENSE CORPORATION ("TLC"))
- WUSN (99.5 FM; CHICAGO, IL; Owner: INFINITY BROADCASTING CORPORATION OF CHICAGO)
- WVAZ (102.7 FM; OAK PARK, IL; Owner: AMFM RADIO LICENSES, L.L.C.)
- WDRV (97.1 FM; CHICAGO, IL; Owner: BONNEVILLE HOLDING COMPANY)
- WXRT-FM (93.1 FM; CHICAGO, IL; Owner: INFINITY BROADCASTING OPERATIONS, INC.)
- WLEY-FM (107.9 FM; AURORA, IL; Owner: WLEY LICENSING, INC.)
TV broadcast stations around Orland Hills:
- W54AP (Channel 54; BLUE ISLAND, IL; Owner: CATHOLIC VIEWS BROADCASTS, INC.)
- WLS-TV (Channel 7; CHICAGO, IL; Owner: WLS TELEVISION, INC.)
- WMAQ-TV (Channel 5; CHICAGO, IL; Owner: NBC SUBSIDIARY (WMAQ-TV), INC.)
- WTTW (Channel 11; CHICAGO, IL; Owner: WINDOW TO THE WORLD COMMUNICATIONS, INC.)
- WGN-TV (Channel 9; CHICAGO, IL; Owner: WGN CONTINENTAL BROADCASTING COMPANY)
- WGBO-TV (Channel 66; JOLIET, IL; Owner: WGBO LICENSE PARTNERSHIP, G.P.)
- WBBM-TV (Channel 2; CHICAGO, IL; Owner: CBS BROADCASTING INC.)
- WPWR-TV (Channel 50; GARY, IN; Owner: FOX TELEVISION STATIONS, INC.)
- WXFT (Channel 60; AURORA, IL; Owner: TELEFUTURA CHICAGO LLC)
- WCIU-TV (Channel 26; CHICAGO, IL; Owner: WCIU-TV LIMITED PARTNERSHIP)
- WCPX (Channel 38; CHICAGO, IL; Owner: PAXSON CHICAGO LICENSE, INC.)
- WFLD (Channel 32; CHICAGO, IL; Owner: FOX TELEVISION STATIONS, INC.)
- W68DO (Channel 68; PALATINE, IL; Owner: TRINITY BROADCASTING NETWORK)
- WFBT-CA (Channel 23; CHICAGO, IL; Owner: CHANNEL 23 LIMITED PARTNERSHIP)
- WJYS (Channel 62; HAMMOND, IN; Owner: JOVON BROADCASTING CORPORATION)
- WSNS-TV (Channel 44; CHICAGO, IL; Owner: TELEMUNDO OF CHICAGO, INC.)
- WYIN (Channel 56; GARY, IN; Owner: NORTHWEST INDIANA PUBLIC BROADCASTING, INC.)
- WOCH-LP (Channel 28; CHICAGO, IL; Owner: KM LPTV OF CHICAGO-28, L.L.C.)
- WYCC (Channel 20; CHICAGO, IL; Owner: COLLEGE DIST. #508, COUNTY OF COOK)
- WOCK-CA (Channel 13; CHICAGO, IL; Owner: KM LPTV OF CHICAGO-13, L.L.C.)
- W34CK (Channel 34; ARLINGTON HEIGHTS, IL; Owner: FIRST UNITED, INC.)
- W64CQ (Channel 64; ARLINGTON HEIGHTS, IL; Owner: TRINITY BROADCASTING NETWORK)
- W24AJ (Channel 24; AURORA, IL; Owner: NELSON TV, INC.)
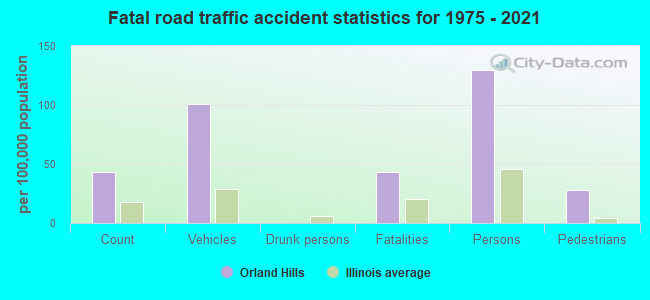
Orland Hills fatal accident list:
Dec 23, 2019 02:09 PM, Us-6 159h St, Lat: 41.601628, Lon: -87.838614, Vehicles: 4, Persons: 5, Fatalities: 1
Jun 7, 1999 07:26 AM, 171st, Vehicles: 2, Persons: 3, Fatalities: 1
FCC Registered Antenna Towers:
3- Richard Byrne, 16533 94th Avenue (Lat: 41.589917 Lon: -87.847194), Type: 27.1, Overall height: 23.1 m, Registrant: Towerco Assets LLC, Afry@towerco.Com, , Cary, Phone: (919) 653-5710
- Richard Byrne, 16533 94th Avenue (Lat: 41.589917 Lon: -87.847194), Type: 27.1, Overall height: 23.1 m, Registrant: Towerco Assets LLC, Afry@towerco.Com, , Cary, Phone: (919) 653-5710
- Edward G Roach, 16533 94th Avenue (Lat: 41.589917 Lon: -87.847194), Type: 27.1, Structure height: 17031 m, Overall height: 23.1 m, Registrant: Sba 2012 Tc Assets, LLC, Eroach@sbasite.Com, , Boca -Raton, Phone: (561) 995-7670
FCC Registered Broadcast Land Mobile Towers:
1- Lat: 41.588167 Lon: -87.845500, Call Sign: WQRW227,
Assigned Frequencies: 466.225 MHz, 466.250 MHz, 466.275 MHz, 466.200 MHz, 466.175 MHz, Grant Date: 08/01/2023, Expiration Date: 08/05/2033, Certifier: Ray Yanowsky, Registrant: Business Radio Licensing, 30251 Golden Lantern, Suite E #501, Laguna Niguel, CA 92677, Phone: (949) 348-8510, Fax: (949) 348-8514, Email:
FCC Registered Microwave Towers:
3- STATION, Station 4 At Sw Corner Of Int Of 167th St And 94th Ave (Lat: 41.586417 Lon: -87.848083), Overall height: 27.4 m, Call Sign: WNEV284,
Assigned Frequencies: 21825.0 MHz, Grant Date: 10/22/1998, Expiration Date: 01/13/2009, Cancellation Date: 03/21/2009, Phone: (312) 349-0074
- George East, Lat: 41.602500 Lon: -87.834444, Type: Building, Structure height: 23 m, Overall height: 23.5 m, Call Sign: WQMH622,
Assigned Frequencies: 3650.00 MHz, Grant Date: 08/10/2010, Expiration Date: 10/17/2020, Cancellation Date: 12/19/2020, Certifier: Randall Edgar, Registrant: Apps Communications, Inc., Apps Communications, Inc., Orland Park, IL 60467, Phone: (708) 403-9200, Fax: (708) 873-1310, Email:
- BANK, 8811 159th St (Lat: 41.601028 Lon: -87.834056), Type: Building, Structure height: 14.6 m, Overall height: 16.7 m, Call Sign: WQUI632,
Assigned Frequencies: 17820.0 MHz, 17820.0 MHz, 17820.0 MHz, 17820.0 MHz, 17820.0 MHz, 17820.0 MHz, 17820.0 MHz, 17820.0 MHz, 17865.0 MHz, Grant Date: 07/17/2014, Expiration Date: 07/17/2024, Certifier: John Urbanski, Registrant: Intelpath, Hinsdale, IL 60522, Phone: (312) 841-9188, Email:
FCC Registered Amateur Radio Licenses:
7- Call Sign: AK9S, Previous Call Sign: AA9CZ, Licensee ID: L00447651, Grant Date: 05/07/2019, Expiration Date: 07/22/2029, Certifier: Sergio Zoruba, Registrant: Sergio Zoruba, 8852 W 167th Place, Orland Hills, IL 60487
- Call Sign: WB9UCN, Licensee ID: L00601779, Grant Date: 05/29/2008, Expiration Date: 06/13/2018, Cancellation Date: 06/16/2020, Certifier: William E Meyers Iii, Registrant: William E Meyers Iii, 17001 Redwood Court, Orland Hills, IL 60487
- Call Sign: KC9QHO, Licensee ID: L01511761, Grant Date: 08/11/2009, Expiration Date: 08/11/2019, Cancellation Date: 08/12/2021, Certifier: Robert C Pienkowski, Registrant: Robert C Pienkowski, 8924 Beacon Ct, Orland Hills, IL 60487
- Call Sign: KD9IOX, Licensee ID: L02103575, Grant Date: 05/09/2017, Expiration Date: 05/09/2027, Certifier: John P Matthews, Registrant: John P Matthews, 16342 Pepperwood Trl, Orland Hills, IL 60487
- Call Sign: KD9IYB, Licensee ID: L02116738, Grant Date: 07/14/2017, Expiration Date: 07/14/2027, Cancellation Date: 08/08/2017, Certifier: Daniel J Haug, Registrant: Daniel J Haug, 16206 Hawthorne Lane, Orland Hills, IL 60487
- Call Sign: KA9BAR, Previous Call Sign: KD9IYB, Licensee ID: L02116738, Grant Date: 08/08/2017, Expiration Date: 08/08/2027, Certifier: Daniel J Haug, Registrant: Daniel J Haug, 16206 Hawthorne Lane, Orland Hills, IL 60487
- Call Sign: KD9NWB, Licensee ID: L02293162, Grant Date: 09/18/2019, Expiration Date: 09/18/2029, Certifier: George T Pearson, Registrant: George T Pearson, 8955 W. 169th Place, Orland Hills, IL 60487
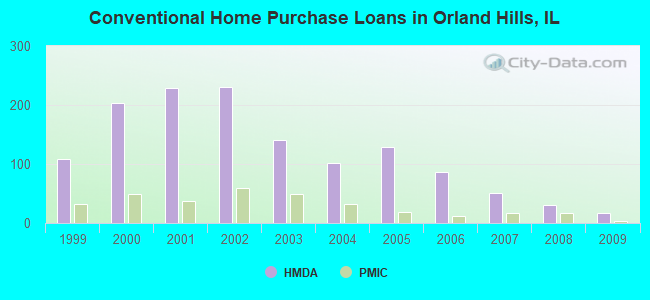
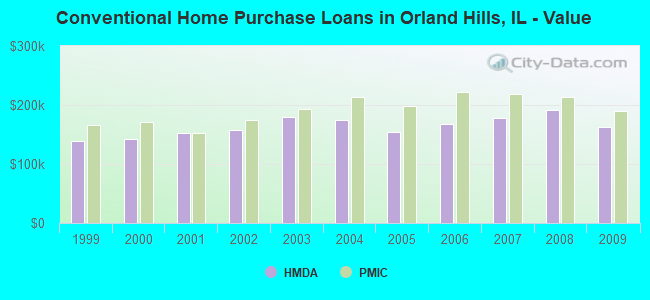
| Home Mortgage Disclosure Act Aggregated Statistics For Year 2009 (Based on 1 partial tract) | ||||||||||
| A) FHA, FSA/RHS & VA Home Purchase Loans | B) Conventional Home Purchase Loans | C) Refinancings | D) Home Improvement Loans | F) Non-occupant Loans on < 5 Family Dwellings (A B C & D) | ||||||
|---|---|---|---|---|---|---|---|---|---|---|
| Number | Average Value | Number | Average Value | Number | Average Value | Number | Average Value | Number | Average Value | |
| LOANS ORIGINATED | 23 | $204,241 | 17 | $162,344 | 166 | $182,570 | 5 | $87,954 | 2 | $129,850 |
| APPLICATIONS APPROVED, NOT ACCEPTED | 2 | $189,750 | 0 | $0 | 12 | $164,703 | 0 | $0 | 0 | $0 |
| APPLICATIONS DENIED | 4 | $207,150 | 1 | $169,310 | 43 | $188,109 | 3 | $54,283 | 1 | $208,760 |
| APPLICATIONS WITHDRAWN | 1 | $99,000 | 1 | $145,630 | 24 | $195,820 | 1 | $7,170 | 3 | $87,763 |
| FILES CLOSED FOR INCOMPLETENESS | 0 | $0 | 1 | $161,410 | 11 | $189,655 | 0 | $0 | 0 | $0 |
Detailed HMDA statistics for the following Tracts: 8241.08
| Private Mortgage Insurance Companies Aggregated Statistics For Year 2009 (Based on 1 partial tract) | ||||
| A) Conventional Home Purchase Loans | B) Refinancings | |||
|---|---|---|---|---|
| Number | Average Value | Number | Average Value | |
| LOANS ORIGINATED | 4 | $189,572 | 2 | $229,570 |
| APPLICATIONS APPROVED, NOT ACCEPTED | 2 | $217,015 | 3 | $233,873 |
| APPLICATIONS DENIED | 1 | $129,130 | 1 | $114,780 |
| APPLICATIONS WITHDRAWN | 0 | $0 | 4 | $169,485 |
| FILES CLOSED FOR INCOMPLETENESS | 0 | $0 | 1 | $148,500 |
Detailed PMIC statistics for the following Tracts: 8241.08
2003 - 2018 National Fire Incident Reporting System (NFIRS) incidents
- Fire incident types reported to NFIRS in Orland Hills, IL
- 10757.8%Structure Fires
- 5831.4%Outside Fires
- 1910.3%Mobile Property/Vehicle Fires
- 10.5%Other
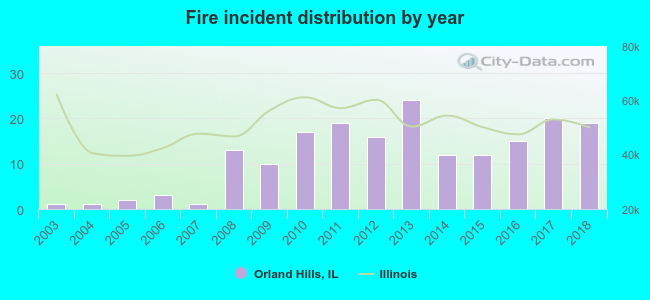 Based on the data from the years 2003 - 2018 the average number of fire incidents per year is 12. The highest number of fire incidents - 24 took place in 2013, and the least - 1 in 2003. The data has a rising trend.
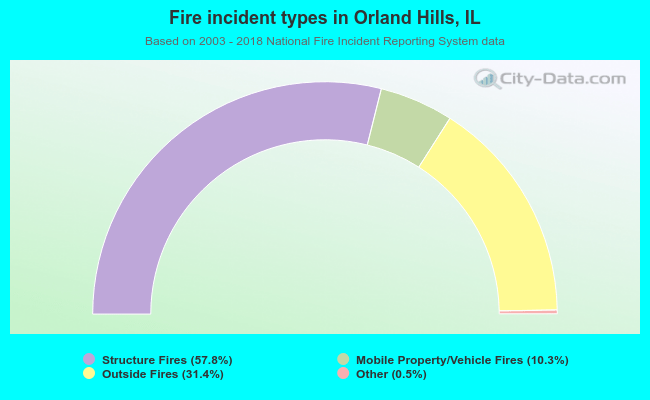 When looking into fire subcategories, the most reports belonged to: Structure Fires (57.8%), and Outside Fires (31.4%).
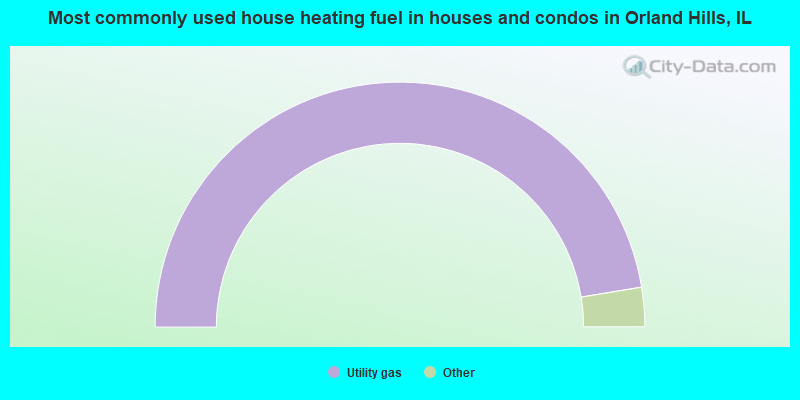
- 94.9%Utility gas
- 3.8%Electricity
- 1.3%Bottled, tank, or LP gas
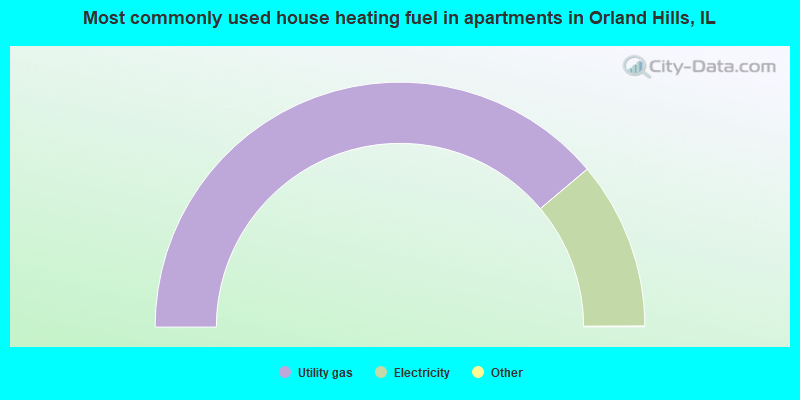
- 77.8%Utility gas
- 22.2%Electricity
Orland Hills compared to Illinois state average:
- Unemployed percentage significantly below state average.
- Median age below state average.
- Length of stay since moving in significantly above state average.
- House age below state average.
Orland Hills on our top lists:
- #3 on the list of "Top 101 cities with the most residents born in Jordan (population 500+)"
- #23 on the list of "Top 101 cities with the lowest cost per building permit(population 5,000+)"
- #23 on the list of "Top 101 cities with the most residents born in Western Asia (population 500+)"
- #57 on the list of "Top 101 cities with the smallest house values disparities (population 5,000+)"
- #72 on the list of "Top 101 cities with the most residents born in Lebanon (population 500+)"
- #76 on the list of "Top 101 cities with the smallest household incomes disparities (population 5,000+)"
- #97 on the list of "Top 101 cities with the most people taking railroad to work (population 5,000+)"
- #59 (60477) on the list of "Top 101 zip codes with the largest percentage of Lithuanian first ancestries (pop 5,000+)"
- #1 on the list of "Top 101 counties with the most Black Protestant congregations"
- #1 on the list of "Top 101 counties with the most Catholic congregations"
- #1 on the list of "Top 101 counties with the highest surface withdrawal of fresh water for public supply"
- #2 on the list of "Top 101 counties with the most Black Protestant adherents"
- #2 on the list of "Top 101 counties with the most Orthodox congregations (pop. 50,000+)"

|
|
Total of 15 patent applications in 2008-2024.