Estimated zip code population in 2022: 28,423 Zip code population in 2010: 30,099 Zip code population in 2000: 29,950
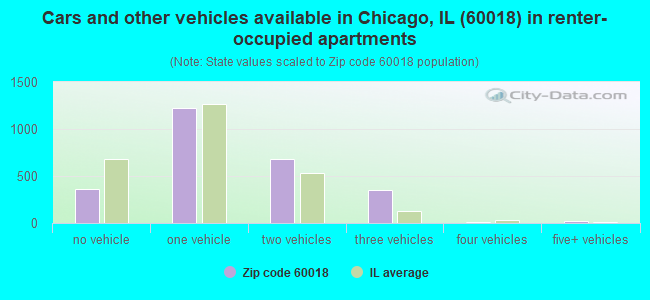
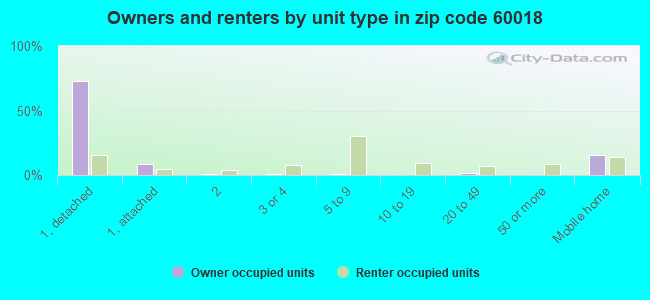
Houses and condos: 10,285 Renter-occupied apartments: 2,673
% of renters here:
27%
State:
33%
March 2022 cost of living index in zip code 60018: 100.9 (near average, U.S. average is 100)
Land area: 16.3 sq. mi. Water area: 0.3 sq. mi.
Population density: 1,738 people per square mile
(low).
OSM Map
General Map
Google Map
MSN Map
OSM Map
General Map
Google Map
MSN Map
OSM Map
General Map
Google Map
MSN Map
OSM Map
General Map
Google Map
MSN Map
Please wait while loading the map...
Real estate property taxes paid for housing units in 2022:
This zip code:
2.1% ($6,275)
Illinois:
2.0% ($4,912)
Median real estate property taxes paid for housing units with mortgages in 2022: $6,317 (1.9%) Median real estate property taxes paid for housing units with no mortgage in 2022: $6,176 (2.3%)
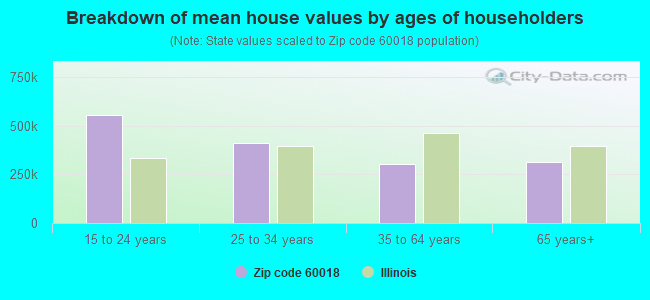
Estimated median house/condo value in 2022: $302,846
60018:
$302,846
Illinois:
$251,600
According to our research of Illinois and other state lists, there were 11 registered sex offenders living in 60018 zip code as of April 27, 2024. The ratio of all residents to sex offenders in zip code 60018 is 2,814 to 1. The ratio of registered sex offenders to all residents in this zip code is much lower than the state average.
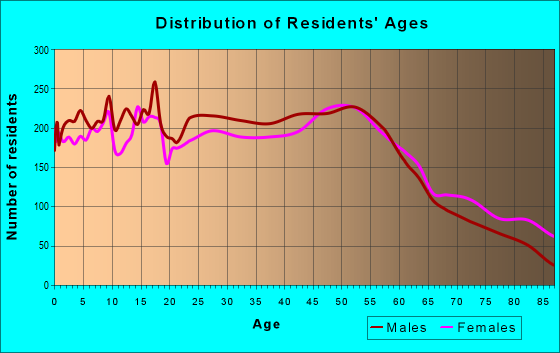
Median resident age:
This zip code:
41.5 years
Illinois median age:
39.1 years
Average household size:
This zip code:
2.8 people
Illinois:
2.4 people
Averages for the 2020 tax year for zip code 60018, filed in 2021:
Average Adjusted Gross Income (AGI) in 2020: $60,662 (Individual Income Tax Returns)
Here:
$60,662
State:
$82,626
Salary/wage: $51,361 (reported on 82.0% of returns)
Here:
$51,361
State:
$66,640
(% of AGI for various income ranges: 1222.6% for AGIs below $25k, 3690.8% for AGIs $25k-50k, 6698.1% for AGIs $50k-75k, 9554.0% for AGIs $75k-100k, 18080.9% for AGIs $100k-200k, 59374.3% for AGIs over 200k)
Taxable interest for individuals: $1,642 (reported on 25.7% of returns)
This zip code:
$1,642
Illinois:
$2,376
(% of AGI for various income ranges: 15.8% for AGIs below $25k, 20.9% for AGIs $25k-50k, 40.1% for AGIs $50k-75k, 79.3% for AGIs $75k-100k, 150.4% for AGIs $100k-200k, 1527.9% for AGIs over 200k)
Ordinary dividends: $7,479 (reported on 18.0% of returns)
Here:
$7,479
State:
$9,061
(% of AGI for various income ranges: 39.2% for AGIs below $25k, 64.1% for AGIs $25k-50k, 144.7% for AGIs $50k-75k, 254.5% for AGIs $75k-100k, 552.8% for AGIs $100k-200k, 4483.6% for AGIs over 200k)
Net capital gain/loss in AGI: +$16,143 (reported on 15.9% of returns)
Here:
+$16,143
State:
+$31,684
(% of AGI for various income ranges: 16.3% for AGIs below $25k, 46.8% for AGIs $25k-50k, 116.3% for AGIs $50k-75k, 197.4% for AGIs $75k-100k, 702.4% for AGIs $100k-200k, 18150.0% for AGIs over 200k)
Profit/loss from business: +$10,108 (reported on 15.4% of returns)
Here:
+$10,108
State:
+$12,175
(% of AGI for various income ranges: 182.7% for AGIs below $25k, 219.1% for AGIs $25k-50k, 206.9% for AGIs $50k-75k, 159.6% for AGIs $75k-100k, 248.2% for AGIs $100k-200k, 1979.3% for AGIs over 200k)
Taxable individual retirement arrangement distribution: $16,218 (reported on 7.1% of returns)
60018:
$16,218
Illinois:
$21,613
(% of AGI for various income ranges: 50.4% for AGIs below $25k, 72.9% for AGIs $25k-50k, 144.9% for AGIs $50k-75k, 258.7% for AGIs $75k-100k, 519.9% for AGIs $100k-200k, 2098.6% for AGIs over 200k)
Total itemized deductions: $32,941 (reported on 8.2% of returns)
Here:
$32,941
State:
$34,948
(% of AGI for various income ranges: 71.0% for AGIs below $25k, 147.7% for AGIs $25k-50k, 410.9% for AGIs $50k-75k, 690.5% for AGIs $75k-100k, 1181.4% for AGIs $100k-200k, 5345.7% for AGIs over 200k)
Charity contributions: $6,052 (reported on 5.6% of returns)
Here:
$6,052
State:
$13,122
(% of AGI for various income ranges: 3.0% for AGIs below $25k, 11.7% for AGIs $25k-50k, 25.8% for AGIs $50k-75k, 51.5% for AGIs $75k-100k, 147.1% for AGIs $100k-200k, 1561.4% for AGIs over 200k)
Taxes paid: $8,298 (reported on 8.1% of returns)
60018:
$8,298
State:
$8,563
(% of AGI for various income ranges: 15.0% for AGIs below $25k, 41.5% for AGIs $25k-50k, 107.5% for AGIs $50k-75k, 205.8% for AGIs $75k-100k, 310.0% for AGIs $100k-200k, 904.3% for AGIs over 200k)
Earned income credit: $2,186 (reported on 12.9% of returns)
Here:
$2,186
State:
$2,311
(% of AGI for various income ranges: 71.4% for AGIs below $25k, 57.2% for AGIs $25k-50k, 1.0% for AGIs $50k-75k)
Percentage of individuals using paid preparers for their 2020 taxes: 90.5%
Here:
90%
State:
93%
(% for various income ranges: 89.4% for AGIs below $25k, 91.3% for AGIs $25k-50k, 91.5% for AGIs $50k-75k, 92.0% for AGIs $75k-100k, 89.0% for AGIs $100k-200k, 90.0% for AGIs over 200k)
Averages for the 2012 tax year for zip code 60018, filed in 2013:
Average Adjusted Gross Income (AGI) in 2012: $62,089 (Individual Income Tax Returns)
Here:
$62,089
State:
$68,058
Salary/wage: $43,483 (reported on 82.7% of returns)
Here:
$43,483
State:
$55,396
(% of AGI for various income ranges: 75.6% for AGIs below $25k, 82.1% for AGIs $25k-50k, 78.3% for AGIs $50k-75k, 77.0% for AGIs $75k-100k, 78.0% for AGIs $100k-200k, 15.1% for AGIs over 200k)
Taxable interest for individuals: $2,167 (reported on 31.2% of returns)
This zip code:
$2,167
Illinois:
$1,969
(% of AGI for various income ranges: 1.1% for AGIs below $25k, 0.6% for AGIs $25k-50k, 0.9% for AGIs $50k-75k, 0.6% for AGIs $75k-100k, 1.0% for AGIs $100k-200k, 1.6% for AGIs over 200k)
Ordinary dividends: $5,859 (reported on 19.6% of returns)
Here:
$5,859
State:
$7,786
(% of AGI for various income ranges: 2.4% for AGIs below $25k, 1.5% for AGIs $25k-50k, 2.1% for AGIs $50k-75k, 1.7% for AGIs $75k-100k, 2.2% for AGIs $100k-200k, 1.6% for AGIs over 200k)
Net capital gain/loss in AGI: +$9,581 (reported on 14.1% of returns)
Here:
+$9,581
State:
+$22,183
(% of AGI for various income ranges: 0.3% for AGIs $25k-50k, 0.7% for AGIs $50k-75k, 1.0% for AGIs $75k-100k, 1.9% for AGIs $100k-200k, 4.8% for AGIs over 200k)
Profit/loss from business: +$9,656 (reported on 13.0% of returns)
Here:
+$9,656
State:
+$12,903
(% of AGI for various income ranges: 9.6% for AGIs below $25k, 3.6% for AGIs $25k-50k, 1.4% for AGIs $50k-75k, 1.7% for AGIs $75k-100k, 1.3% for AGIs $100k-200k, 0.1% for AGIs over 200k)
Taxable individual retirement arrangement distribution: $12,549 (reported on 9.5% of returns)
60018:
$12,549
Illinois:
$17,929
(% of AGI for various income ranges: 3.2% for AGIs below $25k, 2.1% for AGIs $25k-50k, 2.7% for AGIs $50k-75k, 2.8% for AGIs $75k-100k, 2.6% for AGIs $100k-200k, 0.5% for AGIs over 200k)
Self-employment retirement plans: $29,933 (reported on 0.2% of returns)
60018:
$29,933
Illinois:
$24,666
Total itemized deductions: $25,513 (19% of AGI, reported on 32.6% of returns)
Here:
$25,513
State:
$26,433
Here:
19.3% of AGI
State:
19.2% of AGI
(% of AGI for various income ranges: 11.8% for AGIs below $25k, 12.5% for AGIs $25k-50k, 16.0% for AGIs $50k-75k, 18.8% for AGIs $75k-100k, 17.5% for AGIs $100k-200k, 8.9% for AGIs over 200k)
Charity contributions: $3,471 (reported on 25.7% of returns)
Here:
$3,471
State:
$4,525
(% of AGI for various income ranges: 0.6% for AGIs below $25k, 0.7% for AGIs $25k-50k, 1.2% for AGIs $50k-75k, 1.3% for AGIs $75k-100k, 1.6% for AGIs $100k-200k, 2.1% for AGIs over 200k)
Taxes paid: $12,435 (reported on 32.5% of returns)
60018:
$12,435
State:
$11,968
(% of AGI for various income ranges: 3.8% for AGIs below $25k, 4.4% for AGIs $25k-50k, 6.6% for AGIs $50k-75k, 8.0% for AGIs $75k-100k, 8.2% for AGIs $100k-200k, 6.6% for AGIs over 200k)
Earned income credit: $2,136 (reported on 15.1% of returns)
Here:
$2,136
State:
$2,349
(% of AGI for various income ranges: 4.5% for AGIs below $25k, 0.9% for AGIs $25k-50k)
Percentage of individuals using paid preparers for their 2012 taxes: 67.1%
Here:
67%
State:
57%
(% for various income ranges: 66.3% for AGIs below $25k, 68.7% for AGIs $25k-50k, 66.3% for AGIs $50k-75k, 66.9% for AGIs $75k-100k, 65.9% for AGIs $100k-200k, 77.3% for AGIs over 200k)
Averages for the 2004 tax year for zip code 60018, filed in 2005:
Average Adjusted Gross Income (AGI) in 2004: $42,869 (Individual Income Tax Returns)
Here:
$42,869
State:
$54,625
Salary/wage: $39,346 (reported on 84.5% of returns)
Here:
$39,346
State:
$46,811
(% of AGI for various income ranges: 81.6% for AGIs below $10k, 76.2% for AGIs $10k-25k, 83.5% for AGIs $25k-50k, 82.4% for AGIs $50k-75k, 85.8% for AGIs $75k-100k, 64.9% for AGIs over 100k)
Taxable interest for individuals: $1,501 (reported on 48.9% of returns)
This zip code:
$1,501
Illinois:
$2,101
(% of AGI for various income ranges: 5.3% for AGIs below $10k, 2.5% for AGIs $10k-25k, 1.5% for AGIs $25k-50k, 1.5% for AGIs $50k-75k, 0.9% for AGIs $75k-100k, 1.9% for AGIs over 100k)
Taxable dividends: $2,518 (reported on 24.2% of returns)
Here:
$2,518
State:
$4,306
(% of AGI for various income ranges: 2.9% for AGIs below $10k, 1.6% for AGIs $10k-25k, 1.0% for AGIs $25k-50k, 1.2% for AGIs $50k-75k, 0.8% for AGIs $75k-100k, 2.2% for AGIs over 100k)
Net capital gain/loss: +$9,088 (reported on 17.2% of returns)
Here:
+$9,088
State:
+$17,321
(% of AGI for various income ranges: -2.1% for AGIs below $10k, 0.0% for AGIs $10k-25k, 0.2% for AGIs $25k-50k, 0.6% for AGIs $50k-75k, 1.7% for AGIs $75k-100k, 11.4% for AGIs over 100k)
Profit/loss from business: +$9,504 (reported on 12.8% of returns)
Here:
+$9,504
State:
+$11,771
(% of AGI for various income ranges: 13.7% for AGIs below $10k, 6.8% for AGIs $10k-25k, 3.2% for AGIs $25k-50k, 2.0% for AGIs $50k-75k, 1.4% for AGIs $75k-100k, 1.9% for AGIs over 100k)
IRA payment deduction: $3,174 (reported on 2.7% of returns)
60018:
$3,174
Illinois:
$3,087
(% of AGI for various income ranges: 0.2% for AGIs below $10k, 0.3% for AGIs $10k-25k, 0.3% for AGIs $25k-50k, 0.2% for AGIs $50k-75k, 0.2% for AGIs $75k-100k, 0.1% for AGIs over 100k)
Self-employed pension: $10,413 (reported on 0.3% of returns)
Here:
$10,413
Illinois:
$16,965
Total itemized deductions: $17,546 (24% of AGI, reported on 35.0% of returns)
Here:
$17,546
State:
$20,239
Here:
23.8% of AGI
State:
19.5% of AGI
(% of AGI for various income ranges: 15.1% for AGIs below $10k, 12.5% for AGIs $10k-25k, 14.1% for AGIs $25k-50k, 17.1% for AGIs $50k-75k, 15.9% for AGIs $75k-100k, 12.1% for AGIs over 100k)
Charity contributions deductions: $2,067 (3% of AGI, reported on 31.1% of returns)
Here:
$2,067
State:
$3,719
Here:
2.7% of AGI
State:
3.4% of AGI
(% of AGI for various income ranges: 0.7% for AGIs below $10k, 0.8% for AGIs $10k-25k, 1.2% for AGIs $25k-50k, 1.8% for AGIs $50k-75k, 1.7% for AGIs $75k-100k, 1.7% for AGIs over 100k)
Total tax: $6,055 (reported on 72.8% of returns)
60018:
$6,055
State:
$9,882
(% of AGI for various income ranges: 3.4% for AGIs below $10k, 3.9% for AGIs $10k-25k, 6.4% for AGIs $25k-50k, 8.4% for AGIs $50k-75k, 10.1% for AGIs $75k-100k, 17.6% for AGIs over 100k)
Earned income credit: $1,568 (reported on 12.6% of returns)
Here:
$1,568
State:
$1,788
Percentage of individuals using paid preparers for their 2004 taxes: 64.4%
Here:
64%
State:
61%
(% for various income ranges: 58.1% for AGIs below $10k, 67.2% for AGIs $10k-25k, 65.9% for AGIs $25k-50k, 65.6% for AGIs $50k-75k, 61.4% for AGIs $75k-100k, 67.0% for AGIs over 100k)
Likely homosexual households (counted as self-reported same-sex unmarried-partner households)
Lesbian couples: 0.0% of all households
Gay men: 0.1% of all households
Household received Food Stamps/SNAP in the past 12 months: 1,272 Household did not receive Food Stamps/SNAP in the past 12 months: 8,601
Women who had a birth in the past 12 months: 277 (160 now married, 117 unmarried) Women who did not have a birth in the past 12 months: 5,736 (2,551 now married, 3,174 unmarried)
Housing units in zip code 60018 with a mortgage: 4,019 (262 second mortgage, 20 home equity loan, 226 both second mortgage and home equity loan) Houses without a mortgage: 108
Median monthly owner costs for units with a mortgage: $1,893 Median monthly owner costs for units without a mortgage: $855
Residents with income below the poverty level in 2022:
This zip code:
11.2%
Whole state:
11.9%
Residents with income below 50% of the poverty level in 2022:
This zip code:
4.8%
Whole state:
5.7%
Median number of rooms in houses and condos:
Here:
5.9
State:
6.4
Median number of rooms in apartments:
Here:
3.9
State:
4.1
Notable locations in this zip code not listed on our city pages
Notable locations in zip code 60018: Lake Park Golf Course (A), James C Kirie Water Reclamation Plant (B), Rosemont Village Hall (C), Rosemont Convention Center (D), Rosemont Fire Department (E), Chicago Fire Department District 3 Station 10 O'Hare Field Rescue Station 3 (F), Chicago Fire Department District 3 Station 9 O'Hare Field Rescue Station 2 (G), Chicago Fire Department District 3 Station 6 O'Hare Field Rescue Station 1 (H), Rosemont Fire Department Station 2 (I), Des Plaines Fire Department Station 2 (J). Display/hide their locations on the map
Churches in zip code 60018 include: Taiwan Christian Church (A), Trinity Lutheran Church (B), Des Plaines Church of Christ (C), First Christian Reformed Church (D), First Presbyterian Church (E), Immanuel Community Church (F), King James Bible Church (G), Our Lady of Hope Catholic Church (H), Saint Stephens Catholic Church (I). Display/hide their locations on the map
Lakes and reservoirs: Shagbark Lake (A), Axehead Lake (B), Des Plaines Lake (C), Lake Opeka (D), Peterson Lake (E), Lake O'Hare (F). Display/hide their locations on the map
Parks in zip code 60018 include: Lake Park (1), Majewski Metro Park (2), Kiwanis Park (3), Jaycee Park (4), Cherokee Park (5), South Park (6), Eton Park (7), Friendship Park (8), Field Park (9). Display/hide their locations on the map
3,521 married couples with children.
1,816 single-parent households (645 men, 1,171 women).
40.7% of residents of 60018 zip code speak English at home.
34.6% of residents speak Spanish at home (54% very well, 21% well, 16% not well, 9% not at all).
20.0% of residents speak other Indo-European language at home (55% very well, 31% well, 12% not well, 2% not at all).
4.0% of residents speak Asian or Pacific Island language at home (67% very well, 23% well, 8% not well, 2% not at all).
1.8% of residents speak other language at home (58% very well, 31% well, 11% not well, 1% not at all).
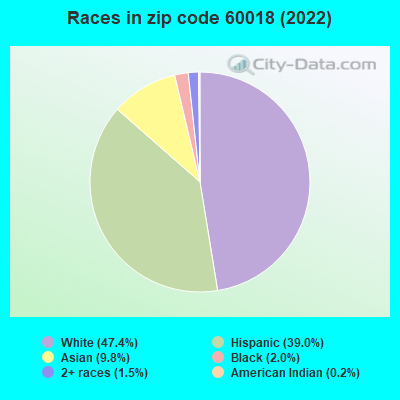
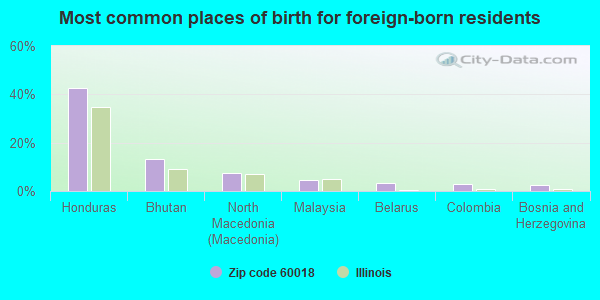
Foreign born population: 11,213 (39.5%) (52.9% of them are naturalized citizens)
This zip code:
39.5%
Whole state:
14.4%
43%Honduras
13%Bhutan
7%North Macedonia (Macedonia)
4%Malaysia
3%Belarus
3%Colombia
2%Bosnia and Herzegovina
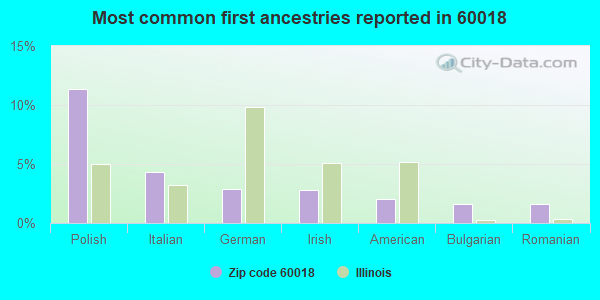
11%Polish
4%Italian
3%German
3%Irish
2%American
2%Bulgarian
2%Romanian
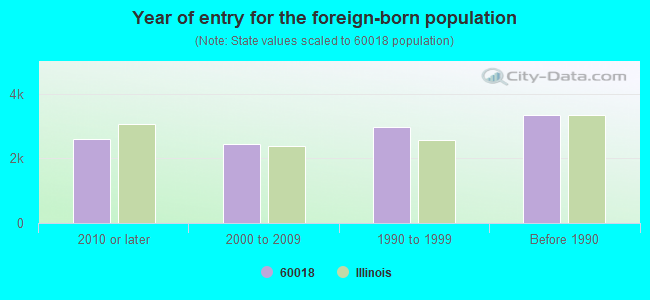
Year of entry for the foreign-born population
2,5982010 or later
2,4572000 to 2009
2,9811990 to 1999
3,342Before 1990
Major facilities with environmental interests located in this zip code:
AKZO NOBEL NON-STICK COATINGS LLC (521 SANTA ROSA DRIVE in DES PLAINES, IL)
STATE MASTER (Illinois EPA Project) - AIR PROGRAM STATE MASTER (Illinois EPA Project) - HAZARDOUS WASTE PROGRAM, AIR PROGRAM, SOLID WASTE PROGRAM STATE MASTER (Illinois EPA Project) - National Pollutant Discharge Elimination System Permit AIR MINOR (AIRS/AFS) (Integrated Compliance Information System) - ICIS-05-2000-0358, FORMAL ENFORCEMENT ACTION CRITERIA AND HAZARDOUS AIR POLLUTANT INVENTORY (Inventory of air pollution sources) National Pollutant Discharge Elimination System NON-MAJOR (Tracking pollutant discharge elimination systems) - permit National Pollutant Discharge Elimination System NON-MAJOR (Tracking pollutant discharge elimination systems) - permit HAZARDOUS WASTE BIENNIAL REPORTER (Resource Conservation and Recovery Act (tracking hazardous waste)) Large Quantity Generators, more that 1000 kg of hazardous waste/month (Resource Conservation and Recovery Act (tracking hazardous waste)) - notification TRI REPORTER (Tracking of toxic chemicals releasing facilities) Business SIC classification: FLAVORING EXTRACTS AND FLAVORING SYRUPS; PAINTS, VARNISHES, LACQUERS, ENAMELS, AND ALLIED PRODUCTS Business NAICS classification: PAINT AND COATING MANUFACTURING. Organizations: INGREDIENT TECHNOLOGY CORP. (CONTACT/OWNER)
Alternative names: AKZO NOBEL NON STICK COATING, AKZO NOBEL NON STICK COATINGS L.L.C., AKZO NOBEL NON STICK CTG-DESPL, COATINGS AND CHEMICALS CORP, INGREDIENT TECHNOLOGY CORP.
KESTER SOLDER (515 EAST TOUHY AVENUE in DES PLAINES, IL)
STATE MASTER (Illinois EPA Project) - HAZARDOUS WASTE PROGRAM, AIR PROGRAM, SOLID WASTE PROGRAM STATE MASTER (Illinois EPA Project) - National Pollutant Discharge Elimination System Permit AIR SYNTHETIC MINOR (AIRS/AFS) (Integrated Compliance Information System) - ICIS-05-1992-0214, FORMAL ENFORCEMENT ACTION COMPLIANCE ACTIVITY (Tracking inspections of insecticide, fungicide, and rodenticide, and toxic substances) CRITERIA AND HAZARDOUS AIR POLLUTANT INVENTORY (Inventory of air pollution sources) National Pollutant Discharge Elimination System NON-MAJOR (Tracking pollutant discharge elimination systems) - permit HAZARDOUS WASTE BIENNIAL REPORTER (Resource Conservation and Recovery Act (tracking hazardous waste)) - ICIS-, ENFORCEMENT/COMPLIANCE ACTIVITY Large Quantity Generators, more that 1000 kg of hazardous waste/month (Resource Conservation and Recovery Act (tracking hazardous waste)) - notification - ICIS-, ENFORCEMENT/COMPLIANCE ACTIVITY TRI REPORTER (Tracking of toxic chemicals releasing facilities) Business SIC classification: ROLLING, DRAWING, AND EXTRUDING OF NONFERROUS METALS, EXCEPT COPPER AND ALUMINUM Business NAICS classification: NONFERROUS METAL (EXCEPT COPPER AND ALUMINUM) ROLLING, DRAWING, AND EXTRUDING. Organizations: LITTON/KESTER SOLDER (CONTACT/OPERATOR)
, LITTON KESTER SOLDER (CONTACT/OWNER)
Alternative names: KAC HOLDINGS INC (DBA KESTER), KAC HOLDINGS INC-DES PLAINES, LITTON KESTER SOLDER, LITTON SYSTEMS INC, LITTON SYSTEMS INC KESTER SOLDER DIV
MIDWEST/GENDEX DENTAL- (901 WEST OAKTON STREET in DES PLAINES, IL)
STATE MASTER (Illinois EPA Project) - AIR PROGRAM, HAZARDOUS WASTE PROGRAM, SOLID WASTE PROGRAM STATE MASTER (Illinois EPA Project) - AIR PROGRAM AIR MINOR (AIRS/AFS) CRITERIA AND HAZARDOUS AIR POLLUTANT INVENTORY (Inventory of air pollution sources) HAZARDOUS WASTE BIENNIAL REPORTER (Resource Conservation and Recovery Act (tracking hazardous waste)) Large Quantity Generators, more that 1000 kg of hazardous waste/month (Resource Conservation and Recovery Act (tracking hazardous waste)) - notification Conditionally Exempt Small Quantity Generators, less than 100 kg/month of hazardous waste (Resource Conservation and Recovery Act (tracking hazardous waste)) TRI REPORTER (Tracking of toxic chemicals releasing facilities) Business SIC classification: DENTAL EQUIPMENT AND SUPPLIES; X-RAY APPARATUS AND TUBES AND RELATED IRRADIATION APPARATUS Business NAICS classification: DENTAL EQUIPMENT AND SUPPLIES MANUFACTURING.; DENTAL EQUIPMENT AND SUPPLIES MANUFACTURING. Organizations: GENDEX CORP (CONTACT/OPERATOR)
Alternative names: DENTSPLY, DENTSPLY PROFESSIONAL, GENDEX CORP, MIDWEST DENTAL PRODS. CORP., MIDWEST GENDEX DENTAL DIVISION, MIDWEST/GENDEX DENTAL-DIV. OF, MIDWEST GENDEX DENTAL DIVS
CHICAGO FAUCET CO (2100 SOUTH CLEARWATER DRIVE in DES PLAINES, IL)
STATE MASTER (Illinois EPA Project) - HAZARDOUS WASTE PROGRAM, AIR PROGRAM, SOLID WASTE PROGRAM AIR MINOR (AIRS/AFS) CRITERIA AND HAZARDOUS AIR POLLUTANT INVENTORY (Inventory of air pollution sources) HAZARDOUS WASTE BIENNIAL REPORTER (Resource Conservation and Recovery Act (tracking hazardous waste)) - ICIS-05-2004-9509, FORMAL ENFORCEMENT ACTION, ICIS-, ENFORCEMENT/COMPLIANCE ACTIVITY Large Quantity Generators, more that 1000 kg of hazardous waste/month (Resource Conservation and Recovery Act (tracking hazardous waste)) - notification - ICIS-05-2004-9509, FORMAL ENFORCEMENT ACTION, ICIS-, ENFORCEMENT/COMPLIANCE ACTIVITY TRI REPORTER (Tracking of toxic chemicals releasing facilities) Business SIC classification: PLUMBING FIXTURE FITTINGS AND TRIM Business NAICS classification: ELECTROPLATING, PLATING, POLISHING, ANODIZING, AND COLORING.
PRECISION INSTRUMENTS INC (1846 MINER ST in DES PLAINES, IL)
STATE MASTER (Illinois EPA Project) - HAZARDOUS WASTE PROGRAM, AIR PROGRAM, SOLID WASTE PROGRAM STATE MASTER (Illinois EPA Project) - National Pollutant Discharge Elimination System Permit AIR MINOR (AIRS/AFS) CRITERIA AND HAZARDOUS AIR POLLUTANT INVENTORY (Inventory of air pollution sources) National Pollutant Discharge Elimination System NON-MAJOR (Tracking pollutant discharge elimination systems) - permit HAZARDOUS WASTE BIENNIAL REPORTER (Resource Conservation and Recovery Act (tracking hazardous waste)) Large Quantity Generators, more that 1000 kg of hazardous waste/month (Resource Conservation and Recovery Act (tracking hazardous waste)) TRI REPORTER (Tracking of toxic chemicals releasing facilities) Business SIC classification: TOTALIZING FLUID METERS AND COUNTING DEVICES Business NAICS classification: MACHINE TOOL (METAL CUTTING TYPES) MANUFACTURING.; TOTALIZING FLUID METER AND COUNTING DEVICE MANUFACTURING. Alternative names: PRECISION INSTRUMENT INC.
CIBA VISION CORPORATION (333 EAST HOWARD AVENUE in DES PLAINES, IL)
STATE MASTER (Illinois EPA Project) - SOLID WASTE PROGRAM, HAZARDOUS WASTE PROGRAM, AIR PROGRAM AIR MINOR (AIRS/AFS) HAZARDOUS WASTE BIENNIAL REPORTER (Resource Conservation and Recovery Act (tracking hazardous waste)) - ICIS-, ENFORCEMENT/COMPLIANCE ACTIVITY Large Quantity Generators, more that 1000 kg of hazardous waste/month (Resource Conservation and Recovery Act (tracking hazardous waste)) - notification - ICIS-, ENFORCEMENT/COMPLIANCE ACTIVITY TRI REPORTER (Tracking of toxic chemicals releasing facilities) Business SIC and NAICS classification: OPHTHALMIC GOODS Alternative names: WESLEY JESSEN CORPORATION
NTN BEARING (31 E OAKTON ST in DES PLAINES, IL)
STATE MASTER (Illinois EPA Project) - HAZARDOUS WASTE PROGRAM, AIR PROGRAM, SOLID WASTE PROGRAM AIR MINOR (AIRS/AFS) CRITERIA AND HAZARDOUS AIR POLLUTANT INVENTORY (Inventory of air pollution sources) Conditionally Exempt Small Quantity Generators, less than 100 kg/month of hazardous waste (Resource Conservation and Recovery Act (tracking hazardous waste)) - ICIS-, ENFORCEMENT/COMPLIANCE ACTIVITY HAZARDOUS WASTE BIENNIAL REPORTER (Resource Conservation and Recovery Act (tracking hazardous waste)) - ICIS-, ENFORCEMENT/COMPLIANCE ACTIVITY Business SIC classification: GENERAL WAREHOUSING AND STORAGE Business NAICS classification: BALL AND ROLLER BEARING MANUFACTURING. Organizations: NTN BEARING CORP (CONTACT/OPERATOR)
CHICAGO FAUCET CO (350 HOWARD AVENUE in DES PLAINES, IL)
STATE MASTER (Illinois EPA Project) - SOLID WASTE PROGRAM, HAZARDOUS WASTE PROGRAM HAZARDOUS WASTE BIENNIAL REPORTER (Resource Conservation and Recovery Act (tracking hazardous waste)) - ICIS-, ENFORCEMENT/COMPLIANCE ACTIVITY (Resource Conservation and Recovery Act (tracking hazardous waste)) - ICIS-, ENFORCEMENT/COMPLIANCE ACTIVITY TRI REPORTER (Tracking of toxic chemicals releasing facilities) Business SIC classification: PLUMBING FIXTURE FITTINGS AND TRIM Business NAICS classification: OTHER METAL VALVE AND PIPE FITTING MANUFACTURING. Alternative names: CHICAGO FAUCETS CO
CREATIVE PRINTING SERVICE INC (1701 BIRCHWOOD AVE in DES PLAINES, IL)
STATE MASTER (Illinois EPA Project) - HAZARDOUS WASTE PROGRAM, AIR PROGRAM, SOLID WASTE PROGRAM AIR MINOR (AIRS/AFS) CRITERIA AND HAZARDOUS AIR POLLUTANT INVENTORY (Inventory of air pollution sources) National Pollutant Discharge Elimination System NON-MAJOR (Tracking pollutant discharge elimination systems) - permit National Pollutant Discharge Elimination System NON-MAJOR (Tracking pollutant discharge elimination systems) - permit HAZARDOUS WASTE BIENNIAL REPORTER (Resource Conservation and Recovery Act (tracking hazardous waste)) Small Quantity Generators, between 100 kg and 1000 kg of hazardous waste/month (Resource Conservation and Recovery Act (tracking hazardous waste)) - notification Business SIC classification: COMMERCIAL PRINTING Organizations: CREATIVE PRINTING SERVICE, INC (CONTACT/OWNER)
, CHESNEY JOHN (CONTACT/OWNER)
SANDOZ AGRO, INC. (1300 E TOUHY AVE in DES PLAINES, IL)
AIR MINOR (AIRS/AFS) COMPLIANCE ACTIVITY (Tracking inspections of insecticide, fungicide, and rodenticide, and toxic substances) HAZARDOUS WASTE BIENNIAL REPORTER (Resource Conservation and Recovery Act (tracking hazardous waste)) Small Quantity Generators, between 100 kg and 1000 kg of hazardous waste/month (Resource Conservation and Recovery Act (tracking hazardous waste)) Business SIC classification: NONCLASSIFIABLE ESTABLISHMENTS Organizations: ABBOTT MOLECULAR DIAGNOSTICS (CONTACT/OPERATOR)
Alternative names: SANDOZ CORP, PROTECTION DIV, SANDOZ/AGLAND COOP, SANDOZ AGRI INC, SANDOZ AGRO NORTH AMERICA INC, SANDOZ CROP PRODUCTION CORP, SANDOZ CROP PROTECTION CORP
INTERNATIONAL PAPER CO (100 E OAKTON ST in DES PLAINES, IL)
STATE MASTER (Illinois EPA Project) - HAZARDOUS WASTE PROGRAM, AIR PROGRAM, SOLID WASTE PROGRAM STATE MASTER (Illinois EPA Project) - National Pollutant Discharge Elimination System Permit AIR SYNTHETIC MINOR (AIRS/AFS) CRITERIA AND HAZARDOUS AIR POLLUTANT INVENTORY (Inventory of air pollution sources) National Pollutant Discharge Elimination System NON-MAJOR (Tracking pollutant discharge elimination systems) - permit Small Quantity Generators, between 100 kg and 1000 kg of hazardous waste/month (Resource Conservation and Recovery Act (tracking hazardous waste)) - notification TRI REPORTER (Tracking of toxic chemicals releasing facilities) Business SIC classification: CORRUGATED AND SOLID FIBER BOXES Business NAICS classification: CORRUGATED AND SOLID FIBER BOX MANUFACTURING.; CORRUGATED AND SOLID FIBER BOX MANUFACTURING. Organizations: UNION CAMP CORP (CONTACT/OPERATOR)
, PAION CAMP CORP. (CONTACT/OWNER)
Alternative names: UNION CAMP CORP
ARTHUR J ROGERS TRUCK TERMINAL (160 OLD HIGGINS ROAD in DES PLAINES, IL)
STATE MASTER (Illinois EPA Project) - AIR PROGRAM, SOLID WASTE PROGRAM STATE MASTER (Illinois EPA Project) - National Pollutant Discharge Elimination System Permit AIR MINOR (AIRS/AFS) Business SIC classification: NONCLASSIFIABLE ESTABLISHMENTS
ALCAN PACKAGING, INC (1731 SOUTH MOUNT PROSPECT ROAD in DES PLAINES, IL)
STATE MASTER (Illinois EPA Project) - HAZARDOUS WASTE PROGRAM, AIR PROGRAM, SOLID WASTE PROGRAM STATE MASTER (Illinois EPA Project) - National Pollutant Discharge Elimination System Permit AIR MINOR (AIRS/AFS) CRITERIA AND HAZARDOUS AIR POLLUTANT INVENTORY (Inventory of air pollution sources) National Pollutant Discharge Elimination System NON-MAJOR (Tracking pollutant discharge elimination systems) - permit Conditionally Exempt Small Quantity Generators, less than 100 kg/month of hazardous waste (Resource Conservation and Recovery Act (tracking hazardous waste)) - notification Business SIC classification: PLASTICS BOTTLES; GLASS CONTAINERS Organizations: WHEATON INC (CONTACT/OWNER)
Alternative names: ALCAN PACKAGING-DESPLAINES, LAWSON MARDON WHEATON INC, WHEATON PLASTICS COMPANY
Housing units lacking complete plumbing facilities: 0.3% Housing units lacking complete kitchen facilities: 2.1%
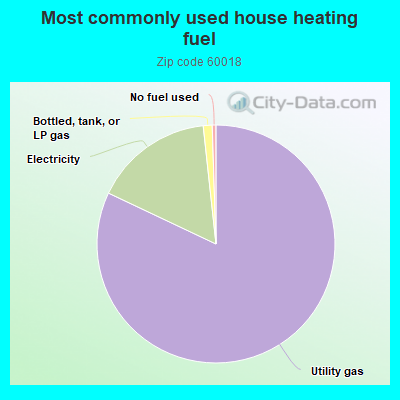
81.8%Utility gas
16.2%Electricity
1.2%Bottled, tank, or LP gas
0.5%No fuel used
Population in 1990: 28,884. Population change in the 1990s: +1,066 (+3.7%).
Place of birth for U.S.-born residents:
This state: 15,464
Northeast: 217
Midwest: 662
South: 453
West: 280
65% of the 60018 zip code residents lived in the same house 5 years ago. Out of people who lived in different houses, 86% lived in this county. Out of people who lived in different counties, 50% lived in Illinois.
92% of the 60018 zip code residents lived in the same house 1 year ago. Out of people who lived in different houses, 77% moved from this county. Out of people who lived in different houses, 10% moved from different county within same state. Out of people who lived in different houses, 5% moved from different state. Out of people who lived in different houses, 5% moved from abroad.
Private vs. public school enrollment:
Students in private schools in grades 1 to 8 (elementary and middle school): 128
Here:
5.1%
Illinois:
13.3%
Students in private schools in grades 9 to 12 (high school): 138
Here:
7.4%
Illinois:
9.9%
Students in private undergraduate colleges: 291
Here:
22.3%
Illinois:
27.4%
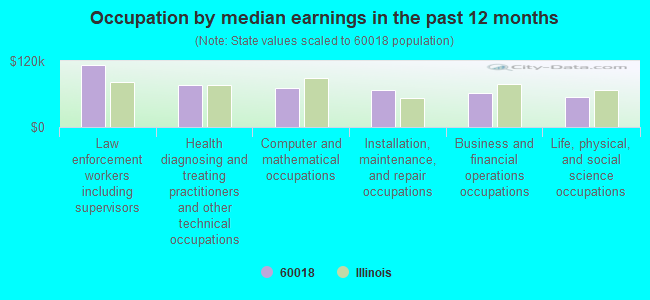
Occupation by median earnings in the past 12 months ($)
112,229Law enforcement workers including supervisors
75,765Health diagnosing and treating practitioners and other technical occupations
71,493Computer and mathematical occupations
67,082Installation, maintenance, and repair occupations
61,473Business and financial operations occupations
54,981Life, physical, and social science occupations
Companies with biggest federal contracts located in this zip code:
BAYER CORPORATION (2150 FRONTAGE RD in DES PLAINES, IL) : $4,497,009 in 18 contractsfrom 1999 to 2000
Contracts for Medical and Surgical Instruments, Equipment, and Supplies, Drugs and Biologicals, ADP Support Equipment, Photographic Supplies by Defense Logistics Agency, Department of Veterans Affairs Signed by year:2000: $4,028,431; 2001: $0; 2002: $0; 2003: $0; 2004: $0; 2005: $0; 2006: $0.
Biggest contracts:
$808,001 with Defense Logistics Agency for Medical and Surgical Instruments, Equipment, and Supplies. Signed on 2000-05-27. Completion date: 2001-01-21.
$597,002, same as above.Signed on 2000-06-07. Completion date: 2001-02-01.
$434,041, same as above.Signed on 2000-02-23. Completion date: 2000-03-23.
$400,000, same as above.Signed on 2000-07-28. Completion date: 2001-03-24.
INFORMATION DATA MANAGEMENT IN (9701 W HIGGINS RD # 500 in DES PLAINES, IL; small business) : $856,941 in 9 contractsfrom 2004 to 2006
Contracts for ADP Software, Equipment, and Telecommunications Training, ADP Software, Invalid code: AN97, Maintenance, Repair and Rebuilding of Equipment -- Miscellaneous, and moreby Army, Office of Policy, Management and Budget/Chief Financial Officer, Air Force Signed by year:2000: $0; 2001: $0; 2002: $0; 2003: $0; 2004: $581,195; 2005: $217,836; 2006: $57,910.
Biggest contracts:
$432,000 with Army for ADP Software, Equipment, and Telecommunications Training. Taking place in VA. Signed on 2004-09-30. Completion date: 2005-09-29.
$171,836 with Office of Policy, Management and Budget/Chief Financial Officer for ADP Software. Signed on 2005-10-31. Completion date: 2006-01-31.
$149,195 with Air Force for Invalid code: AN97. Taking place in TX. Signed on 2004-10-15. Completion date: 2004-11-01.
$36,000 with Army for Maintenance, Repair and Rebuilding of Equipment -- Miscellaneous. Taking place in HI. Signed on 2005-10-28. Completion date: 2006-11-18.
RAMADA PLAZA HOTEL OHARE (6600 NORTH MANNHEIM ROAD in ROSEMONT, IL) : $650,740 in 8 contractsfrom 2000 to 2001
Contracts for Lodging - Hotel/Motel by Navy Signed by year:2000: $530,955; 2001: $119,785; 2002: $0; 2003: $0; 2004: $0; 2005: $0; 2006: $0.
Biggest contracts:
$220,590 with Navy for Lodging - Hotel/Motel. Signed on 2000-08-25. Completion date: 2000-09-07.
$176,344, same as above.Signed on 2000-07-31. Completion date: 2000-08-02.
$90,929, same as above.Signed on 2001-07-19. Completion date: 2001-08-03.
$53,224, same as above.Signed on 2000-07-14. Completion date: 2000-08-02.
ABBOTT MOLECULAR DIAGNOSTIC (1300 E TOUHY AVE in DES PLAINES, IL; small business)
$453,365 with Army for Medical and Surgical Instruments, Equipment, and Supplies. Taking place in DC. Signed on 2005-09-22. Completion date: 2005-09-30.
SCOTT LEASING COMPANY INC (5290 PEARL ST in DES PLAINES, IL; small business) : $365,612 in 18 contractsfrom 2002 to 2006
Contracts for Industrial Sewing Machines and Mobile Textile Repair Shops, Other Administrative Support Services, Textile Industries Machinery, Miscellaneous Maintenance and Repair Shop Specialized Equipment, and moreby Defense Logistics Agency, Army, Bureau of Prisoners/Federal Prison System Signed by year:2000: $0; 2001: $0; 2002: $24,183; 2003: $25,332; 2004: $103,238; 2005: $65,385; 2006: $147,474.
Biggest contracts:
$68,480 with Defense Logistics Agency for Industrial Sewing Machines and Mobile Textile Repair Shops. Signed on 2004-10-14. Completion date: 2005-05-09.
$65,310, same as above.Signed on 2006-02-02. Completion date: 2006-04-03.
$61,460, same as above.Signed on 2006-01-13. Completion date: 2006-05-13.
$32,758 with Army for Industrial Sewing Machines and Mobile Textile Repair Shops. Signed on 2004-09-28. Completion date: 2004-11-23.
ILLINOIS AUTO TRUCK COMPANY IN (1669 MARSHALL DRIVE in DES PLAINES, IL; small business) : $196,855 in 4 contractsfrom 2000 to 2001
$59,740 with Defense Logistics Agency for Vehicular Power Transmission Components. Signed on 2000-03-30. Completion date: 2000-10-26.
$52,503, same as above.Signed on 2001-01-09. Completion date: 2001-08-07.
$52,330, same as above.Signed on 2001-07-27. Completion date: 2002-01-23.
$32,282, same as above.Signed on 2000-03-14. Completion date: 2000-10-10.
ROOFING INDUSTRY EDUCTL INST (10255 W HIGGINS ROAD in ROSEMONT, IL) : $133,570 in 6 contractsfrom 2001 to 2005
Contracts for Education Services, Other Professional Services, Other Education and Training Services, Educational Services by Navy Signed by year:2000: $0; 2001: $29,000; 2002: $51,680; 2003: $20,410; 2004: $0; 2005: $32,480; 2006: $0.
Biggest contracts:
$32,480 with Navy for Education Services. Signed on 2005-09-07. Completion date: 2005-11-15.
$29,000 with Navy for Other Professional Services. Taking place in CA. Signed on 2001-09-28. Completion date: 2001-10-15.
$20,410 with Navy for Other Education and Training Services. Taking place in CA. Signed on 2003-09-30. Completion date: 2003-10-25.
$18,000, same as above.Signed on 2002-07-01. Completion date: 2002-08-23.
MAXIMA-J E P, INC (200 HOWARD AVE STE 250 in DES PLAINES, IL; small business)
$74,240 with Defense Logistics Agency for Liquid and Gas Flow, Liquid Level, and Mechanical Motion Measuring Instruments. Signed on 2000-05-02. Completion date: 2000-07-31.
SPECTRAGEN, INC. (1700 SOUTH MOUNT PROSPECT in DES PLAINES, IL; small business)
$65,957 with Army for Defense Missile and Space Systems -- Advanced Development (R&D). Signed on 2000-04-28. Completion date: 2000-10-28.
EMPOWER GEOGRAPHICS, INC (1000 EXECUTIVE WAY # 201 in DES PLAINES, IL; small business) : $58,027 in 2 contractsin 2005
$41,458 with Army for ADP Software. Signed on 2005-09-30. Completion date: 2005-10-31.
$16,569, same as above.Signed on 2005-06-30. Completion date: 2005-09-12.
Top industries in this zip code by the number of employees in 2005:
Management of Companies and Enterprises: Corporate, Subsidiary, and Regional Managing Offices (500-999: 1, 250-499: 1, 100-249: 2, 50-99: 6, 20-49: 4, 10-19: 6, 5-9: 9, 1-4: 10)
Administrative and Support and Waste Management and Remediation Services: Professional Employer Organizations (over 1000: 1, 100-249: 1, 20-49: 2, 1-4: 1)
Administrative and Support and Waste Management and Remediation Services: Temporary Help Services (100-249: 4, 50-99: 5, 20-49: 5, 10-19: 3, 5-9: 1, 1-4: 5)
2002 - 2018 National Fire Incident Reporting System (NFIRS) incidents
According to the data from the years 2002 - 2018 the average number of fire incidents per year is 89. The highest number of fire incidents - 141 took place in 2002, and the least - 38 in 2005. The data has a decreasing trend.
When looking into fire subcategories, the most incidents belonged to: Outside Fires (31.9%), and Structure Fires (29.2%).
Fire incident types reported to NFIRS in Zip Code 60018

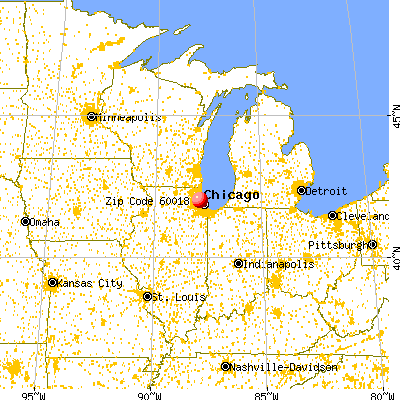


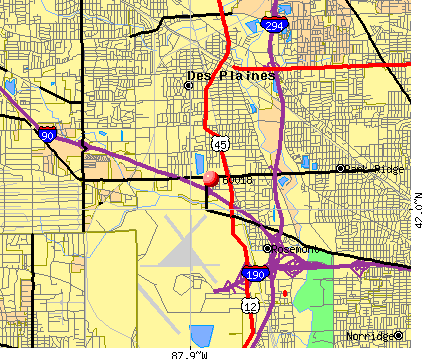 Nearest zip codes: 60106, 60176, 60131, 60164, 60191, 60016.


 According to the data from the years 2002 - 2018 the average number of fire incidents per year is 89. The highest number of fire incidents - 141 took place in 2002, and the least - 38 in 2005. The data has a decreasing trend.
 When looking into fire subcategories, the most incidents belonged to: Outside Fires (31.9%), and Structure Fires (29.2%).