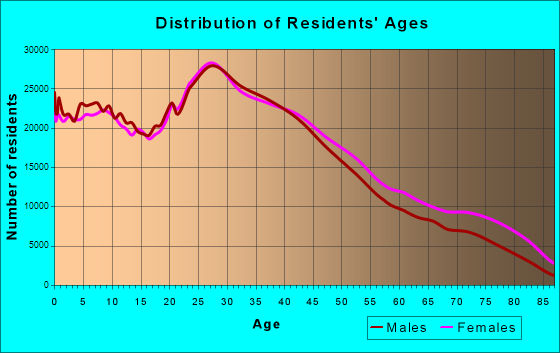
Chicago, IL (Illinois) Houses and Residents
Estimated median house or condo value in 2022: $313,300 (it was $144,300 in 2000 )
Chicago:
$313,300Illinois:
$251,600
Lower value quartile - upper value quartile: $209,000 - $479,300Mean price in 2022: Detached houses: $393,455 Here:
$393,455State:
$310,164
Townhouses or other attached units: $498,446 Here:
$498,446State:
$286,230
In 2-unit structures: $320,802 Here:
$320,802State:
$299,638
In 3-to-4-unit structures: $416,830 Here:
$416,830State:
$330,907
In 5-or-more-unit structures: $416,975 Here:
$416,975State:
$318,887
Mobile homes: $116,082 Here:
$116,082State:
$78,855
Occupied boats, RVs, vans, etc.: $140,000 Here:
$140,000State:
$171,856
Total population: 2,722,389 (All urban)
Houses: 1,262,463 (1,159,424 occupied: 530,398 owner occupied, 629,026 renter occupied )
% of renters here:
54%State:
33%
Housing density: 5,558 houses/condos per square mile
Median price asked for vacant for-sale houses and condos in 2022: $189,546.
Median contract rent in 2022: $1,161 (lower quartile is $844, upper quartile is $1,723)
Median rent asked for vacant for-rent units in 2022: $1,363
Median gross rent in Chicago, IL in 2022: $1,324
Housing units in Chicago with a mortgage: 343,027 (26,613 second mortgage, 854 home equity loan, 18,960 both second mortgage and home equity loan )Houses without a mortgage: 6,491
Median household income for houses/condos with a mortgage: $114,213
Median household income for apartments without a mortgage: $76,035
Median monthly housing costs: $1,432
Data:
Median house or condo value ($)
Median house or condo value ($ change since 2000)
Median house or condo value ($) - White
Median house or condo value ($) - Black or African American
Median house or condo value ($) - Asian
Median house or condo value ($) - Hispanic or Latino
Median house or condo value ($) - American Indian and Alaska Native
Median house or condo value ($) - Multirace
Median house or condo value ($) - Other Race
Median price asked for mobile homes ($)
Household density (households per square mile)
Mean house or condo value by units in structure - 1, detached ($)
Mean house or condo value by units in structure - 1, attached ($)
Mean house or condo value by units in structure - 2 ($)
Mean house or condo value by units in structure by units in structure - 3 or 4 ($)
Mean house or condo value by units in structure - 5 or more ($)
Mean house or condo value by units in structure - Boat, RV, van, etc. ($)
Mean house or condo value by units in structure - Mobile home ($)
Median contract rent ($)
Median contract rent - Lower quartile ($)
Median contract rent - Upper quartile ($)
Median gross rent ($)
Urban houses (%)
Rural houses (%)
Houses occupied (%)
Houses occupied (% change since 2000)
Houses owner occupied (%)
Houses owner occupied (% change since 2000)
Houses renter occupied (%)
Houses renter occupied (% change since 2000)
Vacant housing units - For rent (%)
Vacant housing units - For rent (% change since 2000)
Vacant housing units - For sale only (%)
Vacant housing units - For sale only (% change since 2000)
Vacant housing units - Rented or sold, not occupied (%)
Vacant housing units - Rented or sold, not occupied (% change since 2000)
Vacant housing units - For seasonal, recreational, or occasional use (%)
Vacant housing units - For seasonal, recreational, or occasional use (% change since 2000)
Vacant housing units - For migrant workers (%)
Vacant housing units - For migrant workers (% change since 2000)
Vacant housing units - Other vacant (%)
Vacant housing units - Other vacant (% change since 2000)
Median monthly housing costs ($)
Median household income for houses/condos with a mortgage ($)
Median household income for houses/condos without a mortgage ($)
Median household income ($)
Median household income ($) - White
Median household income ($) - Black or African American
Median household income ($) - Asian
Median household income ($) - Hispanic or Latino
Median household income ($) - American Indian and Alaska Native
Median household income ($) - Multirace
Median household income ($) - Other Race
Mortgage status - with mortgage (%)
Mortgage status - with second mortgage (%)
Mortgage status - with home equity loan (%)
Mortgage status - with both second mortgage and home equity loan (%)
Mortgage status - without a mortgage (%)
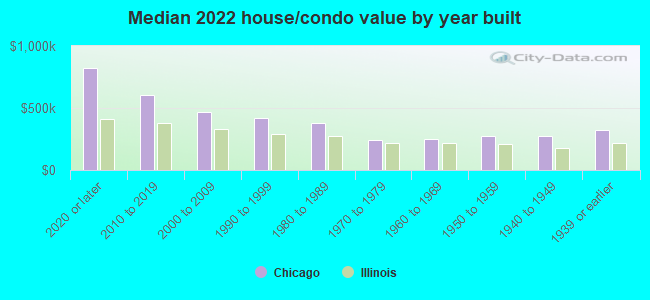
Median year house/condo built
Median year apartment built
Household type by relationship - Male householder living alone (%)
Household type by relationship - Male householder not living alone (%)
Household type by relationship - Female householder living alone (%)
Household type by relationship - Female householder not living alone (%)
Household type by relationship - Opposite-Sex spouse (%)
Household type by relationship - Same-Sex spouse (%)
Household type by relationship - Opposite-Sex unmarried partner (%)
Household type by relationship - Same-Sex unmarried partner (%)
Household type by relationship - In group quarters (%)
Size of family households - 2-person household (%)
Size of family households - 3-person household (%)
Size of family households - 4-person household (%)
Size of family households - 5-person household (%)
Size of family households - 6-person household (%)
Size of family households - 7-or-more-person household (%)
Size of nonfamily households - 1-person household (%)
Size of nonfamily households - 2-person household (%)
Size of nonfamily households - 3-person household (%)
Size of nonfamily households - 4-person household (%)
Size of nonfamily households - 5-person household (%)
Size of nonfamily households - 6-person household (%)
Size of nonfamily households - 7-or-moreperson household (%)
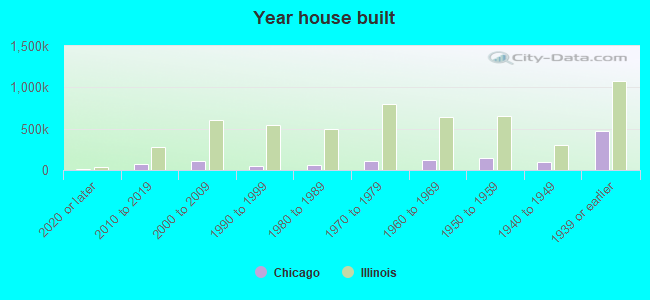
Year house built - Built 2010 or later (%)
Year house built - Built 2000 to 2009 (%)
Year house built - Built 1990 to 1999 (%)
Year house built - Built 1980 to 1989 (%)
Year house built - Built 1970 to 1979 (%)
Year house built - Built 1960 to 1969 (%)
Year house built - Built 1950 to 1959 (%)
Year house built - Built 1940 to 1949 (%)
Year house built - Built 1939 or earlier (%)
Median number of rooms in houses and condos
Median number of rooms in apartments
Median number of bedrooms in owner occupied houses
Mean number of bedrooms in owner occupied houses
Median number of bedrooms in renter occupied houses
Mean number of bedrooms in renter occupied houses
Median number of vehichles in owner occupied houses
Mean number of vehichles in owner occupied houses
Median number of vehichles in renter occupied houses
Mean number of vehichles in renter occupied houses
Rooms in owner-occupied houses - 1 room (%)
Rooms in owner-occupied houses - 2 rooms (%)
Rooms in owner-occupied houses - 3 rooms (%)
Rooms in owner-occupied houses - 4 rooms (%)
Rooms in owner-occupied houses - 5 rooms (%)
Rooms in owner-occupied houses - 6 rooms (%)
Rooms in owner-occupied houses - 7 rooms (%)
Rooms in owner-occupied houses - 8 rooms (%)
Rooms in owner-occupied houses - 9+ rooms (%)
Rooms in renter-occupied houses - 1 room (%)
Rooms in renter-occupied houses - 2 rooms (%)
Rooms in renter-occupied houses - 3 rooms (%)
Rooms in renter-occupied houses - 4 rooms (%)
Rooms in renter-occupied houses - 5 rooms (%)
Rooms in renter-occupied houses - 6 rooms (%)
Rooms in renter-occupied houses - 7 rooms (%)
Rooms in renter-occupied houses - 8 rooms (%)
Rooms in renter-occupied houses - 9+ rooms (%)
Bedrooms in owner-occupied houses - no bedrooms (%)
Bedrooms in owner-occupied houses - 1 bedroom (%)
Bedrooms in owner-occupied houses - 2 bedrooms (%)
Bedrooms in owner-occupied houses - 3 bedrooms (%)
Bedrooms in owner-occupied houses - 4 bedrooms (%)
Bedrooms in owner-occupied houses - 5+ bedrooms (%)
Bedrooms in renter-occupied houses - no bedrooms (%)
Bedrooms in renter-occupied houses - 1 bedroom (%)
Bedrooms in renter-occupied houses - 2 bedrooms (%)
Bedrooms in renter-occupied houses - 3 bedrooms (%)
Bedrooms in renter-occupied houses - 4 bedrooms (%)
Bedrooms in renter-occupied houses - 5+ bedrooms (%)
Vehicles available in owner-occupied houses - no vehicle available (%)
Vehicles available in owner-occupied houses - 1 vehicle available(%)
Vehicles available in owner-occupied houses - 2 Vehicles available (%)
Vehicles available in owner-occupied houses - 3 Vehicles available (%)
Vehicles available in owner-occupied houses - 4 Vehicles available (%)
Vehicles available in owner-occupied houses - 5+ Vehicles available (%)
Vehicles available in renter-occupied houses - no vehicle available (%)
Vehicles available in renter-occupied houses - 1 vehicle available (%)
Vehicles available in renter-occupied houses - 2 Vehicles available (%)
Vehicles available in renter-occupied houses - 3 Vehicles available (%)
Vehicles available in renter-occupied houses - 4 Vehicles available (%)
Vehicles available in renter-occupied houses - 5+ Vehicles available (%)
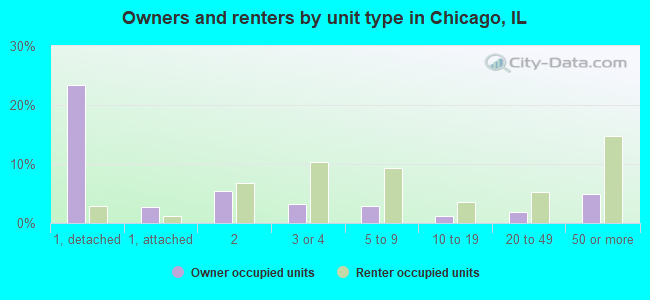
Housing units in structures - 1, detached (%)
Housing units in structures - 1, attached (%)
Housing units in structures - 2 (%)
Housing units in structures - 3 or 4 (%)
Housing units in structures - 5 to 9 (%)
Housing units in structures - 10 to 19 (%)
Housing units in structures - 20 to 49 (%)
Housing units in structures - 50 or more (%)
Housing units in structures - Mobile home (%)
Housing units in structures - Boat, RV, van, etc. (%)
Housing units in structures - Owners - 1, detached (%)
Housing units in structures - Owners - 1, attached (%)
Housing units in structures - Owners - 2 (%)
Housing units in structures - Owners - 3 or 4 (%)
Housing units in structures - Owners - 5 to 9 (%)
Housing units in structures - Owners - 10 to 19 (%)
Housing units in structures - Owners - 20 to 49 (%)
Housing units in structures - Owners - 50 or more (%)
Housing units in structures - Owners - Mobile home (%)
Housing units in structures - Owners - Boat, RV, van, etc. (%)
Housing units in structures - Renters - 1, detached (%)
Housing units in structures - Renters - 1, attached (%)
Housing units in structures - Renters - 2 (%)
Housing units in structures - Renters - 3 or 4 (%)
Housing units in structures - Renters - 5 to 9 (%)
Housing units in structures - Renters - 10 to 19 (%)
Housing units in structures - Renters - 20 to 49 (%)
Housing units in structures - Renters - 50 or more (%)
Housing units in structures - Renters - Mobile home (%)
Housing units in structures - Renters - Boat, RV, van, etc. (%)
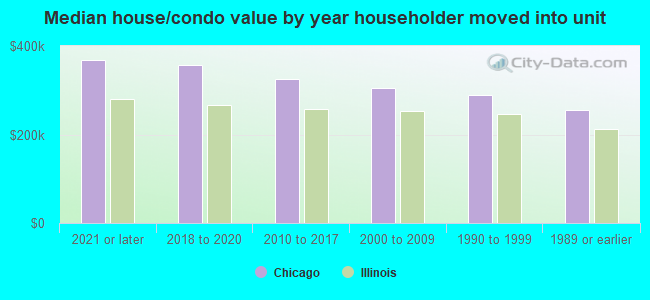
House/condo owner moved in on average (years ago)
Renter moved in on average (years ago)
Year householder moved into unit - Moved in 1999 to March 2000 (%)
Year householder moved into unit - Moved in 1999 to March 2000 (%) - White
Year householder moved into unit - Moved in 1999 to March 2000 (%) - Black or African American
Year householder moved into unit - Moved in 1999 to March 2000 (%) - Asian
Year householder moved into unit - Moved in 1999 to March 2000 (%) - Hispanic or Latino
Year householder moved into unit - Moved in 1999 to March 2000 (%) - American Indian and Alaska Native
Year householder moved into unit - Moved in 1999 to March 2000 (%) - Multirace
Year householder moved into unit - Moved in 1999 to March 2000 (%) - Other Race
Year householder moved into unit - Moved in 1995 to 1998 (%)
Year householder moved into unit - Moved in 1995 to 1998 (%) - White
Year householder moved into unit - Moved in 1995 to 1998 (%) - Black or African American
Year householder moved into unit - Moved in 1995 to 1998 (%) - Asian
Year householder moved into unit - Moved in 1995 to 1998 (%) - Hispanic or Latino
Year householder moved into unit - Moved in 1995 to 1998 (%) - American Indian and Alaska Native
Year householder moved into unit - Moved in 1995 to 1998 (%) - Multirace
Year householder moved into unit - Moved in 1995 to 1998 (%) - Other Race
Year householder moved into unit - Moved in 1990 to 1994 (%)
Year householder moved into unit - Moved in 1990 to 1994 (%) - White
Year householder moved into unit - Moved in 1990 to 1994 (%) - Black or African American
Year householder moved into unit - Moved in 1990 to 1994 (%) - Asian
Year householder moved into unit - Moved in 1990 to 1994 (%) - Hispanic or Latino
Year householder moved into unit - Moved in 1990 to 1994 (%) - American Indian and Alaska Native
Year householder moved into unit - Moved in 1990 to 1994 (%) - Multirace
Year householder moved into unit - Moved in 1990 to 1994 (%) - Other Race
Year householder moved into unit - Moved in 1980 to 1989 (%)
Year householder moved into unit - Moved in 1980 to 1989 (%) - White
Year householder moved into unit - Moved in 1980 to 1989 (%) - Black or African American
Year householder moved into unit - Moved in 1980 to 1989 (%) - Asian
Year householder moved into unit - Moved in 1980 to 1989 (%) - Hispanic or Latino
Year householder moved into unit - Moved in 1980 to 1989 (%) - American Indian and Alaska Native
Year householder moved into unit - Moved in 1980 to 1989 (%) - Multirace
Year householder moved into unit - Moved in 1980 to 1989 (%) - Other Race
Year householder moved into unit - Moved in 1970 to 1979 (%)
Year householder moved into unit - Moved in 1970 to 1979 (%) - White
Year householder moved into unit - Moved in 1970 to 1979 (%) - Black or African American
Year householder moved into unit - Moved in 1970 to 1979 (%) - Asian
Year householder moved into unit - Moved in 1970 to 1979 (%) - Hispanic or Latino
Year householder moved into unit - Moved in 1970 to 1979 (%) - American Indian and Alaska Native
Year householder moved into unit - Moved in 1970 to 1979 (%) - Multirace
Year householder moved into unit - Moved in 1970 to 1979 (%) - Other Race
Year householder moved into unit - Moved in 1969 or earlier (%)
Year householder moved into unit - Moved in 1969 or earlier (%) - White
Year householder moved into unit - Moved in 1969 or earlier (%) - Black or African American
Year householder moved into unit - Moved in 1969 or earlier (%) - Asian
Year householder moved into unit - Moved in 1969 or earlier (%) - Hispanic or Latino
Year householder moved into unit - Moved in 1969 or earlier (%) - American Indian and Alaska Native
Year householder moved into unit - Moved in 1969 or earlier (%) - Multirace
Year householder moved into unit - Moved in 1969 or earlier (%) - Other Race
Housing units lacking complete plumbing facilities (%)
Housing units lacking complete kitchen facilities (%)
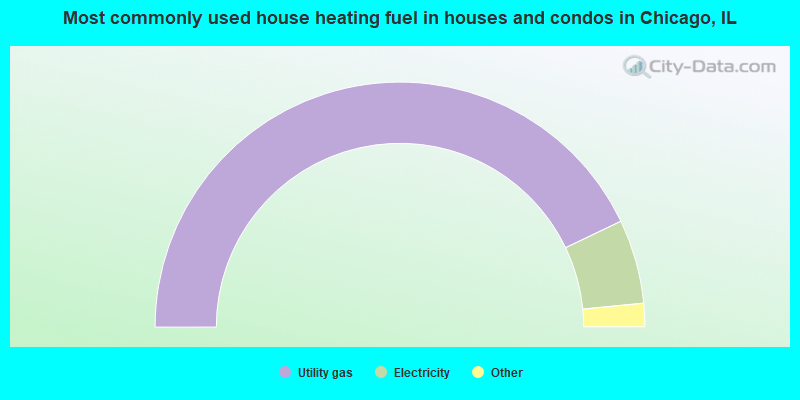
House heating fuel used in houses and condos - Utility gas (%)
House heating fuel used in houses and condos - Bottled, tank, or LP gas (%)
House heating fuel used in houses and condos - Electricity (%)
House heating fuel used in houses and condos - Fuel oil, kerosene, etc. (%)
House heating fuel used in houses and condos - Coal or coke (%)
House heating fuel used in houses and condos - Wood (%)
House heating fuel used in houses and condos - Solar energy (%)
House heating fuel used in houses and condos - Other fuel (%)
House heating fuel used in houses and condos - No fuel used (%)
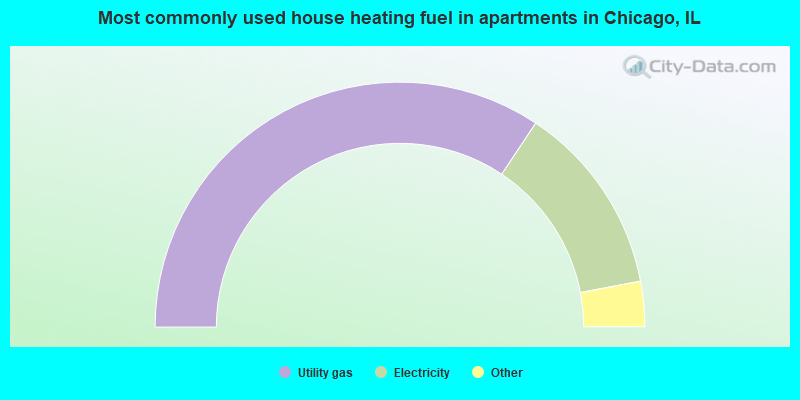
House heating fuel used in apartments - Utility gas (%)
House heating fuel used in apartments - Bottled, tank, or LP gas (%)
House heating fuel used in apartments - Electricity (%)
House heating fuel used in apartments - Fuel oil, kerosene, etc. (%)
House heating fuel used in apartments - Coal or coke (%)
House heating fuel used in apartments - Wood (%)
House heating fuel used in apartments - Solar energy (%)
House heating fuel used in apartments - Other fuel (%)
House heating fuel used in apartments - No fuel used (%)
Latest news about housing in Chicago, IL collected exclusively by city-data.com from local newspapers, TV, and radio stations
Median year house/condo built: 1951Median year apartment built: 1959Household type by relationship:
Households: 2,665,064
Male householders: 536,274 (205,854 living alone ), Female householders: 623,150 (251,693 living alone )351,644 spouses (341,801 opposite-sex spouses ), 95,242 unmarried partners , (85,365 opposite-sex unmarried partners ), 693,897 children (667,630 natural , 9,308 adopted , 16,959 stepchildren ), 74,458 grandchildren , 45,141 brothers or sisters , 37,165 parents , 1,017 foster children , 58,451 other relatives , 100,931 non-relatives In group quarters: 47,694
Size of family households: 242,481 2-persons , 139,259 3-persons , 108,596 4-persons , 50,371 5-persons , 22,681 6-persons , 17,625 7-or-more-persons .
Size of nonfamily households: 457,547 1-person , 101,406 2-persons , 14,560 3-persons , 3,508 4-persons , 949 5-persons , 441 7-or-more-persons .
239,781 married couples with children. single-parent households (33,323 men , 159,620 women ).
64.1% of residents of Chicago speak English at home. of residents speak Spanish at home (58% speak English very well , 20% speak English well , 16% speak English not well , 6% don't speak English at all ).of residents speak other Indo-European language at home (64% speak English very well , 21% speak English well , 12% speak English not well , 2% don't speak English at all ).of residents speak Asian or Pacific Island language at home (54% speak English very well , 24% speak English well , 15% speak English not well , 7% don't speak English at all ).of residents speak other language at home (73% speak English very well , 22% speak English well , 4% speak English not well , 1% don't speak English at all ).
Foreign born population: 548,452 (20.6%)of them are naturalized citizens )
Median number of rooms in houses and condos:
Median number of rooms in apartments
Owner-occupied Renter-occupied
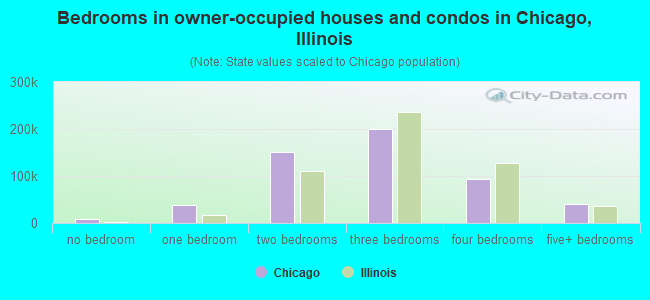
Bedrooms in owner-occupied houses and condos in Chicago, Illinois
7,914 no bedroom 38,317 1 bedroom 150,010 2 bedrooms 199,262 3 bedrooms 93,778 4 bedrooms 41,117 5+ bedrooms
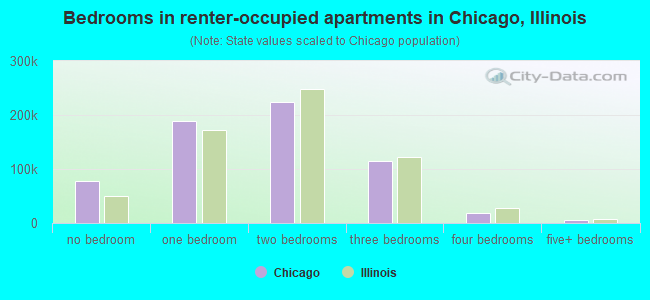
Bedrooms in renter-occupied apartments in Chicago, Illinois
77,535 no bedroom 189,288 1 bedroom 223,988 2 bedrooms 114,104 3 bedrooms 17,742 4 bedrooms 6,369 5+ bedrooms
Owner-occupied Renter-occupied
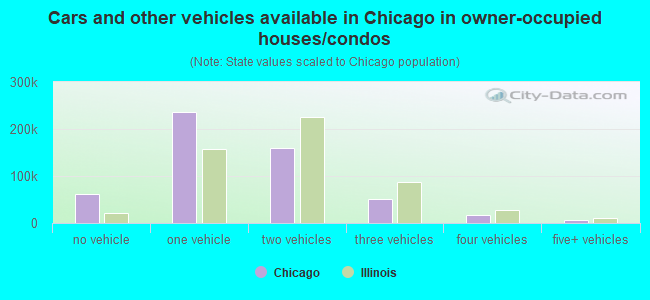
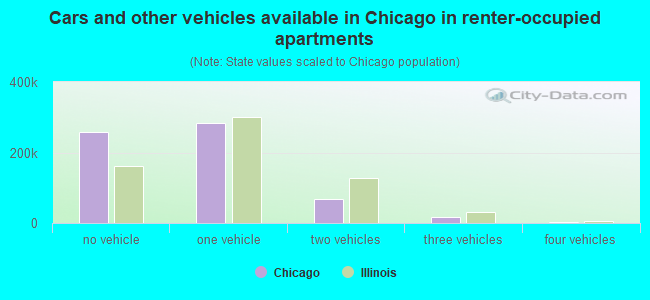
Cars and other vehicles available in Chicago in owner-occupied houses/condos
60,912 no vehicle 236,649 1 vehicle 159,761 2 vehicles 51,262 3 vehicles 16,295 4 vehicles 5,519 5+ vehicles
Cars and other vehicles available in Chicago in renter-occupied apartments
259,450 no vehicle 282,732 1 vehicle 67,919 2 vehicles 15,930 3 vehicles 2,356 4 vehicles 639 5+ vehicles
Owner-occupied Renter-occupied
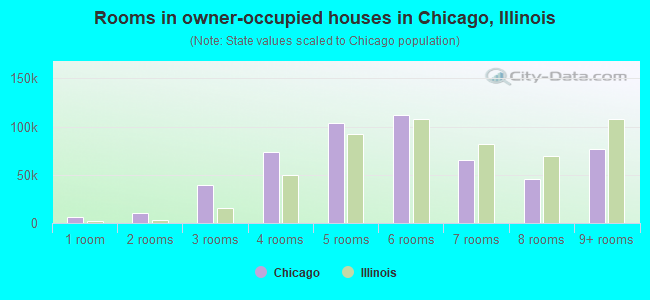
Rooms in owner-occupied houses in Chicago, Illinois
5,791 1 room 10,156 2 rooms 38,957 3 rooms 73,387 4 rooms 103,358 5 rooms 111,983 6 rooms 64,821 7 rooms 45,525 8 rooms 76,420 9+ rooms
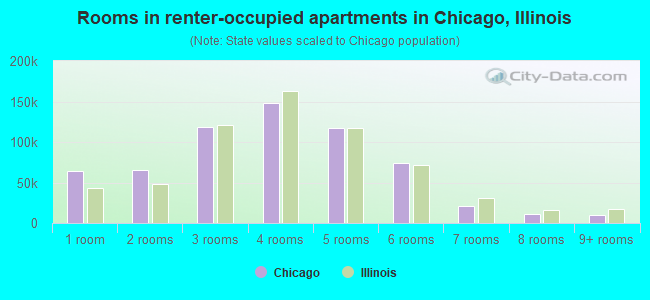
Rooms in renter-occupied apartments in Chicago, Illinois
64,611 1 room 64,875 2 rooms 118,024 3 rooms 148,428 4 rooms 117,555 5 rooms 74,099 6 rooms 20,660 7 rooms 11,105 8 rooms 9,669 9+ rooms
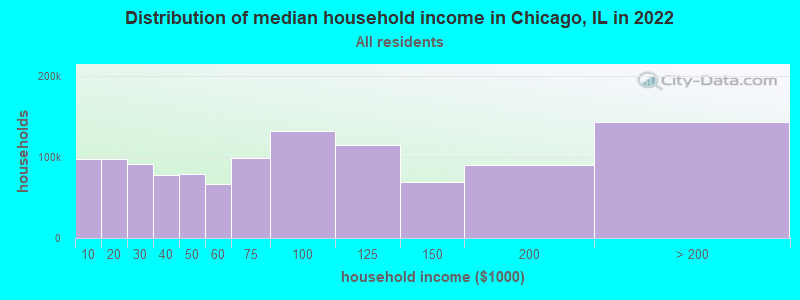
Chicago, IL household income distribution 97,990 Less than $10,00098,002 $10,000 to $19,99990,985 $20,000 to $29,99978,406 $30,000 to $39,99978,932 $40,000 to $49,99966,216 $50,000 to $59,99998,574 $60,000 to $74,999132,370 $75,000 to $99,999114,763 $100,000 to $124,99969,692 $125,000 to $149,99990,133 $150,000 to $199,999143,361 $200,000 or more
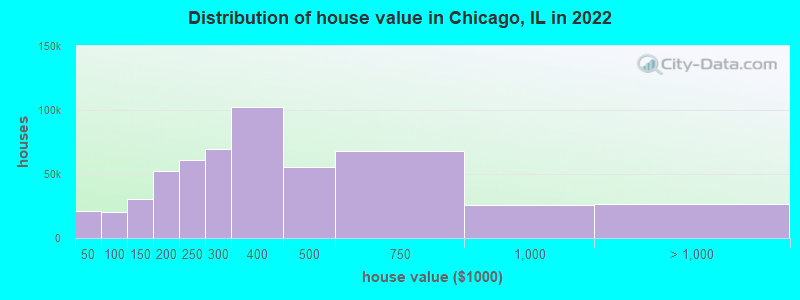
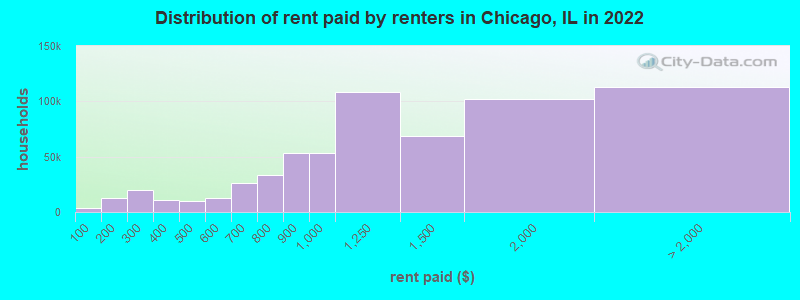
Home value of owner - occupied houses in 2022 in Chicago, IL 8,039 Less than $10,0001,130 $10,000 to $14,9991,384 $15,000 to $19,9992,119 $20,000 to $24,9992,067 $25,000 to $29,9992,126 $30,000 to $34,9991,889 $35,000 to $39,9991,990 $40,000 to $49,9991,788 $50,000 to $59,9993,616 $60,000 to $69,9992,204 $70,000 to $79,9994,864 $80,000 to $89,9995,554 $90,000 to $99,99915,659 $100,000 to $124,99915,172 $125,000 to $149,99929,051 $150,000 to $174,99923,034 $175,000 to $199,99960,670 $200,000 to $249,99969,250 $250,000 to $299,999102,444 $300,000 to $399,99955,170 $400,000 to $499,99968,101 $500,000 to $749,99926,136 $750,000 to $999,99915,502 $1,000,000 to $1,499,9994,529 $1,500,000 to $1,999,9996,910 $2,000,000 or moreRent paid by renters in 2022 in Chicago, IL 3,587 Less than $1004,050 $100 to $1498,876 $150 to $19912,179 $200 to $2497,915 $250 to $2995,425 $300 to $3495,392 $350 to $3995,060 $400 to $4494,840 $450 to $4997,546 $500 to $5494,750 $550 to $59915,412 $600 to $64911,168 $650 to $69915,824 $700 to $74917,549 $750 to $79953,324 $800 to $89953,539 $900 to $999108,548 $1,000 to $1,24968,633 $1,250 to $1,499102,375 $1,500 to $1,99947,171 $2,000 to $2,49922,520 $2,500 to $2,9999,602 $3,000 to $3,49917,015 $3,500 or more16,726 No cash rent
Percentage of workers working in this county: 93.7%Number of people working at home: 288,422 (21.2% of all workers )
Travel time to work (commute)
Less than 5 minutes: 17,6415 to 9 minutes: 44,73410 to 14 minutes: 83,14315 to 19 minutes: 107,24920 to 24 minutes: 133,22325 to 29 minutes: 65,63830 to 34 minutes: 207,39635 to 39 minutes: 45,64640 to 44 minutes: 64,00745 to 59 minutes: 149,63960 to 89 minutes: 116,70990 or more minutes: 37,768
Means of transportation to work:
Drove a car alone: 663,644 (45.7%)Carpooled: 95,445 (6.6%)Bus : 121,425 (8.4%)Subway or elevated rail : 102,959 (7.1%)Long-distance train or commuter rail : 64,082 (4.4%)Light rail, streetcar or trolley : 3,134 (0.2%)Ferryboat: 190 (0.0%)Taxi: 25,835 (1.8%)Bicycle: 17,005 (1.2%)Walked: 69,486 (4.8%)Worked at home: 288,422 (19.9%)
Unemployment by race in 2022
Unemployment rate for White non-Hispanic residents 3.0% Males3.3% FemalesUnemployment rate for Black residents 13.6% Males11.9% FemalesUnemployment rate for American Indian and Alaska Native residents 6.5% Males3.4% FemalesUnemployment rate for Asian residents 3.8% Males2.5% FemalesUnemployment rate for other race residents 7.7% Males7.6% FemalesUnemployment rate for two or more race residents 6.8% Males5.3% FemalesUnemployment rate for Hispanic or Latino residents 6.6% Males5.9% Females
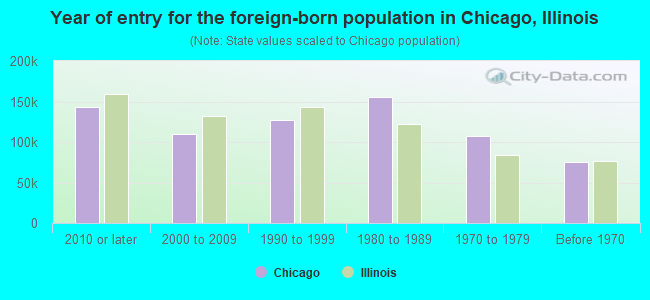
Year of entry for the foreign-born population in Chicago, Illinois
143,319 2010 or later 109,857 2000 to 2009 127,524 1990 to 1999 155,121 1980 to 1989 106,984 1970 to 1979 75,013 Before 1970
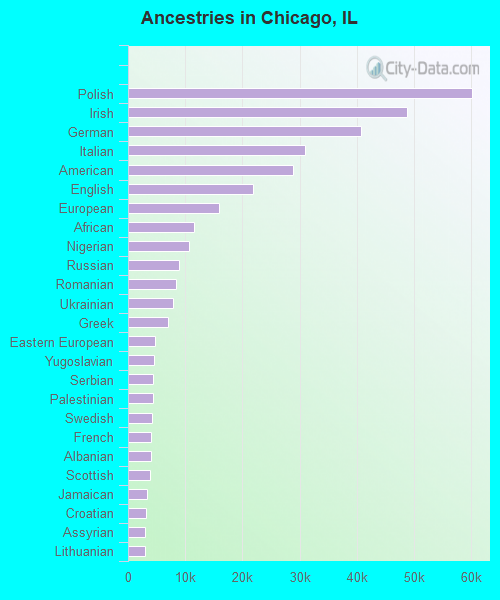
First ancestries reported:
Polish: 60,114 (3.7%)
Irish: 48,737 (3.0%)
German: 40,661 (2.5%)
Italian: 30,975 (1.9%)
American: 28,791 (1.8%)
English: 21,797 (1.4%)
European: 15,902 (1.0%)
African: 11,570 (0.7%)
Nigerian: 10,686 (0.7%)
Russian: 8,880 (0.6%)
Romanian: 8,423 (0.5%)
Ukrainian: 7,825 (0.5%)
Greek: 7,036 (0.4%)
Eastern European: 4,642 (0.3%)
Yugoslavian: 4,496 (0.3%)
Serbian: 4,421 (0.3%)
Palestinian: 4,401 (0.3%)
Swedish: 4,180 (0.3%)
French: 4,064 (0.3%)
Albanian: 3,975 (0.2%)
Scottish: 3,832 (0.2%)
Jamaican: 3,350 (0.2%)
Croatian: 3,187 (0.2%)
Assyrian: 2,968 (0.2%)
Lithuanian: 2,943 (0.2%)
Dutch: 2,800 (0.2%)
Brazilian: 2,759 (0.2%)
Ethiopian: 2,593 (0.2%)
Haitian: 2,584 (0.2%)
Bulgarian: 2,381 (0.1%)
Czech: 2,233 (0.1%)
Iranian: 2,232 (0.1%)
Norwegian: 2,150 (0.1%)
Belizean: 2,101 (0.1%)
British: 1,815 (0.1%)
Turkish: 1,811 (0.1%)
Ghanaian: 1,788 (0.1%)
Afghan: 1,394 (0.09%)
Syrian: 1,384 (0.09%)
Northern European: 1,287 (0.08%)
Egyptian: 1,251 (0.08%)
Liberian: 1,242 (0.08%)
Sudanese: 1,054 (0.07%)
West Indian: 1,028 (0.06%)
Austrian: 1,022 (0.06%)
Macedonian: 1,002 (0.06%)
Armenian: 944 (0.06%)
Slovene: 938 (0.06%)
Somali: 891 (0.06%)
Hungarian: 839 (0.05%)
Scotch-Irish: 785 (0.05%)
Lebanese: 778 (0.05%)
Danish: 769 (0.05%)
Canadian: 765 (0.05%)
Slovak: 736 (0.05%)
French Canadian: 682 (0.04%)
Jordanian: 637 (0.04%)
Portuguese: 578 (0.04%)
Kenyan: 561 (0.03%)
Latvian: 531 (0.03%)
Scandinavian: 503 (0.03%)
Welsh: 498 (0.03%)
Belgian: 493 (0.03%)
Australian: 434 (0.03%)
Senegalese: 366 (0.02%)
Arab: 346 (0.02%)
Finnish: 331 (0.02%)
Luxembourger: 283 (0.02%)
Swiss: 259 (0.02%)
Moroccan: 224 (0.01%)
Icelander: 192 (0.01%)
Guyanese: 192 (0.01%)
Barbadian: 173 (0.01%)
Israeli: 171 (0.01%)
Slavic: 169 (0.01%)
Basque: 163 (0.01%)
Ugandan: 140 (0.01%)
Czechoslovakian: 137 (0.01%)
Iraqi: 135 (0.01%)
South African: 134 (0.01%)
Bahamian: 134 (0.01%)
Trinidadian and Tobagonian: 90 (0.01%)
Most common places of birth for foreign-born residents (%): Mexico Chicago:
41.1% (225,629)Illinois:
34.3% (621,541)
China, excluding Hong Kong and Taiwan Chicago:
6.1% (33,521)Illinois:
4.0% (72,783)
India Chicago:
5.1% (28,095)Illinois:
9.6% (173,578)
Poland Chicago:
4.3% (23,639)Illinois:
6.7% (120,473)
Philippines Chicago:
4.2% (23,020)Illinois:
5.1% (92,569)
Guatemala Chicago:
1.8% (9,878)Illinois:
1.3% (22,886)
Nigeria Chicago:
1.7% (9,593)Illinois:
1.3% (22,648)
Korea Chicago:
1.7% (9,414)Illinois:
2.1% (37,662)
Ecuador Chicago:
1.6% (8,648)Illinois:
0.8% (14,356)
Venezuela Chicago:
1.5% (8,436)Illinois:
0.9% (15,387)
Place of birth for U.S.-born residents:
This state: 1,560,507Other state: 499,802Northeast: 81,756Midwest: 192,036South: 162,883West: 63,127 85.0% of Chicago residents lived in the same house 1 years ago.
Out of people who lived in different houses, 41.6% lived in this county.
Out of people who lived in different counties, 22.1% lived in Illinois.
Chicago:
85.0%State average:
88.3%
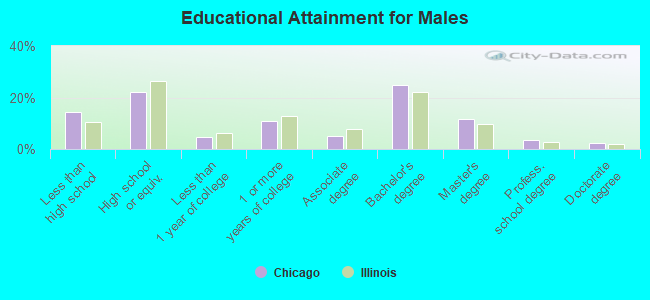
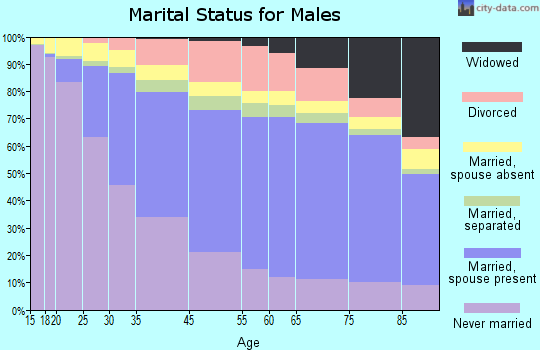
Education attainment for males 25 years and older:
No schooling: 27,308Nursery to 4th grade: 7,3005th and 6th grade: 17,4777th and 8th grade: 14,8859th grade: 10,96810th grade: 12,96311th grade: 14,06912th grade, no diploma: 26,327High school graduate (or equivalency): 202,506Less than 1 year of college: 42,099Some college more than 1 year, no degree: 98,289Associate degree: 47,106Bachelor's degree: 227,900Master's degree: 107,677Professional school degree: 31,813Doctorate degree: 21,287
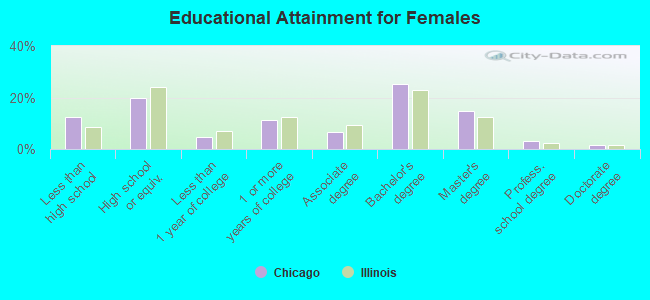
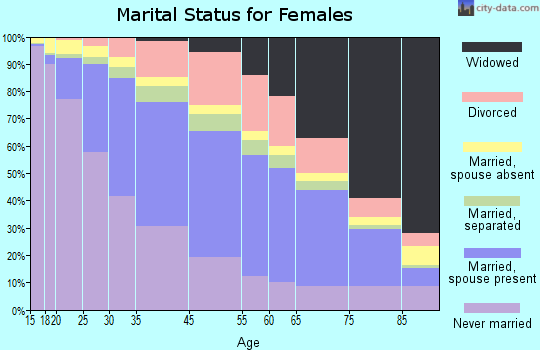
Education attainment for females 25 years and older:
No schooling: 26,285Nursery to 4th grade: 8,0835th and 6th grade: 18,3617th and 8th grade: 16,0839th grade: 7,42210th grade: 9,19111th grade: 13,27612th grade, no diploma: 23,746High school graduate (or equivalency): 193,692Less than 1 year of college: 45,578Some college more than 1 year, no degree: 110,211Associate degree: 65,614Bachelor's degree: 244,238Master's degree: 143,001Professional school degree: 31,316Doctorate degree: 15,537
Housing units in structures:
One, detached: 320,889One, attached: 48,381Two: 158,1163 or 4: 175,1615 to 9: 153,51210 to 19: 59,45620 to 49: 87,90950 or more: 255,233Mobile homes: 3,471Boats, RVs, vans, etc.: 335Housing units lacking complete plumbing facilities in 2022: 1.4%Housing units lacking complete kitchen facilities in 2022: 2.2%House/condo owner moved in on average 12 years ago
Renter moved in on average 2 years ago
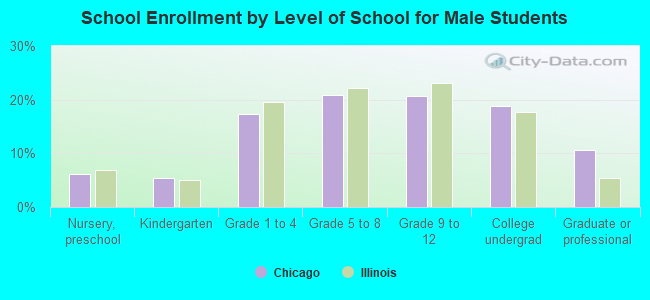
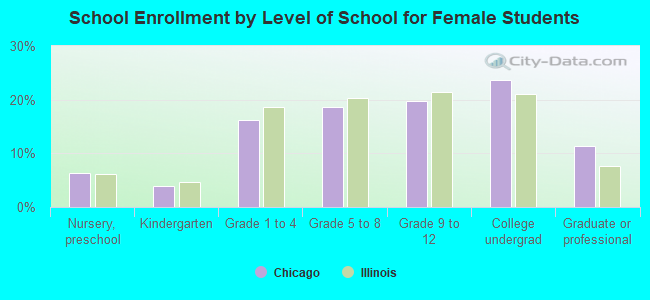
Private vs. public school enrollment:
Students in private schools in grades 1 to 8 (elementary and middle school): 37,417 Students in private schools in grades 9 to 12 (high school): 17,036 Students in private undergraduate colleges: 53,107