Cabrini-Green (Cabrini Green) neighborhood in Chicago, Illinois (IL), 60610 detailed profile
Settings
X

Business Search - 14 Million verified businesses
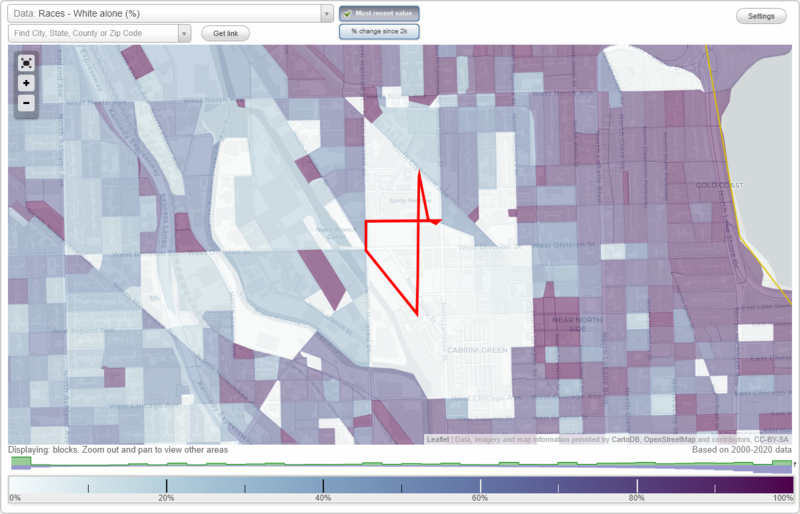
Area: 0.029 square miles
Population: 342
Population density:
| Cabrini-Green (Cabrini Green): | 11,709 people per square mile |
| Chicago: | 11,734 people per square mile |

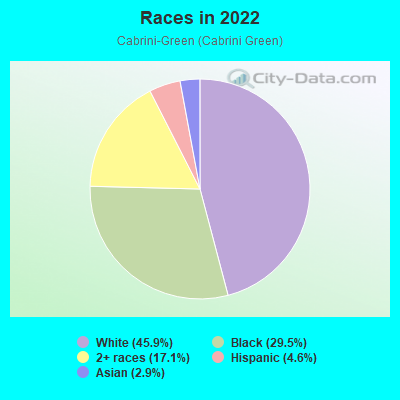
- 31645.9%White
- 20329.5%Black
- 11817.1%Two or more races
- 324.6%Hispanic or Latino
- 202.9%Asian
Distribution of median household income
![Distribution of median household income]()
- 18Less than $10,000
- 119$10,000 to $19,999
- 13$20,000 to $29,999
- 19$30,000 to $39,999
- 46$40,000 to $49,999
- 17$50,000 to $59,999
- 14$75,000 to $99,999
- 5$100,000 to $124,999
- 7$125,000 to $149,999
- 27$150,000 to $199,999
- 22$200,000 or more

Distribution of owner-occupied house/condo value
![Distribution of owner-occupied house/condo value]()
- 6$250,000 to $299,999
- 10$300,000 to $399,999
- 18$400,000 to $499,999
- 106$500,000 to $749,999
- 18$750,000 to $999,999
- 18$1,000,000 or more

Distribution of rent paid by renters
![Distribution of rent paid by renters]()
- 4Less than $100
- 21$100 to $199
- 77$200 to $299
- 19$300 to $399
- 16$400 to $499
- 29$500 to $599
- 22$600 to $699
- 14$1,000 to $1,249
- 15$1,250 to $1,499
- 61$1,500 to $1,999
- 53$2,000 or more

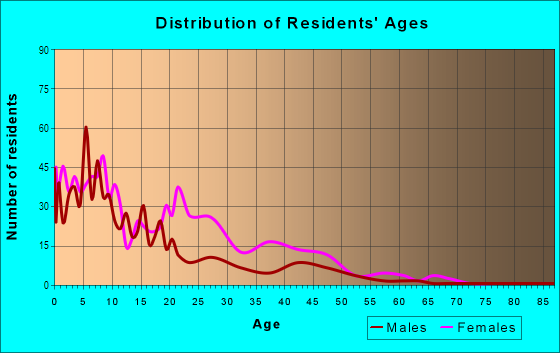
| Males: | 174 |
| Females: | 168 |
Males:
| This neighborhood: | 60.5 years |
| Whole city: | 35.3 years |
| This neighborhood: | 30.1 years |
| Whole city: | 36.2 years |
Average household size:
| Cabrini-Green (Cabrini Green): | 1.8 people |
| Chicago: | 2.3 people |
Percentage of family households:
| Cabrini-Green (Cabrini Green): | 21.1% |
| Chicago: | 36.7% |
| Here: | 11.6% |
| Chicago: | 30.4% |
Percentage of married-couple families with children (among all households):
| Cabrini-Green (Cabrini Green): | 34.8% |
| Chicago: | 24.1% |
Percentage of single-mother households (among all households):
| Cabrini-Green (Cabrini Green): | 19.9% |
| Chicago: | 16.0% |
Percentage of never married males 15 years old and over:
Percentage of never married females 15 years old and over:
| Cabrini-Green (Cabrini Green): | 7.0% |
| Chicago: | 24.5% |
Percentage of never married females 15 years old and over:
| Cabrini-Green (Cabrini Green): | 32.5% |
| city: | 24.9% |
Percentage of people that speak English not well or not at all:
| Cabrini-Green (Cabrini Green): | 0.0% |
| Chicago: | 7.1% |
Percentage of people born in this state:
Percentage of people born in another U.S. state:
Percentage of native residents but born outside the U.S.:
Percentage of foreign born residents:
| Here: | 65.9% |
| Chicago: | 58.6% |
Percentage of people born in another U.S. state:
| Cabrini-Green (Cabrini Green): | 30.0% |
| Chicago: | 18.8% |
Percentage of native residents but born outside the U.S.:
| Here: | 0.0% |
| city: | 2.1% |
Percentage of foreign born residents:
| Here: | 4.1% |
| Chicago: | 20.6% |
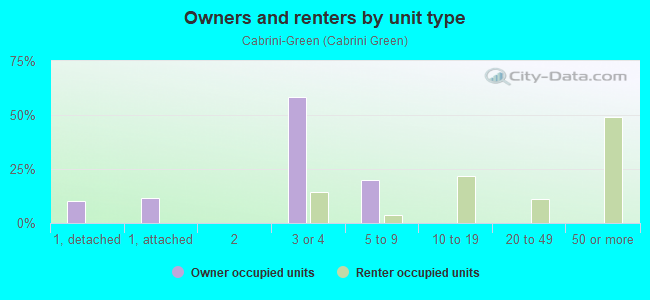
Owner-occupied
Renter-occupied

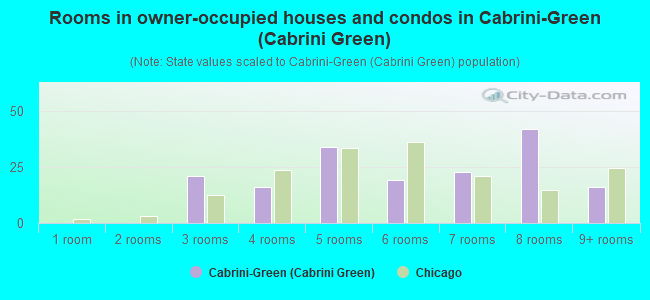
- Rooms in owner-occupied houses and condos in Cabrini-Green <
> - 01 room
- 02 rooms
- 213 rooms
- 164 rooms
- 345 rooms
- 196 rooms
- 237 rooms
- 428 rooms
- 169+ rooms
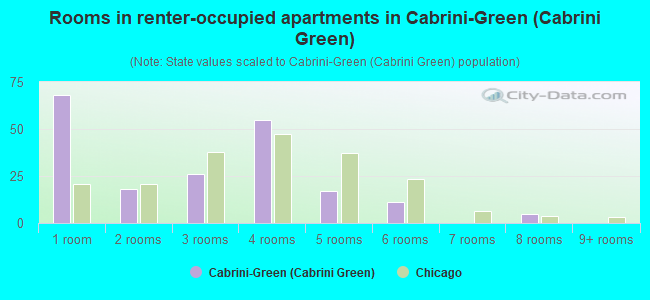
- Rooms in renter-occupied apartments in Cabrini-Green <
> - 681 room
- 182 rooms
- 263 rooms
- 554 rooms
- 175 rooms
- 116 rooms
- 07 rooms
- 58 rooms
- 09+ rooms
Owner-occupied
Renter-occupied
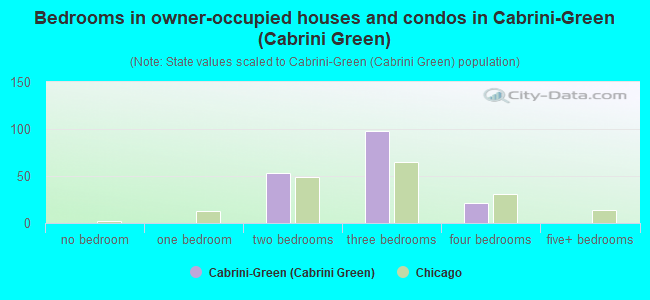
- Bedrooms in owner-occupied houses and condos in Cabrini-Green <
> - 0no bedroom
- 01 bedroom
- 532 bedrooms
- 983 bedrooms
- 214 bedrooms
- 05+ bedrooms
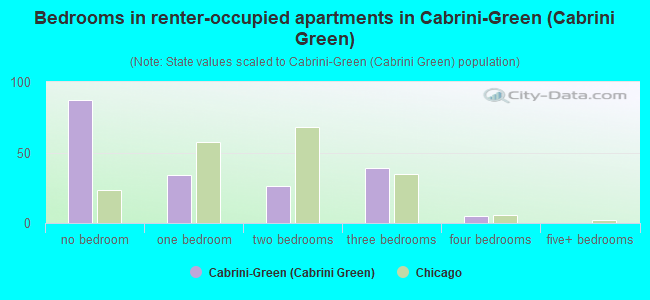
- Bedrooms in renter-occupied apartments in Cabrini-Green <
> - 87no bedroom
- 341 bedroom
- 262 bedrooms
- 393 bedrooms
- 54 bedrooms
- 05+ bedrooms
Average number of cars or other vehicles available in houses/condos:
Average number of cars or other vehicles available in apartments:
| This neighborhood: | |
| Chicago: |
Average number of cars or other vehicles available in apartments:
| Here: | 0.4 |
| city: | 0.8 |
Percentage of units with a mortgage:
| Cabrini-Green (Cabrini Green): | 76.2% |
| Chicago: | 64.7% |
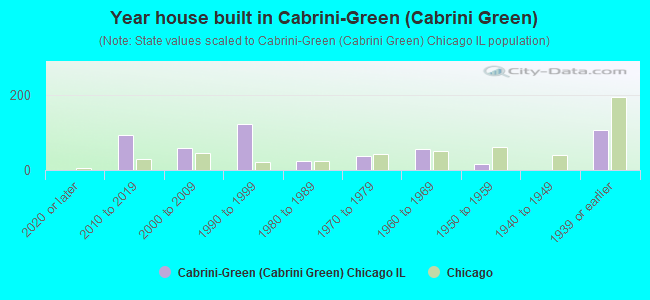
- Year house built in Cabrini-Green <
> - 02020 or later
- 932010 to 2019
- 582000 to 2009
- 1221990 to 1999
- 231980 to 1989
- 381970 to 1979
- 561960 to 1969
- 171950 to 1959
- 01940 to 1949
- 1061939 or earlier
City-data.com crime index for city in 2020 (higher means more crime):
| City: | 421.1 |
| U.S. average: | 219.5 |
Travel time to work (commute)
![Travel time to work (commute)]()
- 55 to 9 minutes
- 4510 to 14 minutes
- 2915 to 19 minutes
- 3820 to 24 minutes
- 2725 to 29 minutes
- 8330 to 34 minutes
- 4040 to 44 minutes
- 7045 to 59 minutes
- 3360 to 89 minutes
- 1490 or more minutes

Means of transportation to work
![Means of transportation to work]()
- 22.2%26Drove a car alone
- 17.1%20Carpooled
- 72.6%85Bus
- 14.5%17Subway or elevated rail
- 4.3%5Long-distance train or commuter rail
- 4.3%5Light rail, streetcar or trolley
- 17.9%21Bicycle
- 20.5%24Walked
- 25.6%30Worked at home

Time leaving home to go to work
![Time leaving home to go to work]()
- 306:00 a.m. to 6:29 a.m.
- 496:30 a.m. to 6:59 a.m.
- 927:00 a.m. to 7:29 a.m.
- 587:30 a.m. to 7:59 a.m.
- 588:00 a.m. to 8:29 a.m.
- 358:30 a.m. to 8:59 a.m.
- 209:00 a.m. to 9:59 a.m.
- 2910:00 a.m. to 10:59 a.m.
- 911:00 a.m. to 11:59 a.m.
- 512:00 p.m. to 3:59 p.m.

Occupations of males:
- Percentage of males in management occupations (except farmers):
Here: 186.0% city: 12.0%
- Percentage of males in business and financial operations occupations:
Here: 100.0% city: 7.9%
- Percentage of males in computer and mathematical occupations:
Here: 120.4% city: 6.3%
- Percentage of males in architecture and engineering occupations:
Here: 22.5% city: 2.4%
- Percentage of males in life, physical, and social science occupations:
Here: 14.7% city: 1.1%
- Percentage of males in legal occupations:
Here: 229.1% city: 2.1%
- Percentage of males in healthcare practitioners and technical occupations:
Here: 28.4% city: 3.1%
- Percentage of males in service occupations:
Here: 42.1% city: 15.8%
- Percentage of males in sales and office occupations:
Here: 239.8% city: 14.5%
Occupations of females:
- Percentage of females in management occupations (except farmers):
Here: 32.0% city: 11.1%
- Percentage of females in business and financial operations occupations:
Here: 19.3% city: 9.2%
- Percentage of females in architecture and engineering occupations:
Here: 5.5% city: 0.8%
- Percentage of females in life, physical, and social science occupations:
Here: 21.9% city: 1.2%
- Percentage of females in community and social services occupations:
Here: 5.3% city: 3.0%
- Percentage of females in legal occupations:
Here: 60.5% city: 2.3%
- Percentage of females in education, training, and library occupations:
Here: 8.4% city: 8.8%
- Percentage of females in healthcare practitioners and technical occupations:
Here: 27.3% city: 8.5%
- Percentage of females in service occupations:
Here: 18.8% city: 19.6%
- Percentage of females in sales and office occupations:
Here: 61.4% city: 23.3%
- Percentage of females in material moving occupations:
Here: 34.6% city: 1.9%
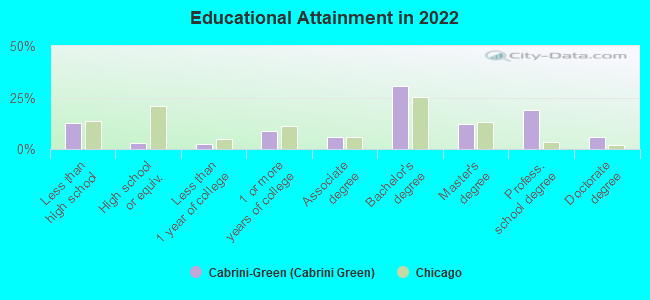
Education in this neighborhood (subdivision or community):
- Percentage of people 3 years and older in K-12 schools:
Cabrini-Green (Cabrini Green): 43.6% Chicago: 14.6%
- Percentage of people 3 years and older in undergraduate colleges:
Cabrini-Green (Cabrini Green): 33.3% Chicago: 5.1%
- Percentage of people 3 years and older in grad. or professional schools:
Cabrini-Green (Cabrini Green): 1.5% Chicago: 2.6%
- Percentage of students K-12 enrolled in private schools:
Cabrini-Green (Cabrini Green): 2.7% Chicago: 15.6%
Percentage of population below poverty level:
| Cabrini-Green (Cabrini Green): | 21.5% |
| Chicago: | 17.2% |
Median year renter moved in (as recorded in 2022):
| Cabrini-Green (Cabrini Green): | 2014 |
| Chicago: | 2020 |
Percentage of married-couple families with both working:
| Cabrini-Green (Cabrini Green): | 100.0% |
| Chicago: | 69.2% |
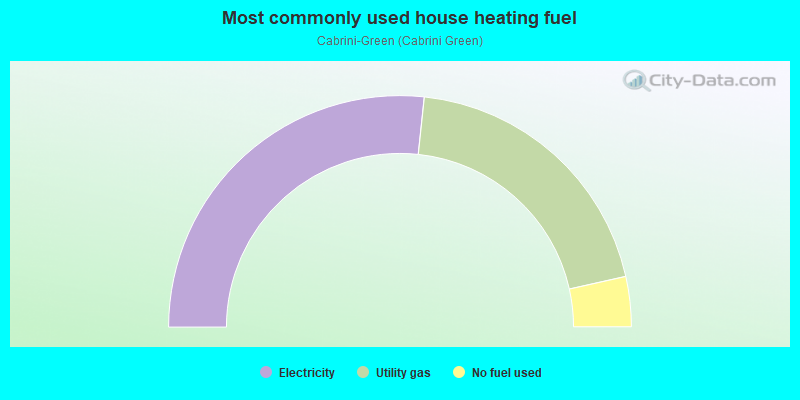
- 53.3%Electricity
- 39.6%Utility gas
- 7.0%No fuel used
Roads and streets:
W Division St
Length: 0.45 miles
Direction: E-W
Address range: 500 to 739
Direction: E-W
Address range: 500 to 739
N Larrabee St
Length: 0.08 miles
Direction: N-S
Address range: 1200 to 1299
Direction: N-S
Address range: 1200 to 1299
N Cleveland Ave
Length: 0.03 miles
Directions: N-S, SE-NW
Address range: 1200 to 1221
Directions: N-S, SE-NW
Address range: 1200 to 1221