Cobb County, Georgia (GA)
County owner-occupied free and clear houses and condos in 2010: 29,744
County owner-occupied houses and condos in 2000: 155,075
Renter-occupied apartments: 86,091 (it was 72,412 in 2000)
| % of renters here: | 32% |
| State: | 34% |
Land area: 340 sq. mi.
Water area: 4.4 sq. mi.
Population density: 2269 people per square mile (very high).
Industries providing employment: Educational, health and social services (19.3%), Professional, scientific, management, administrative, and waste management services (17.2%), Retail trade (11.0%).
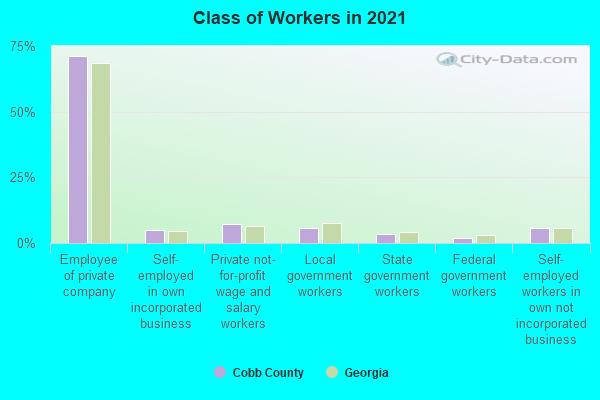
Type of workers:
- Private wage or salary: 84%
- Government: 11%
- Self-employed, not incorporated: 5%
- Unpaid family work: 0%
- OSM Map
- General Map
- Google Map
- MSN Map

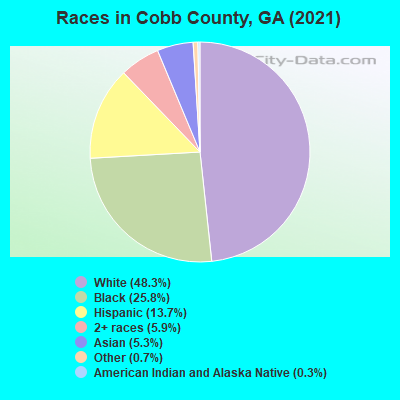
- 370,33648.0%White Non-Hispanic Alone
- 208,04227.0%Black Non-Hispanic Alone
- 106,54813.8%Hispanic or Latino
- 42,6745.5%Asian alone
- 38,5715.0%Two or more races
- 4,9920.6%Some other race alone
- 6030.08%American Indian and Alaska Native alone
- 1860.02%Native Hawaiian and Other
Pacific Islander alone
| Median resident age: | 37.6 years |
| Georgia median age: | 37.6 years |
| Males: 376,720 | |
| Females: 395,232 |


| Cobb County: | 2.0 people |
| Georgia: | 3 people |
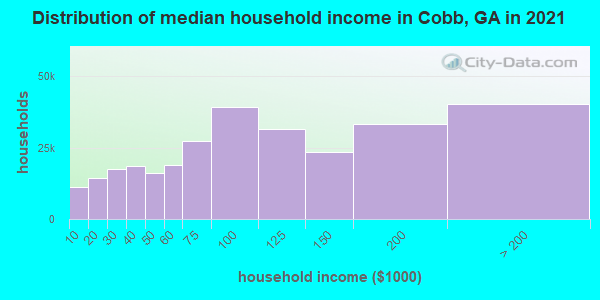
Estimated median household income in 2022: $97,084 ($58,289 in 1999)
| This county: | $97,084 |
| Georgia: | $72,837 |
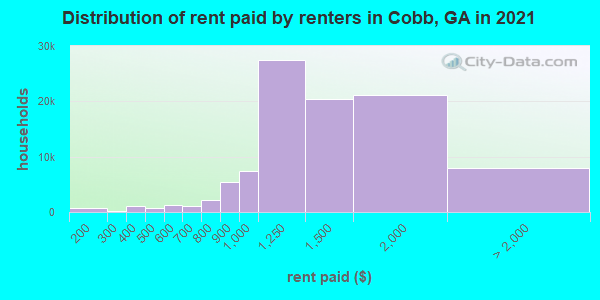
Median contract rent in 2022 for apartments: $1,458 (lower quartile is $1,138, upper quartile is $1,805)
| This county: | $1458 |
| State: | $1065 |
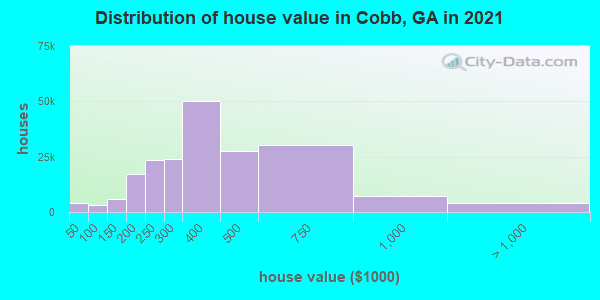
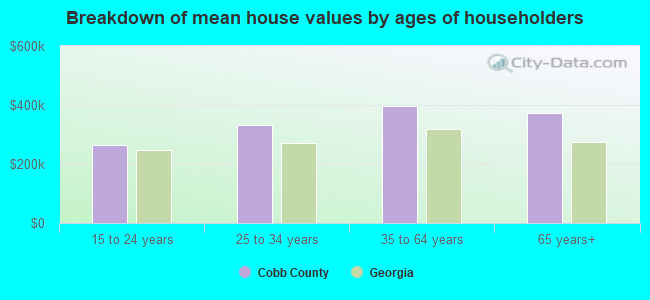
Estimated median house or condo value in 2022: $398,000 (it was $145,300 in 2000)
| Cobb: | $398,000 |
| Georgia: | $297,400 |
Mean price in 2022:
Median monthly housing costs for homes and condos with a mortgage: $1,854Detached houses: $474,704
Here: $474,704 State: $376,364 Townhouses or other attached units: $341,027
Here: $341,027 State: $341,709 In 2-unit structures: $176,733
Here: $176,733 State: $269,631 In 3-to-4-unit structures: $260,679
Here: $260,679 State: $250,092 In 5-or-more-unit structures: $351,124
Here: $351,124 State: $370,730 Mobile homes: $63,312
Here: $63,312 State: $102,413 Occupied boats, RVs, vans, etc.: $296,824
Here: $296,824 State: $86,124
Median monthly housing costs for units without a mortgage: $533
Institutionalized population: 4,489
Crime in 2021 (reported by the sheriff's office or county police, not the county total):
- Murders: 0
- Rapes: 6
- Robberies: 0
- Assaults: 17
- Burglaries: 0
- Thefts: 357
- Auto thefts: 9
Crime in 2020 (reported by the sheriff's office or county police, not the county total):
- Murders: 0
- Rapes: 9
- Robberies: 1
- Assaults: 16
- Burglaries: 1
- Thefts: 294
- Auto thefts: 7
Health of residents in Cobb County based on CDC Behavioral Risk Factor Surveillance System Survey Questionnaires from 2013 to 2021:
General health status score of residents in this county from 1 (poor) to 5 (excellent) is 3.5. This is about average.72.9% of residents exercised in the past month. This is about average.
36.6% of residents smoked 100+ cigarettes in their lives. This is less than average.
52.3% of adult residents drank alcohol in the past 30 days. This is less than average.
66.6% of residents visited a dentist within the past year. This is less than average.
Average weight of males is 197 pounds. This is about average.
Average weight of females is 164 pounds. This is about average.
Health of residents in Cobb County based on CDC Behavioral Risk Factor Surveillance System Survey Questionnaires from 2003 to 2012:
General health status score of residents in this county from 1 (poor) to 5 (excellent) is 3.7. This is significantly better than average.79.2% of residents exercised in the past month. This is about average.
42.6% of residents smoked 100+ cigarettes in their lives. This is about average.
99.0% of adult residents drank alcohol in the past 30 days. This is more than average.
76.0% of residents visited a dentist within the past year. This is about average.
Average weight of males is 196 pounds. This is about average.
Average weight of females is 153 pounds. This is less than average.
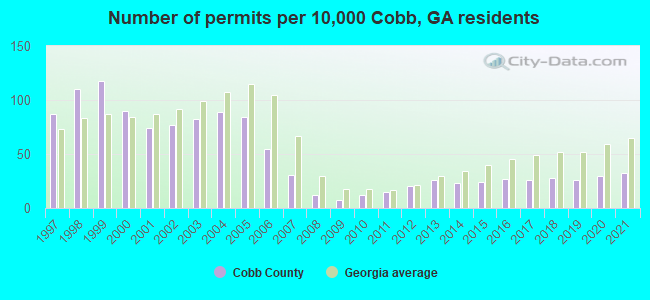
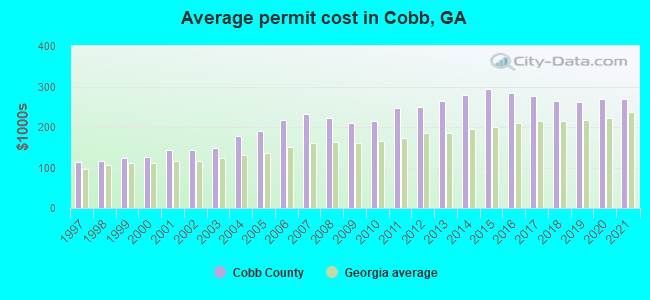
Single-family new house construction building permits:
- 2022: 1371 buildings, average cost: $297,000
- 2021: 1947 buildings, average cost: $268,700
- 2020: 1811 buildings, average cost: $268,900
- 2019: 1581 buildings, average cost: $262,400
- 2018: 1673 buildings, average cost: $263,800
- 2017: 1564 buildings, average cost: $275,900
- 2016: 1654 buildings, average cost: $283,700
- 2015: 1477 buildings, average cost: $293,300
- 2014: 1391 buildings, average cost: $278,500
- 2013: 1594 buildings, average cost: $264,400
- 2012: 1193 buildings, average cost: $248,600
- 2011: 886 buildings, average cost: $245,600
- 2010: 713 buildings, average cost: $215,900
- 2009: 409 buildings, average cost: $208,900
- 2008: 727 buildings, average cost: $221,400
- 2007: 1901 buildings, average cost: $233,300
- 2006: 3346 buildings, average cost: $217,400
- 2005: 5123 buildings, average cost: $190,200
- 2004: 5432 buildings, average cost: $177,200
- 2003: 4993 buildings, average cost: $149,400
- 2002: 4703 buildings, average cost: $142,800
- 2001: 4513 buildings, average cost: $143,900
- 2000: 5455 buildings, average cost: $125,600
- 1999: 7143 buildings, average cost: $123,500
- 1998: 6711 buildings, average cost: $117,300
- 1997: 5314 buildings, average cost: $114,300
Median real estate property taxes paid for housing units with mortgages in 2022: $2,858 (0.7%)
Median real estate property taxes paid for housing units with no mortgage in 2022: $1,582 (0.4%)
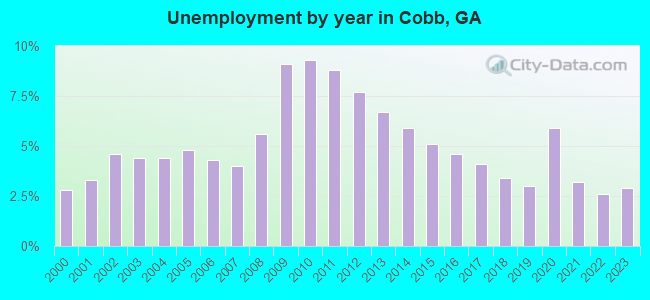
| Cobb County: | 7.8% |
| Georgia: | 12.7% |
Median age of residents in 2022: 37.6 years old
(Males: 36.6 years old, Females: 38.6 years old)
(Median age for: White residents: 43.4 years old, Black residents: 35.2 years old, American Indian residents: 23.3 years old, Asian residents: 37.6 years old, Hispanic or Latino residents: 28.2 years old, Other race residents: 29.4 years old)
Area name: Atlanta-Sandy Springs-Marietta, GA HUD Metro FMR Area
Fair market rent in 2006 for a 1-bedroom apartment in Cobb County is $686 a month.
Fair market rent for a 2-bedroom apartment is $763 a month.
Fair market rent for a 3-bedroom apartment is $929 a month.
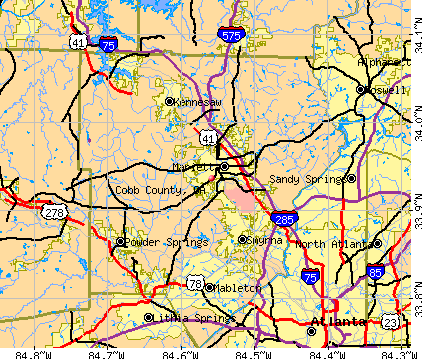
Cities in this county include: Northeast Cobb, Marietta, Smyrna, Mableton, Kennesaw, Acworth, Powder Springs, Vinings, Fair Oaks, Austell.
2023 air pollution in Cobb County:
Ozone (1-hour): 0.031 ppm (standard limit: 0.12 ppm). Near U.S. average.
Notable locations in this county outside city limits:
Reservoirs: J. Strom Thurmond Reservoir (A), Athens Waterworks Pond (B). Display/hide their locations on the map
Neighboring counties: Banks County  , Cherokee County
  , Jefferson County, Oklahoma
  , Orangeburg County, South Carolina
  , Sunflower County, Mississippi , Lincoln County .
| Here: | 2.6% |
| Georgia: | 2.9% |
Current college students: 35,713
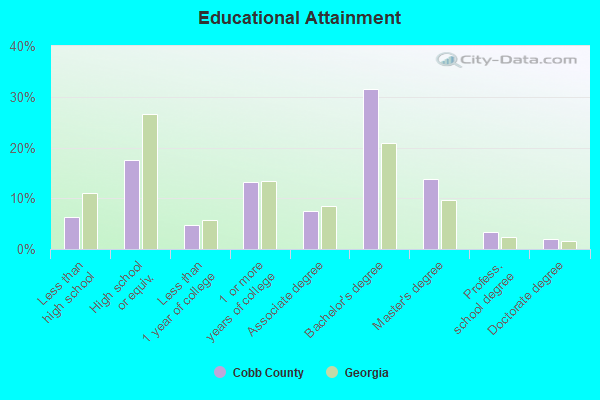
People 25 years of age or older with a high school degree or higher: 93.6%
People 25 years of age or older with a bachelor's degree or higher: 51.5%
Number of foreign born residents: 127,674 (48.2% naturalized citizens)
| Cobb County: | 16.5% |
| Whole state: | 10.7% |
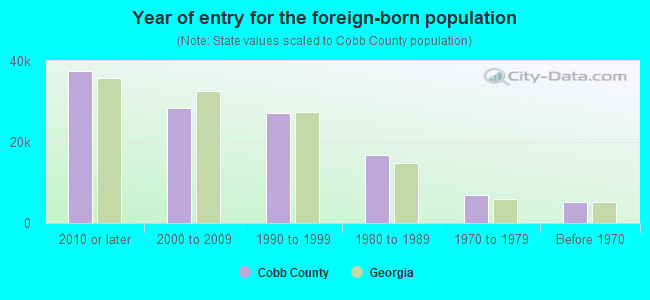
- Year of entry for the foreign-born population
- 50,5732010 or later
- 31,0102000 to 2009
- 23,9971990 to 1999
- 16,6771980 to 1989
- 6,8031970 to 1979
- 5,246Before 1970
Mean travel time to work (commute): minutes
Percentage of county residents living and working in this county: 98.9%
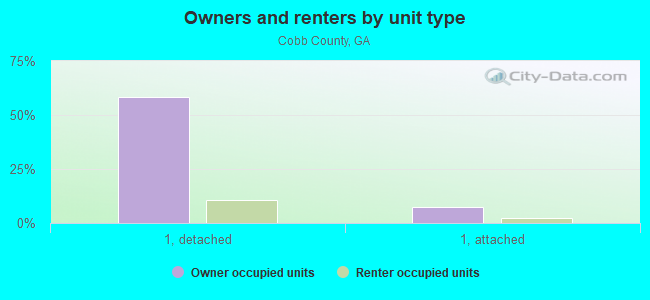
Housing units in structures:
- One, detached: 201,621
- One, attached: 29,544
- Two: 1,917
- 3 or 4: 7,151
- 5 to 9: 15,930
- 10 to 19: 24,826
- 20 to 49: 13,887
- 50 or more: 16,149
- Mobile homes: 3,191
- Boats, RVs, vans, etc.: 116
Housing units in Cobb County with a mortgage: 140,539 (12,588 second mortgage, 449 home equity loan, 11,112 both second mortgage and home equity loan)
Houses without a mortgage: 2,471
| Here: | 98.6% with mortgage |
| State: | 98.2% with mortgage |
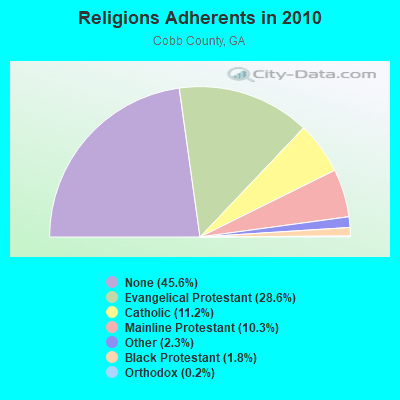
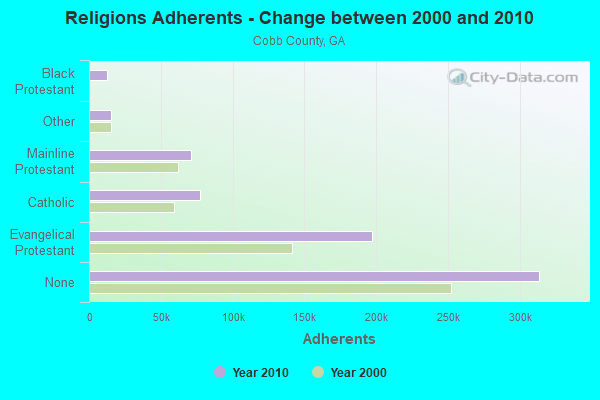
Religion statistics for Cobb County
| Religion | Adherents | Congregations |
|---|---|---|
| Evangelical Protestant | 196,846 | 303 |
| Catholic | 76,988 | 7 |
| Mainline Protestant | 71,018 | 71 |
| Other | 15,543 | 49 |
| Black Protestant | 12,228 | 18 |
| Orthodox | 1,700 | 1 |
| None | 313,755 | - |
Source: Clifford Grammich, Kirk Hadaway, Richard Houseal, Dale E.Jones, Alexei Krindatch, Richie Stanley and Richard H.Taylor. 2012. 2010 U.S.Religion Census: Religious Congregations & Membership Study. Association of Statisticians of American Religious Bodies. Jones, Dale E., et al. 2002. Congregations and Membership in the United States 2000. Nashville, TN: Glenmary Research Center.
Food Environment Statistics:
| Cobb County: | 1.42 / 10,000 pop. |
| State: | 1.91 / 10,000 pop. |
| Here: | 0.10 / 10,000 pop. |
| Georgia: | 0.15 / 10,000 pop. |
| This county: | 0.35 / 10,000 pop. |
| Georgia: | 0.86 / 10,000 pop. |
| Cobb County: | 3.35 / 10,000 pop. |
| Georgia: | 5.12 / 10,000 pop. |
| This county: | 8.16 / 10,000 pop. |
| State: | 7.41 / 10,000 pop. |
| Cobb County: | 8.1% |
| Georgia: | 10.4% |
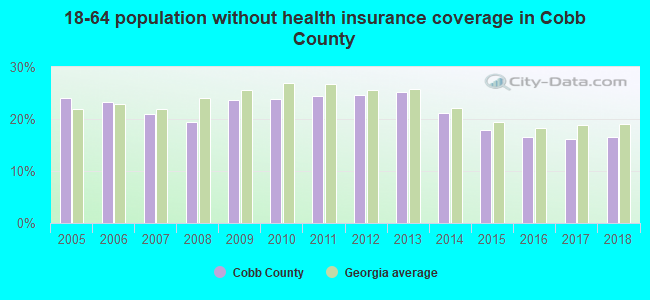
| Cobb County: | 23.8% |
| State: | 27.8% |
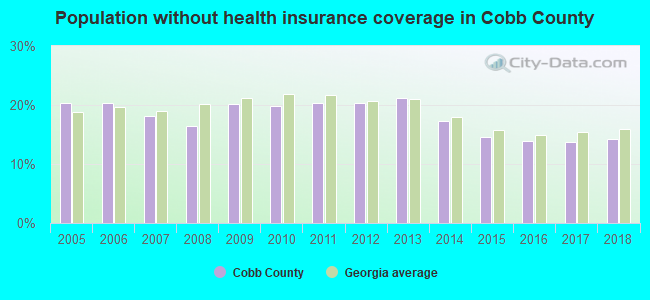
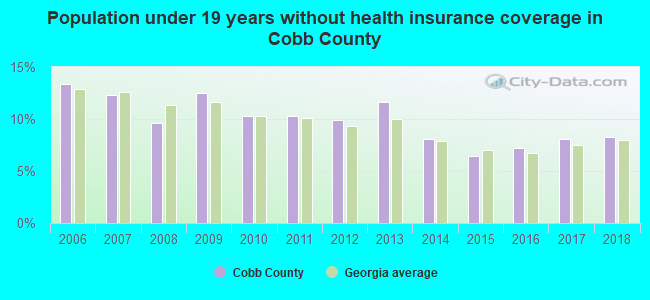
| Here: | 17.4% |
| State: | 14.6% |
Agriculture in Cobb County:
Average size of farms: 57 acresAverage value of agricultural products sold per farm: $28,150
Average value of crops sold per acre for harvested cropland: $5073.25
The value of livestock, poultry, and their products as a percentage of the total market value of agricultural products sold: 5.64%
Average total farm production expenses per farm: $27,743
Harvested cropland as a percentage of land in farms: 9.13%
Irrigated harvested cropland as a percentage of land in farms: 3.30%
Average market value of all machinery and equipment per farm: $21,451
The percentage of farms operated by a family or individual: 91.10%
Average age of principal farm operators: 59 years
Average number of cattle and calves per 100 acres of all land in farms: 7.93
Vegetables: 5 harvested acres
Land in orchards: 15 acres
Earthquake activity:
Cobb County-area historical earthquake activity is significantly above Georgia state average. It is 63% greater than the overall U.S. average.On 4/29/2003 at 08:59:39, a magnitude 4.9 (4.4 MB, 4.6 MW, 4.9 LG, Class: Light, Intensity: IV - V) earthquake occurred 72.4 miles away from Cobb County center
On 8/2/1974 at 08:52:09, a magnitude 4.9 (4.3 MB, 4.9 LG) earthquake occurred 119.0 miles away from the county center
On 4/29/2003 at 08:59:39, a magnitude 4.6 (4.6 MW, Depth: 12.3 mi) earthquake occurred 72.4 miles away from the county center
On 11/30/1973 at 07:48:41, a magnitude 4.7 (4.7 MB, 4.6 ML) earthquake occurred 133.3 miles away from the county center
On 1/18/1999 at 07:00:53, a magnitude 4.8 (4.8 MB, 4.0 LG, Depth: 0.6 mi) earthquake occurred 159.5 miles away from Cobb County center
On 12/12/2018 at 09:14:43, a magnitude 4.4 (4.4 MW, Depth: 4.9 mi) earthquake occurred 116.4 miles away from the county center
Magnitude types: regional Lg-wave magnitude (LG), body-wave magnitude (MB), local magnitude (ML), moment magnitude (MW)
Most recent natural disasters:
- Georgia Covid-19 Pandemic, Incident Period: January 20, 2020, FEMA Id: 4501, Natural disaster type: Other
- Georgia Severe Winter Storm, Incident Period: February 10, 2014 to February 14, 2014, Emergency Declared EM-3368: February 11, 2014, FEMA Id: 3368, Natural disaster type: Winter Storm
- Georgia Severe Storms and Flooding, Incident Period: September 18, 2009 to October 08, 2009, Major Disaster (Presidential) Declared DR-1858: September 24, 2009, FEMA Id: 1858, Natural disaster type: Storm, Flood
- Georgia Hurricane Katrina Evacuation, Incident Period: August 27, 2005 to October 01, 2005, Emergency Declared EM-3218: September 05, 2005, FEMA Id: 3218, Natural disaster type: Hurricane
- Georgia Hurricane Ivan, Incident Period: September 14, 2004 to October 30, 2004, Major Disaster (Presidential) Declared DR-1554: September 18, 2004, FEMA Id: 1554, Natural disaster type: Hurricane
- Georgia Winter Storm, Incident Period: January 22, 2000 to February 01, 2000, Major Disaster (Presidential) Declared DR-1311: January 28, 2000, FEMA Id: 1311, Natural disaster type: Winter Storm
- Georgia Severe Storms, Tornadoes and Flooding, Incident Period: February 14, 1998 to May 11, 1998, Major Disaster (Presidential) Declared DR-1209: March 11, 1998, FEMA Id: 1209, Natural disaster type: Storm, Tornado, Flood
- Georgia Hurricane Opal, Incident Period: October 04, 1995 to October 05, 1995, Major Disaster (Presidential) Declared DR-1071: October 10, 1995, FEMA Id: 1071, Natural disaster type: Hurricane
- Georgia Severe Snowfall, Winter Storm, Incident Period: March 13, 1993 to March 17, 1993, Emergency Declared EM-3097: March 15, 1993, FEMA Id: 3097, Natural disaster type: Winter Storm, Snowfall
- Georgia Tornadoes, High Winds, Heavy Rain, Incident Period: February 21, 1993 to February 22, 1993, Major Disaster (Presidential) Declared DR-980: March 04, 1993, FEMA Id: 980, Natural disaster type: Tornado, Wind, Heavy Rain
- 4 other natural disasters have been reported since 1953.
The number of natural disasters in Cobb County (14) is near the US average (15).
Major Disasters (Presidential) Declared: 9
Emergencies Declared: 4
Causes of natural disasters: Floods: 4, Tornadoes: 4, Hurricanes: 3, Storms: 3, Winter Storms: 3, Heavy Rains: 2, Winds: 2, Drought: 1, Snowfall: 1, Other: 1 (Note: some incidents may be assigned to more than one category).
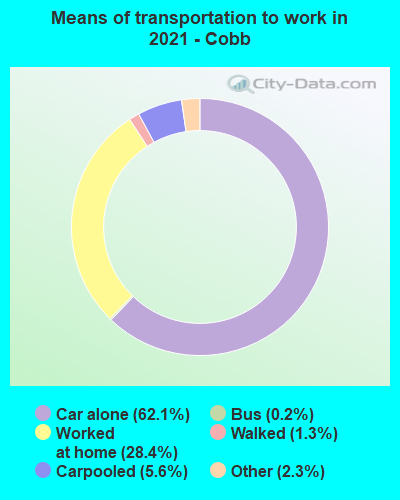
Means of transportation to work:
- Drove a car alone: 275,668 (63.9%)
- Carpooled: 35,276 (8.2%)
- Bus: 2,147 (0.5%)
- Subway or elevated rail: 64 (0.0%)
- Light rail, streetcar or trolley: 313 (0.1%)
- Ferryboat: 86 (0.0%)
- Taxicab, motorcycle, or other means: 9,759 (2.3%)
- Bicycle: 65 (0.0%)
- Walked: 5,275 (1.2%)
- Worked at home: 102,794 (23.8%)
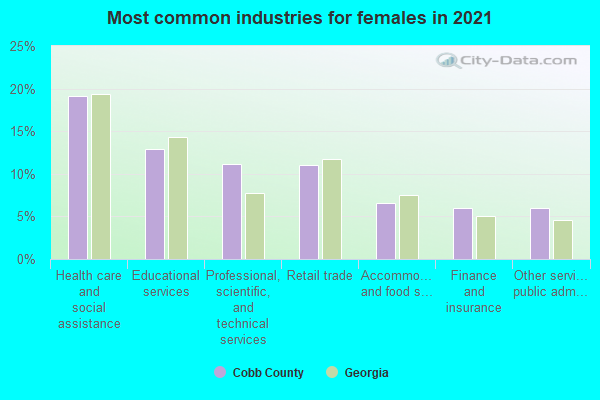
- Health care and social assistance (16%)
- Educational services (11%)
- Professional, scientific, and technical services (11%)
- Retail trade (10%)
- Accommodation and food services (6%)
- Finance and insurance (6%)
- Other services, except public administration (5%)
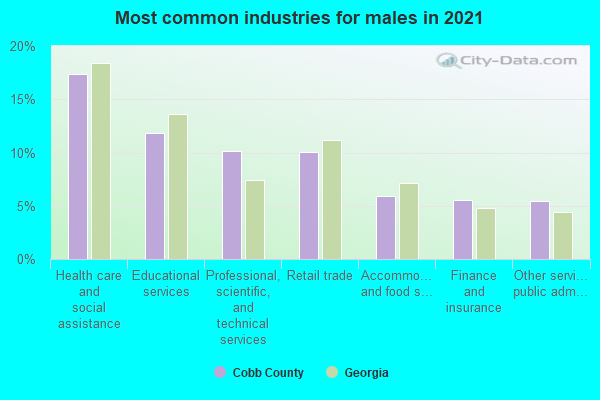
- Health care and social assistance (18%)
- Educational services (12%)
- Professional, scientific, and technical services (12%)
- Retail trade (11%)
- Accommodation and food services (7%)
- Finance and insurance (7%)
- Other services, except public administration (6%)
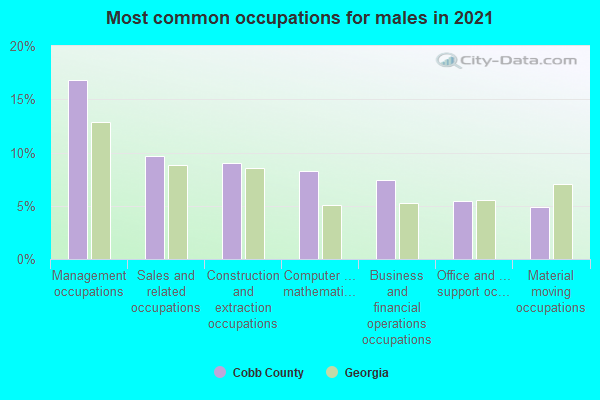
- Management occupations (16%)
- Sales and related occupations (11%)
- Construction and extraction occupations (8%)
- Computer and mathematical occupations (8%)
- Business and financial operations occupations (7%)
- Office and administrative support occupations (6%)
- Material moving occupations (5%)
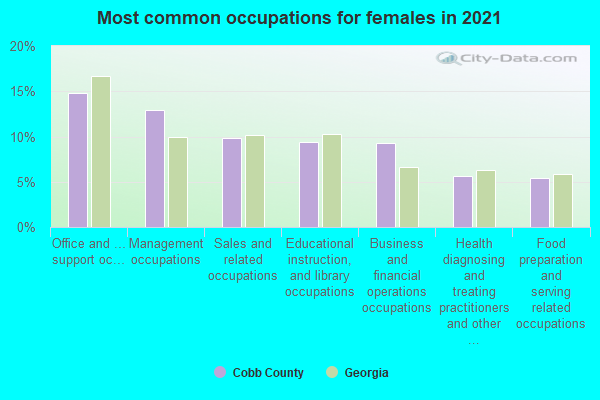
- Management occupations (15%)
- Office and administrative support occupations (14%)
- Sales and related occupations (10%)
- Business and financial operations occupations (9%)
- Educational instruction, and library occupations (9%)
- Food preparation and serving related occupations (6%)
- Health diagnosing and treating practitioners and other technical occupations (6%)
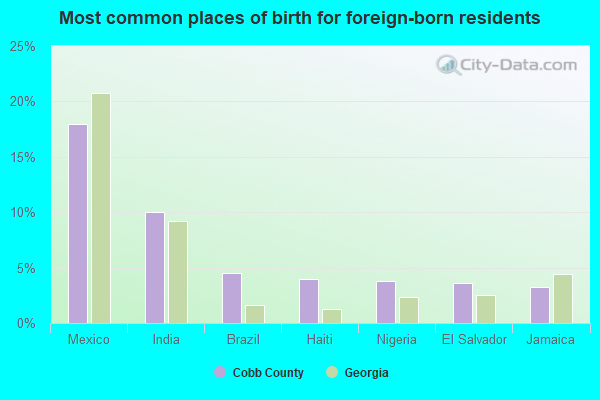
- Mexico (17%)
- India (10%)
- Brazil (5%)
- Haiti (4%)
- Nigeria (4%)
- Guatemala (4%)
- Jamaica (4%)
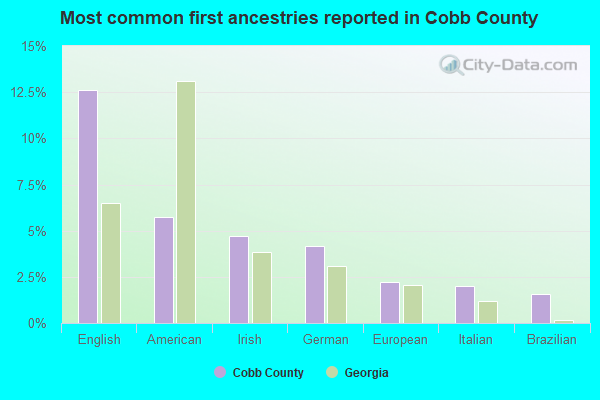
- English (12%)
- American (6%)
- Irish (5%)
- German (4%)
- European (2%)
- Italian (2%)
- Haitian (2%)
People in group quarters in Cobb County, Georgia in 2010:
- 3,900 people in college/university student housing
- 2,158 people in local jails and other municipal confinement facilities
- 1,620 people in nursing facilities/skilled-nursing facilities
- 261 people in correctional residential facilities
- 207 people in emergency and transitional shelters (with sleeping facilities) for people experiencing homelessness
- 203 people in group homes intended for adults
- 154 people in mental (psychiatric) hospitals and psychiatric units in other hospitals
- 146 people in other noninstitutional facilities
- 138 people in hospitals with patients who have no usual home elsewhere
- 65 people in correctional facilities intended for juveniles
- 59 people in group homes for juveniles (non-correctional)
- 51 people in workers' group living quarters and job corps centers
- 36 people in military barracks and dormitories (nondisciplinary)
- 36 people in residential treatment centers for adults
- 21 people in in-patient hospice facilities
- 13 people in residential treatment centers for juveniles (non-correctional)
People in group quarters in Cobb County, Georgia in 2000:
- 2,245 people in other noninstitutional group quarters
- 2,192 people in local jails and other confinement facilities (including police lockups)
- 1,625 people in nursing homes
- 347 people in college dormitories (includes college quarters off campus)
- 159 people in military barracks, etc.
- 144 people in homes or halfway houses for drug/alcohol abuse
- 137 people in homes for the mentally ill
- 126 people in hospitals or wards for drug/alcohol abuse
- 125 people in homes for the physically handicapped
- 49 people in short-term care, detention or diagnostic centers for delinquent children
- 27 people in training schools for juvenile delinquents
- 23 people in state prisons
- 20 people in hospitals/wards and hospices for chronically ill
- 20 people in homes for the mentally retarded
- 16 people in unknown juvenile institutions
- 15 people in mental (psychiatric) hospitals or wards
- 10 people in hospices or homes for chronically ill
- 10 people in military hospitals or wards for chronically ill
- 7 people in other group homes
- 6 people in religious group quarters
- 6 people in other nonhousehold living situations
- 5 people in orthopedic wards and institutions for the physically handicapped
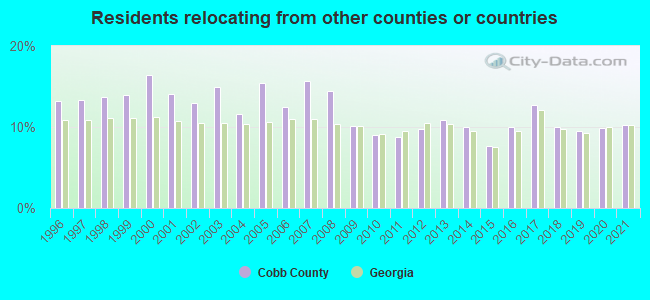
10.27% of this county's 2021 resident taxpayers lived in other counties in 2020 ($69,386 average adjusted gross income)
| Here: | 10.27% |
| Georgia average: | 10.21% |
0.01% of residents moved from foreign countries ($96 average AGI)
Cobb County: 0.01% Georgia average: 0.04%
6.29% relocated from other counties in Georgia ($40,906 average AGI)
3.97% relocated from other states ($28,383 average AGI)
Cobb County: 3.97% Georgia average: 3.80%
Top counties from which taxpayers relocated into this county between 2020 and 2021:
| from Fulton County, GA | |
| from DeKalb County, GA | |
| from Cherokee County, GA | |
| from Paulding County, GA | |
| from Gwinnett County, GA | |
| from Douglas County, GA | |
| from Clayton County, GA |
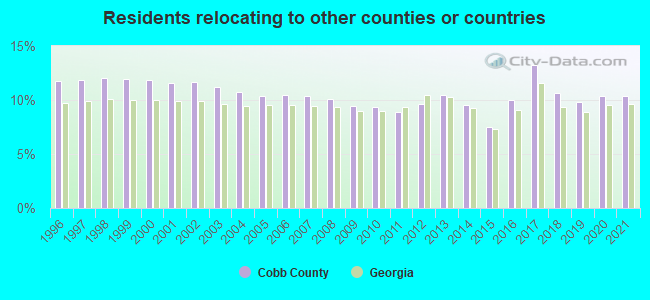
10.33% of this county's 2020 resident taxpayers moved to other counties in 2021 ($75,526 average adjusted gross income)
| Here: | 10.33% |
| Georgia average: | 9.60% |
0.03% of residents moved to foreign countries ($156 average AGI)
Cobb County: 0.03% Georgia average: 0.03%
7.01% relocated to other counties in Georgia ($48,961 average AGI)
3.29% relocated to other states ($26,410 average AGI)
Cobb County: 3.29% Georgia average: 3.15%
Top counties to which taxpayers relocated from this county between 2020 and 2021:
| to Fulton County, GA | |
| to Cherokee County, GA | |
| to Paulding County, GA | |
| to DeKalb County, GA | |
| to Douglas County, GA | |
| to Gwinnett County, GA | |
| to Bartow County, GA |
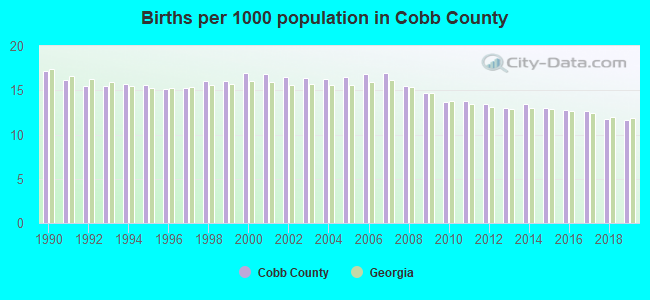
Births per 1000 population from 1990 to 1999: 15.8
Births per 1000 population from 2000 to 2009: 16.3
Births per 1000 population from 2010 to 2022: 10.8
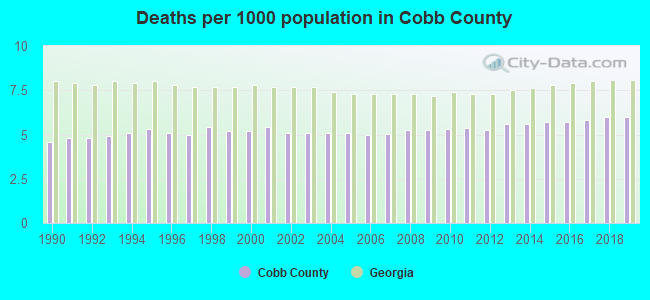
Deaths per 1000 population from 1990 to 1999: 5.0
Deaths per 1000 population from 2000 to 2009: 5.2
Deaths per 1000 population from 2010 to 2020: 5.8
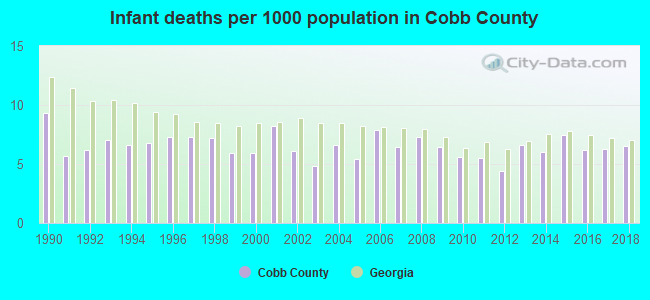
Infant deaths per 1000 live births from 1990 to 1999: 6.9
Infant deaths per 1000 live births from 2000 to 2009: 6.5
Infant deaths per 1000 live births from 2010 to 2021: 5.7
Persons under 19 years old without health insurance coverage in 2018: 8.3%
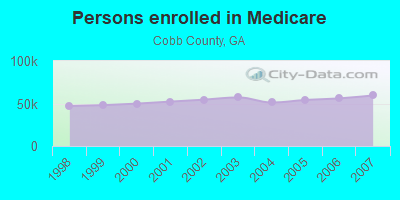
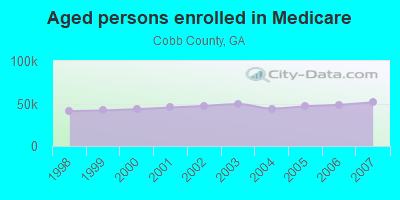
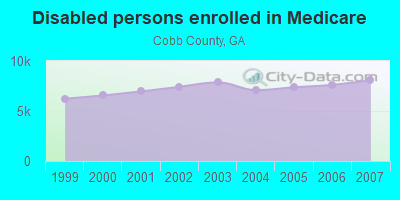
Persons enrolled in hospital insurance and/or supplemental medical insurance (Medicare) in July 1, 2007: 59,478 (51,383 aged, 8,095 disabled)
Children under 18 without health insurance coverage in 2007: 21,661 (11%)
Most common underlying causes of death in Cobb County, Georgia in 1999 - 2019:
- Bronchus or lung, unspecified - Malignant neoplasms (4,387)
- Atherosclerotic heart disease (3,508)
- Unspecified dementia (3,000)
- Chronic obstructive pulmonary disease, unspecified (2,791)
- Alzheimer disease, unspecified (2,600)
- Stroke, not specified as haemorrhage or infarction (2,227)
- Acute myocardial infarction, unspecified (2,203)
- Congestive heart failure (2,010)
- Heart disease, unspecified (1,912)
- Breast, unspecified - Malignant neoplasms (1,588)
Population without health insurance coverage in 2000: 15%
Children under 18 without health insurance coverage in 2000: 16%
Short term general hospital admissions per 100,000 population in 2004: 8,893
Short term general hospital beds per 100,000 population in 2004: 137
Emergency room visits per 100,000 population in 2004: 31,693
General practice office based MDs per 100,000 population in 2005: 1,602
Medical specialist MDs per 100,000 population in 2005: 510
Dentists per 100,000 population in 1998: 10
Total births per 100,000 population, July 2005 - July 2006 : 42
Total deaths per 100,000 population, July 2005 - July 2006: 88
Limited-service eating places per 100,000 population in 2005 : 12
Beer, wine & liquor stores per 100,000 population in 2005: 1
Homicides per 1,000,000 population from 2000 to 2006: 52.8. This is less than state average.
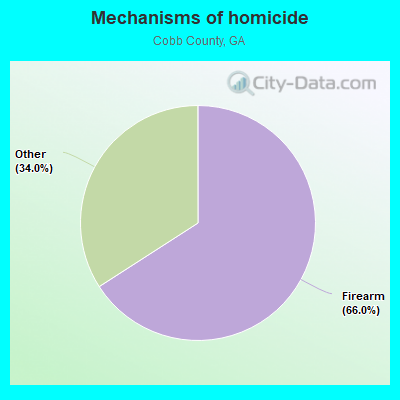
- Firearm - 34.8
- Other - 18.0
Suicides per 1,000,000 population from 2000 to 2006: 86.5. This is less than state average.
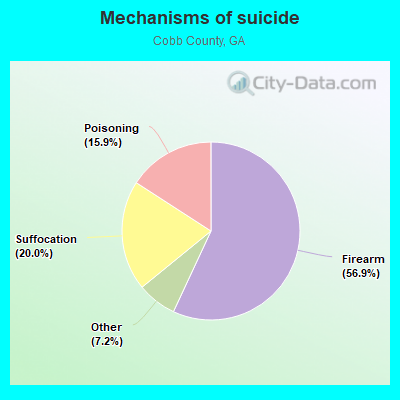
- Firearm - 49.2
- Suffocation - 17.3
- Poisoning - 13.7
- Other - 6.2
Household type by relationship:
Households: 771,952- Male householders: 144,386 (31,366 living alone), Female householders: 153,853 (43,920 living alone)
150,451 spouses (148,902 opposite-sex spouses), 16,550 unmarried partners, (15,620 opposite-sex unmarried partners), 218,379 children (206,688 natural, 3,336 adopted, 8,355 stepchildren), 14,593 grandchildren, 10,514 brothers or sisters, 13,041 parents, 279 foster children, 13,259 other relatives, 28,080 non-relatives
- In group quarters: 8,567
Size of family households: 81,796 2-persons, 49,949 3-persons, 42,119 4-persons, 16,958 5-persons, 6,241 6-persons, 3,973 7-or-more-persons.
Size of nonfamily households: 75,286 1-person, 15,461 2-persons, 4,851 3-persons, 1,392 4-persons, 213 6-persons.
119,254 married couples with children.
35,980 single-parent households (7,695 men, 28,285 women).
78.5% of residents of Cobb speak English at home.
11.0% of residents speak Spanish at home (57% speak English very well, 16% speak English well, 16% speak English not well, 11% don't speak English at all).
5.7% of residents speak other Indo-European language at home (71% speak English very well, 17% speak English well, 7% speak English not well, 5% don't speak English at all).
2.5% of residents speak Asian or Pacific Island language at home (61% speak English very well, 23% speak English well, 13% speak English not well, 3% don't speak English at all).
2.3% of residents speak other language at home (91% speak English very well, 7% speak English well, 2% speak English not well).
In fiscal year 2004:
Federal Government expenditure: $2,979,573,000 ($4,556 per capita)
Department of Defense expenditure: $1,337,218,000
Federal direct payments to individuals for retirement and disability: $1,024,498,000
Federal other direct payments to individuals: $364,008,000
Federal direct payments not to individuals: $2,549,000
Federal grants: $206,606,000
Federal procurement contracts: $1,159,222,000 ($1,078,327,000 Department of Defense)
Federal salaries and wages: $222,691,000 ($134,999,000 Department of Defense)
Federal Government direct loans: $502,000
Federal guaranteed/insured loans: $621,236,000
Federal Government insurance: $423,723,000
Population change from April 1, 2000 to July 1, 2005:
Births: 55,427| Here: | 83 per 1000 residents |
| State: | 79 per 1000 residents |
Deaths: 17,125
| Here: | 26 per 1000 residents |
| State: | 38 per 1000 residents |
Net international migration: +23,777
| Here: | +36 per 1000 residents |
| State: | +21 per 1000 residents |
Net internal migration: -5,098
| Here: | |
| State: |
Total withdrawal of fresh water for public supply: 96.78 millions of gallons per day (0% from ground, 100% from surface)
| Here: | 7.6 |
| State: | 6.8 |
| Here: | 4.2 |
| State: | 4.6 |
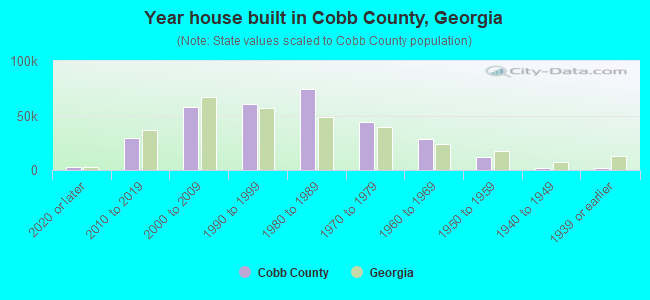
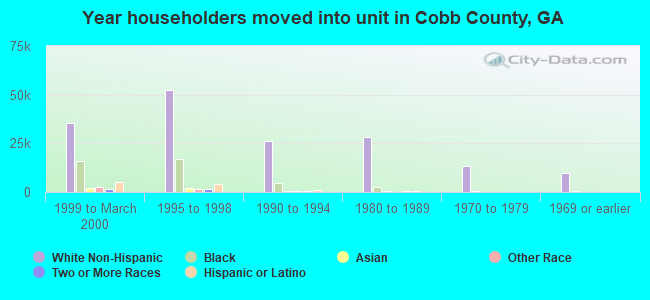
- Year house built in Cobb County, Georgia
- 5,3262020 or later
- 32,2382010 to 2019
- 58,0182000 to 2009
- 57,0411990 to 1999
- 75,4561980 to 1989
- 45,1861970 to 1979
- 21,7541960 to 1969
- 13,9831950 to 1959
- 2,7911940 to 1949
- 2,5391939 or earlier
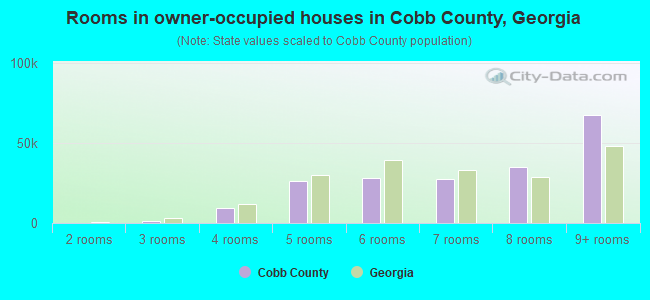
- Rooms in owner-occupied houses in Cobb County, Georgia
- 4611 room
- 4852 rooms
- 2,3113 rooms
- 10,3674 rooms
- 22,9795 rooms
- 31,0836 rooms
- 28,5207 rooms
- 33,9808 rooms
- 68,8109+ rooms
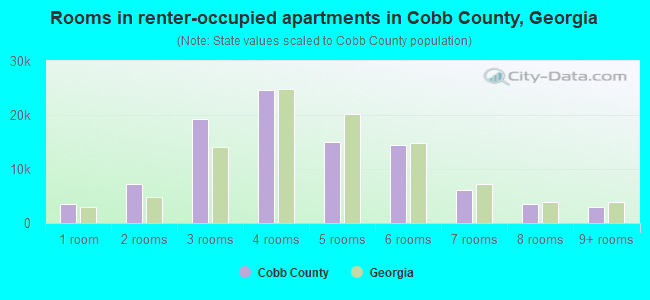
- Rooms in renter-occupied apartments in Cobb County, Georgia
- 1,8261 room
- 8,0072 rooms
- 19,8843 rooms
- 27,2084 rooms
- 19,2545 rooms
- 11,1216 rooms
- 6,1037 rooms
- 2,9568 rooms
- 2,8849+ rooms
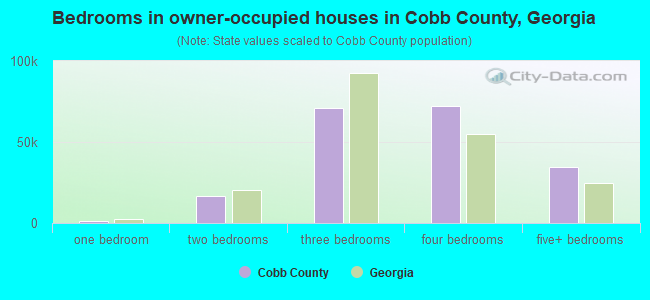
- Bedrooms in owner-occupied houses in Cobb County, Georgia
- 619no bedroom
- 1,6211 bedroom
- 16,8672 bedrooms
- 73,8753 bedrooms
- 68,4734 bedrooms
- 37,5415+ bedrooms
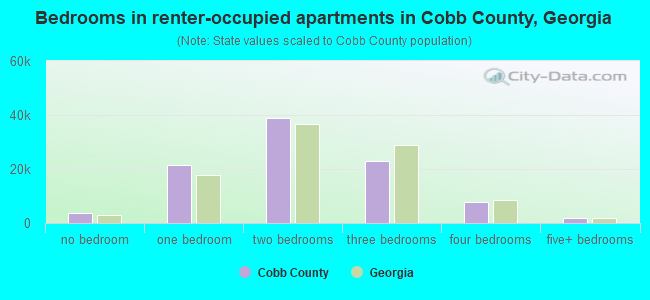
- Bedrooms in renter-occupied apartments in Cobb County, Georgia
- 2,005no bedroom
- 24,6441 bedroom
- 39,9322 bedrooms
- 24,0013 bedrooms
- 7,1314 bedrooms
- 1,5305+ bedrooms
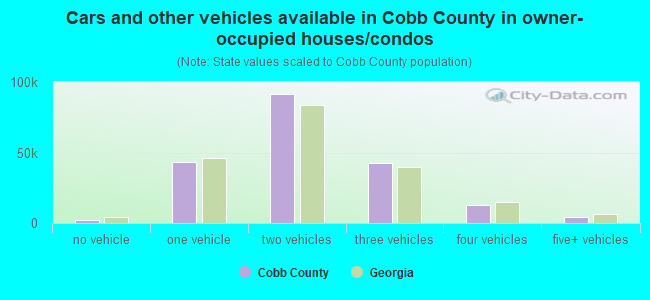
- Cars and other vehicles available in Cobb County in owner-occupied houses/condos
- 2,255no vehicle
- 44,3271 vehicle
- 94,8472 vehicles
- 40,1253 vehicles
- 13,7704 vehicles
- 3,6725+ vehicles
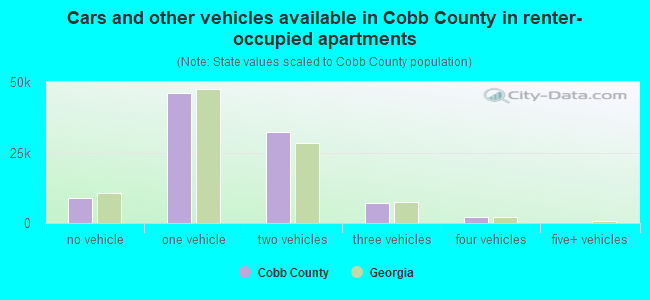
- Cars and other vehicles available in Cobb County in renter-occupied apartments
- 9,052no vehicle
- 43,9701 vehicle
- 34,5532 vehicles
- 9,0743 vehicles
- 2,1064 vehicles
- 4885+ vehicles
86.4% of Cobb County residents lived in the same house 1 years ago.
Out of people who lived in different houses, 29% lived in this county.
Out of people who lived in different counties, 57% lived in Georgia.
| Cobb County: | 86.4% |
| State average: | 86.6% |
Place of birth for U.S.-born residents:
- This state: 298,751
- Other state: 333,345
- Northeast: 71,816
- Midwest: 76,395
- South: 153,932
- West: 31,202
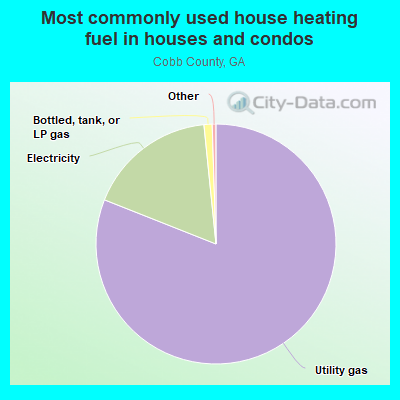
- 80.6%Utility gas
- 17.8%Electricity
- 1.1%Bottled, tank, or LP gas
- 0.2%No fuel used
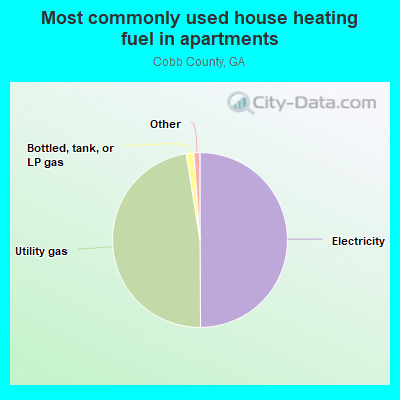
- 51.7%Electricity
- 45.8%Utility gas
- 1.4%Bottled, tank, or LP gas
- 0.6%No fuel used
- 0.3%Fuel oil, kerosene, etc.
- 0.1%Other fuel
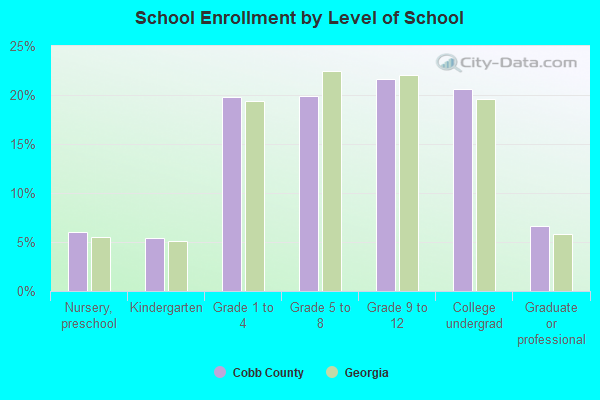
Private vs. public school enrollment:
| Here: | 12.6% |
| Georgia: | 12.1% |
| Here: | 12.2% |
| Georgia: | 10.8% |
| Here: | 11.8% |
| Georgia: | 17.1% |
Cobb County government finances - Expenditure in 2018:
- Bond Funds - Cash and Securities: $55,302,000
Cash and Securities: $44,544,000
- Charges - Sewerage: $159,276,000
Sewerage: $104,351,000
Other: $72,245,000
Other: $60,794,000
Parks and Recreation: $33,140,000
Parks and Recreation: $32,155,000
Regular Highways: $6,848,000
Regular Highways: $4,419,000
Solid Waste Management: $499,000
Solid Waste Management: $495,000
- Construction - Regular Highways: $128,066,000
Parks and Recreation: $103,419,000
Regular Highways: $74,069,000
General - Other: $15,834,000
Libraries: $10,051,000
Libraries: $8,900,000
Local Fire Protection: $7,996,000
Parks and Recreation: $6,273,000
General Public Buildings: $5,718,000
General Public Buildings: $4,158,000
Local Fire Protection: $3,436,000
Health - Other: $3,309,000
General - Other: $1,546,000
Correctional Institutions: $474,000
Correctional Institutions: $454,000
Financial Administration: $289,000
Financial Administration: $51,000
Judicial and Legal Services: $29,000
Health - Other: $15,000
Central Staff Services: $5,000
- Current Operations - Police Protection: $149,012,000
Sewerage: $113,416,000
Water Utilities: $105,758,000
Police Protection: $102,811,000
Local Fire Protection: $89,386,000
Local Fire Protection: $80,342,000
Sewerage: $73,168,000
Judicial and Legal Services: $70,936,000
Water Utilities: $70,250,000
General - Other: $69,937,000
General - Other: $68,236,000
Judicial and Legal Services: $65,128,000
Parks and Recreation: $55,187,000
Correctional Institutions: $52,079,000
Parks and Recreation: $49,083,000
Financial Administration: $39,441,000
Regular Highways: $27,368,000
Regular Highways: $26,678,000
Financial Administration: $22,466,000
Central Staff Services: $21,641,000
Correctional Institutions: $21,240,000
Central Staff Services: $17,485,000
Libraries: $13,784,000
Libraries: $12,230,000
General Public Buildings: $11,039,000
General Public Buildings: $10,611,000
Housing and Community Development: $7,105,000
Housing and Community Development: $6,821,000
Health - Other: $3,483,000
Health - Other: $3,327,000
Solid Waste Management: $1,133,000
Natural Resources - Other: $699,000
Natural Resources - Other: $588,000
Solid Waste Management: $376,000
Protective Inspection and Regulation - Other: $307,000
Parking Facilities: $228,000
- Federal Intergovernmental - Other: $16,609,000
Other: $7,007,000
Public Welfare: $6,806,000
Housing and Community Development: $6,352,000
Housing and Community Development: $6,282,000
Public Welfare: $5,107,000
General Local Government Support: $37,000
General Local Government Support: $24,000
- General - Interest on Debt: $47,422,000
Interest on Debt: $31,277,000
- Intergovernmental to Local - Other - General - Other: $88,823,000
Other - General - Other: $65,394,000
Other - Parks and Recreation: $7,652,000
Other - Parks and Recreation: $6,552,000
Other - Electric Utilities: $3,451,000
Other - Electric Utilities: $3,364,000
Other - Water Utilities: $74,000
Other - Regular Highways: $65,000
Other - Water Utilities: $60,000
Other - Public Welfare - Other: $8,000
Other - Public Welfare - Other: $7,000
Other - Solid Waste Management: $6,000
Other - Regular Highways: $2,000
Other - Solid Waste Management: $1,000
- Local Intergovernmental - Other: $53,309,000
Other: $52,460,000
- Long Term Debt - Beginning Outstanding - Unspecified Public Purpose: $1,269,542,000
Outstanding Unspecified Public Purpose: $1,243,758,000
Beginning Outstanding - Unspecified Public Purpose: $724,689,000
Outstanding Unspecified Public Purpose: $675,179,000
Retired Unspecified Public Purpose: $119,825,000
Issue, Unspecified Public Purpose: $70,315,000
Retired Unspecified Public Purpose: $50,484,000
Issue, Unspecified Public Purpose: $24,700,000
- Miscellaneous - General Revenue - Other: $100,460,000
General Revenue - Other: $92,473,000
Fines and Forfeits: $10,570,000
Special Assessments: $9,455,000
Rents: $9,320,000
Interest Earnings: $9,240,000
Fines and Forfeits: $7,293,000
Rents: $4,206,000
Sale of Property: $2,744,000
Interest Earnings: $2,652,000
Donations From Private Sources: $2,514,000
Donations From Private Sources: $1,336,000
Sale of Property: $456,000
- Other Capital Outlay - Police Protection: $12,675,000
Regular Highways: $11,403,000
Financial Administration: $5,504,000
Local Fire Protection: $4,868,000
Local Fire Protection: $3,922,000
Parks and Recreation: $3,659,000
Regular Highways: $2,757,000
Parks and Recreation: $2,713,000
Financial Administration: $2,675,000
Police Protection: $1,348,000
General Public Building: $1,212,000
General - Other: $1,163,000
General - Other: $858,000
General Public Building: $444,000
Judicial and Legal Services: $254,000
Central Staff Services: $182,000
Libraries: $161,000
Libraries: $152,000
Health - Other: $144,000
Correctional Institutions: $132,000
Judicial and Legal Services: $65,000
Correctional Institutions: $17,000
- Other Funds - Cash and Securities: $364,941,000
Cash and Securities: $318,069,000
- Revenue - Water Utilities: $99,207,000
Water Utilities: $64,904,000
Transit Utilities: $4,453,000
Transit Utilities: $3,992,000
- Short Term Debt Outstanding - Beginning: $90,000,000
End of Fiscal Year: $64,000,000
End of Fiscal Year: $60,000,000
- Sinking Funds - Cash and Securities: $16,038,000
Cash and Securities: $14,729,000
- State Intergovernmental - Other: $47,570,000
Other: $14,944,000
General Local Government Support: $3,037,000
General Local Government Support: $2,279,000
Public Welfare: $1,856,000
Public Welfare: $1,547,000
Water Utilities: $13,000
Sewerage: $13,000
Water Utilities: $1,000
Sewerage: $1,000
- Tax - Property: $419,337,000
Property: $326,867,000
General Sales and Gross Receipts: $158,710,000
General Sales and Gross Receipts: $144,258,000
Insurance Premiums Sales: $32,808,000
Insurance Premiums Sales: $28,405,000
Occupation and Business License - Other: $20,239,000
Other Selective Sales: $18,548,000
Occupation and Business License - Other: $17,495,000
Other Selective Sales: $15,521,000
Other License: $9,402,000
Public Utilities Sales: $9,353,000
Public Utilities Sales: $8,761,000
Other License: $8,110,000
Alcoholic Beverage Sales: $5,304,000
Alcoholic Beverage Sales: $5,185,000
Alcoholic Beverage License: $2,938,000
Alcoholic Beverage License: $2,764,000
- Total Salaries and Wages: $9,927,000
: $9,748,000
- Water Utilities - Interest on Debt: $4,088,000
Interest on Debt: $2,581,000
Cobb County government finances - Revenue in 2018:
- Bond Funds - Cash and Securities: $55,302,000
Cash and Securities: $44,544,000
- Charges - Sewerage: $159,276,000
Sewerage: $104,351,000
Other: $72,245,000
Other: $60,794,000
Parks and Recreation: $33,140,000
Parks and Recreation: $32,155,000
Regular Highways: $6,848,000
Regular Highways: $4,419,000
Solid Waste Management: $499,000
Solid Waste Management: $495,000
- Construction - Regular Highways: $128,066,000
Parks and Recreation: $103,419,000
Regular Highways: $74,069,000
General - Other: $15,834,000
Libraries: $10,051,000
Libraries: $8,900,000
Local Fire Protection: $7,996,000
Parks and Recreation: $6,273,000
General Public Buildings: $5,718,000
General Public Buildings: $4,158,000
Local Fire Protection: $3,436,000
Health - Other: $3,309,000
General - Other: $1,546,000
Correctional Institutions: $474,000
Correctional Institutions: $454,000
Financial Administration: $289,000
Financial Administration: $51,000
Judicial and Legal Services: $29,000
Health - Other: $15,000
Central Staff Services: $5,000
- Current Operations - Police Protection: $149,012,000
Sewerage: $113,416,000
Water Utilities: $105,758,000
Police Protection: $102,811,000
Local Fire Protection: $89,386,000
Local Fire Protection: $80,342,000
Sewerage: $73,168,000
Judicial and Legal Services: $70,936,000
Water Utilities: $70,250,000
General - Other: $69,937,000
General - Other: $68,236,000
Judicial and Legal Services: $65,128,000
Parks and Recreation: $55,187,000
Correctional Institutions: $52,079,000
Parks and Recreation: $49,083,000
Financial Administration: $39,441,000
Regular Highways: $27,368,000
Regular Highways: $26,678,000
Financial Administration: $22,466,000
Central Staff Services: $21,641,000
Correctional Institutions: $21,240,000
Central Staff Services: $17,485,000
Libraries: $13,784,000
Libraries: $12,230,000
General Public Buildings: $11,039,000
General Public Buildings: $10,611,000
Housing and Community Development: $7,105,000
Housing and Community Development: $6,821,000
Health - Other: $3,483,000
Health - Other: $3,327,000
Solid Waste Management: $1,133,000
Natural Resources - Other: $699,000
Natural Resources - Other: $588,000
Solid Waste Management: $376,000
Protective Inspection and Regulation - Other: $307,000
Parking Facilities: $228,000
- Federal Intergovernmental - Other: $16,609,000
Other: $7,007,000
Public Welfare: $6,806,000
Housing and Community Development: $6,352,000
Housing and Community Development: $6,282,000
Public Welfare: $5,107,000
General Local Government Support: $37,000
General Local Government Support: $24,000
- General - Interest on Debt: $47,422,000
Interest on Debt: $31,277,000
- Intergovernmental to Local - Other - General - Other: $88,823,000
Other - General - Other: $65,394,000
Other - Parks and Recreation: $7,652,000
Other - Parks and Recreation: $6,552,000
Other - Electric Utilities: $3,451,000
Other - Electric Utilities: $3,364,000
Other - Water Utilities: $74,000
Other - Regular Highways: $65,000
Other - Water Utilities: $60,000
Other - Public Welfare - Other: $8,000
Other - Public Welfare - Other: $7,000
Other - Solid Waste Management: $6,000
Other - Regular Highways: $2,000
Other - Solid Waste Management: $1,000
- Local Intergovernmental - Other: $53,309,000
Other: $52,460,000
- Long Term Debt - Beginning Outstanding - Unspecified Public Purpose: $1,269,542,000
Outstanding Unspecified Public Purpose: $1,243,758,000
Beginning Outstanding - Unspecified Public Purpose: $724,689,000
Outstanding Unspecified Public Purpose: $675,179,000
Retired Unspecified Public Purpose: $119,825,000
Issue, Unspecified Public Purpose: $70,315,000
Retired Unspecified Public Purpose: $50,484,000
Issue, Unspecified Public Purpose: $24,700,000
- Miscellaneous - General Revenue - Other: $100,460,000
General Revenue - Other: $92,473,000
Fines and Forfeits: $10,570,000
Special Assessments: $9,455,000
Rents: $9,320,000
Interest Earnings: $9,240,000
Fines and Forfeits: $7,293,000
Rents: $4,206,000
Sale of Property: $2,744,000
Interest Earnings: $2,652,000
Donations From Private Sources: $2,514,000
Donations From Private Sources: $1,336,000
Sale of Property: $456,000
- Other Capital Outlay - Police Protection: $12,675,000
Regular Highways: $11,403,000
Financial Administration: $5,504,000
Local Fire Protection: $4,868,000
Local Fire Protection: $3,922,000
Parks and Recreation: $3,659,000
Regular Highways: $2,757,000
Parks and Recreation: $2,713,000
Financial Administration: $2,675,000
Police Protection: $1,348,000
General Public Building: $1,212,000
General - Other: $1,163,000
General - Other: $858,000
General Public Building: $444,000
Judicial and Legal Services: $254,000
Central Staff Services: $182,000
Libraries: $161,000
Libraries: $152,000
Health - Other: $144,000
Correctional Institutions: $132,000
Judicial and Legal Services: $65,000
Correctional Institutions: $17,000
- Other Funds - Cash and Securities: $364,941,000
Cash and Securities: $318,069,000
- Revenue - Water Utilities: $99,207,000
Water Utilities: $64,904,000
Transit Utilities: $4,453,000
Transit Utilities: $3,992,000
- Short Term Debt Outstanding - Beginning: $90,000,000
End of Fiscal Year: $64,000,000
End of Fiscal Year: $60,000,000
- Sinking Funds - Cash and Securities: $16,038,000
Cash and Securities: $14,729,000
- State Intergovernmental - Other: $47,570,000
Other: $14,944,000
General Local Government Support: $3,037,000
General Local Government Support: $2,279,000
Public Welfare: $1,856,000
Public Welfare: $1,547,000
Water Utilities: $13,000
Sewerage: $13,000
Water Utilities: $1,000
Sewerage: $1,000
- Tax - Property: $419,337,000
Property: $326,867,000
General Sales and Gross Receipts: $158,710,000
General Sales and Gross Receipts: $144,258,000
Insurance Premiums Sales: $32,808,000
Insurance Premiums Sales: $28,405,000
Occupation and Business License - Other: $20,239,000
Other Selective Sales: $18,548,000
Occupation and Business License - Other: $17,495,000
Other Selective Sales: $15,521,000
Other License: $9,402,000
Public Utilities Sales: $9,353,000
Public Utilities Sales: $8,761,000
Other License: $8,110,000
Alcoholic Beverage Sales: $5,304,000
Alcoholic Beverage Sales: $5,185,000
Alcoholic Beverage License: $2,938,000
Alcoholic Beverage License: $2,764,000
- Total Salaries and Wages: $9,927,000
: $9,748,000
- Water Utilities - Interest on Debt: $4,088,000
Interest on Debt: $2,581,000
Cobb County government finances - Debt in 2018:
- Bond Funds - Cash and Securities: $55,302,000
Cash and Securities: $44,544,000
- Charges - Sewerage: $159,276,000
Sewerage: $104,351,000
Other: $72,245,000
Other: $60,794,000
Parks and Recreation: $33,140,000
Parks and Recreation: $32,155,000
Regular Highways: $6,848,000
Regular Highways: $4,419,000
Solid Waste Management: $499,000
Solid Waste Management: $495,000
- Construction - Regular Highways: $128,066,000
Parks and Recreation: $103,419,000
Regular Highways: $74,069,000
General - Other: $15,834,000
Libraries: $10,051,000
Libraries: $8,900,000
Local Fire Protection: $7,996,000
Parks and Recreation: $6,273,000
General Public Buildings: $5,718,000
General Public Buildings: $4,158,000
Local Fire Protection: $3,436,000
Health - Other: $3,309,000
General - Other: $1,546,000
Correctional Institutions: $474,000
Correctional Institutions: $454,000
Financial Administration: $289,000
Financial Administration: $51,000
Judicial and Legal Services: $29,000
Health - Other: $15,000
Central Staff Services: $5,000
- Current Operations - Police Protection: $149,012,000
Sewerage: $113,416,000
Water Utilities: $105,758,000
Police Protection: $102,811,000
Local Fire Protection: $89,386,000
Local Fire Protection: $80,342,000
Sewerage: $73,168,000
Judicial and Legal Services: $70,936,000
Water Utilities: $70,250,000
General - Other: $69,937,000
General - Other: $68,236,000
Judicial and Legal Services: $65,128,000
Parks and Recreation: $55,187,000
Correctional Institutions: $52,079,000
Parks and Recreation: $49,083,000
Financial Administration: $39,441,000
Regular Highways: $27,368,000
Regular Highways: $26,678,000
Financial Administration: $22,466,000
Central Staff Services: $21,641,000
Correctional Institutions: $21,240,000
Central Staff Services: $17,485,000
Libraries: $13,784,000
Libraries: $12,230,000
General Public Buildings: $11,039,000
General Public Buildings: $10,611,000
Housing and Community Development: $7,105,000
Housing and Community Development: $6,821,000
Health - Other: $3,483,000
Health - Other: $3,327,000
Solid Waste Management: $1,133,000
Natural Resources - Other: $699,000
Natural Resources - Other: $588,000
Solid Waste Management: $376,000
Protective Inspection and Regulation - Other: $307,000
Parking Facilities: $228,000
- Federal Intergovernmental - Other: $16,609,000
Other: $7,007,000
Public Welfare: $6,806,000
Housing and Community Development: $6,352,000
Housing and Community Development: $6,282,000
Public Welfare: $5,107,000
General Local Government Support: $37,000
General Local Government Support: $24,000
- General - Interest on Debt: $47,422,000
Interest on Debt: $31,277,000
- Intergovernmental to Local - Other - General - Other: $88,823,000
Other - General - Other: $65,394,000
Other - Parks and Recreation: $7,652,000
Other - Parks and Recreation: $6,552,000
Other - Electric Utilities: $3,451,000
Other - Electric Utilities: $3,364,000
Other - Water Utilities: $74,000
Other - Regular Highways: $65,000
Other - Water Utilities: $60,000
Other - Public Welfare - Other: $8,000
Other - Public Welfare - Other: $7,000
Other - Solid Waste Management: $6,000
Other - Regular Highways: $2,000
Other - Solid Waste Management: $1,000
- Local Intergovernmental - Other: $53,309,000
Other: $52,460,000
- Long Term Debt - Beginning Outstanding - Unspecified Public Purpose: $1,269,542,000
Outstanding Unspecified Public Purpose: $1,243,758,000
Beginning Outstanding - Unspecified Public Purpose: $724,689,000
Outstanding Unspecified Public Purpose: $675,179,000
Retired Unspecified Public Purpose: $119,825,000
Issue, Unspecified Public Purpose: $70,315,000
Retired Unspecified Public Purpose: $50,484,000
Issue, Unspecified Public Purpose: $24,700,000
- Miscellaneous - General Revenue - Other: $100,460,000
General Revenue - Other: $92,473,000
Fines and Forfeits: $10,570,000
Special Assessments: $9,455,000
Rents: $9,320,000
Interest Earnings: $9,240,000
Fines and Forfeits: $7,293,000
Rents: $4,206,000
Sale of Property: $2,744,000
Interest Earnings: $2,652,000
Donations From Private Sources: $2,514,000
Donations From Private Sources: $1,336,000
Sale of Property: $456,000
- Other Capital Outlay - Police Protection: $12,675,000
Regular Highways: $11,403,000
Financial Administration: $5,504,000
Local Fire Protection: $4,868,000
Local Fire Protection: $3,922,000
Parks and Recreation: $3,659,000
Regular Highways: $2,757,000
Parks and Recreation: $2,713,000
Financial Administration: $2,675,000
Police Protection: $1,348,000
General Public Building: $1,212,000
General - Other: $1,163,000
General - Other: $858,000
General Public Building: $444,000
Judicial and Legal Services: $254,000
Central Staff Services: $182,000
Libraries: $161,000
Libraries: $152,000
Health - Other: $144,000
Correctional Institutions: $132,000
Judicial and Legal Services: $65,000
Correctional Institutions: $17,000
- Other Funds - Cash and Securities: $364,941,000
Cash and Securities: $318,069,000
- Revenue - Water Utilities: $99,207,000
Water Utilities: $64,904,000
Transit Utilities: $4,453,000
Transit Utilities: $3,992,000
- Short Term Debt Outstanding - Beginning: $90,000,000
End of Fiscal Year: $64,000,000
End of Fiscal Year: $60,000,000
- Sinking Funds - Cash and Securities: $16,038,000
Cash and Securities: $14,729,000
- State Intergovernmental - Other: $47,570,000
Other: $14,944,000
General Local Government Support: $3,037,000
General Local Government Support: $2,279,000
Public Welfare: $1,856,000
Public Welfare: $1,547,000
Water Utilities: $13,000
Sewerage: $13,000
Water Utilities: $1,000
Sewerage: $1,000
- Tax - Property: $419,337,000
Property: $326,867,000
General Sales and Gross Receipts: $158,710,000
General Sales and Gross Receipts: $144,258,000
Insurance Premiums Sales: $32,808,000
Insurance Premiums Sales: $28,405,000
Occupation and Business License - Other: $20,239,000
Other Selective Sales: $18,548,000
Occupation and Business License - Other: $17,495,000
Other Selective Sales: $15,521,000
Other License: $9,402,000
Public Utilities Sales: $9,353,000
Public Utilities Sales: $8,761,000
Other License: $8,110,000
Alcoholic Beverage Sales: $5,304,000
Alcoholic Beverage Sales: $5,185,000
Alcoholic Beverage License: $2,938,000
Alcoholic Beverage License: $2,764,000
- Total Salaries and Wages: $9,927,000
: $9,748,000
- Water Utilities - Interest on Debt: $4,088,000
Interest on Debt: $2,581,000
Cobb County government finances - Cash and Securities in 2018:
- Bond Funds - Cash and Securities: $55,302,000
Cash and Securities: $44,544,000
- Charges - Sewerage: $159,276,000
Sewerage: $104,351,000
Other: $72,245,000
Other: $60,794,000
Parks and Recreation: $33,140,000
Parks and Recreation: $32,155,000
Regular Highways: $6,848,000
Regular Highways: $4,419,000
Solid Waste Management: $499,000
Solid Waste Management: $495,000
- Construction - Regular Highways: $128,066,000
Parks and Recreation: $103,419,000
Regular Highways: $74,069,000
General - Other: $15,834,000
Libraries: $10,051,000
Libraries: $8,900,000
Local Fire Protection: $7,996,000
Parks and Recreation: $6,273,000
General Public Buildings: $5,718,000
General Public Buildings: $4,158,000
Local Fire Protection: $3,436,000
Health - Other: $3,309,000
General - Other: $1,546,000
Correctional Institutions: $474,000
Correctional Institutions: $454,000
Financial Administration: $289,000
Financial Administration: $51,000
Judicial and Legal Services: $29,000
Health - Other: $15,000
Central Staff Services: $5,000
- Current Operations - Police Protection: $149,012,000
Sewerage: $113,416,000
Water Utilities: $105,758,000
Police Protection: $102,811,000
Local Fire Protection: $89,386,000
Local Fire Protection: $80,342,000
Sewerage: $73,168,000
Judicial and Legal Services: $70,936,000
Water Utilities: $70,250,000
General - Other: $69,937,000
General - Other: $68,236,000
Judicial and Legal Services: $65,128,000
Parks and Recreation: $55,187,000
Correctional Institutions: $52,079,000
Parks and Recreation: $49,083,000
Financial Administration: $39,441,000
Regular Highways: $27,368,000
Regular Highways: $26,678,000
Financial Administration: $22,466,000
Central Staff Services: $21,641,000
Correctional Institutions: $21,240,000
Central Staff Services: $17,485,000
Libraries: $13,784,000
Libraries: $12,230,000
General Public Buildings: $11,039,000
General Public Buildings: $10,611,000
Housing and Community Development: $7,105,000
Housing and Community Development: $6,821,000
Health - Other: $3,483,000
Health - Other: $3,327,000
Solid Waste Management: $1,133,000
Natural Resources - Other: $699,000
Natural Resources - Other: $588,000
Solid Waste Management: $376,000
Protective Inspection and Regulation - Other: $307,000
Parking Facilities: $228,000
- Federal Intergovernmental - Other: $16,609,000
Other: $7,007,000
Public Welfare: $6,806,000
Housing and Community Development: $6,352,000
Housing and Community Development: $6,282,000
Public Welfare: $5,107,000
General Local Government Support: $37,000
General Local Government Support: $24,000
- General - Interest on Debt: $47,422,000
Interest on Debt: $31,277,000
- Intergovernmental to Local - Other - General - Other: $88,823,000
Other - General - Other: $65,394,000
Other - Parks and Recreation: $7,652,000
Other - Parks and Recreation: $6,552,000
Other - Electric Utilities: $3,451,000
Other - Electric Utilities: $3,364,000
Other - Water Utilities: $74,000
Other - Regular Highways: $65,000
Other - Water Utilities: $60,000
Other - Public Welfare - Other: $8,000
Other - Public Welfare - Other: $7,000
Other - Solid Waste Management: $6,000
Other - Regular Highways: $2,000
Other - Solid Waste Management: $1,000
- Local Intergovernmental - Other: $53,309,000
Other: $52,460,000
- Long Term Debt - Beginning Outstanding - Unspecified Public Purpose: $1,269,542,000
Outstanding Unspecified Public Purpose: $1,243,758,000
Beginning Outstanding - Unspecified Public Purpose: $724,689,000
Outstanding Unspecified Public Purpose: $675,179,000
Retired Unspecified Public Purpose: $119,825,000
Issue, Unspecified Public Purpose: $70,315,000
Retired Unspecified Public Purpose: $50,484,000
Issue, Unspecified Public Purpose: $24,700,000
- Miscellaneous - General Revenue - Other: $100,460,000
General Revenue - Other: $92,473,000
Fines and Forfeits: $10,570,000
Special Assessments: $9,455,000
Rents: $9,320,000
Interest Earnings: $9,240,000
Fines and Forfeits: $7,293,000
Rents: $4,206,000
Sale of Property: $2,744,000
Interest Earnings: $2,652,000
Donations From Private Sources: $2,514,000
Donations From Private Sources: $1,336,000
Sale of Property: $456,000
- Other Capital Outlay - Police Protection: $12,675,000
Regular Highways: $11,403,000
Financial Administration: $5,504,000
Local Fire Protection: $4,868,000
Local Fire Protection: $3,922,000
Parks and Recreation: $3,659,000
Regular Highways: $2,757,000
Parks and Recreation: $2,713,000
Financial Administration: $2,675,000
Police Protection: $1,348,000
General Public Building: $1,212,000
General - Other: $1,163,000
General - Other: $858,000
General Public Building: $444,000
Judicial and Legal Services: $254,000
Central Staff Services: $182,000
Libraries: $161,000
Libraries: $152,000
Health - Other: $144,000
Correctional Institutions: $132,000
Judicial and Legal Services: $65,000
Correctional Institutions: $17,000
- Other Funds - Cash and Securities: $364,941,000
Cash and Securities: $318,069,000
- Revenue - Water Utilities: $99,207,000
Water Utilities: $64,904,000
Transit Utilities: $4,453,000
Transit Utilities: $3,992,000
- Short Term Debt Outstanding - Beginning: $90,000,000
End of Fiscal Year: $64,000,000
End of Fiscal Year: $60,000,000
- Sinking Funds - Cash and Securities: $16,038,000
Cash and Securities: $14,729,000
- State Intergovernmental - Other: $47,570,000
Other: $14,944,000
General Local Government Support: $3,037,000
General Local Government Support: $2,279,000
Public Welfare: $1,856,000
Public Welfare: $1,547,000
Water Utilities: $13,000
Sewerage: $13,000
Water Utilities: $1,000
Sewerage: $1,000
- Tax - Property: $419,337,000
Property: $326,867,000
General Sales and Gross Receipts: $158,710,000
General Sales and Gross Receipts: $144,258,000
Insurance Premiums Sales: $32,808,000
Insurance Premiums Sales: $28,405,000
Occupation and Business License - Other: $20,239,000
Other Selective Sales: $18,548,000
Occupation and Business License - Other: $17,495,000
Other Selective Sales: $15,521,000
Other License: $9,402,000
Public Utilities Sales: $9,353,000
Public Utilities Sales: $8,761,000
Other License: $8,110,000
Alcoholic Beverage Sales: $5,304,000
Alcoholic Beverage Sales: $5,185,000
Alcoholic Beverage License: $2,938,000
Alcoholic Beverage License: $2,764,000
- Total Salaries and Wages: $9,927,000
: $9,748,000
- Water Utilities - Interest on Debt: $4,088,000
Interest on Debt: $2,581,000
Supplemental Security Income (SSI) in 2006:
- Total number of recipients: 6,398
- Number of aged recipients: 1,037
- Number of blind and disabled recipients: 5,361
- Number of recipients under 18: 1,502
- Number of recipients between 18 and 64: 3,337
- Number of recipients older than 64: 1,559
- Number of recipients also receiving OASDI: 1,807
- Amount of payments (thousands of dollars): 2,956
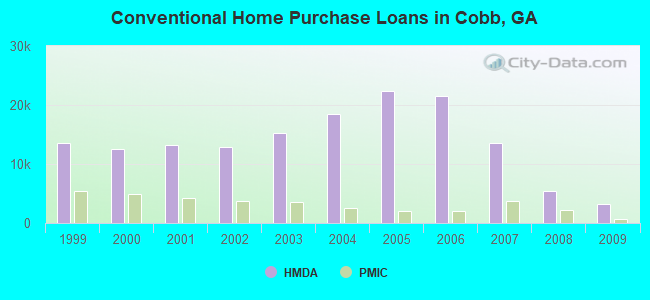
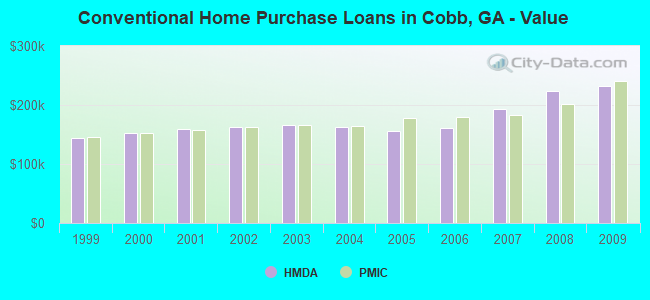
| Home Mortgage Disclosure Act Aggregated Statistics For Year 2009 (Based on 87 full tracts) | ||||||||||||||
| A) FHA, FSA/RHS & VA Home Purchase Loans | B) Conventional Home Purchase Loans | C) Refinancings | D) Home Improvement Loans | E) Loans on Dwellings For 5+ Families | F) Non-occupant Loans on < 5 Family Dwellings (A B C & D) | G) Loans On Manufactured Home Dwelling (A B C & D) | ||||||||
|---|---|---|---|---|---|---|---|---|---|---|---|---|---|---|
| Number | Average Value | Number | Average Value | Number | Average Value | Number | Average Value | Number | Average Value | Number | Average Value | Number | Average Value | |
| LOANS ORIGINATED | 3,553 | $172,408 | 3,144 | $232,724 | 15,592 | $213,030 | 546 | $93,608 | 15 | $14,939,000 | 894 | $154,846 | 10 | $104,900 |
| APPLICATIONS APPROVED, NOT ACCEPTED | 161 | $170,683 | 221 | $226,493 | 1,313 | $208,250 | 99 | $66,101 | 2 | $4,500,000 | 73 | $128,863 | 0 | $0 |
| APPLICATIONS DENIED | 506 | $154,761 | 499 | $199,756 | 5,686 | $204,504 | 491 | $48,334 | 5 | $7,970,800 | 487 | $129,298 | 14 | $43,786 |
| APPLICATIONS WITHDRAWN | 567 | $168,316 | 514 | $216,953 | 4,165 | $206,681 | 164 | $88,378 | 1 | $6,000,000 | 240 | $133,254 | 3 | $47,000 |
| FILES CLOSED FOR INCOMPLETENESS | 82 | $159,220 | 99 | $243,485 | 1,010 | $214,588 | 41 | $132,073 | 0 | $0 | 44 | $148,250 | 0 | $0 |
| Private Mortgage Insurance Companies Aggregated Statistics For Year 2009 (Based on 87 full tracts) | ||||||
| A) Conventional Home Purchase Loans | B) Refinancings | C) Non-occupant Loans on < 5 Family Dwellings (A & B) | ||||
|---|---|---|---|---|---|---|
| Number | Average Value | Number | Average Value | Number | Average Value | |
| LOANS ORIGINATED | 670 | $240,603 | 576 | $226,519 | 16 | $152,062 |
| APPLICATIONS APPROVED, NOT ACCEPTED | 214 | $229,864 | 277 | $224,812 | 14 | $140,214 |
| APPLICATIONS DENIED | 98 | $234,082 | 138 | $222,087 | 8 | $170,500 |
| APPLICATIONS WITHDRAWN | 44 | $223,955 | 73 | $215,836 | 2 | $148,000 |
| FILES CLOSED FOR INCOMPLETENESS | 32 | $245,938 | 22 | $228,727 | 5 | $234,600 |
| Most common first names in Cobb County, GA among deceased individuals | ||
| Name | Count | Lived (average) |
|---|---|---|
| James | 1,789 | 71.1 years |
| Mary | 1,596 | 78.2 years |
| William | 1,512 | 72.2 years |
| John | 1,401 | 73.4 years |
| Robert | 1,131 | 70.7 years |
| Charles | 832 | 71.2 years |
| George | 622 | 74.7 years |
| Dorothy | 573 | 77.6 years |
| Thomas | 514 | 71.9 years |
| Ruth | 473 | 80.9 years |
| Most common last names in Cobb County, GA among deceased individuals | ||
| Last name | Count | Lived (average) |
|---|---|---|
| Smith | 818 | 73.9 years |
| Brown | 490 | 73.0 years |
| Johnson | 441 | 73.2 years |
| Jones | 431 | 72.1 years |
| Williams | 428 | 73.0 years |
| Davis | 375 | 73.0 years |
| Wilson | 261 | 74.8 years |
| Martin | 254 | 74.7 years |
| Anderson | 228 | 74.3 years |
| Turner | 223 | 74.3 years |
| Businesses in Cobb County, GA | ||||
| Name | Count | Name | Count | |
|---|---|---|---|---|
| ALDI | 4 | Justice | 4 | |
| ALDO | 1 | KFC | 12 | |
| AMF Bowling | 1 | Kincaid | 2 | |
| AT&T | 18 | Kmart | 1 | |
| Abercrombie & Fitch | 1 | Knights Inn | 1 | |
| Abercrombie Kids | 1 | Kohl's | 3 | |
| Ace Hardware | 4 | Kroger | 18 | |
| Advance Auto Parts | 18 | LA Fitness | 7 | |
| Aeropostale | 2 | La Quinta | 3 | |
| Aerosoles | 1 | La-Z-Boy | 1 | |
| American Eagle Outfitters | 4 | Lane Bryant | 3 | |
| Ann Taylor | 3 | Lane Furniture | 4 | |
| Applebee's | 4 | LensCrafters | 5 | |
| Arby's | 14 | Little Caesars Pizza | 12 | |
| Ashley Furniture | 1 | Long John Silver's | 1 | |
| Audi | 1 | Lowe's | 3 | |
| AutoZone | 11 | Macy's | 3 | |
| Avenue | 1 | Marriott | 11 | |
| BMW | 1 | Marshalls | 4 | |
| Bakers | 2 | MasterBrand Cabinets | 10 | |
| Bally Total Fitness | 1 | Mazda | 1 | |
| Banana Republic | 2 | McDonald's | 33 | |
| Barnes & Noble | 3 | Men's Wearhouse | 4 | |
| Baskin-Robbins | 8 | Motel 6 | 2 | |
| Bath & Body Works | 4 | Motherhood Maternity | 6 | |
| Baymont Inn | 1 | New Balance | 8 | |
| Bebe | 2 | New York & Co | 2 | |
| Bed Bath & Beyond | 3 | Nike | 40 | |
| Ben & Jerry's | 2 | Nissan | 2 | |
| Best Western | 2 | Office Depot | 5 | |
| Blockbuster | 12 | OfficeMax | 5 | |
| Brookstone | 1 | Old Navy | 3 | |
| Brunswick Bowling & Billiards | 3 | Olive Garden | 2 | |
| Budget Car Rental | 3 | On The Border | 1 | |
| Buffalo Wild Wings | 1 | Outback | 1 | |
| Burger King | 16 | Outback Steakhouse | 1 | |
| CVS | 24 | Pac Sun | 1 | |
| Cache | 1 | Panda Express | 6 | |
| CarMax | 1 | Panera Bread | 5 | |
| Caribou Coffee | 2 | Payless | 9 | |
| Casual Male XL | 2 | Penske | 8 | |
| Catherines | 2 | PetSmart | 5 | |
| Charlotte Russe | 2 | Pier 1 Imports | 3 | |
| Chevrolet | 3 | Pizza Hut | 13 | |
| Chick-Fil-A | 20 | Plato's Closet | 1 | |
| Chico's | 3 | Popeyes | 4 | |
| Chipotle | 2 | Pottery Barn | 1 | |
| Chuck E. Cheese's | 3 | Publix Super Markets | 24 | |
| Church's Chicken | 3 | Quality | 3 | |
| Cinnabon | 2 | Quiznos | 9 | |
| Circle K | 3 | RadioShack | 8 | |
| Cold Stone Creamery | 5 | Ramada | 1 | |
| Coldwater Creek | 2 | Red Lobster | 3 | |
| ColorTyme | 1 | Red Roof Inn | 2 | |
| Comfort Inn | 3 | Rite Aid | 19 | |
| Comfort Suites | 2 | Rooms To Go | 4 | |
| Costco | 2 | Ruby Tuesday | 4 | |
| Cracker Barrel | 2 | Rue21 | 2 | |
| Curves | 6 | Ryder Rental & Truck Leasing | 1 | |
| DHL | 9 | SAS Shoes | 2 | |
| Dairy Queen | 9 | SONIC Drive-In | 3 | |
| Days Inn | 2 | Sam's Club | 1 | |
| Decora Cabinetry | 6 | Sears | 8 | |
| Discount Tire | 3 | Sephora | 2 | |
| Domino's Pizza | 2 | Sheraton | 1 | |
| DressBarn | 2 | Shoe Carnival | 1 | |
| Dressbarn | 3 | Sleep Inn | 2 | |
| Dunkin Donuts | 15 | Soma Intimates | 2 | |
| Econo Lodge | 2 | Spencer Gifts | 2 | |
| Eddie Bauer | 2 | Sprint Nextel | 9 | |
| Express | 2 | Staples | 3 | |
| Extended Stay America | 2 | Starbucks | 26 | |
| Extended Stay Deluxe | 3 | Steak 'n Shake | 4 | |
| Famous Footwear | 3 | Studio 6 | 1 | |
| FedEx | 118 | Studio Plus Deluxe Studios | 1 | |
| Finish Line | 2 | Subaru | 1 | |
| Firestone Complete Auto Care | 8 | Suburban | 1 | |
| Foot Locker | 3 | Subway | 33 | |
| Ford | 3 | Super 8 | 3 | |
| Forever 21 | 3 | T-Mobile | 20 | |
| Fredericks Of Hollywood | 1 | T.G.I. Driday's | 1 | |
| GNC | 18 | T.J.Maxx | 4 | |
| GameStop | 9 | Taco Bell | 18 | |
| Gap | 3 | Talbots | 3 | |
| Goodwill | 1 | Target | 7 | |
| Gymboree | 4 | The Athlete's Foot | 1 | |
| H&M | 2 | The Cheesecake Factory | 1 | |
| H&R Block | 23 | The Limited | 1 | |
| Haagen-Dazs | 3 | Torrid | 1 | |
| Hardee's | 2 | Toyota | 2 | |
| Havertys Furniture | 2 | Toys"R"Us | 5 | |
| Hilton | 10 | Trader Joe's | 1 | |
| Hobby Lobby | 2 | Travelodge | 1 | |
| Holiday Inn | 5 | True Value | 2 | |
| Hollister Co. | 1 | U-Haul | 43 | |
| Home Depot | 10 | UPS | 138 | |
| Homestead Studio Suites | 2 | Value City Furniture | 2 | |
| Honda | 1 | Vans | 4 | |
| Hot Topic | 1 | Verizon Wireless | 5 | |
| Houlihan's | 1 | Victoria's Secret | 4 | |
| Hyatt | 1 | Volkswagen | 2 | |
| Hyundai | 2 | Waffle House | 30 | |
| IHOP | 6 | Walgreens | 20 | |
| InTown Suites | 1 | Walmart | 8 | |
| J.Crew | 1 | Wendy's | 26 | |
| JCPenney | 2 | Wet Seal | 2 | |
| JoS. A. Bank | 4 | Whole Foods Market | 2 | |
| Johnny Rockets | 2 | Wingate | 2 | |
| Jones New York | 11 | World Gym | 1 | |
| Journeys | 2 | YMCA | 3 | |
Cobb County on our top lists:
- #22 on the list of "Top 101 counties with the lowest average weight of females"
- #23 on the list of "Top 101 counties with the best general health status score of residents (1-5), 3 years of data"
- #25 on the list of "Top 101 counties with the most Evangelical Protestant adherents"
- #25 on the list of "Top 101 counties with the most Evangelical Protestant adherents (pop. 50,000+)"
- #43 on the list of "Top 101 counties with the most Mainline Protestant adherents"
- #43 on the list of "Top 101 counties with the most Mainline Protestant adherents (pop. 50,000+)"
- #50 on the list of "Top 101 counties with the lowest number of deaths per 1000 residents 2007-2013 (pop. 50,000+)"
- #56 on the list of "Top 101 counties with the highest surface withdrawal of fresh water for public supply (pop. 50,000+)"
- #58 on the list of "Top 101 counties with the highest surface withdrawal of fresh water for public supply"
- #62 on the list of "Top 101 counties with the highest percentage of residents that exercised in the past month"
- #65 on the list of "Top 101 counties with the largest decrease in the number of births per 1000 residents 2000-2006 to 2007-2013 (pop 50,000+)"
- #65 on the list of "Top 101 counties with the lowest ground withdrawal of fresh water for public supply (pop. 50,000+)"
- #69 on the list of "Top 101 counties with the lowest percentage of residents that smoked 100+ cigarettes in their lives"
- #73 on the list of "Top 101 counties with the highest percentage of residents that drank alcohol in the past 30 days"
- #77 on the list of "Top 101 counties with the most Evangelical Protestant congregations"
- #77 on the list of "Top 101 counties with the most Evangelical Protestant congregations (pop. 50,000+)"
- #79 on the list of "Top 101 counties with the most Black Protestant adherents"
- #79 on the list of "Top 101 counties with the most Black Protestant adherents (pop. 50,000+)"
- #83 on the list of "Top 101 counties with the highest total withdrawal of fresh water for public supply (pop. 50,000+)"
- #85 on the list of "Top 101 counties with the highest total withdrawal of fresh water for public supply"