Orangeburg County, South Carolina (SC)
County owner-occupied free and clear houses and condos in 2010: 11,558
County owner-occupied houses and condos in 2000: 25,806
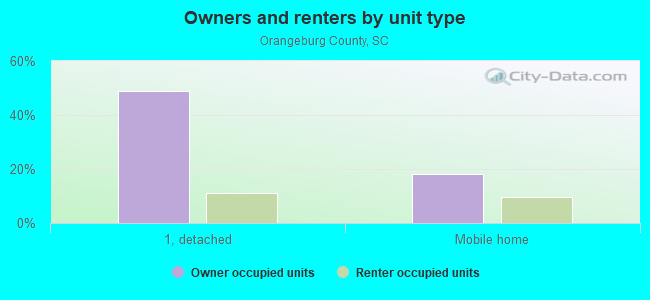
Renter-occupied apartments: 11,222 (it was 8,312 in 2000)
| % of renters here: | 24% |
| State: | 31% |
Land area: 1106 sq. mi.
Water area: 21.9 sq. mi.
Population density: 75 people per square mile (average).
Industries providing employment: Educational, health and social services (25.9%), Manufacturing (17.1%), Retail trade (13.0%).
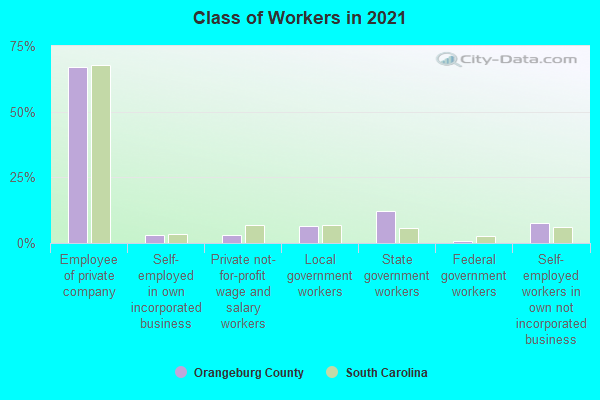
Type of workers:
- Private wage or salary: 74%
- Government: 19%
- Self-employed, not incorporated: 7%
- Unpaid family work: 0%
- OSM Map
- General Map
- Google Map
- MSN Map

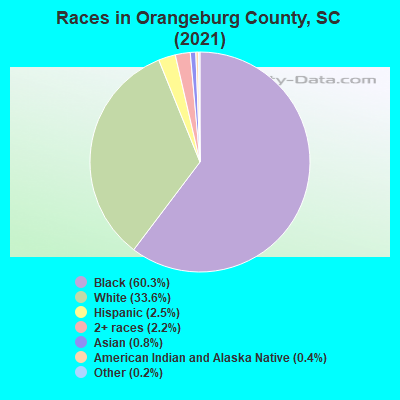
- 51,46460.4%Black Non-Hispanic Alone
- 28,37633.3%White Non-Hispanic Alone
- 2,2402.6%Hispanic or Latino
- 1,8772.2%Two or more races
- 6430.8%Asian alone
- 3350.4%American Indian and Alaska Native alone
- 2260.3%Some other race alone
- 1050.1%Native Hawaiian and Other
Pacific Islander alone
| Median resident age: | 40.2 years |
| South Carolina median age: | 40.5 years |
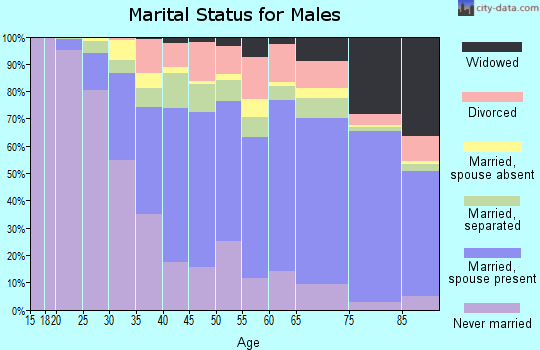
| Males: 39,253 | |
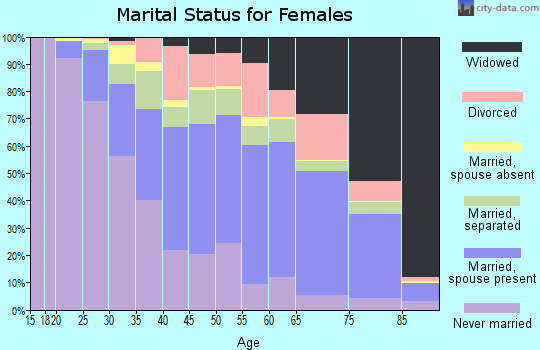
| Females: 43,841 |


| Orangeburg County: | 2.0 people |
| South Carolina: | 2 people |
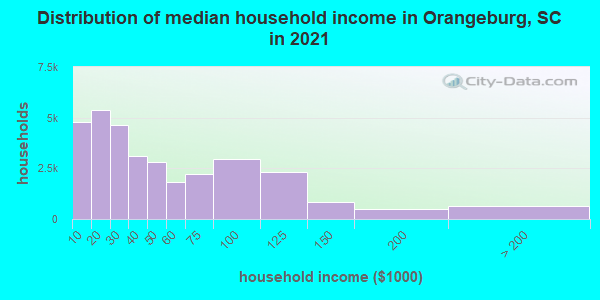
Estimated median household income in 2022: $40,016 ($29,567 in 1999)
| This county: | $40,016 |
| South Carolina: | $64,115 |
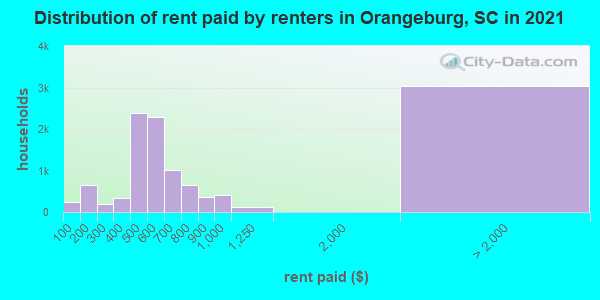
Median contract rent in 2022 for apartments: $534 (lower quartile is $355, upper quartile is $685)
| This county: | $534 |
| State: | $893 |
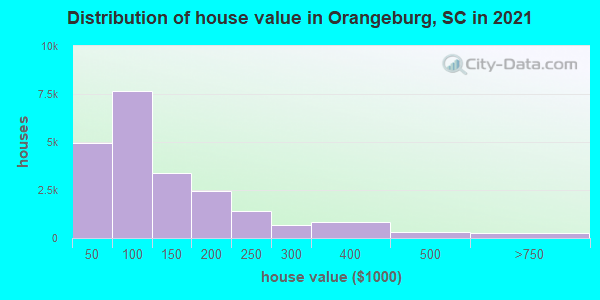
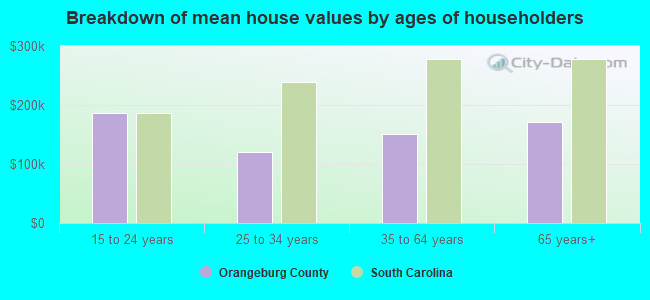
Estimated median house or condo value in 2022: $130,000 (it was $59,800 in 2000)
| Orangeburg: | $130,000 |
| South Carolina: | $254,600 |
Mean price in 2022:
Median monthly housing costs for homes and condos with a mortgage: $1,099Detached houses: $253,997
Here: $253,997 State: $368,255 Townhouses or other attached units: $223,254
Here: $223,254 State: $292,023 In 2-unit structures: $154,763
Here: $154,763 State: $358,283 In 3-to-4-unit structures: $103,764
Here: $103,764 State: $230,702 In 5-or-more-unit structures: $107,402
Here: $107,402 State: $326,361 Mobile homes: $92,355
Here: $92,355 State: $102,531 Occupied boats, RVs, vans, etc.: $11,163
Here: $11,163 State: $132,484
Median monthly housing costs for units without a mortgage: $379
Institutionalized population: 730
Crime in 2021 (reported by the sheriff's office or county police, not the county total):
- Murders: 25
- Rapes: 8
- Robberies: 50
- Assaults: 809
- Burglaries: 547
- Thefts: 1480
- Auto thefts: 342
Crime in 2020 (reported by the sheriff's office or county police, not the county total):
- Murders: 15
- Rapes: 14
- Robberies: 59
- Assaults: 786
- Burglaries: 658
- Thefts: 1555
- Auto thefts: 304
Health of residents in Orangeburg County based on CDC Behavioral Risk Factor Surveillance System Survey Questionnaires from 2003 to 2012:
General health status score of residents in this county from 1 (poor) to 5 (excellent) is 3.2. This is significantly worse than average.66.6% of residents exercised in the past month. This is less than average.
41.6% of residents smoked 100+ cigarettes in their lives. This is about average.
50.7% of adult residents drank alcohol in the past 30 days. This is less than average.
59.7% of residents visited a dentist within the past year. This is less than average.
Average weight of males is 198 pounds. This is about average.
Average weight of females is 172 pounds. This is more than average.
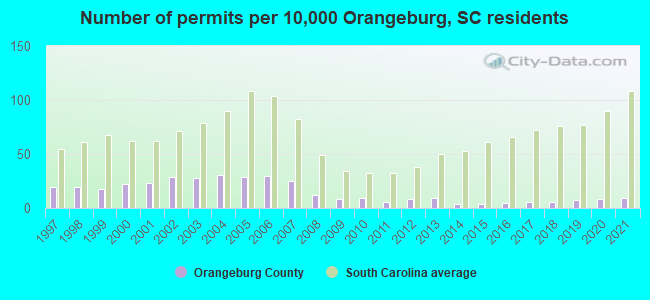
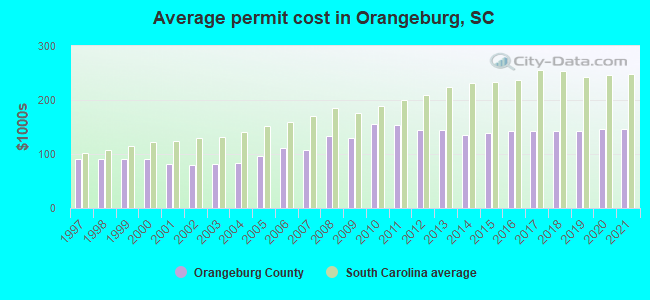
Single-family new house construction building permits:
- 2022: 86 buildings, average cost: $147,400
- 2021: 87 buildings, average cost: $147,400
- 2020: 71 buildings, average cost: $147,300
- 2019: 64 buildings, average cost: $142,100
- 2018: 59 buildings, average cost: $141,900
- 2017: 53 buildings, average cost: $141,700
- 2016: 48 buildings, average cost: $142,300
- 2015: 41 buildings, average cost: $139,400
- 2014: 41 buildings, average cost: $135,500
- 2013: 85 buildings, average cost: $144,600
- 2012: 71 buildings, average cost: $144,200
- 2011: 57 buildings, average cost: $153,300
- 2010: 79 buildings, average cost: $155,500
- 2009: 69 buildings, average cost: $128,700
- 2008: 113 buildings, average cost: $133,600
- 2007: 228 buildings, average cost: $108,200
- 2006: 274 buildings, average cost: $111,500
- 2005: 262 buildings, average cost: $97,000
- 2004: 287 buildings, average cost: $82,700
- 2003: 260 buildings, average cost: $81,600
- 2002: 266 buildings, average cost: $79,500
- 2001: 212 buildings, average cost: $81,000
- 2000: 197 buildings, average cost: $90,600
- 1999: 166 buildings, average cost: $91,200
- 1998: 175 buildings, average cost: $91,100
- 1997: 178 buildings, average cost: $90,000
Median real estate property taxes paid for housing units with mortgages in 2022: $1,005 (0.6%)
Median real estate property taxes paid for housing units with no mortgage in 2022: $595 (0.6%)
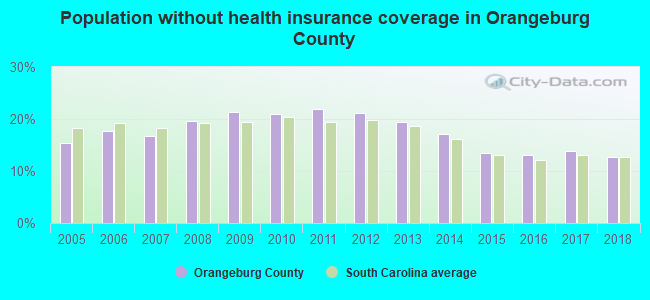
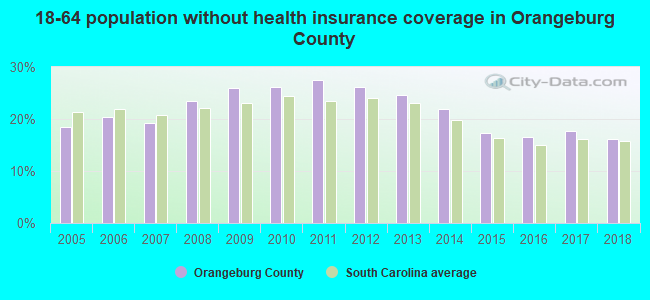
| Orangeburg County: | 24.6% |
| South Carolina: | 14.0% |
Median age of residents in 2022: 40.2 years old
(Males: 38.5 years old, Females: 42.8 years old)
(Median age for: White residents: 51.5 years old, Black residents: 36.5 years old, American Indian residents: 69.5 years old, Asian residents: 38.9 years old, Hispanic or Latino residents: 19.6 years old, Other race residents: 20.1 years old)
Fair market rent in 2006 for a 1-bedroom apartment in Orangeburg County is $433 a month.
Fair market rent for a 2-bedroom apartment is $481 a month.
Fair market rent for a 3-bedroom apartment is $597 a month.
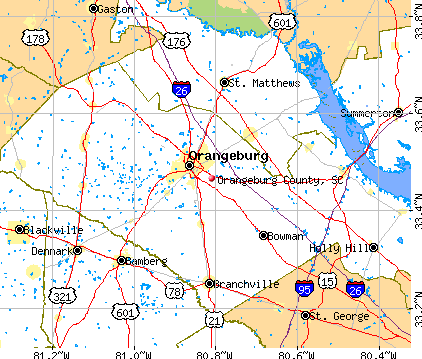
Cities in this county include: Orangeburg, Brookdale, Wilkinson Heights, Edisto, Holly Hill, Bowman, Branchville, North, Elloree, Santee.
Neighboring counties: Carroll County, Mississippi  , Cobb County, Georgia , Shelby County, Alabama , Sunflower County, Mississippi , Lincoln County, Georgia
  .
.
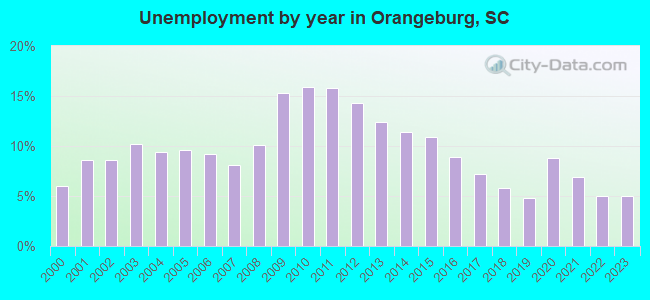
| Here: | 4.4% |
| South Carolina: | 3.1% |
Current college students: 6,858
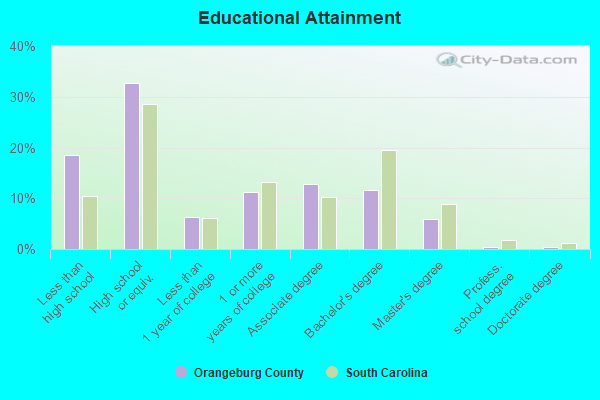
People 25 years of age or older with a high school degree or higher: 86.1%
People 25 years of age or older with a bachelor's degree or higher: 18.1%
Number of foreign born residents: 1,973 (24.2% naturalized citizens)
| Orangeburg County: | 2.4% |
| Whole state: | 5.2% |
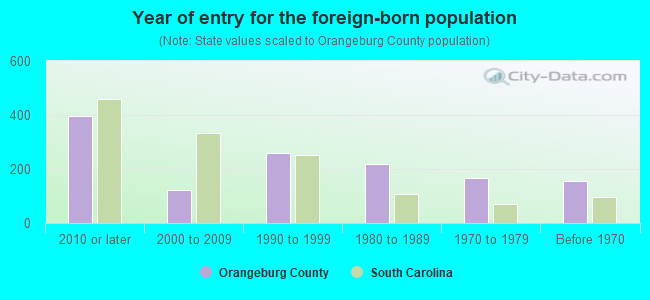
- Year of entry for the foreign-born population
- 5252010 or later
- 2072000 to 2009
- 1691990 to 1999
- 2201980 to 1989
- 1661970 to 1979
- 156Before 1970
Mean travel time to work (commute): minutes
Percentage of county residents living and working in this county: 99.1%
Housing units in structures:
- One, detached: 24,479
- One, attached: 505
- Two: 878
- 3 or 4: 1,761
- 5 to 9: 463
- 10 to 19: 601
- 20 to 49: 1,107
- 50 or more: 79
- Mobile homes: 11,441
- Boats, RVs, vans, etc.: 238
Housing units in Orangeburg County with a mortgage: 8,177 (264 second mortgage, 0 home equity loan, 254 both second mortgage and home equity loan)
Houses without a mortgage: 105
| Here: | 7.1% with mortgage |
| State: | 97.3% with mortgage |
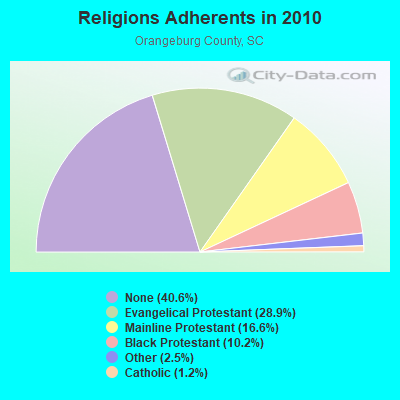
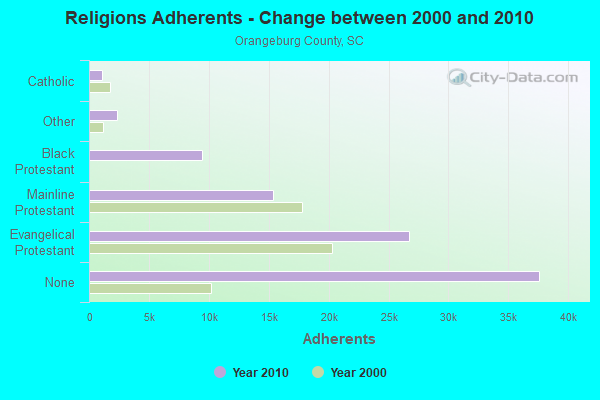
Religion statistics for Orangeburg County
| Religion | Adherents | Congregations |
|---|---|---|
| Evangelical Protestant | 26,734 | 124 |
| Mainline Protestant | 15,336 | 60 |
| Black Protestant | 9,400 | 41 |
| Other | 2,313 | 8 |
| Catholic | 1,125 | 3 |
| None | 37,593 | - |
Source: Clifford Grammich, Kirk Hadaway, Richard Houseal, Dale E.Jones, Alexei Krindatch, Richie Stanley and Richard H.Taylor. 2012. 2010 U.S.Religion Census: Religious Congregations & Membership Study. Association of Statisticians of American Religious Bodies. Jones, Dale E., et al. 2002. Congregations and Membership in the United States 2000. Nashville, TN: Glenmary Research Center.
Food Environment Statistics:
| Orangeburg County: | 2.55 / 10,000 pop. |
| State: | 1.99 / 10,000 pop. |
| Here: | 0.11 / 10,000 pop. |
| South Carolina: | 0.15 / 10,000 pop. |
| This county: | 0.66 / 10,000 pop. |
| South Carolina: | 0.85 / 10,000 pop. |
| Orangeburg County: | 8.63 / 10,000 pop. |
| South Carolina: | 5.38 / 10,000 pop. |
| This county: | 6.42 / 10,000 pop. |
| State: | 7.75 / 10,000 pop. |
| Orangeburg County: | 13.9% |
| South Carolina: | 10.6% |
| Orangeburg County: | 38.2% |
| State: | 29.4% |
| Here: | 14.6% |
| State: | 13.4% |
Agriculture in Orangeburg County:
Average size of farms: 283 acresAverage value of agricultural products sold per farm: $71,414
Average value of crops sold per acre for harvested cropland: $301.71
The value of nursery, greenhouse, floriculture, and sod as a percentage of the total market value of agricultural products sold: 24.04%
The value of livestock, poultry, and their products as a percentage of the total market value of agricultural products sold: 53.20%
Average total farm production expenses per farm: $74,144
Harvested cropland as a percentage of land in farms: 39.09%
Irrigated harvested cropland as a percentage of land in farms: 15.51%
Average market value of all machinery and equipment per farm: $82,778
The percentage of farms operated by a family or individual: 89.88%
Average age of principal farm operators: 58 years
Average number of cattle and calves per 100 acres of all land in farms: 6.10
Milk cows as a percentage of all cattle and calves: 22.09%
Corn for grain: 30324 harvested acres
All wheat for grain: 17470 harvested acres
Upland cotton: 16758 harvested acres
Soybeans for beans: 20838 harvested acres
Vegetables: 1,078 harvested acres
Land in orchards: 929 acres
Earthquake activity:
Orangeburg County-area historical earthquake activity is significantly above South Carolina state average. It is 36% smaller than the overall U.S. average.On 11/22/1974 at 05:25:55, a magnitude 4.7 (4.7 MB, Class: Light, Intensity: IV - V) earthquake occurred 54.9 miles away from Orangeburg County center
On 8/2/1974 at 08:52:09, a magnitude 4.9 (4.3 MB, 4.9 LG) earthquake occurred 100.5 miles away from the county center
On 8/21/1992 at 16:31:55, a magnitude 4.4 (4.1 MB, 4.1 LG, 4.4 LG, Depth: 6.2 mi) earthquake occurred 49.4 miles away from the county center
On 8/9/2020 at 12:07:37, a magnitude 5.1 (5.1 MW, Depth: 4.7 mi, Class: Moderate, Intensity: VI - VII) earthquake occurred 208.9 miles away from the county center
On 8/23/2011 at 17:51:04, a magnitude 5.8 (5.8 MW, Depth: 3.7 mi) earthquake occurred 347.3 miles away from Orangeburg County center
On 2/15/2014 at 03:23:38, a magnitude 4.1 (4.1 MW, Depth: 3.2 mi) earthquake occurred 77.6 miles away from the county center
Magnitude types: regional Lg-wave magnitude (LG), body-wave magnitude (MB), moment magnitude (MW)
Most recent natural disasters:
- South Carolina Severe Storms, Tornadoes, And Straight-line Winds, Incident Period: April 12, 2020 - April 13, 2020, FEMA Id: 4542, Natural disaster type: Storm, Tornado, Wind
- South Carolina Covid-19 Pandemic, Incident Period: January 20, 2020, FEMA Id: 4492, Natural disaster type: Other
- South Carolina Hurricane Florence, Incident Period: September 8, 2018 - October 8, 2018, FEMA Id: 4394, Natural disaster type: Hurricane
- South Carolina Hurricane Irma, Incident Period: September 6, 2017 - September 13, 2017, FEMA Id: 4346, Natural disaster type: Hurricane
- South Carolina Hurricane Matthew, Incident Period: October 04, 2016 to October 30, 2016, Emergency Declared EM-3378: October 06, 2016, FEMA Id: 3378, Natural disaster type: Hurricane
- South Carolina Hurricane Matthew, Incident Period: October 04, 2016 to October 30, 2016, Major Disaster (Presidential) Declared DR-4286: October 11, 2016, FEMA Id: 4286, Natural disaster type: Hurricane
- South Carolina Severe Storms and Flooding, Incident Period: October 01, 2015 to October 23, 2015, Emergency Declared EM-3373: October 03, 2015, FEMA Id: 3373, Natural disaster type: Storm, Flood
- South Carolina Severe Storms and Flooding, Incident Period: October 01, 2015 to October 23, 2015, Major Disaster (Presidential) Declared DR-4241: October 05, 2015, FEMA Id: 4241, Natural disaster type: Storm, Flood
- South Carolina Severe Winter Storm, Incident Period: February 10, 2014 to February 19, 2014, Emergency Declared EM-3369: February 12, 2014, FEMA Id: 3369, Natural disaster type: Winter Storm
- South Carolina Severe Winter Storm, Incident Period: February 10, 2014 to February 15, 2014, Major Disaster (Presidential) Declared DR-4166: March 12, 2014, FEMA Id: 4166, Natural disaster type: Winter Storm
- 8 other natural disasters have been reported since 1953.
The number of natural disasters in Orangeburg County (18) is near the US average (15).
Major Disasters (Presidential) Declared: 8
Emergencies Declared: 6
Causes of natural disasters: Hurricanes: 8, Storms: 4, Floods: 3, Winter Storms: 3, Drought: 1, Ice Storm: 1, Tornado: 1, Wind: 1, Other: 1 (Note: some incidents may be assigned to more than one category).
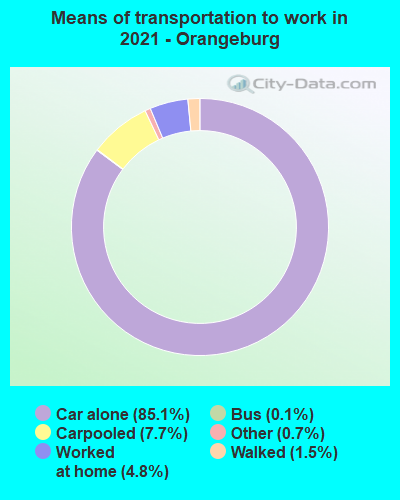
Means of transportation to work:
- Drove a car alone: 24,626 (79.3%)
- Carpooled: 2,748 (8.8%)
- Bus: 42 (0.1%)
- Subway or elevated rail: 3 (0.0%)
- Taxicab, motorcycle, or other means: 281 (0.9%)
- Bicycle: 43 (0.1%)
- Walked: 488 (1.6%)
- Worked at home: 2,486 (8.0%)
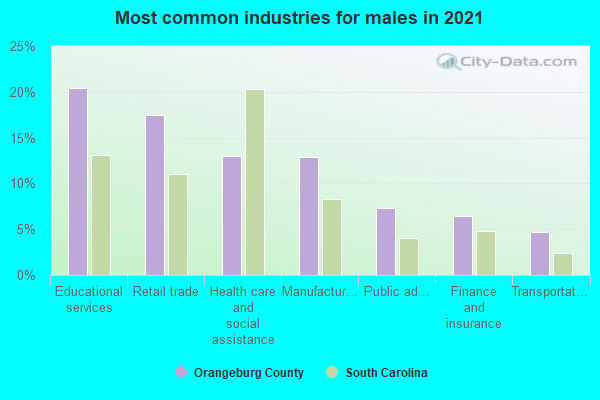
- Health care and social assistance (26%)
- Educational services (13%)
- Retail trade (13%)
- Manufacturing (12%)
- Accommodation and food services (9%)
- Other services, except public administration (8%)
- Public administration (4%)
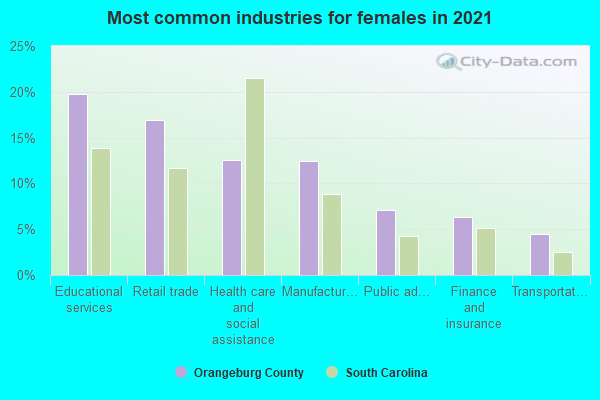
- Health care and social assistance (25%)
- Educational services (13%)
- Retail trade (13%)
- Manufacturing (12%)
- Accommodation and food services (9%)
- Other services, except public administration (8%)
- Public administration (4%)
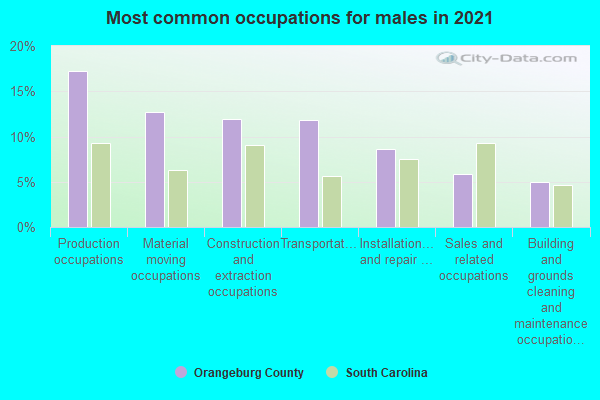
- Installation, maintenance, and repair occupations (17%)
- Production occupations (14%)
- Transportation occupations (11%)
- Construction and extraction occupations (11%)
- Food preparation and serving related occupations (7%)
- Material moving occupations (6%)
- Management occupations (6%)
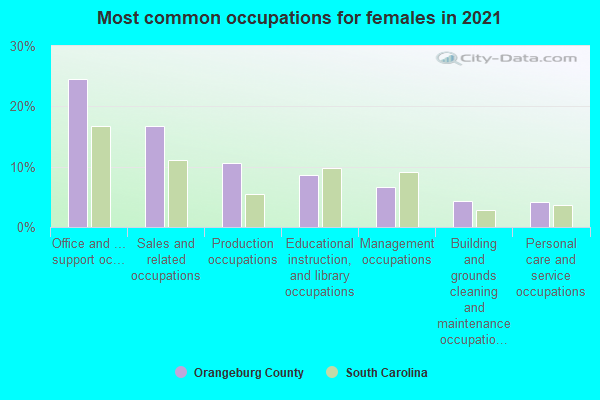
- Office and administrative support occupations (13%)
- Management occupations (13%)
- Production occupations (11%)
- Educational instruction, and library occupations (7%)
- Healthcare support occupations (7%)
- Food preparation and serving related occupations (7%)
- Personal care and service occupations (6%)
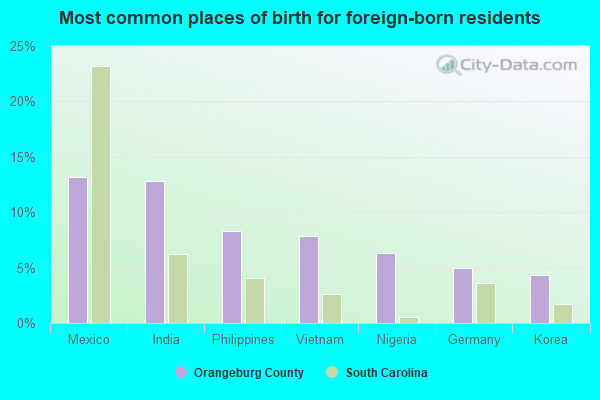
- Nigeria (12%)
- Mexico (12%)
- Honduras (8%)
- Vietnam (6%)
- Korea (6%)
- India (6%)
- Romania (6%)
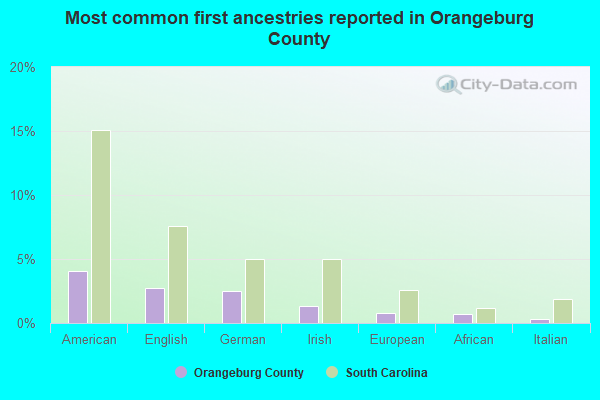
- American (5%)
- English (3%)
- German (3%)
- Irish (2%)
- African (1%)
- European (0%)
- Italian (0%)
People in group quarters in Orangeburg County, South Carolina in 2010:
- 2,411 people in college/university student housing
- 401 people in nursing facilities/skilled-nursing facilities
- 307 people in local jails and other municipal confinement facilities
- 50 people in group homes intended for adults
- 43 people in other noninstitutional facilities
- 32 people in residential treatment centers for adults
- 27 people in emergency and transitional shelters (with sleeping facilities) for people experiencing homelessness
- 14 people in group homes for juveniles (non-correctional)
- 8 people in residential treatment centers for juveniles (non-correctional)
- 7 people in workers' group living quarters and job corps centers
People in group quarters in Orangeburg County, South Carolina in 2000:
- 2,366 people in college dormitories (includes college quarters off campus)
- 713 people in nursing homes
- 324 people in local jails and other confinement facilities (including police lockups)
- 116 people in other noninstitutional group quarters
- 69 people in other group homes
- 55 people in homes for the mentally retarded
- 10 people in other nonhousehold living situations
- 4 people in homes for the mentally ill
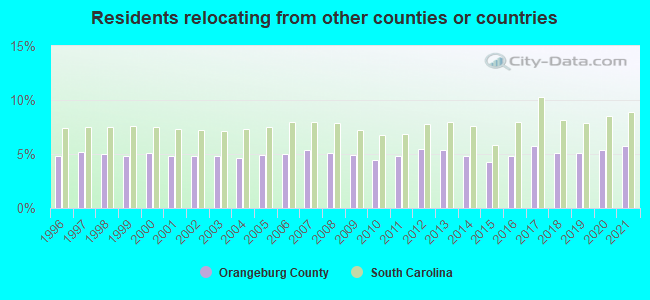
5.73% of this county's 2021 resident taxpayers lived in other counties in 2020 ($43,827 average adjusted gross income)
| Here: | 5.73% |
| South Carolina average: | 8.89% |
10 or fewer of this county's residents moved from foreign countries.
3.88% relocated from other counties in South Carolina ($28,549 average AGI)
1.85% relocated from other states ($15,279 average AGI)
Orangeburg County: 1.85% South Carolina average: 4.96%
Top counties from which taxpayers relocated into this county between 2020 and 2021:
| from Dorchester County, SC | |
| from Berkeley County, SC | |
| from Richland County, SC | |
| from Lexington County, SC | |
| from Calhoun County, SC | |
| from Charleston County, SC | |
| from Bamberg County, SC |
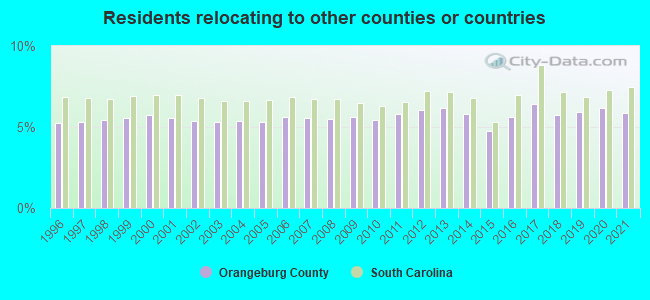
5.89% of this county's 2020 resident taxpayers moved to other counties in 2021 ($38,835 average adjusted gross income)
| Here: | 5.89% |
| South Carolina average: | 7.46% |
10 or fewer of this county's residents moved to foreign countries.
4.12% relocated to other counties in South Carolina ($27,305 average AGI)
1.77% relocated to other states ($11,530 average AGI)
Orangeburg County: 1.77% South Carolina average: 3.47%
Top counties to which taxpayers relocated from this county between 2020 and 2021:
| to Richland County, SC | |
| to Lexington County, SC | |
| to Berkeley County, SC | |
| to Calhoun County, SC | |
| to Dorchester County, SC | |
| to Charleston County, SC | |
| to Bamberg County, SC |
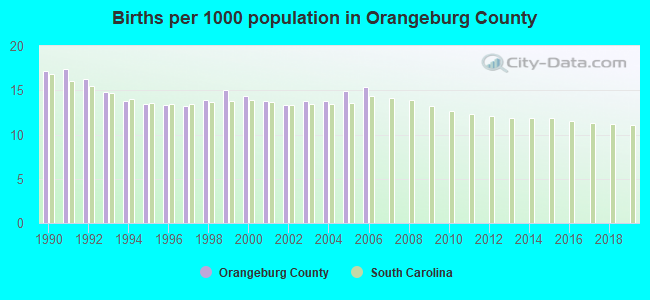
Births per 1000 population from 1990 to 1999: 14.8
Births per 1000 population from 2000 to 2006: 14.2
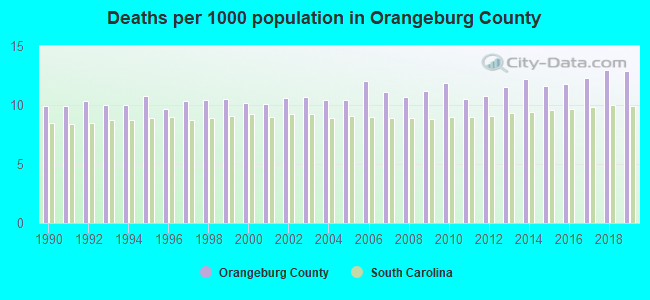
Deaths per 1000 population from 1990 to 1999: 10.2
Deaths per 1000 population from 2000 to 2009: 10.7
Deaths per 1000 population from 2010 to 2020: 12.2
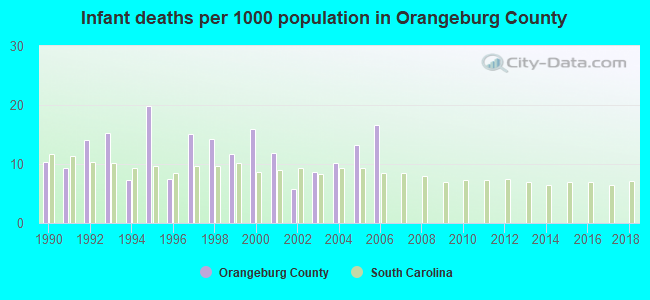
Infant deaths per 1000 live births from 1990 to 1999: 12.4
Infant deaths per 1000 live births from 2000 to 2006: 11.8
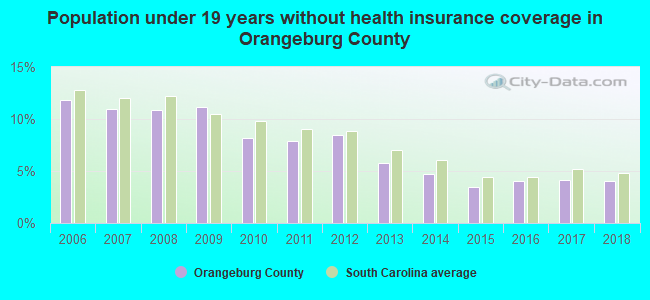
Persons under 19 years old without health insurance coverage in 2018: 4.0%
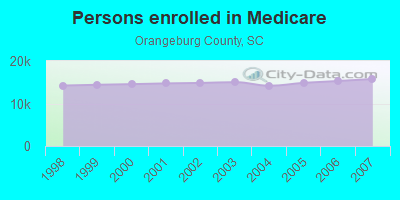
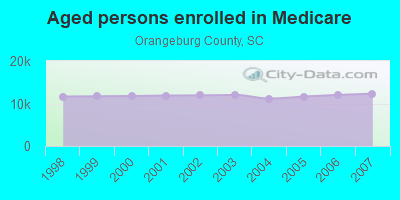
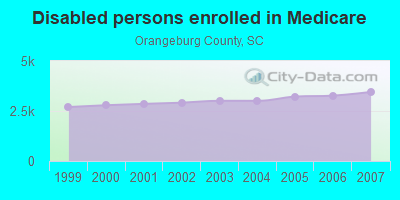
Persons enrolled in hospital insurance and/or supplemental medical insurance (Medicare) in July 1, 2007: 15,766 (12,313 aged, 3,453 disabled)
Children under 18 without health insurance coverage in 2007: 2,300 (10%)
Most common underlying causes of death in Orangeburg County, South Carolina in 1999 - 2019:
- Acute myocardial infarction, unspecified (1,155)
- Bronchus or lung, unspecified - Malignant neoplasms (1,035)
- Atherosclerotic heart disease (742)
- Chronic obstructive pulmonary disease, unspecified (718)
- Alzheimer disease, unspecified (687)
- Unspecified diabetes mellitus, without complications (667)
- Stroke, not specified as haemorrhage or infarction (579)
- Septicaemia, unspecified (512)
- Unspecified dementia (417)
- Colon, unspecified - Malignant neoplasms (402)
Population without health insurance coverage in 2000: 18%
Children under 18 without health insurance coverage in 2000: 14%
Short term general hospital admissions per 100,000 population in 2004: 11,369
Short term general hospital beds per 100,000 population in 2004: 315
Emergency room visits per 100,000 population in 2004: 51,683
General practice office based MDs per 100,000 population in 2005: 1,457
Medical specialist MDs per 100,000 population in 2005: 1,049
Dentists per 100,000 population in 1998: 9
Total births per 100,000 population, July 2005 - July 2006 : 26
Total deaths per 100,000 population, July 2005 - July 2006: 74
Limited-service eating places per 100,000 population in 2005 : 10
Homicides per 1,000,000 population from 2000 to 2006: 149.3. This is more than state average.
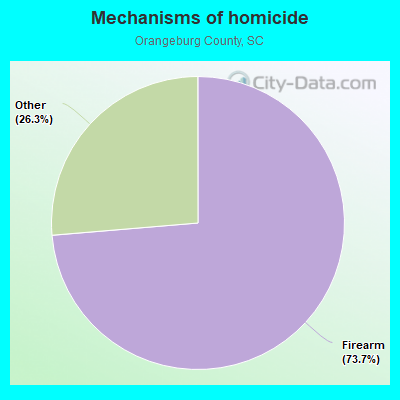
- Firearm - 110.0
- Other - 39.3
Suicides per 1,000,000 population from 2000 to 2006: 84.9. This is less than state average.
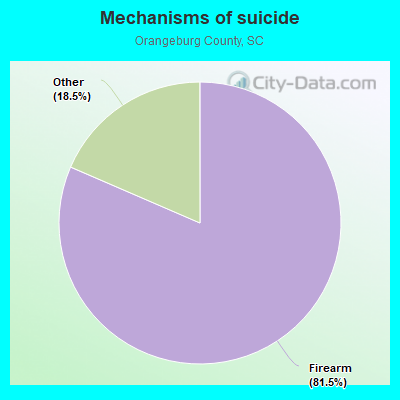
- Firearm - 69.2
- Other - 15.7
Household type by relationship:
Households: 83,094- Male householders: 15,183 (4,842 living alone), Female householders: 18,449 (6,755 living alone)
11,581 spouses (11,546 opposite-sex spouses), 2,331 unmarried partners, (2,113 opposite-sex unmarried partners), 23,620 children (21,990 natural, 543 adopted, 1,087 stepchildren), 3,962 grandchildren, 943 brothers or sisters, 883 parents, 0 foster children, 1,771 other relatives, 767 non-relatives
- In group quarters: 3,604
Size of family households: 10,196 2-persons, 5,356 3-persons, 2,267 4-persons, 1,463 5-persons, 533 6-persons, 270 7-or-more-persons.
Size of nonfamily households: 11,597 1-person, 1,950 2-persons.
6,885 married couples with children.
6,945 single-parent households (576 men, 6,369 women).
95.9% of residents of Orangeburg speak English at home.
2.4% of residents speak Spanish at home (38% speak English very well, 45% speak English well, 13% speak English not well, 4% don't speak English at all).
0.5% of residents speak other Indo-European language at home (88% speak English very well, 5% speak English well, 5% speak English not well, 2% don't speak English at all).
0.4% of residents speak Asian or Pacific Island language at home (62% speak English very well, 22% speak English well, 10% speak English not well, 6% don't speak English at all).
0.6% of residents speak other language at home (78% speak English very well, 8% speak English well, 13% speak English not well, 1% don't speak English at all).
In fiscal year 2004:
Federal Government expenditure: $606,872,000 ($6,685 per capita)
Department of Defense expenditure: $27,548,000
Federal direct payments to individuals for retirement and disability: $237,307,000
Federal other direct payments to individuals: $134,710,000
Federal direct payments not to individuals: $9,416,000
Federal grants: $197,491,000
Federal procurement contracts: $13,883,000 ($10,276,000 Department of Defense)
Federal salaries and wages: $14,065,000 ($2,342,000 Department of Defense)
Federal Government direct loans: $2,763,000
Federal guaranteed/insured loans: $13,140,000
Federal Government insurance: $38,856,000
Population change from April 1, 2000 to July 1, 2005:
Births: 6,941| Here: | 75 per 1000 residents |
| State: | 69 per 1000 residents |
Deaths: 5,157
| Here: | 56 per 1000 residents |
| State: | 46 per 1000 residents |
Net international migration: +214
| Here: | +2 per 1000 residents |
| State: | +9 per 1000 residents |
Net internal migration: -1,226
| Here: | |
| State: |
Total withdrawal of fresh water for public supply: 9.60 millions of gallons per day (20% from ground, 80% from surface)
| Here: | 6.2 |
| State: | 6.4 |
| Here: | 4.6 |
| State: | 4.5 |
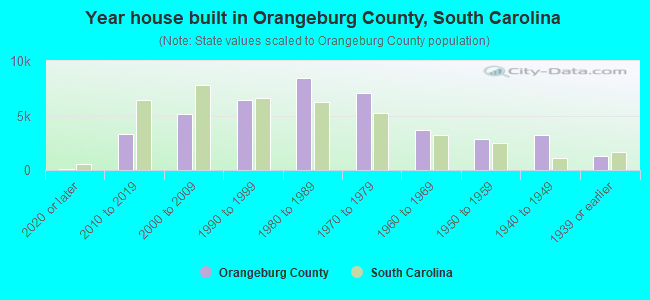
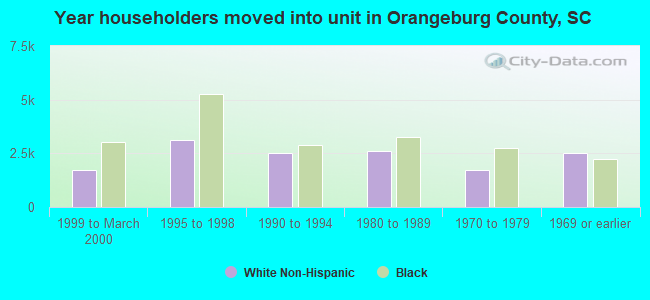
- Year house built in Orangeburg County, South Carolina
- 2032020 or later
- 1,9572010 to 2019
- 4,4022000 to 2009
- 8,8461990 to 1999
- 6,7951980 to 1989
- 6,2521970 to 1979
- 5,7981960 to 1969
- 3,7891950 to 1959
- 1,2151940 to 1949
- 2,2951939 or earlier
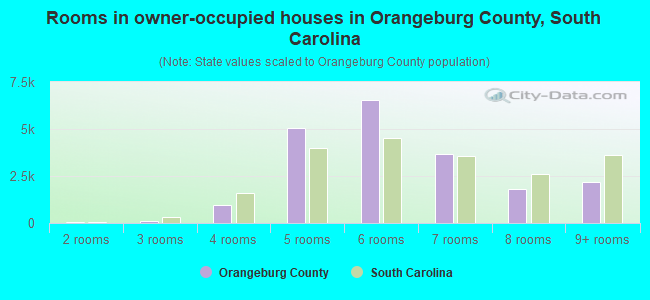
- Rooms in owner-occupied houses in Orangeburg County, South Carolina
- 3081 room
- 692 rooms
- 3333 rooms
- 1,5214 rooms
- 4,9445 rooms
- 5,6596 rooms
- 4,6257 rooms
- 2,1038 rooms
- 2,7059+ rooms
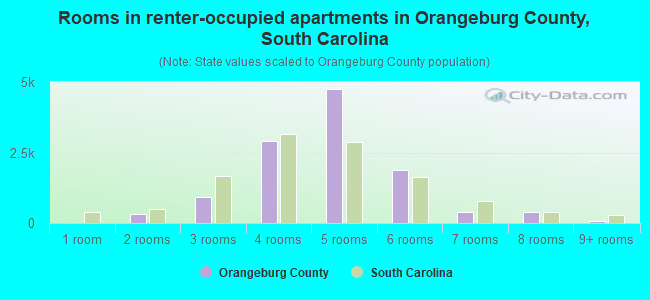
- Rooms in renter-occupied apartments in Orangeburg County, South Carolina
- 1931 room
- 282 rooms
- 1,8583 rooms
- 3,2664 rooms
- 2,8365 rooms
- 2,2676 rooms
- 4937 rooms
- 2628 rooms
- 1629+ rooms
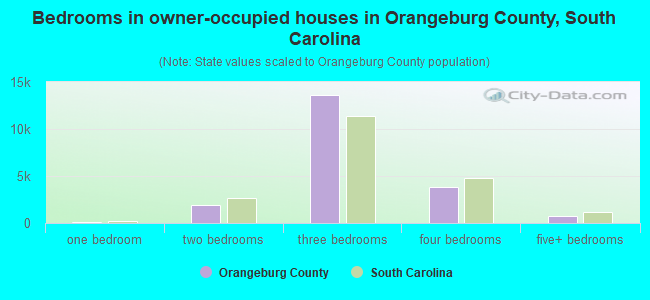
- Bedrooms in owner-occupied houses in Orangeburg County, South Carolina
- 308no bedroom
- 5021 bedroom
- 3,1242 bedrooms
- 13,4753 bedrooms
- 3,7474 bedrooms
- 1,1115+ bedrooms
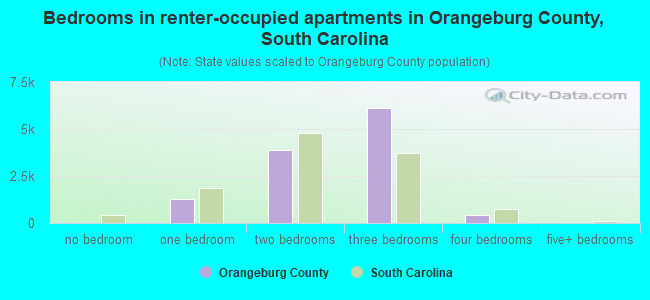
- Bedrooms in renter-occupied apartments in Orangeburg County, South Carolina
- 193no bedroom
- 1,6151 bedroom
- 4,2742 bedrooms
- 4,8203 bedrooms
- 3774 bedrooms
- 865+ bedrooms
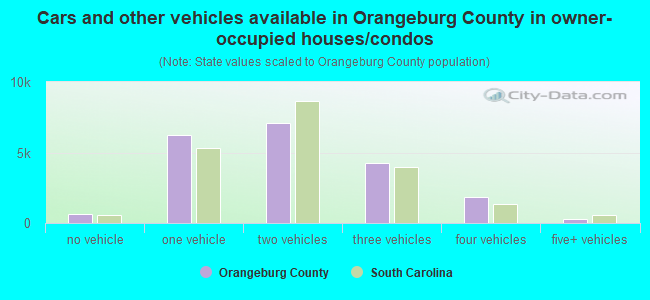
- Cars and other vehicles available in Orangeburg County in owner-occupied houses/condos
- 942no vehicle
- 6,1611 vehicle
- 6,8842 vehicles
- 5,6563 vehicles
- 2,2164 vehicles
- 4085+ vehicles
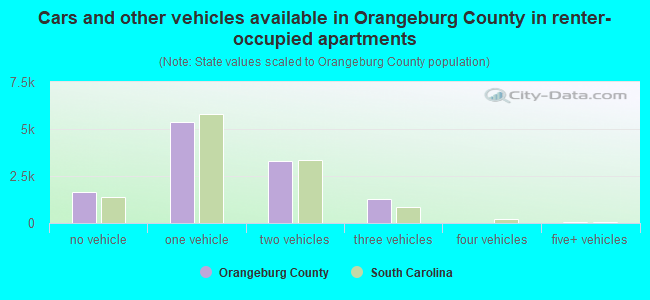
- Cars and other vehicles available in Orangeburg County in renter-occupied apartments
- 2,244no vehicle
- 6,4761 vehicle
- 1,5002 vehicles
- 1,0063 vehicles
- 574 vehicles
- 825+ vehicles
90.3% of Orangeburg County residents lived in the same house 1 years ago.
Out of people who lived in different houses, 39% lived in this county.
Out of people who lived in different counties, 67% lived in South Carolina.
| Orangeburg County: | 90.3% |
| State average: | 86.5% |
Place of birth for U.S.-born residents:
- This state: 64,214
- Other state: 16,666
- Northeast: 7,410
- Midwest: 1,084
- South: 7,240
- West: 932
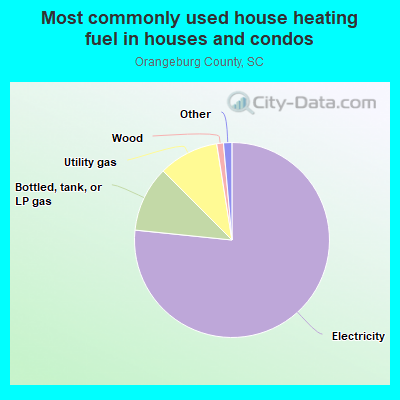
- 77.9%Electricity
- 10.0%Bottled, tank, or LP gas
- 9.3%Utility gas
- 1.0%Wood
- 0.9%No fuel used
- 0.3%Fuel oil, kerosene, etc.
- 0.2%Other fuel
- 0.2%Coal or coke
- 0.1%Solar energy
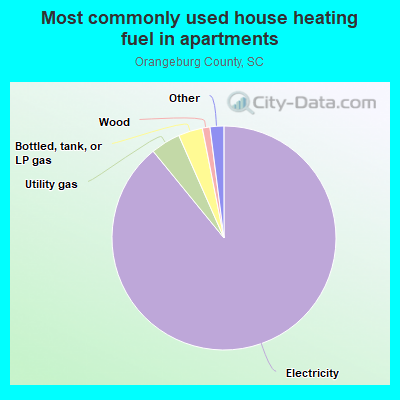
- 88.5%Electricity
- 4.6%Utility gas
- 4.3%Bottled, tank, or LP gas
- 1.2%Wood
- 0.8%No fuel used
- 0.3%Fuel oil, kerosene, etc.
- 0.3%Other fuel
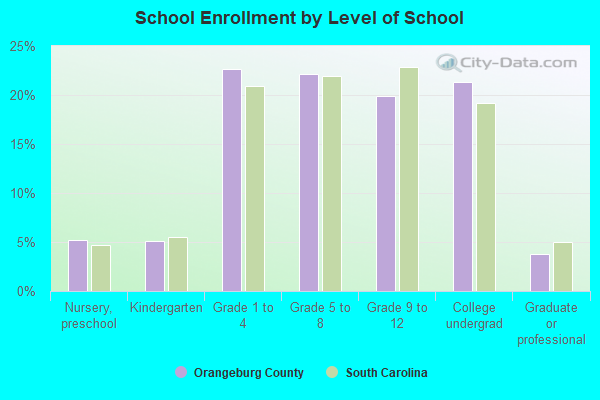
Private vs. public school enrollment:
| Here: | 10.0% |
| South Carolina: | 14.4% |
| Here: | 18.4% |
| South Carolina: | 11.1% |
| Here: | 40.4% |
| South Carolina: | 21.9% |
Orangeburg County government finances - Expenditure in 2018:
- Bond Funds - Cash and Securities: $28,716,000
Cash and Securities: $4,035,000
- Charges - Hospital Public: $221,255,000
Hospital Public: $218,031,000
Other: $7,326,000
Other: $5,247,000
Regular Highways: $2,556,000
Regular Highways: $2,491,000
Solid Waste Management: $1,728,000
Sewerage: $404,000
Sewerage: $399,000
- Construction - Regular Highways: $4,546,000
Correctional Institutions: $2,517,000
Hospitals: $2,461,000
General - Other: $1,674,000
General - Other: $1,370,000
Central Staff Services: $955,000
General Public Buildings: $948,000
Judicial and Legal Services: $817,000
Housing and Community Development: $816,000
Police Protection: $271,000
Sewerage: $40,000
Sewerage: $13,000
Parks and Recreation: $6,000
- Current Operations - Hospitals: $233,249,000
Hospitals: $210,338,000
Police Protection: $15,668,000
Police Protection: $9,427,000
Central Staff Services: $7,845,000
General - Other: $7,101,000
General - Other: $6,945,000
Solid Waste Management: $5,385,000
Judicial and Legal Services: $5,333,000
Correctional Institutions: $5,325,000
Correctional Institutions: $5,155,000
Solid Waste Management: $4,602,000
Health - Other: $4,514,000
Judicial and Legal Services: $4,451,000
Health - Other: $4,059,000
Financial Administration: $4,026,000
Regular Highways: $3,438,000
Central Staff Services: $3,388,000
Financial Administration: $2,683,000
Regular Highways: $2,450,000
General Public Buildings: $2,260,000
Local Fire Protection: $2,181,000
Libraries: $1,944,000
Local Fire Protection: $1,917,000
General Public Buildings: $1,862,000
Libraries: $1,535,000
Transit Utilities: $730,000
Parks and Recreation: $612,000
Water Utilities: $571,000
Sewerage: $567,000
Water Utilities: $511,000
Parks and Recreation: $496,000
Sewerage: $457,000
Protective Inspection and Regulation - Other: $351,000
Natural Resources - Other: $231,000
Natural Resources - Other: $54,000
- Federal Intergovernmental - Other: $875,000
Housing and Community Development: $826,000
- General - Interest on Debt: $4,202,000
Interest on Debt: $4,174,000
- Intergovernmental to Local - Other - Central Staff Services: $1,689,000
Other - Regular Highways: $659,000
Other - Libraries: $170,000
- Local Intergovernmental - Other: $1,131,000
Health and Hospitals: $36,000
- Long Term Debt - Beginning Outstanding - Unspecified Public Purpose: $109,419,000
Outstanding Unspecified Public Purpose: $107,124,000
Outstanding Unspecified Public Purpose: $99,836,000
Beginning Outstanding - Unspecified Public Purpose: $87,655,000
Issue, Unspecified Public Purpose: $70,543,000
Retired Unspecified Public Purpose: $51,074,000
Retired Unspecified Public Purpose: $9,583,000
Beginning Outstanding - Public Debt for Private Purpose: $3,020,000
Retired Nonguaranteed - Public Debt for Private Purpose: $1,880,000
Outstanding Nonguaranteed - Industrial Revenue: $1,140,000
- Miscellaneous - General Revenue - Other: $5,110,000
General Revenue - Other: $4,928,000
Interest Earnings: $1,397,000
Fines and Forfeits: $1,102,000
Fines and Forfeits: $676,000
Sale of Property: $335,000
Rents: $147,000
Rents: $143,000
Interest Earnings: $53,000
Sale of Property: $8,000
- Other Capital Outlay - Hospitals: $16,262,000
Hospitals: $9,061,000
General - Other: $6,318,000
Police Protection: $2,558,000
Local Fire Protection: $1,933,000
Police Protection: $1,021,000
Local Fire Protection: $987,000
General Public Building: $389,000
Financial Administration: $286,000
Judicial and Legal Services: $214,000
Solid Waste Management: $206,000
Solid Waste Management: $137,000
Correctional Institutions: $122,000
Transit Utilities: $82,000
General - Other: $73,000
Central Staff Services: $34,000
Health - Other: $26,000
Judicial and Legal Services: $17,000
Sewerage: $6,000
Regular Highways: $3,000
- Other Funds - Cash and Securities: $118,312,000
Cash and Securities: $110,894,000
- Revenue - Water Utilities: $180,000
Water Utilities: $76,000
- Short Term Debt Outstanding - Beginning: $7,000,000
- Sinking Funds - Cash and Securities: $3,361,000
- State Intergovernmental - Other: $8,553,000
General Local Government Support: $4,496,000
Other: $2,591,000
Highways: $1,409,000
Highways: $622,000
Transit Utilities: $154,000
- Tax - Property: $42,192,000
Property: $33,628,000
Other Selective Sales: $9,981,000
Other Selective Sales: $9,298,000
Other License: $1,539,000
Other License: $1,330,000
Other: $747,000
Public Utilities Sales: $691,000
Occupation and Business License - Other: $380,000
Documentary and Stock Transfer: $222,000
Public Utilities Sales: $206,000
- Total Salaries and Wages: $121,339,000
: $100,919,000
- Water Utilities - Interest on Debt: $174,000
Orangeburg County government finances - Revenue in 2018:
- Bond Funds - Cash and Securities: $28,716,000
Cash and Securities: $4,035,000
- Charges - Hospital Public: $221,255,000
Hospital Public: $218,031,000
Other: $7,326,000
Other: $5,247,000
Regular Highways: $2,556,000
Regular Highways: $2,491,000
Solid Waste Management: $1,728,000
Sewerage: $404,000
Sewerage: $399,000
- Construction - Regular Highways: $4,546,000
Correctional Institutions: $2,517,000
Hospitals: $2,461,000
General - Other: $1,674,000
General - Other: $1,370,000
Central Staff Services: $955,000
General Public Buildings: $948,000
Judicial and Legal Services: $817,000
Housing and Community Development: $816,000
Police Protection: $271,000
Sewerage: $40,000
Sewerage: $13,000
Parks and Recreation: $6,000
- Current Operations - Hospitals: $233,249,000
Hospitals: $210,338,000
Police Protection: $15,668,000
Police Protection: $9,427,000
Central Staff Services: $7,845,000
General - Other: $7,101,000
General - Other: $6,945,000
Solid Waste Management: $5,385,000
Judicial and Legal Services: $5,333,000
Correctional Institutions: $5,325,000
Correctional Institutions: $5,155,000
Solid Waste Management: $4,602,000
Health - Other: $4,514,000
Judicial and Legal Services: $4,451,000
Health - Other: $4,059,000
Financial Administration: $4,026,000
Regular Highways: $3,438,000
Central Staff Services: $3,388,000
Financial Administration: $2,683,000
Regular Highways: $2,450,000
General Public Buildings: $2,260,000
Local Fire Protection: $2,181,000
Libraries: $1,944,000
Local Fire Protection: $1,917,000
General Public Buildings: $1,862,000
Libraries: $1,535,000
Transit Utilities: $730,000
Parks and Recreation: $612,000
Water Utilities: $571,000
Sewerage: $567,000
Water Utilities: $511,000
Parks and Recreation: $496,000
Sewerage: $457,000
Protective Inspection and Regulation - Other: $351,000
Natural Resources - Other: $231,000
Natural Resources - Other: $54,000
- Federal Intergovernmental - Other: $875,000
Housing and Community Development: $826,000
- General - Interest on Debt: $4,202,000
Interest on Debt: $4,174,000
- Intergovernmental to Local - Other - Central Staff Services: $1,689,000
Other - Regular Highways: $659,000
Other - Libraries: $170,000
- Local Intergovernmental - Other: $1,131,000
Health and Hospitals: $36,000
- Long Term Debt - Beginning Outstanding - Unspecified Public Purpose: $109,419,000
Outstanding Unspecified Public Purpose: $107,124,000
Outstanding Unspecified Public Purpose: $99,836,000
Beginning Outstanding - Unspecified Public Purpose: $87,655,000
Issue, Unspecified Public Purpose: $70,543,000
Retired Unspecified Public Purpose: $51,074,000
Retired Unspecified Public Purpose: $9,583,000
Beginning Outstanding - Public Debt for Private Purpose: $3,020,000
Retired Nonguaranteed - Public Debt for Private Purpose: $1,880,000
Outstanding Nonguaranteed - Industrial Revenue: $1,140,000
- Miscellaneous - General Revenue - Other: $5,110,000
General Revenue - Other: $4,928,000
Interest Earnings: $1,397,000
Fines and Forfeits: $1,102,000
Fines and Forfeits: $676,000
Sale of Property: $335,000
Rents: $147,000
Rents: $143,000
Interest Earnings: $53,000
Sale of Property: $8,000
- Other Capital Outlay - Hospitals: $16,262,000
Hospitals: $9,061,000
General - Other: $6,318,000
Police Protection: $2,558,000
Local Fire Protection: $1,933,000
Police Protection: $1,021,000
Local Fire Protection: $987,000
General Public Building: $389,000
Financial Administration: $286,000
Judicial and Legal Services: $214,000
Solid Waste Management: $206,000
Solid Waste Management: $137,000
Correctional Institutions: $122,000
Transit Utilities: $82,000
General - Other: $73,000
Central Staff Services: $34,000
Health - Other: $26,000
Judicial and Legal Services: $17,000
Sewerage: $6,000
Regular Highways: $3,000
- Other Funds - Cash and Securities: $118,312,000
Cash and Securities: $110,894,000
- Revenue - Water Utilities: $180,000
Water Utilities: $76,000
- Short Term Debt Outstanding - Beginning: $7,000,000
- Sinking Funds - Cash and Securities: $3,361,000
- State Intergovernmental - Other: $8,553,000
General Local Government Support: $4,496,000
Other: $2,591,000
Highways: $1,409,000
Highways: $622,000
Transit Utilities: $154,000
- Tax - Property: $42,192,000
Property: $33,628,000
Other Selective Sales: $9,981,000
Other Selective Sales: $9,298,000
Other License: $1,539,000
Other License: $1,330,000
Other: $747,000
Public Utilities Sales: $691,000
Occupation and Business License - Other: $380,000
Documentary and Stock Transfer: $222,000
Public Utilities Sales: $206,000
- Total Salaries and Wages: $121,339,000
: $100,919,000
- Water Utilities - Interest on Debt: $174,000
Orangeburg County government finances - Debt in 2018:
- Bond Funds - Cash and Securities: $28,716,000
Cash and Securities: $4,035,000
- Charges - Hospital Public: $221,255,000
Hospital Public: $218,031,000
Other: $7,326,000
Other: $5,247,000
Regular Highways: $2,556,000
Regular Highways: $2,491,000
Solid Waste Management: $1,728,000
Sewerage: $404,000
Sewerage: $399,000
- Construction - Regular Highways: $4,546,000
Correctional Institutions: $2,517,000
Hospitals: $2,461,000
General - Other: $1,674,000
General - Other: $1,370,000
Central Staff Services: $955,000
General Public Buildings: $948,000
Judicial and Legal Services: $817,000
Housing and Community Development: $816,000
Police Protection: $271,000
Sewerage: $40,000
Sewerage: $13,000
Parks and Recreation: $6,000
- Current Operations - Hospitals: $233,249,000
Hospitals: $210,338,000
Police Protection: $15,668,000
Police Protection: $9,427,000
Central Staff Services: $7,845,000
General - Other: $7,101,000
General - Other: $6,945,000
Solid Waste Management: $5,385,000
Judicial and Legal Services: $5,333,000
Correctional Institutions: $5,325,000
Correctional Institutions: $5,155,000
Solid Waste Management: $4,602,000
Health - Other: $4,514,000
Judicial and Legal Services: $4,451,000
Health - Other: $4,059,000
Financial Administration: $4,026,000
Regular Highways: $3,438,000
Central Staff Services: $3,388,000
Financial Administration: $2,683,000
Regular Highways: $2,450,000
General Public Buildings: $2,260,000
Local Fire Protection: $2,181,000
Libraries: $1,944,000
Local Fire Protection: $1,917,000
General Public Buildings: $1,862,000
Libraries: $1,535,000
Transit Utilities: $730,000
Parks and Recreation: $612,000
Water Utilities: $571,000
Sewerage: $567,000
Water Utilities: $511,000
Parks and Recreation: $496,000
Sewerage: $457,000
Protective Inspection and Regulation - Other: $351,000
Natural Resources - Other: $231,000
Natural Resources - Other: $54,000
- Federal Intergovernmental - Other: $875,000
Housing and Community Development: $826,000
- General - Interest on Debt: $4,202,000
Interest on Debt: $4,174,000
- Intergovernmental to Local - Other - Central Staff Services: $1,689,000
Other - Regular Highways: $659,000
Other - Libraries: $170,000
- Local Intergovernmental - Other: $1,131,000
Health and Hospitals: $36,000
- Long Term Debt - Beginning Outstanding - Unspecified Public Purpose: $109,419,000
Outstanding Unspecified Public Purpose: $107,124,000
Outstanding Unspecified Public Purpose: $99,836,000
Beginning Outstanding - Unspecified Public Purpose: $87,655,000
Issue, Unspecified Public Purpose: $70,543,000
Retired Unspecified Public Purpose: $51,074,000
Retired Unspecified Public Purpose: $9,583,000
Beginning Outstanding - Public Debt for Private Purpose: $3,020,000
Retired Nonguaranteed - Public Debt for Private Purpose: $1,880,000
Outstanding Nonguaranteed - Industrial Revenue: $1,140,000
- Miscellaneous - General Revenue - Other: $5,110,000
General Revenue - Other: $4,928,000
Interest Earnings: $1,397,000
Fines and Forfeits: $1,102,000
Fines and Forfeits: $676,000
Sale of Property: $335,000
Rents: $147,000
Rents: $143,000
Interest Earnings: $53,000
Sale of Property: $8,000
- Other Capital Outlay - Hospitals: $16,262,000
Hospitals: $9,061,000
General - Other: $6,318,000
Police Protection: $2,558,000
Local Fire Protection: $1,933,000
Police Protection: $1,021,000
Local Fire Protection: $987,000
General Public Building: $389,000
Financial Administration: $286,000
Judicial and Legal Services: $214,000
Solid Waste Management: $206,000
Solid Waste Management: $137,000
Correctional Institutions: $122,000
Transit Utilities: $82,000
General - Other: $73,000
Central Staff Services: $34,000
Health - Other: $26,000
Judicial and Legal Services: $17,000
Sewerage: $6,000
Regular Highways: $3,000
- Other Funds - Cash and Securities: $118,312,000
Cash and Securities: $110,894,000
- Revenue - Water Utilities: $180,000
Water Utilities: $76,000
- Short Term Debt Outstanding - Beginning: $7,000,000
- Sinking Funds - Cash and Securities: $3,361,000
- State Intergovernmental - Other: $8,553,000
General Local Government Support: $4,496,000
Other: $2,591,000
Highways: $1,409,000
Highways: $622,000
Transit Utilities: $154,000
- Tax - Property: $42,192,000
Property: $33,628,000
Other Selective Sales: $9,981,000
Other Selective Sales: $9,298,000
Other License: $1,539,000
Other License: $1,330,000
Other: $747,000
Public Utilities Sales: $691,000
Occupation and Business License - Other: $380,000
Documentary and Stock Transfer: $222,000
Public Utilities Sales: $206,000
- Total Salaries and Wages: $121,339,000
: $100,919,000
- Water Utilities - Interest on Debt: $174,000
Orangeburg County government finances - Cash and Securities in 2018:
- Bond Funds - Cash and Securities: $28,716,000
Cash and Securities: $4,035,000
- Charges - Hospital Public: $221,255,000
Hospital Public: $218,031,000
Other: $7,326,000
Other: $5,247,000
Regular Highways: $2,556,000
Regular Highways: $2,491,000
Solid Waste Management: $1,728,000
Sewerage: $404,000
Sewerage: $399,000
- Construction - Regular Highways: $4,546,000
Correctional Institutions: $2,517,000
Hospitals: $2,461,000
General - Other: $1,674,000
General - Other: $1,370,000
Central Staff Services: $955,000
General Public Buildings: $948,000
Judicial and Legal Services: $817,000
Housing and Community Development: $816,000
Police Protection: $271,000
Sewerage: $40,000
Sewerage: $13,000
Parks and Recreation: $6,000
- Current Operations - Hospitals: $233,249,000
Hospitals: $210,338,000
Police Protection: $15,668,000
Police Protection: $9,427,000
Central Staff Services: $7,845,000
General - Other: $7,101,000
General - Other: $6,945,000
Solid Waste Management: $5,385,000
Judicial and Legal Services: $5,333,000
Correctional Institutions: $5,325,000
Correctional Institutions: $5,155,000
Solid Waste Management: $4,602,000
Health - Other: $4,514,000
Judicial and Legal Services: $4,451,000
Health - Other: $4,059,000
Financial Administration: $4,026,000
Regular Highways: $3,438,000
Central Staff Services: $3,388,000
Financial Administration: $2,683,000
Regular Highways: $2,450,000
General Public Buildings: $2,260,000
Local Fire Protection: $2,181,000
Libraries: $1,944,000
Local Fire Protection: $1,917,000
General Public Buildings: $1,862,000
Libraries: $1,535,000
Transit Utilities: $730,000
Parks and Recreation: $612,000
Water Utilities: $571,000
Sewerage: $567,000
Water Utilities: $511,000
Parks and Recreation: $496,000
Sewerage: $457,000
Protective Inspection and Regulation - Other: $351,000
Natural Resources - Other: $231,000
Natural Resources - Other: $54,000
- Federal Intergovernmental - Other: $875,000
Housing and Community Development: $826,000
- General - Interest on Debt: $4,202,000
Interest on Debt: $4,174,000
- Intergovernmental to Local - Other - Central Staff Services: $1,689,000
Other - Regular Highways: $659,000
Other - Libraries: $170,000
- Local Intergovernmental - Other: $1,131,000
Health and Hospitals: $36,000
- Long Term Debt - Beginning Outstanding - Unspecified Public Purpose: $109,419,000
Outstanding Unspecified Public Purpose: $107,124,000
Outstanding Unspecified Public Purpose: $99,836,000
Beginning Outstanding - Unspecified Public Purpose: $87,655,000
Issue, Unspecified Public Purpose: $70,543,000
Retired Unspecified Public Purpose: $51,074,000
Retired Unspecified Public Purpose: $9,583,000
Beginning Outstanding - Public Debt for Private Purpose: $3,020,000
Retired Nonguaranteed - Public Debt for Private Purpose: $1,880,000
Outstanding Nonguaranteed - Industrial Revenue: $1,140,000
- Miscellaneous - General Revenue - Other: $5,110,000
General Revenue - Other: $4,928,000
Interest Earnings: $1,397,000
Fines and Forfeits: $1,102,000
Fines and Forfeits: $676,000
Sale of Property: $335,000
Rents: $147,000
Rents: $143,000
Interest Earnings: $53,000
Sale of Property: $8,000
- Other Capital Outlay - Hospitals: $16,262,000
Hospitals: $9,061,000
General - Other: $6,318,000
Police Protection: $2,558,000
Local Fire Protection: $1,933,000
Police Protection: $1,021,000
Local Fire Protection: $987,000
General Public Building: $389,000
Financial Administration: $286,000
Judicial and Legal Services: $214,000
Solid Waste Management: $206,000
Solid Waste Management: $137,000
Correctional Institutions: $122,000
Transit Utilities: $82,000
General - Other: $73,000
Central Staff Services: $34,000
Health - Other: $26,000
Judicial and Legal Services: $17,000
Sewerage: $6,000
Regular Highways: $3,000
- Other Funds - Cash and Securities: $118,312,000
Cash and Securities: $110,894,000
- Revenue - Water Utilities: $180,000
Water Utilities: $76,000
- Short Term Debt Outstanding - Beginning: $7,000,000
- Sinking Funds - Cash and Securities: $3,361,000
- State Intergovernmental - Other: $8,553,000
General Local Government Support: $4,496,000
Other: $2,591,000
Highways: $1,409,000
Highways: $622,000
Transit Utilities: $154,000
- Tax - Property: $42,192,000
Property: $33,628,000
Other Selective Sales: $9,981,000
Other Selective Sales: $9,298,000
Other License: $1,539,000
Other License: $1,330,000
Other: $747,000
Public Utilities Sales: $691,000
Occupation and Business License - Other: $380,000
Documentary and Stock Transfer: $222,000
Public Utilities Sales: $206,000
- Total Salaries and Wages: $121,339,000
: $100,919,000
- Water Utilities - Interest on Debt: $174,000
Supplemental Security Income (SSI) in 2006:
- Total number of recipients: 4,018
- Number of aged recipients: 583
- Number of blind and disabled recipients: 3,435
- Number of recipients under 18: 588
- Number of recipients between 18 and 64: 2,304
- Number of recipients older than 64: 1,126
- Number of recipients also receiving OASDI: 1,623
- Amount of payments (thousands of dollars): 1,678
| Most common first names in Orangeburg County, SC among deceased individuals | ||
| Name | Count | Lived (average) |
|---|---|---|
| James | 765 | 69.4 years |
| John | 619 | 71.7 years |
| Mary | 565 | 76.6 years |
| Willie | 443 | 70.8 years |
| William | 440 | 71.1 years |
| George | 350 | 71.7 years |
| Annie | 345 | 77.8 years |
| Robert | 334 | 68.7 years |
| Henry | 264 | 71.8 years |
| Thomas | 262 | 71.9 years |
| Most common last names in Orangeburg County, SC among deceased individuals | ||
| Last name | Count | Lived (average) |
|---|---|---|
| Williams | 598 | 72.4 years |
| Johnson | 443 | 70.3 years |
| Brown | 378 | 70.7 years |
| Davis | 336 | 72.9 years |
| Jones | 260 | 72.3 years |
| Shuler | 259 | 72.6 years |
| Smith | 256 | 74.0 years |
| Fogle | 203 | 70.0 years |
| Robinson | 196 | 71.0 years |
| Green | 175 | 71.1 years |
| Businesses in Orangeburg County, SC | ||||
| Name | Count | Name | Count | |
|---|---|---|---|---|
| AT&T | 1 | Lowe's | 1 | |
| Ace Hardware | 3 | Marriott | 1 | |
| Advance Auto Parts | 3 | MasterBrand Cabinets | 4 | |
| Applebee's | 1 | McDonald's | 5 | |
| Arby's | 1 | Motel 6 | 1 | |
| AutoZone | 1 | New Balance | 1 | |
| Bath & Body Works | 1 | Nike | 8 | |
| Best Western | 2 | Nissan | 1 | |
| Burger King | 4 | OfficeMax | 1 | |
| CVS | 4 | Papa John's Pizza | 1 | |
| Chevrolet | 1 | Payless | 1 | |
| Church's Chicken | 1 | Pizza Hut | 3 | |
| Comfort Inn | 1 | Popeyes | 1 | |
| Cracker Barrel | 2 | Quality | 1 | |
| Curves | 1 | RadioShack | 1 | |
| Days Inn | 1 | Ruby Tuesday | 1 | |
| Domino's Pizza | 2 | Rue21 | 1 | |
| FedEx | 6 | Ryan's Grill | 1 | |
| Firestone Complete Auto Care | 1 | Ryder Rental & Truck Leasing | 1 | |
| Foot Locker | 1 | SAS Shoes | 1 | |
| Ford | 2 | SONIC Drive-In | 1 | |
| GNC | 1 | Sears | 1 | |
| GameStop | 1 | Sleep Inn | 1 | |
| H&R Block | 4 | Sprint Nextel | 1 | |
| Hardee's | 3 | Subway | 3 | |
| Hilton | 2 | Super 8 | 2 | |
| Holiday Inn | 2 | T.J.Maxx | 1 | |
| Honda | 1 | Taco Bell | 1 | |
| Howard Johnson | 2 | Toyota | 1 | |
| IHOP | 1 | Travelodge | 1 | |
| JCPenney | 1 | True Value | 1 | |
| Jones New York | 1 | U-Haul | 11 | |
| KFC | 4 | UPS | 12 | |
| Kincaid | 1 | Verizon Wireless | 1 | |
| Kmart | 1 | Waffle House | 3 | |
| La-Z-Boy | 2 | Walgreens | 2 | |
| Lane Furniture | 5 | Walmart | 1 | |
| Little Caesars Pizza | 1 | YMCA | 1 | |
Orangeburg County on our top lists:
- #8 on the list of "Top 101 counties with the lowest percentage of residents that visited a dentist within the past year"
- #9 on the list of "Top 101 counties with the lowest percentage of residents that exercised in the past month"
- #14 on the list of "Top 101 counties with the highest average weight of females"
- #22 on the list of "Top 101 counties with the highest percentage of residents that drank alcohol in the past 30 days"
- #26 on the list of "Top 101 counties with the worst general health status score of residents (1-5), 3 years of data"
- #31 on the list of "Top 101 counties with the lowest percentage of residents that smoked 100+ cigarettes in their lives"
- #42 on the list of "Top 101 counties with highest percentage of residents voting for Obama (Democrat) in the 2012 Presidential Election (pop. 50,000+)"
- #56 on the list of "Top 101 counties with the largest number of people moving out compared to moving in (pop. 50,000+)"
- #78 on the list of "Top 101 counties with the most Black Protestant congregations (pop. 50,000+)"
- #81 on the list of "Top 101 counties with highest percentage of residents voting for Obama (Democrat) in the 2012 Presidential Election"
- #83 on the list of "Top 101 counties with the smallest number of children under 18 without health insurance coverage in 2000 (pop. 50,000+)"
- #84 on the list of "Top 101 counties with the most Black Protestant congregations"
- #98 on the list of "Top 101 counties with the most Black Protestant adherents"
- #98 on the list of "Top 101 counties with the most Black Protestant adherents (pop. 50,000+)"