When considering a move to Baltimore, MD or Alexandria, VA, one will inevitably find contrasting yet appealing characteristics in both cities. Baltimore, defined by its rich historical legacy, vibrant arts scene, and world-class medical facilities, offers a distinct urban appeal. Alexandria, on the other hand, charms with its small-town feel, stunning colonial architecture, and seamless blend of historical significance and bustling commerce.
Distance between
Baltimore, MD and
Alexandria, VA : 41.8 miles
Baltimore's population is larger by 273%. Its population has decreased by 74,656 people (11.5%) since 2000. The population of Alexandria has grown by 26,423 people (20.6%) during that time.
In terms of safety, Alexandria tends to have a lower crime rate compared to Baltimore. According to Neighborhood Scout, Alexandria is safer than 38% of U.S. cities, while Baltimore's higher crime rate means it is safer than only 6% of U.S. cities. However, specific neighborhoods in Baltimore, such as Roland Park and the Inner Harbor, are quite safe with strong community involvement contributing to an enhanced sense of security.
City-data.com crime index counts serious crimes and violent crime more heavily. It adjusts for the number of visitors and daily workers commuting into cities. (higher means more crime, U.S. average = 301.1)
City-data.com crime index counts serious crimes and violent crime more heavily. It adjusts for the number of visitors and daily workers commuting into cities. (higher means more crime, U.S. average = 301.1)
Sex Offenders
According to our data, there are 1,557 registered sex offenders living in Baltimore and 272 registered sex offenders living in . The ratio of residents to sex offenders in Baltimore is 395 to 1; the ratio in Alexandria is 573 to 1. The number of registered sex offenders compared to the number of residents is larger in Baltimore than in Alexandria.
Cost of Living
Living in Alexandria is generally more expensive than in Baltimore. The cost of housing, groceries, health care, and transportation are all significantly higher in Alexandria. In contrast, Baltimore offers a lower cost of living, making it more affordable for those on a budget.
Income Tax
Both Alexandria and Baltimore mandate state income taxes. In Maryland, Baltimore residents pay a county tax in addition to state tax, while in Virginia, Alexandria residents pay only state tax. Overall, Maryland has a higher top marginal income tax rate than Virginia.
Property Tax
Property taxes are higher in Baltimore than in Alexandria. This in part compensates for the lower living costs in Baltimore, but can be significant for homeowners.
Sales Tax
Sales tax in both cities is relatively close, with Alexandria at 6% and Baltimore at 6%. Both Maryland and Virginia do not have local sales taxes.
Income
Type
Baltimore
Alexandria
Estimated median household income
$54,652
$101,162
Estimated per capita income
$35,091
$68,020
Cost of living index (U.S. average is 100)
105.7
171.5
If you make $50,000 in Baltimore, you will have to make $81,126 in Alexandria to maintain the same standard of living.
Geographical Conditions
Baltimore offers a mix of urban and suburban landscapes with access to natural havens like Chesapeake Bay. Alexandria, meanwhile, is known for its well-preserved historic district and close proximity to Potomac River, offering beautiful views and recreational opportunities.
Both cities have excellent educational offerings. Baltimore is home to renowned institutions like Johns Hopkins University and Loyola University Maryland. Alexandria also boasts reputable schools, like T.C. Williams High School of "Remember the Titans" fame. In terms of public schools, Alexandria beats Baltimore with higher ratings overall, according to GreatSchools.
Baltimore's economy is diversified with strong sectors in health, education, and technology. Its position on Chesapeake Bay also allows for a robust blue economy. Meanwhile, Alexandria's economy relies heavily on federal employment and professional services, benefiting from its proximity to Washington D.C.
Biggest Employers
In Baltimore, the largest employers include Johns Hopkins University & Health System and the University of Maryland. In Alexandria, the Department of Defense, City of Alexandria, and Alexandria City Public Schools are among the largest employers.
There were 191 building permits issued in Baltimore in 2012 (116 more than in 2011) compared to 12 building permits issued in Alexandria in 2012 (93 less than in 2011).
In Baltimore (Baltimore city), 87.4% voted for Democrats and 11.1% for Republicans in 2012 Presidential Election. In Alexandria (Alexandria city), 71.3% voted for Democrats and 27.7% for Republicans.
Elections
Type
Democrats
Republicans
Other
Year
Baltimore
Alexandria
Baltimore
Alexandria
Baltimore
Alexandria
2020
87.5%
80.3%
10.7%
17.6%
1.8%
2.1%
2016
84.8%
75.6%
10.5%
17.5%
4.6%
6.9%
2012
87.4%
71.3%
11.1%
27.7%
1.4%
1.0%
2008
87.6%
71.9%
11.7%
27.3%
0.6%
0.8%
2004
82.5%
66.8%
17.1%
32.3%
0.5%
0.9%
2000
82.9%
61.2%
14.2%
34.6%
2.9%
4.2%
1996
79.3%
61.6%
15.5%
34.3%
5.1%
4.1%
Breakdown of population affiliated with a religious congregation
Type
Adherents
Congregations
Religion
Baltimore
Alexandria
Baltimore
Alexandria
CATHOLIC CHURCH
11.0%
13.3%
8.2%
4.2%
EPISCOPAL CHURCH
1.6%
5.8%
4.0%
8.4%
AMERICAN BAPTIST CHURCHES IN THE USA
1.4%
0.8%
2.2%
3.2%
SOUTHERN BAPTIST CONVENTION
1.4%
4.1%
7.3%
9.5%
EVANGELICAL LUTHERAN CHURCH IN AMERICA
1.0%
0.3%
4.3%
1.1%
MUSLIM ESTIMATE
0.6%
2.5%
1.5%
1.1%
SEVENTH DAY ADVENTIST CHURCH
0.5%
1.1%
1.5%
3.2%
LUTHERAN CHURCH
0.4%
0.2%
1.8%
1.1%
PRESBYTERIAN CHURCH IN AMERICA
0.1%
0.4%
0.6%
2.1%
Weather
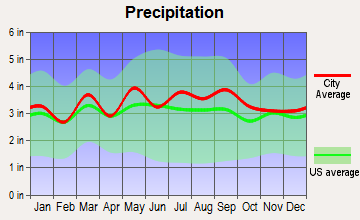
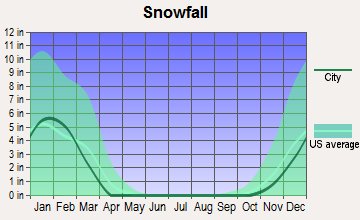
The weather in both cities is relatively similar due to their close proximity. Summers can be hot and humid, while winters are generally mild to chilly. However, compared to Baltimore, Alexandria experiences slightly fewer days of precipitation. For those who enjoy the snow, Baltimore tends to see more days of snowfall in winter than Alexandria.
Weather and climate
Type
Baltimore
Alexandria
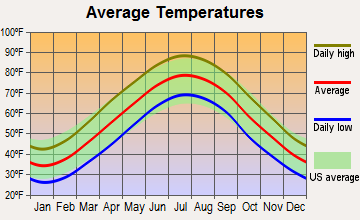
Temperature - Average
54.5°F
57.2°F
Humidity - Average morning or afternoon humidity
70.4%
68.8%
Humidity - Differences between morning and afternoon humidity
36%
33%
Humidity - Maximum monthly morning or afternoon humidity
84%
81%
Humidity - Minimum monthly morning or afternoon humidity
48%
48%
Precipitation - Yearly average
42.9 in
40.6 in
Snowfall - Yearly average
39.6 in
32.4 in
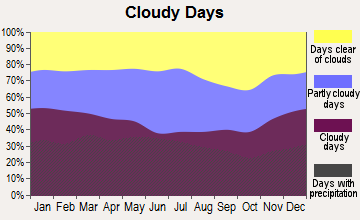
Clouds - Number of days clear of clouds
17.5%
15.9%
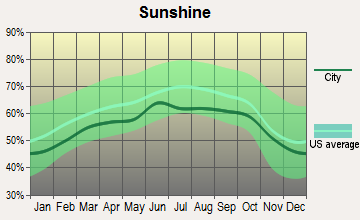
Sunshine amount - Average
60.3%
61.5%
Sunshine amount - Differences during a year
16%
21%
Sunshine amount - Maximum monthly
63%
66%
Sunshine amount - Minimum monthly
47%
45%
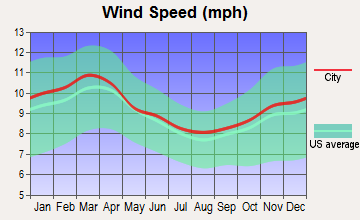
Wind speed - Average
7.9 mph
9.7 mph
Average climate in Baltimore, Maryland
Average climate in Alexandria, Virginia
Air pollution
Type
AQI
CO
NO2
OZONE
PB
PM10
PM25
SO2
Year
Baltimore
Alexandria
Baltimore
Alexandria
Baltimore
Alexandria
Baltimore
Alexandria
Alexandria
Baltimore
Alexandria
Baltimore
Alexandria
Baltimore
Alexandria
2018
89
88
0.23
0.31
11.8
10.4
28.3
25.5
N/A
N/A
N/A
16.4
7.9
7.7
0.1
0.6
2017
89
84
0.25
0.29
12.1
10.7
27.7
27.0
N/A
N/A
N/A
16.5
8.2
8.0
0.2
0.5
2016
102
98
0.26
0.31
13.0
12.1
28.3
27.0
0.002
N/A
N/A
17.2
7.7
7.5
0.3
0.5
2015
89
91
0.28
0.33
12.4
12.0
28.3
26.8
0.002
N/A
N/A
17.0
9.5
8.2
0.4
0.9
2014
82
84
0.25
0.31
11.8
12.0
25.7
26.5
0.002
N/A
N/A
17.1
10.9
8.2
0.6
1.0
2013
86
88
0.22
0.34
10.7
12.3
25.6
25.3
0.002
N/A
N/A
17.3
9.6
8.7
0.5
0.7
2012
98
103
0.24
0.26
11.3
13.0
25.0
26.9
0.002
N/A
N/A
N/A
11.2
9.3
0.5
0.6
2011
101
105
0.24
0.29
12.5
13.1
25.1
27.4
0.002
N/A
N/A
N/A
12.1
9.9
0.8
0.7
2010
110
114
0.24
0.22
13.1
15.7
26.9
28.6
0.003
N/A
N/A
N/A
12.2
9.8
1.0
2.1
2009
84
90
0.23
0.19
12.2
15.2
23.5
24.1
0.002
N/A
N/A
N/A
10.4
8.2
1.4
2.0
2008
96
103
0.25
0.24
13.6
15.9
21.6
23.8
0.003
N/A
N/A
N/A
12.8
9.0
1.8
3.0
2007
107
113
0.21
0.24
13.8
17.0
23.2
27.0
0.004
N/A
N/A
N/A
14.0
10.4
2.5
3.3
2006
112
114
N/A
0.31
12.0
19.1
24.6
25.4
0.004
N/A
N/A
N/A
14.7
10.9
N/A
2.9
2005
111
105
N/A
0.38
14.3
23.3
26.3
22.4
0.006
N/A
23.0
N/A
17.1
11.7
N/A
4.6
2004
108
113
N/A
0.35
15.3
24.1
28.0
22.5
0.004
N/A
23.1
N/A
16.3
11.3
N/A
5.5
2003
110
108
N/A
0.42
17.8
23.5
22.4
21.5
N/A
N/A
N/A
N/A
13.9
12.2
N/A
5.8
2002
119
125
N/A
0.52
17.4
24.7
19.4
24.5
N/A
N/A
N/A
N/A
16.3
N/A
5.8
6.1
2001
104
110
N/A
0.54
18.2
23.3
23.9
22.5
0.017
N/A
N/A
N/A
N/A
N/A
6.0
5.7
2000
101
110
N/A
0.60
17.0
23.0
22.4
19.1
N/A
N/A
N/A
N/A
N/A
N/A
6.3
6.4
Natural disasters
Type
Baltimore
Alexandria
Tornado activity compared to U.S. average
117.8%
108.9%
Earthquake activity compared to U.S. average
40.6%
43.4%
Natural disasters compared to U.S. average
0%
0%
Transportation
Both cities have extensive public transportation networks. Baltimore has the Charm City Circulator, metro subway, and light rail system, while Alexandria has the DASH bus and Metrorail system. Alexandria, being closer to Washington D.C., offers more predictable commuting times and better access to nationwide train routes.
Transport
Type
Baltimore
Alexandria
Amtrak stations
2
1
Amtrak stations nearby
2
3
FAA registered aircraft
136
163
FAA registered aircraft manufacturers and dealers
2
0
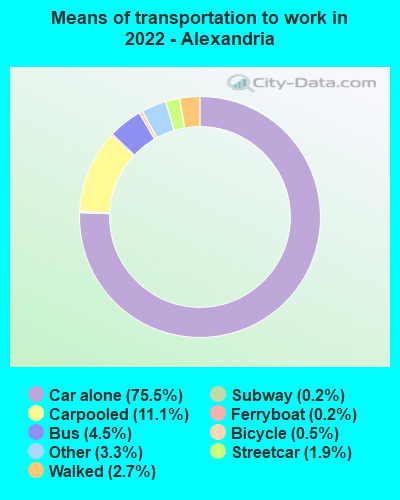
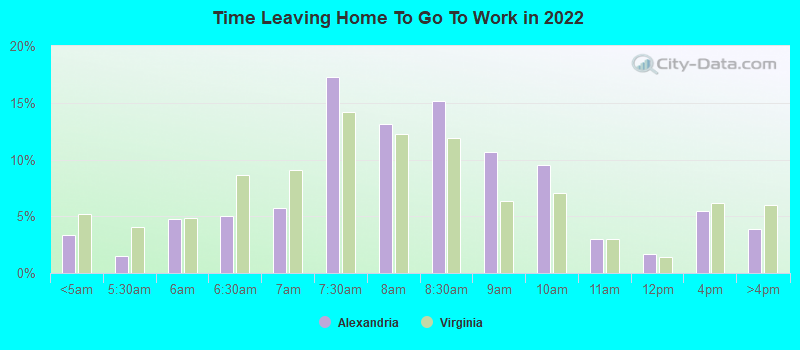
Means of transportation to work
Type
Baltimore
Alexandria
Bicycle
0.4%
0.8%
Bus
6.2%
7%
Carpooled
7.3%
13.1%
Car alone
77.2%
70.5%
Motorcycle
0%
0.1%
Railroad
0.3%
0.1%
Streetcar
1.2%
2.2%
Subway
0.2%
1%
Taxicab
0.7%
0.5%
Walked
4.5%
3.3%
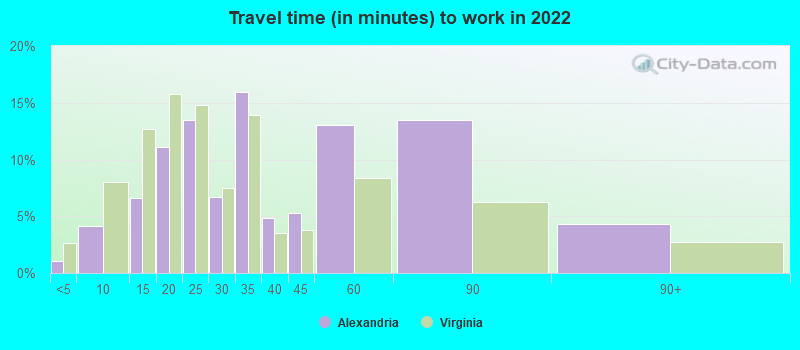
Average travel time to work
Type
Baltimore
Alexandria
Average
32.3 min
33.8 min
Other means
26.3 min
28.5 min
Public transportation
46.8 min
43.6 min
Private vehicle occupancy
Type
Baltimore
Alexandria
Average
1.1
1.2
Drove alone
90.7%
88.7%
In 2 person carpool
7.5%
8.1%
In 3 person carpool
1%
1.2%
In 4 person carpool
0.4%
1.9%
In 5-6 person carpool
0.3%
0.2%
In 7+ person carpool
0.2%
0%
How many people usually rode to work in the car, truck or van.
Real Estate
In terms of real estate, Baltimore offers a wider range of prices, with homes in various styles from row houses to large suburban single-family homes. Alexandria's real estate is more expensive, reflecting its higher cost of living, but it offers charming historic homes and modern condominiums.
Neighborhoods
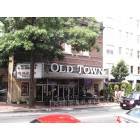
Baltimore's neighborhoods are varied, rich in historical and cultural diversity from the water-oriented community of Fells Point to artsy Station North. On the other hand, Alexandria's neighborhoods combine historic elegance with modern urban living, from beautiful Old Town to the more residential Del Ray.
Houses and residents
Type
Baltimore
Alexandria
Houses
293,487
80,350
Average household size (people)
2.4
2
Median year apartment built
1959
1977
Median year house/condo built
1944
1970
Length of stay in the house since moving in
15.7 years
10.9 years
Houses occupied
254,370 (86.7%)
72,024 (89.6%)
Houses occupied by owners
123,249 (48.5%)
31,137 (43.2%)
Houses occupied by renters
131,121 (51.5%)
40,887 (56.8%)
Median rent asked for vacant for-rent units
$1,254
$3,780
Median monthly housing costs
$1,196
$1,930
Median price asked for vacant for-sale houses and condos
$207,303
$1,479,435
Estimated median house or condo value
$193,100
$630,500
Median numbers of rooms
5.6
4.2
Median number of rooms in apartments
4.2
3.7
Median number of rooms in houses and condos
6.5
5.8
Median house price - detached houses
$321,473
$994,240
Median house price - in 2-unit structures
$218,934
$620,900
Median house price - in 3-to-4-unit structures
$142,945
$386,591
Median house price - in 5 or more unit structures
$257,173
$338,886
Median house price - Townhouses or other attached units
$210,096
$767,898
Median house price - All housing units
$246,241
$697,053
Median house age
72
47
Renting percentage
52.3%
56.7%
Housing density (houses/condos per square mile)
3,632.1
5,293.9
House value disparities
38.5%
29.5%
Household income disparities
49.4%
41.2%
Median household income for houses/condes with a mortgage
$85,990
$163,037
Median household income for apartments without a mortgage
$53,334
$112,052
Housing units without a mortgage
2,415 (2.8%)
279 (1.1%)
Housing units with both a second mortgage and home equity loan
5,740 (6.6%)
1,736 (7.1%)
Housing units with a mortgage
84,578 (97.2%)
24,232 (98.9%)
Housing units with a home equity loan
579 (0.7%)
131 (0.5%)
Housing units with a second mortgage
8,544 (9.8%)
2,115 (8.6%)
House/condo owner moved in on average (years ago)
14
7
House/condo renter moved in on average (years ago)
3
1
Housing units lacking complete kitchen facilities
6%
0.7%
Housing units lacking complete plumbing facilities
5.1%
0.5%
Housing units in structures
Housing units in structures
Baltimore
Alexandria
One, detached
16.4%
13.5%
One, attached
49.5%
20.9%
Two
4.5%
1.0%
3 or 4
4.9%
2.6%
5 to 9
5.5%
7.4%
10 to 19
4.8%
13.6%
20 to 49
2.8%
5.2%
50 or more
11.4%
35.8%
Mobile homes
0.2%
0.0%
Boats, RVs, vans, etc.
0.1%
0.0%
Median real estate property taxes paid for housing units
Self-employed workers in own not incorporated business
12,671
4,414
State government workers
20,410
1,833
Unpaid family workers
356
84
Industries and Occupations
Healthcare (Johns Hopkins), academics, and maritime industries are the pillars of Baltimore's economy. Alexandria leans on professional, scientific, technical services, and public administration reflecting its close ties with the federal government.
In terms of healthcare, Baltimore houses world-class medical institutions like Johns Hopkins Hospital. Meanwhile, Alexandria residents have access to a selection of highly-regarded healthcare facilities within the city and nearby D.C. area, including Inova Alexandria Hospital and Georgetown University Hospital.
Baltimore's infrastructure, notably its collections of historic architecture and marine facilities, offer unique appeal. Conversely, Alexandria depicts well-preserved colonial-era streets, properties, and waterfronts. However, both cities are working to improve their aging infrastructures, like roads and bridges.
Infrastructure
Type
Baltimore
Alexandria
Hospitals
45
4
TV stations
19
25
Bank branches located here
215
85
Bank institutions located here
44
15
Main business address for public companies
27
10
Drinking water stations with no reported violations in the past
13
1
Drinking water stations with reported violations in the past
HMDA - Conventional home purchase loans - Applications denied
Year
Baltimore
Alexandria
1999
2,486
0
2000
2,058
0
2001
1,371
0
2002
1,111
0
2003
1,526
231
2004
2,929
430
2005
4,981
642
2006
5,533
561
2007
3,592
314
2008
1,111
170
2009
381
80
Culture and Food
Both cities have vibrant cultures. Baltimore's rich history can be seen in its architecture, museums, and festivals. The city's food scene offers impressive seafood, notably its famous crabs. Alexandria's culture is steeped in its colonial and African-American roots. Not to be outdone in the culinary department, Alexandria offers nationally recognized dining experiences, featuring a blend of comfort food and international cuisine.
Sports Teams
For major sports enthusiasts, Baltimore has the upper hand with two major league teams, the Baltimore Ravens in NFL and the Baltimore Orioles in MLB. Alexandria residents, however, typically support D.C. area teams like the Washington Redskins, Washington Nationals, and the Washington Capitals.


 Baltimore, MD
 Alexandria, VA