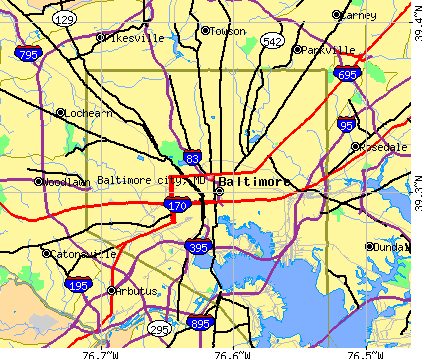
Baltimore city, Maryland (MD)
County owner-occupied free and clear houses and condos in 2010: 29,715
County owner-occupied houses and condos in 2000: 129,879
Renter-occupied apartments: 130,740 (it was 128,117 in 2000)
| % of renters here: | 50% |
| State: | 32% |
Land area: 81 sq. mi.
Water area: 11.3 sq. mi.
Population density: 7053 people per square mile (very high).
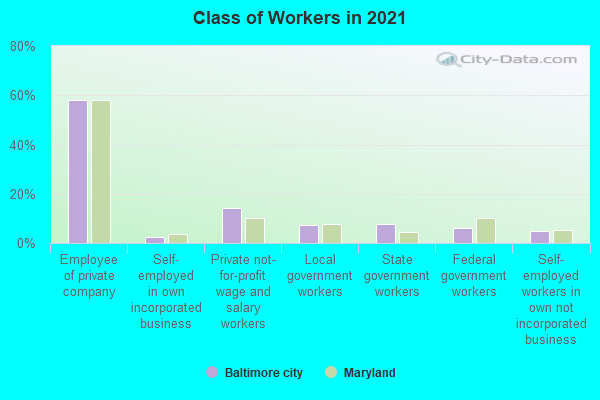
Industries providing employment: Educational, health and social services (31.8%), Professional, scientific, management, administrative, and waste management services (13.0%).
Type of workers:
- Private wage or salary: 73%
- Government: 22%
- Self-employed, not incorporated: 4%
- Unpaid family work: 0%
- OSM Map
- General Map
- Google Map
- MSN Map

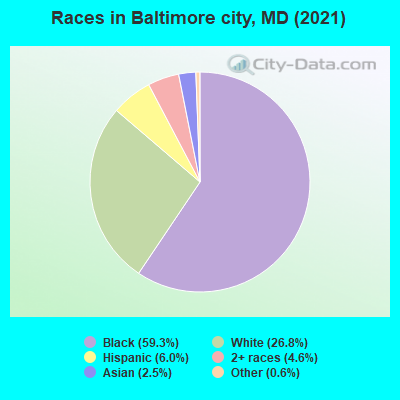
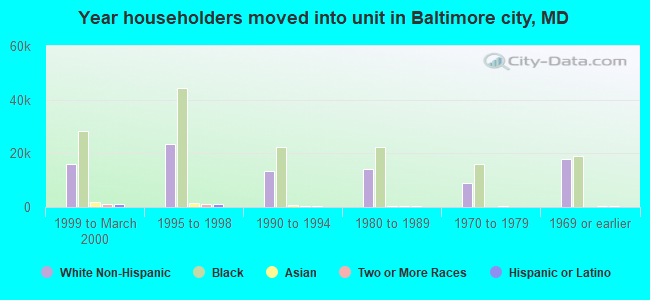
- 341,76160.0%Black Non-Hispanic Alone
- 150,90726.5%White Non-Hispanic Alone
- 36,1246.3%Hispanic or Latino
- 19,7853.5%Two or more races
- 15,9442.8%Asian alone
- 4,0220.7%Some other race alone
- 9930.2%American Indian and Alaska Native alone
- 3950.07%Native Hawaiian and Other
Pacific Islander alone
| Median resident age: | 36.5 years |
| Maryland median age: | 39.7 years |
| Males: 265,199 | |
| Females: 304,732 |

 | Gun Buyback program for Baltimore City (25 replies) |
| Do Marylanders consider themselves "North Eastern" (62 replies) |
| Any idea on Baltimore City Speed Camera Ticket - Contest? (7 replies) |
| Baltimore City Schools (4 replies) |
| I miss Maryland (106 replies) |
| Could Preakness Leave Baltimore? (119 replies) |
| Baltimore city: | 2.0 people |
| Maryland: | 3 people |
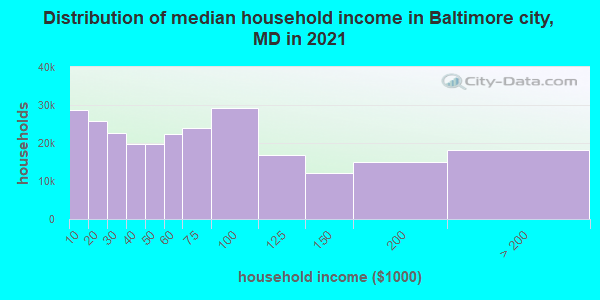
Estimated median household income in 2022: $55,198 ($30,078 in 1999)
| This county: | $55,198 |
| Maryland: | $94,991 |
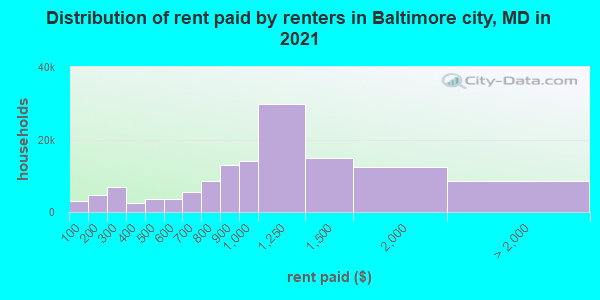
Median contract rent in 2022 for apartments: $1,043 (lower quartile is $737, upper quartile is $1,368)
| This county: | $1043 |
| State: | $1388 |
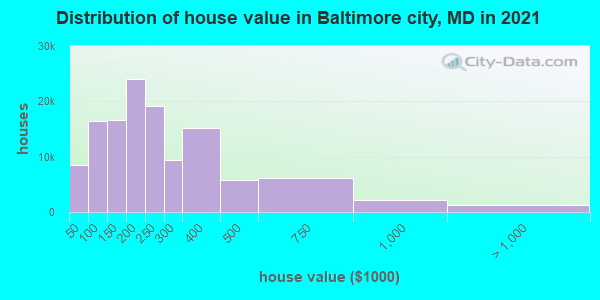
Estimated median house or condo value in 2022: $210,300 (it was $69,900 in 2000)
| Baltimore city: | $210,300 |
| Maryland: | $398,100 |
Mean price in 2022:
Median monthly housing costs for homes and condos with a mortgage: $1,608Detached houses: $358,828
Here: $358,828 State: $526,819 Townhouses or other attached units: $221,452
Here: $221,452 State: $328,305 In 2-unit structures: $273,134
Here: $273,134 State: $346,599 In 3-to-4-unit structures: $224,361
Here: $224,361 State: $295,378 In 5-or-more-unit structures: $335,179
Here: $335,179 State: $350,378 Mobile homes: $133,518
Here: $133,518 State: $89,353 Occupied boats, RVs, vans, etc.: $223,466
Here: $223,466 State: $254,500
Median monthly housing costs for units without a mortgage: $611
Institutionalized population: 9,951
Health of residents in Baltimore city based on CDC Behavioral Risk Factor Surveillance System Survey Questionnaires from 2013 to 2021:
General health status score of residents in this county from 1 (poor) to 5 (excellent) is 3.5. This is about average.73.7% of residents exercised in the past month. This is about average.
41.4% of residents smoked 100+ cigarettes in their lives. This is about average.
56.5% of adult residents drank alcohol in the past 30 days. This is less than average.
72.1% of residents visited a dentist within the past year. This is about average.
Average weight of males is 198 pounds. This is about average.
Average weight of females is 166 pounds. This is about average.
Health of residents in Baltimore city based on CDC Behavioral Risk Factor Surveillance System Survey Questionnaires from 2003 to 2012:
General health status score of residents in this county from 1 (poor) to 5 (excellent) is 3.4. This is worse than average.68.7% of residents exercised in the past month. This is less than average.
48.4% of residents smoked 100+ cigarettes in their lives. This is about average.
71.2% of adult residents drank alcohol in the past 30 days. This is about average.
66.7% of residents visited a dentist within the past year. This is less than average.
Average weight of males is 196 pounds. This is about average.
Average weight of females is 171 pounds. This is more than average.
11.2% of residents keep firearms around their homes. This is less than average.
Median real estate property taxes paid for housing units with mortgages in 2022: $3,337 (1.5%)
Median real estate property taxes paid for housing units with no mortgage in 2022: $2,576 (1.5%)
| Baltimore city: | 18.5% |
| Maryland: | 9.6% |
Median age of residents in 2022: 36.5 years old
(Males: 35.0 years old, Females: 38.2 years old)
(Median age for: White residents: 37.9 years old, Black residents: 38.3 years old, American Indian residents: 44.0 years old, Asian residents: 32.2 years old, Hispanic or Latino residents: 27.1 years old, Other race residents: 27.9 years old)
Area name: Baltimore-Towson, MD HUD Metro FMR Area
Fair market rent in 2006 for a 1-bedroom apartment in Baltimore city is $791 a month.
Fair market rent for a 2-bedroom apartment is $950 a month.
Fair market rent for a 3-bedroom apartment is $1220 a month.
Cities in this county include: Baltimore.
2023 air pollution in Baltimore city:
Ozone (1-hour): 0.039 ppm (standard limit: 0.12 ppm). Near U.S. average.
Notable locations in this county outside city limits:
Notable locations in Baltimore city: Dorsey Business Center (A), Dorsey Run Industrial Park (B), Route 94 Business Center (C), Hopkins Applied Physics Lab (D), Cissel Farm (E), Port Capital Center Industrial Park (F), Kalmia Farms (G), Route 100 Industrial Park (H), Corridor Industrial Park (I), Turf Valley Country Club (J), University of Maryland Central Farm (K), Waverly (L), Junction Industrial Park (M), Woodbine Campground (N), Woodcamp Farm (O), Howard County Landfill (P), Greenwood Farm (Q), Maryland Wholesale Food Center (R), Days End Farm Horse Rescue (S), Kimberthy Turf Farms (T). Display/hide their locations on the map
Shopping Center: WEst Friendship Exchange Shopping Center (1). Display/hide its location on the map
Churches in Baltimore city include: Dayton Four Square Gospel Church (A), Asbury United Methodist Church (B), Hopkins United Methodist Church (C), Linthicum Chapel (D), Saint Louis Roman Catholic Church (E), Wearon Rolling Hills Church (F), Cedars Baptist Church (G), Dorsey Emanuel United Methodist Church (H), Kings Church of God (I). Display/hide their locations on the map
Cemeteries: Rosa Bonheur Pet Cemetery (1), Trinity Cemetery (2), Saint Johns Cemetery (3), Saint Louis Cemetery (4), Zion Cemetery (5), Hopkins Cemetery (6), Crestlawn Cemetery (7). Display/hide their locations on the map
Reservoirs: Bernstein Farm Pond (A), General Electric Retention Pond (B), Warfields Pond (C), Rigga Farm Pond (D), Johns Hopkins Pond (E). Display/hide their locations on the map
Streams, rivers, and creeks: Benson Branch (A), Cabin Branch (B), Cattail Creek (C), Lisbons Little Creek (D), Dorsey Branch (E), Terrapin Branch (F), Hay Meadow Branch (G), Piney Run (H). Display/hide their locations on the map
Parks in Baltimore city include: Schooley Mill Park (1), Patuxent River State Park (2), Carrs Mill Park (3), Glenwood Park (4), Cedar-Villa Heights Park (5), Howard County Fairground (6), Hugh Thomas Wildlife Management Area (7), Lisbon Park (8), Pfefferkorn Natural Environmental Area (9). Display/hide their locations on the map
Neighboring counties: Baltimore County  , Carroll County
  , Hardy County, West Virginia
  , Preston County, West Virginia , Monroe County, Indiana , Trego County, Kansas .
| Here: | 2.8% |
| Maryland: | 2.0% |
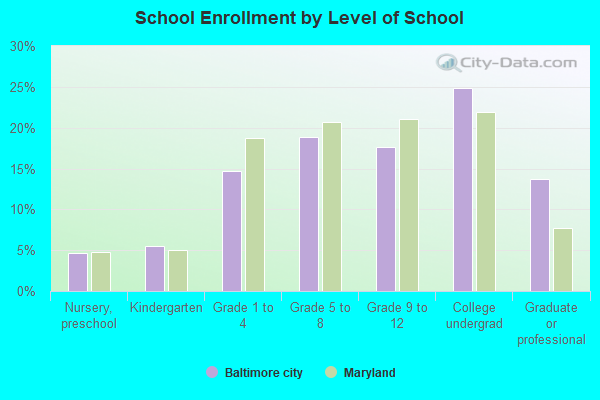
Current college students: 48,736
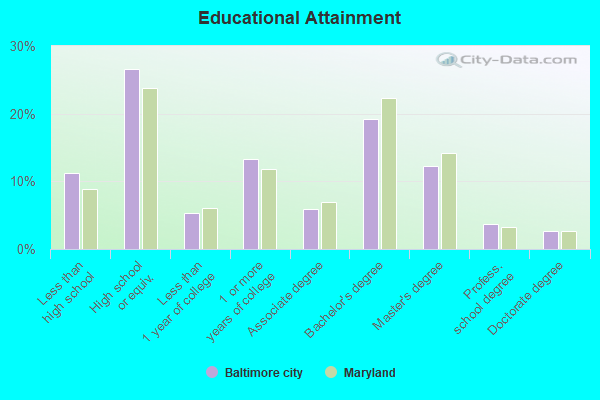
People 25 years of age or older with a high school degree or higher: 87.6%
People 25 years of age or older with a bachelor's degree or higher: 34.8%
Number of foreign born residents: 55,144 (45.8% naturalized citizens)
| Baltimore city: | 9.7% |
| Whole state: | 16.7% |
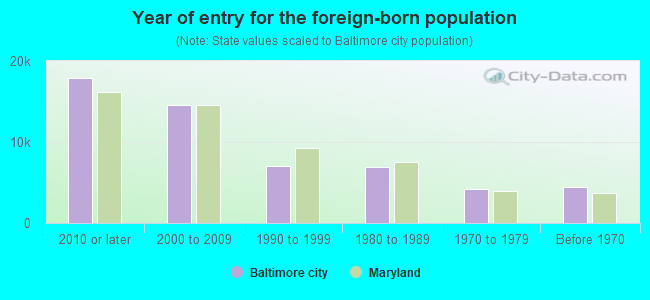
- Year of entry for the foreign-born population
- 27,3772010 or later
- 10,6502000 to 2009
- 7,1151990 to 1999
- 6,9751980 to 1989
- 4,1721970 to 1979
- 4,434Before 1970
Mean travel time to work (commute): minutes
Percentage of county residents living and working in this county: 97.4%
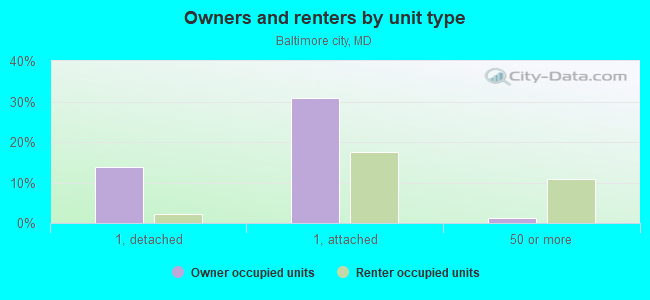
Housing units in structures:
- One, detached: 42,126
- One, attached: 152,504
- Two: 11,596
- 3 or 4: 14,247
- 5 to 9: 14,366
- 10 to 19: 11,486
- 20 to 49: 10,718
- 50 or more: 36,201
- Mobile homes: 570
- Boats, RVs, vans, etc.: 65
Housing units in Baltimore city with a mortgage: 77,968 (7,463 second mortgage, 477 home equity loan, 5,400 both second mortgage and home equity loan)
Houses without a mortgage: 1,679
| Here: | 98.7% with mortgage |
| State: | 97.5% with mortgage |
Religion statistics for Baltimore city
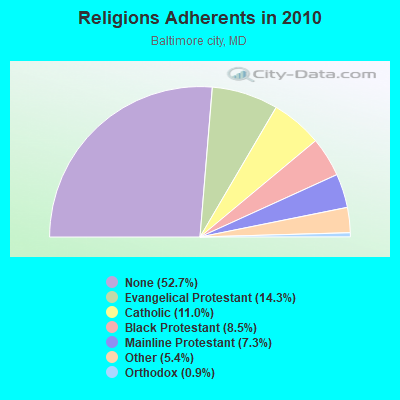
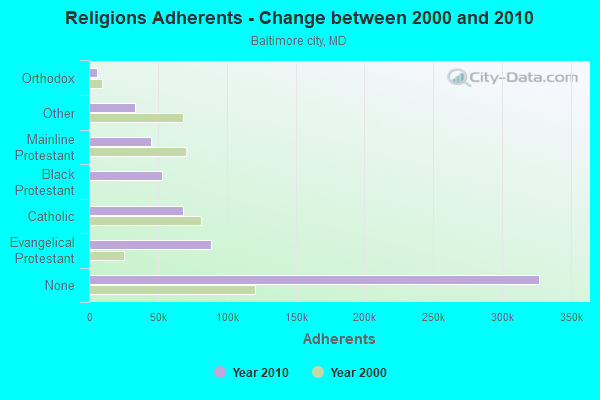
| Religion | Adherents | Congregations |
|---|---|---|
| Evangelical Protestant | 88,536 | 277 |
| Catholic | 68,003 | 56 |
| Black Protestant | 53,071 | 93 |
| Mainline Protestant | 45,316 | 167 |
| Other | 33,359 | 71 |
| Orthodox | 5,595 | 6 |
| None | 327,081 | - |
Source: Clifford Grammich, Kirk Hadaway, Richard Houseal, Dale E.Jones, Alexei Krindatch, Richie Stanley and Richard H.Taylor. 2012. 2010 U.S.Religion Census: Religious Congregations & Membership Study. Association of Statisticians of American Religious Bodies. Jones, Dale E., et al. 2002. Congregations and Membership in the United States 2000. Nashville, TN: Glenmary Research Center.
Food Environment Statistics:
| Baltimore city: | 3.08 / 10,000 pop. |
| State: | 1.96 / 10,000 pop. |
| This county: | 1.56 / 10,000 pop. |
| Maryland: | 1.22 / 10,000 pop. |
| Baltimore city: | 1.52 / 10,000 pop. |
| Maryland: | 2.05 / 10,000 pop. |
| This county: | 5.16 / 10,000 pop. |
| State: | 5.40 / 10,000 pop. |
| Baltimore city: | 12.1% |
| Maryland: | 9.1% |
| Baltimore city: | 32.1% |
| State: | 26.7% |
| Here: | 12.3% |
| State: | 15.5% |
Tornado activity:
Baltimore city historical area-adjusted tornado activity is significantly below Maryland state average. It is 1302734.3 times below overall U.S. average.Tornadoes in this county have caused 2 fatalities and 57 injuries recorded between 1950 and 2004.
On 9/24/2001, a category 3 (max. wind speeds 158-206 mph) tornado killed 2 people and injured 55 people and caused $101 million in damages.
Earthquake activity:
Baltimore city-area historical earthquake activity is significantly above Maryland state average. It is 59% smaller than the overall U.S. average.On 8/23/2011 at 17:51:04, a magnitude 5.8 (5.8 MW, Depth: 3.7 mi, Class: Moderate, Intensity: VI - VII) earthquake occurred 120.2 miles away from Baltimore city center
On 1/16/1994 at 01:49:16, a magnitude 4.6 (4.6 MB, 4.6 LG, Depth: 3.1 mi, Class: Light, Intensity: IV - V) earthquake occurred 77.1 miles away from the county center
On 9/25/1998 at 19:52:52, a magnitude 5.2 (4.8 MB, 4.3 MS, 5.2 LG, 4.5 MW, Depth: 3.1 mi) earthquake occurred 249.8 miles away from the county center
On 8/25/2011 at 05:07:52, a magnitude 4.5 (4.5 ML, Depth: 4.2 mi) earthquake occurred 119.1 miles away from the county center
On 12/9/2003 at 20:59:18, a magnitude 4.5 (4.5 ML, Depth: 6.2 mi) earthquake occurred 133.0 miles away from Baltimore city center
On 12/9/2003 at 20:59:14, a magnitude 4.5 (4.5 MB, 4.5 LG) earthquake occurred 137.9 miles away from the county center
Magnitude types: regional Lg-wave magnitude (LG), body-wave magnitude (MB), local magnitude (ML), surface-wave magnitude (MS), moment magnitude (MW)
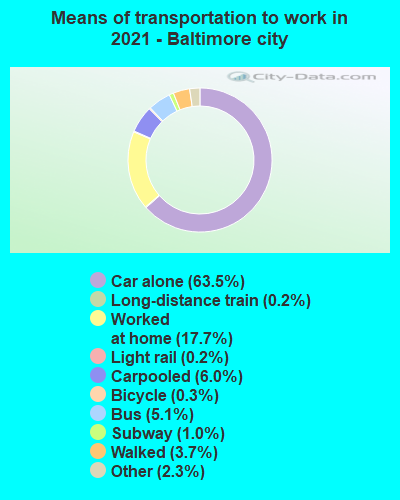
Means of transportation to work:
- Drove a car alone: 239,556 (65.5%)
- Carpooled: 29,293 (8.0%)
- Bus: 22,275 (6.1%)
- Subway or elevated rail: 4,839 (1.3%)
- Long-distance train or commuter rail: 1,322 (0.4%)
- Light rail, streetcar or trolley: 577 (0.2%)
- Ferryboat: 313 (0.1%)
- Taxicab, motorcycle, or other means: 5,934 (1.6%)
- Bicycle: 1,582 (0.4%)
- Walked: 11,856 (3.2%)
- Worked at home: 48,227 (13.2%)
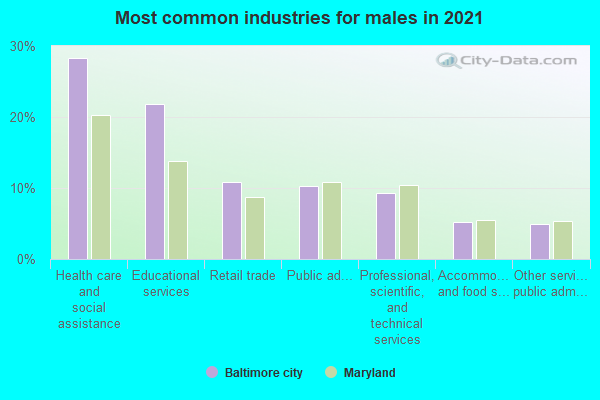
- Health care and social assistance (30%)
- Educational services (20%)
- Public administration (11%)
- Retail trade (10%)
- Professional, scientific, and technical services (9%)
- Other services, except public administration (6%)
- Accommodation and food services (5%)
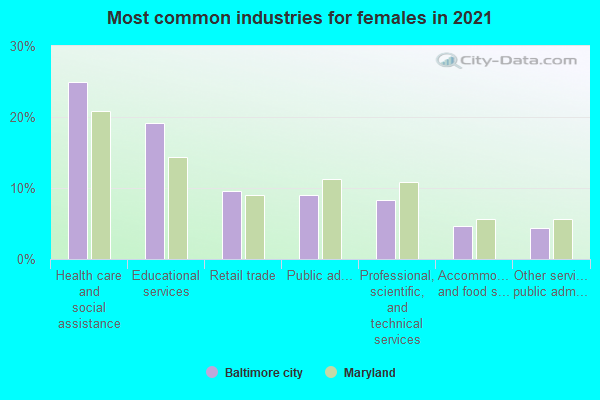
- Health care and social assistance (26%)
- Educational services (17%)
- Public administration (10%)
- Retail trade (9%)
- Professional, scientific, and technical services (8%)
- Other services, except public administration (5%)
- Accommodation and food services (5%)
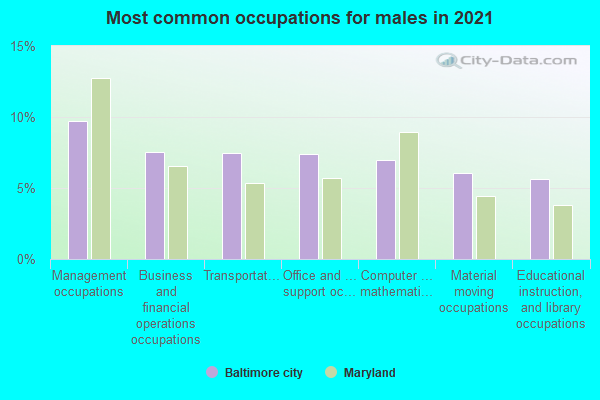
- Management occupations (9%)
- Material moving occupations (9%)
- Sales and related occupations (8%)
- Computer and mathematical occupations (7%)
- Educational instruction, and library occupations (6%)
- Office and administrative support occupations (6%)
- Construction and extraction occupations (6%)
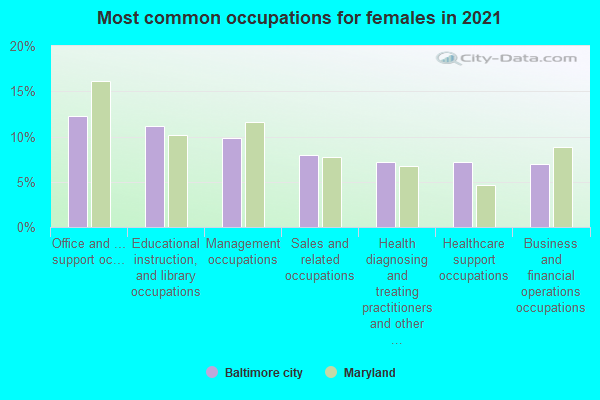
- Office and administrative support occupations (14%)
- Educational instruction, and library occupations (11%)
- Management occupations (9%)
- Sales and related occupations (7%)
- Healthcare support occupations (7%)
- Business and financial operations occupations (7%)
- Health diagnosing and treating practitioners and other technical occupations (6%)
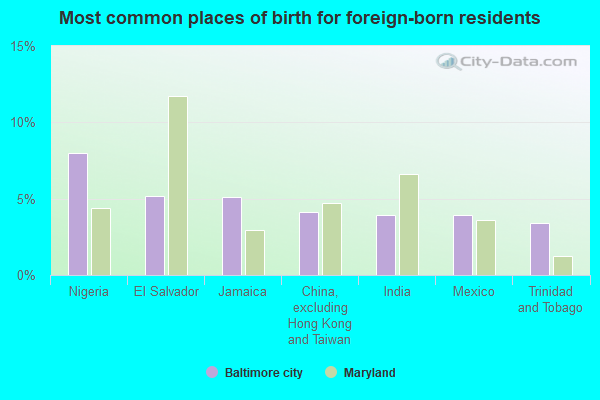
- Nigeria (8%)
- Jamaica (5%)
- El Salvador (5%)
- Honduras (5%)
- Trinidad and Tobago (4%)
- China, excluding Hong Kong and Taiwan (4%)
- Mexico (4%)
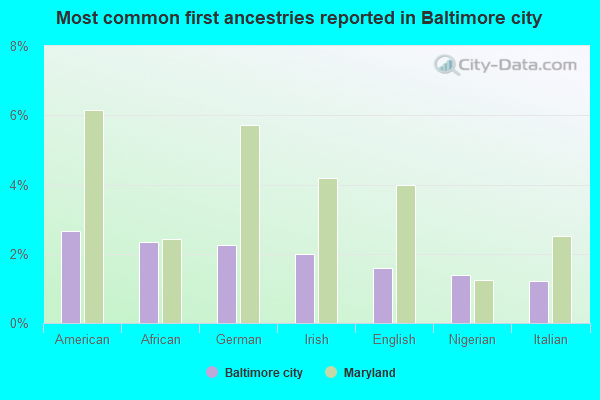
- American (3%)
- German (2%)
- Irish (2%)
- African (2%)
- English (2%)
- Nigerian (1%)
- Italian (1%)
People in group quarters in Baltimore city, Maryland in 2010:
- 10,647 people in college/university student housing
- 5,830 people in state prisons
- 3,793 people in nursing facilities/skilled-nursing facilities
- 1,999 people in other noninstitutional facilities
- 1,483 people in emergency and transitional shelters (with sleeping facilities) for people experiencing homelessness
- 432 people in group homes intended for adults
- 412 people in residential treatment centers for adults
- 262 people in workers' group living quarters and job corps centers
- 152 people in group homes for juveniles (non-correctional)
- 95 people in correctional residential facilities
- 60 people in residential treatment centers for juveniles (non-correctional)
- 21 people in in-patient hospice facilities
- 13 people in maritime/merchant vessels
People in group quarters in Baltimore city, Maryland in 2000:
- 9,262 people in college dormitories (includes college quarters off campus)
- 4,204 people in nursing homes
- 3,705 people in state prisons
- 3,514 people in local jails and other confinement facilities (including police lockups)
- 2,305 people in other noninstitutional group quarters
- 352 people in other group homes
- 342 people in homes or halfway houses for drug/alcohol abuse
- 284 people in religious group quarters
- 262 people in halfway houses
- 202 people in other nonhousehold living situations
- 193 people in orthopedic wards and institutions for the physically handicapped
- 171 people in wards in general hospitals for patients who have no usual home elsewhere
- 153 people in hospitals/wards and hospices for chronically ill
- 128 people in homes for the mentally retarded
- 93 people in unknown juvenile institutions
- 80 people in other hospitals or wards for chronically ill
- 79 people in job corps and vocational training facilities
- 66 people in homes for the mentally ill
- 64 people in homes for the physically handicapped
- 62 people in mental (psychiatric) hospitals or wards
- 62 people in training schools for juvenile delinquents
- 57 people in schools, hospitals, or wards for the intellectually disabled
- 56 people in homes for abused, dependent, and neglected children
- 48 people in military hospitals or wards for chronically ill
- 47 people in short-term care, detention or diagnostic centers for delinquent children
- 45 people in other types of correctional institutions
- 25 people in hospices or homes for chronically ill
- 20 people in other workers' dormitories
- 13 people in crews of maritime vessels
- 10 people in hospitals or wards for drug/alcohol abuse
- 2 people in military ships
9.67% of this county's 2021 resident taxpayers lived in other counties in 2020 ($56,402 average adjusted gross income)
| Here: | 9.67% |
| Maryland average: | 7.42% |
0.02% of residents moved from foreign countries ($149 average AGI)
Baltimore city: 0.02% Maryland average: 0.05%
5.93% relocated from other counties in Maryland ($30,312 average AGI)
3.72% relocated from other states ($25,940 average AGI)
Baltimore city: 3.72% Maryland average: 3.41%

Top counties from which taxpayers relocated into this county between 2020 and 2021:
| from Baltimore County, MD | |
| from Anne Arundel County, MD | |
| from Prince George's County, MD | |
| from Howard County, MD | |
| from Montgomery County, MD | |
| from District of Columbia, DC | |
| from Harford County, MD |
10.71% of this county's 2020 resident taxpayers moved to other counties in 2021 ($72,797 average adjusted gross income)
| Here: | 10.71% |
| Maryland average: | 7.91% |
0.02% of residents moved to foreign countries ($145 average AGI)
Baltimore city: 0.02% Maryland average: 0.04%
6.59% relocated to other counties in Maryland ($39,383 average AGI)
4.10% relocated to other states ($33,269 average AGI)
Baltimore city: 4.10% Maryland average: 3.93%
Top counties to which taxpayers relocated from this county between 2020 and 2021:
| to Baltimore County, MD | |
| to Anne Arundel County, MD | |
| to Howard County, MD | |
| to Harford County, MD | |
| to Montgomery County, MD | |
| to Prince George's County, MD | |
| to District of Columbia, DC |
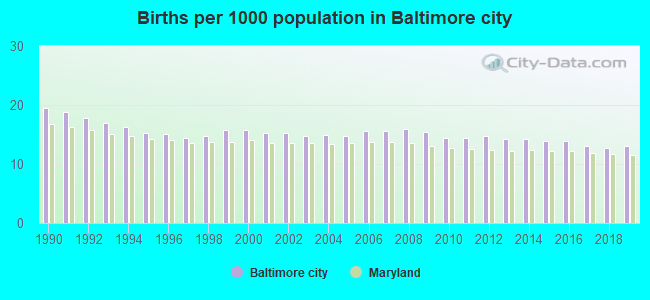
Births per 1000 population from 1990 to 1999: 16.4
Births per 1000 population from 2000 to 2009: 15.3
Births per 1000 population from 2010 to 2022: 11.6
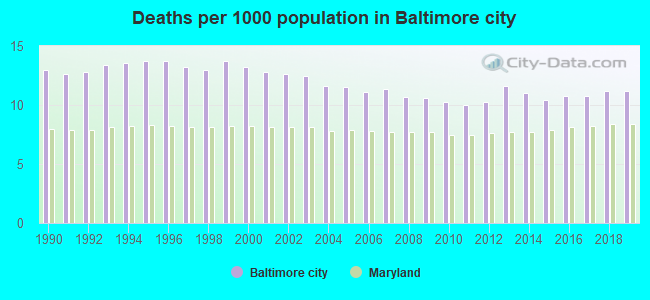
Deaths per 1000 population from 1990 to 1999: 13.3
Deaths per 1000 population from 2000 to 2009: 11.8
Deaths per 1000 population from 2010 to 2020: 11.0
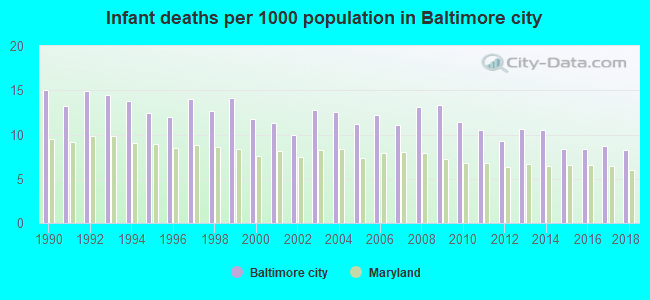
Infant deaths per 1000 live births from 1990 to 1999: 13.6
Infant deaths per 1000 live births from 2000 to 2009: 11.9
Infant deaths per 1000 live births from 2010 to 2021: 9.4
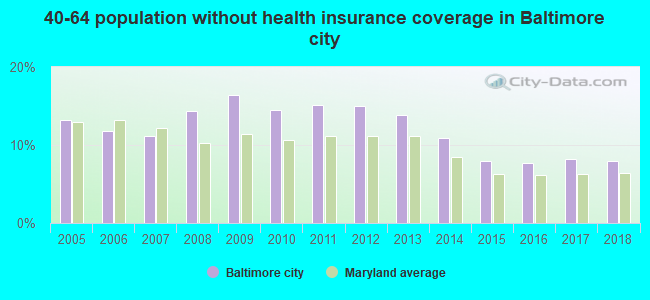
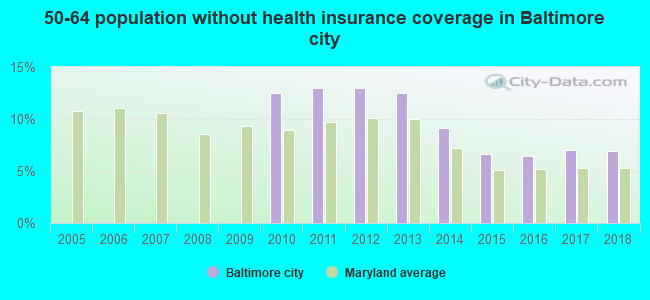
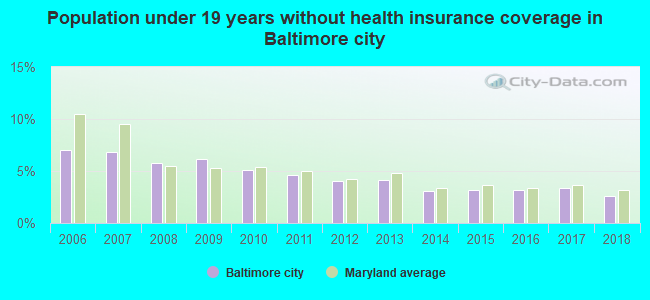
Persons under 19 years old without health insurance coverage in 2018: 2.6%
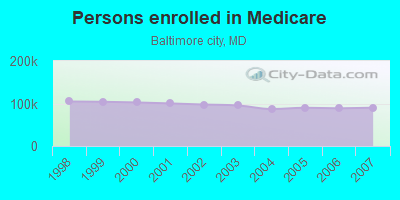
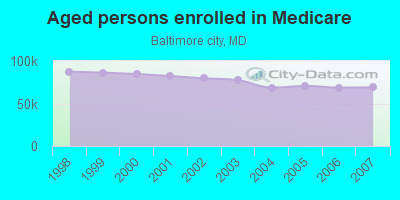
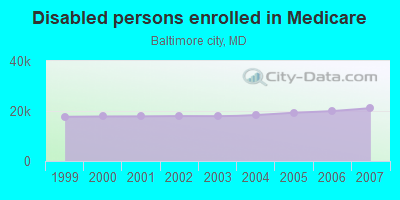
Persons enrolled in hospital insurance and/or supplemental medical insurance (Medicare) in July 1, 2007: 90,103 (68,922 aged, 21,181 disabled)
Children under 18 without health insurance coverage in 2007: 17,086 (11%)
Most common underlying causes of death in Baltimore city, Maryland in 1999 - 2019:
- Bronchus or lung, unspecified - Malignant neoplasms (8,924)
- Atherosclerotic cardiovascular disease, so described (8,355)
- Acute myocardial infarction, unspecified (7,754)
- Atherosclerotic heart disease (6,444)
- Poisoning by and exposure to narcotics and psychodysleptics [hallucinogens], not elsewhere classified, undetermined intent (4,765)
- Unspecified dementia (4,553)
- Septicaemia, unspecified (4,170)
- Hypertensive heart disease without (congestive) heart failure (4,107)
- Assault by other and unspecified firearm discharge (3,929)
- Chronic obstructive pulmonary disease, unspecified (3,707)
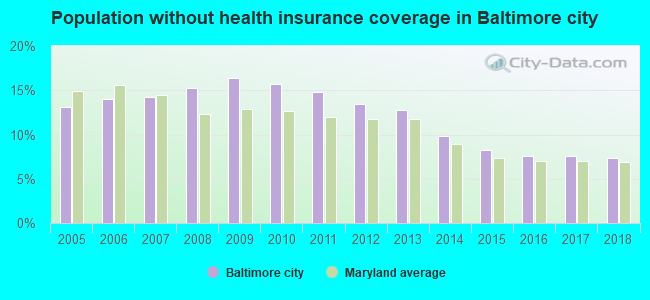
Population without health insurance coverage in 2000: 18%
Children under 18 without health insurance coverage in 2000: 14%
Short term general hospital admissions per 100,000 population in 2004: 44,063
Short term general hospital beds per 100,000 population in 2004: 880
Emergency room visits per 100,000 population in 2004: 116,238
General practice office based MDs per 100,000 population in 2005: 1,458
Medical specialist MDs per 100,000 population in 2005: 1,206
Dentists per 100,000 population in 1998: 40
Total births per 100,000 population, July 2005 - July 2006 : 36
Total deaths per 100,000 population, July 2005 - July 2006: 109
Limited-service eating places per 100,000 population in 2005 : 5
Beer, wine & liquor stores per 100,000 population in 2005: 1
Fitness & recreation sports centers per 100,000 population in 2005: 12,305
EPA green book nonattainment status in 2004-2006: 1
Crimes per 100,000 population in 1996: 1
Homicides per 1,000,000 population from 2000 to 2006: 373.3. This is more than state average.
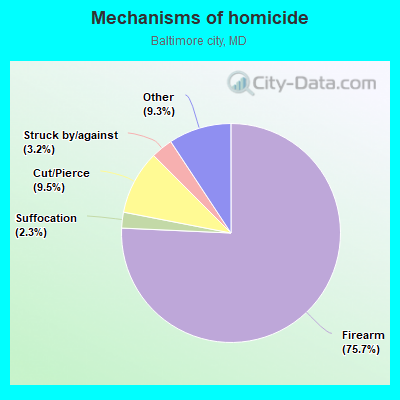
- Firearm - 282.7
- Cut/Pierce - 35.3
- Struck by/against - 12.0
- Suffocation - 8.7
- Other - 34.6
Suicides per 1,000,000 population from 2000 to 2006: 80.8. This is less than state average.
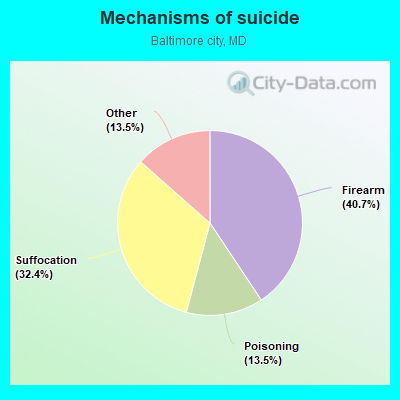
- Firearm - 32.9
- Suffocation - 26.2
- Poisoning - 10.9
- Other - 10.9
Household type by relationship:
Households: 569,931- Male householders: 102,661 (47,652 living alone), Female householders: 152,046 (61,670 living alone)
59,114 spouses (56,875 opposite-sex spouses), 19,105 unmarried partners, (18,068 opposite-sex unmarried partners), 147,028 children (139,389 natural, 3,263 adopted, 4,376 stepchildren), 17,137 grandchildren, 10,495 brothers or sisters, 6,994 parents, 113 foster children, 14,211 other relatives, 22,578 non-relatives
- In group quarters: 18,449
Size of family households: 59,740 2-persons, 29,243 3-persons, 17,897 4-persons, 9,408 5-persons, 3,241 6-persons, 2,347 7-or-more-persons.
Size of nonfamily households: 109,322 1-person, 19,898 2-persons, 2,279 3-persons, 596 4-persons, 331 5-persons, 405 7-or-more-persons.
48,537 married couples with children.
48,322 single-parent households (7,763 men, 40,559 women).
89.0% of residents of Baltimore city speak English at home.
4.7% of residents speak Spanish at home (51% speak English very well, 20% speak English well, 24% speak English not well, 5% don't speak English at all).
2.5% of residents speak other Indo-European language at home (65% speak English very well, 22% speak English well, 12% speak English not well).
1.9% of residents speak Asian or Pacific Island language at home (59% speak English very well, 25% speak English well, 13% speak English not well, 4% don't speak English at all).
1.8% of residents speak other language at home (65% speak English very well, 26% speak English well, 4% speak English not well, 4% don't speak English at all).
In fiscal year 2004:
Federal Government expenditure: $10,590,076,000 ($16,644 per capita)
Department of Defense expenditure: $1,224,598,000
Federal direct payments to individuals for retirement and disability: $1,571,425,000
Federal other direct payments to individuals: $1,554,756,000
Federal direct payments not to individuals: $108,549,000
Federal grants: $3,944,460,000
Federal procurement contracts: $2,559,760,000 ($1,043,143,000 Department of Defense)
Federal salaries and wages: $851,126,000 ($74,857,000 Department of Defense)
Federal Government direct loans: $219,957,000
Federal guaranteed/insured loans: $434,743,000
Federal Government insurance: $204,886,000
Population change from April 1, 2000 to July 1, 2005:
Births: 50,002| Here: | 79 per 1000 residents |
| State: | 71 per 1000 residents |
Deaths: 41,689
| Here: | 66 per 1000 residents |
| State: | 41 per 1000 residents |
Net international migration: +6,439
| Here: | +10 per 1000 residents |
| State: | +19 per 1000 residents |
Net internal migration: -55,893
| Here: | |
| State: |
Total withdrawal of fresh water for public supply: 0.00 millions of gallons per day (all from surface)
| Here: | 6.3 |
| State: | 7.3 |
| Here: | 4.3 |
| State: | 4.2 |
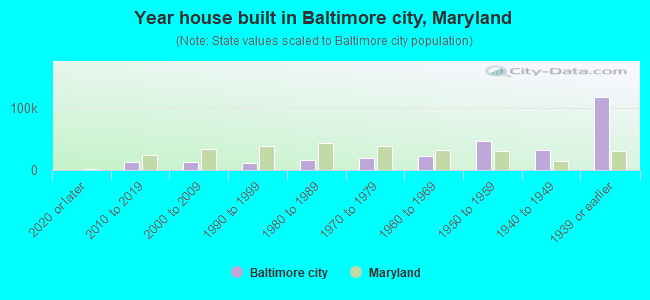
- Year house built in Baltimore city, Maryland
- 1,6042020 or later
- 13,0592010 to 2019
- 13,1412000 to 2009
- 12,4061990 to 1999
- 14,9111980 to 1989
- 20,9201970 to 1979
- 22,7971960 to 1969
- 42,4641950 to 1959
- 29,0061940 to 1949
- 123,5711939 or earlier
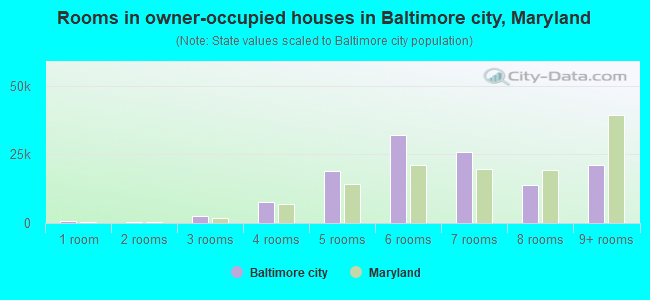
- Rooms in owner-occupied houses in Baltimore city, Maryland
- 2441 room
- 4952 rooms
- 4,4233 rooms
- 8,4994 rooms
- 14,4905 rooms
- 39,9136 rooms
- 21,0937 rooms
- 11,8478 rooms
- 20,2139+ rooms
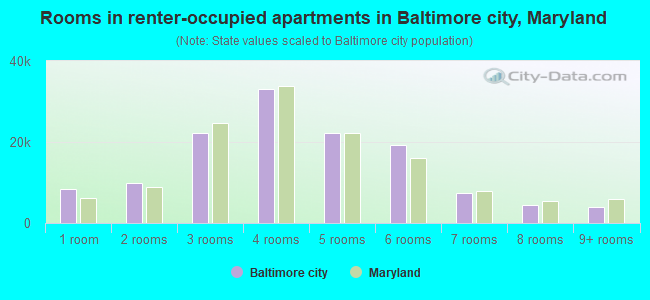
- Rooms in renter-occupied apartments in Baltimore city, Maryland
- 10,0201 room
- 8,2942 rooms
- 24,1423 rooms
- 31,2264 rooms
- 18,0775 rooms
- 25,6286 rooms
- 8,8237 rooms
- 3,5798 rooms
- 3,7019+ rooms
- Bedrooms in owner-occupied houses in Baltimore city, Maryland
- 244no bedroom
- 4,3841 bedroom
- 26,5882 bedrooms
- 65,0003 bedrooms
- 17,5714 bedrooms
- 7,4305+ bedrooms
- Bedrooms in renter-occupied apartments in Baltimore city, Maryland
- 11,387no bedroom
- 40,6221 bedroom
- 42,3542 bedrooms
- 30,5903 bedrooms
- 6,9734 bedrooms
- 1,5645+ bedrooms
- Cars and other vehicles available in Baltimore city in owner-occupied houses/condos
- 12,052no vehicle
- 54,6561 vehicle
- 42,9182 vehicles
- 8,3233 vehicles
- 2,9054 vehicles
- 3635+ vehicles
- Cars and other vehicles available in Baltimore city in renter-occupied apartments
- 53,642no vehicle
- 57,8261 vehicle
- 18,7742 vehicles
- 2,5673 vehicles
- 6084 vehicles
- 735+ vehicles
87.3% of Baltimore city residents lived in the same house 1 years ago.
Out of people who lived in different houses, 36% lived in this county.
Out of people who lived in different counties, 50% lived in Maryland.
| Baltimore city: | 87.3% |
| State average: | 88.5% |
Place of birth for U.S.-born residents:
- This state: 367,151
- Other state: 142,277
- Northeast: 52,337
- Midwest: 17,092
- South: 58,528
- West: 14,320
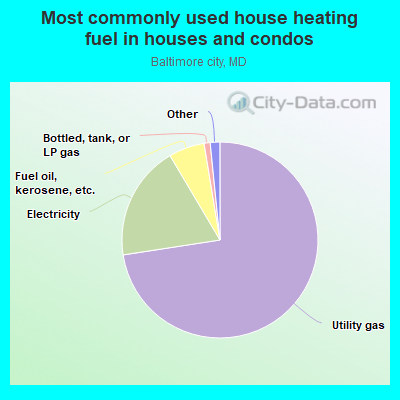
- 71.4%Utility gas
- 20.2%Electricity
- 4.8%Fuel oil, kerosene, etc.
- 2.6%Bottled, tank, or LP gas
- 0.5%No fuel used
- 0.3%Wood
- 0.1%Other fuel
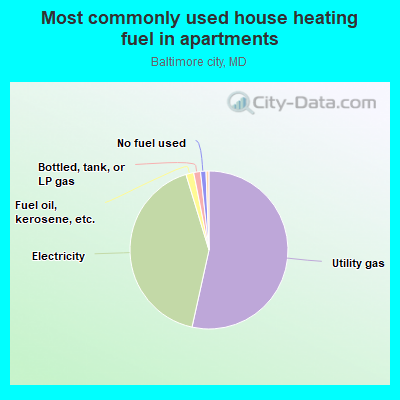
- 55.1%Utility gas
- 40.5%Electricity
- 1.4%Bottled, tank, or LP gas
- 1.3%No fuel used
- 1.2%Fuel oil, kerosene, etc.
- 0.5%Other fuel
Private vs. public school enrollment:
| Here: | 12.5% |
| Maryland: | 15.2% |
| Here: | 13.8% |
| Maryland: | 14.4% |
| Here: | 33.0% |
| Maryland: | 20.2% |
Supplemental Security Income (SSI) in 2004:
- Total number of recipients: 28,498
- Number of aged recipients: 2,810
- Number of blind and disabled recipients: 25,688
- Number of recipients under 18: 4,129
- Number of recipients between 18 and 64: 17,770
- Number of recipients older than 64: 6,599
- Number of recipients also receiving OASDI: 7,938
- Amount of payments (thousands of dollars): 13,439
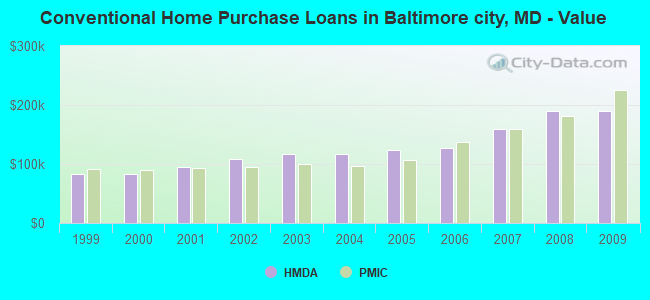
| Home Mortgage Disclosure Act Aggregated Statistics For Year 2009 (Based on 199 full tracts) | ||||||||||||||
| A) FHA, FSA/RHS & VA Home Purchase Loans | B) Conventional Home Purchase Loans | C) Refinancings | D) Home Improvement Loans | E) Loans on Dwellings For 5+ Families | F) Non-occupant Loans on < 5 Family Dwellings (A B C & D) | G) Loans On Manufactured Home Dwelling (A B C & D) | ||||||||
|---|---|---|---|---|---|---|---|---|---|---|---|---|---|---|
| Number | Average Value | Number | Average Value | Number | Average Value | Number | Average Value | Number | Average Value | Number | Average Value | Number | Average Value | |
| LOANS ORIGINATED | 2,396 | $179,461 | 1,493 | $189,882 | 7,773 | $179,747 | 579 | $84,396 | 40 | $1,164,950 | 1,512 | $131,802 | 1 | $2,000 |
| APPLICATIONS APPROVED, NOT ACCEPTED | 137 | $174,693 | 137 | $172,350 | 1,000 | $162,664 | 122 | $47,779 | 4 | $790,750 | 160 | $133,869 | 1 | $73,000 |
| APPLICATIONS DENIED | 426 | $158,789 | 381 | $149,126 | 4,550 | $161,139 | 865 | $47,271 | 12 | $1,546,417 | 862 | $121,092 | 6 | $87,333 |
| APPLICATIONS WITHDRAWN | 357 | $175,353 | 261 | $177,605 | 2,569 | $170,594 | 141 | $86,078 | 9 | $2,655,444 | 338 | $127,678 | 2 | $128,500 |
| FILES CLOSED FOR INCOMPLETENESS | 90 | $148,256 | 57 | $191,754 | 793 | $161,912 | 57 | $92,439 | 3 | $212,000 | 117 | $141,162 | 1 | $104,000 |
| Private Mortgage Insurance Companies Aggregated Statistics For Year 2009 (Based on 148 full tracts) | ||||||
| A) Conventional Home Purchase Loans | B) Refinancings | C) Non-occupant Loans on < 5 Family Dwellings (A & B) | ||||
|---|---|---|---|---|---|---|
| Number | Average Value | Number | Average Value | Number | Average Value | |
| LOANS ORIGINATED | 191 | $224,901 | 131 | $235,321 | 1 | $152,000 |
| APPLICATIONS APPROVED, NOT ACCEPTED | 143 | $170,559 | 84 | $221,298 | 33 | $110,303 |
| APPLICATIONS DENIED | 42 | $230,000 | 45 | $216,244 | 2 | $161,500 |
| APPLICATIONS WITHDRAWN | 15 | $212,333 | 26 | $231,846 | 2 | $188,000 |
| FILES CLOSED FOR INCOMPLETENESS | 14 | $194,429 | 4 | $165,250 | 5 | $174,400 |
| Most common first names in Baltimore city, MD among deceased individuals | ||
| Name | Count | Lived (average) |
|---|---|---|
| John | 9,101 | 72.3 years |
| Mary | 8,781 | 77.9 years |
| William | 8,780 | 71.7 years |
| James | 7,660 | 69.1 years |
| Charles | 5,824 | 71.5 years |
| Joseph | 5,062 | 72.3 years |
| George | 4,863 | 72.7 years |
| Robert | 4,127 | 67.9 years |
| Margaret | 3,664 | 77.9 years |
| Anna | 3,197 | 80.4 years |
| Most common last names in Baltimore city, MD among deceased individuals | ||
| Last name | Count | Lived (average) |
|---|---|---|
| Smith | 3,813 | 72.0 years |
| Johnson | 3,699 | 70.2 years |
| Jones | 3,067 | 70.2 years |
| Brown | 2,978 | 70.8 years |
| Williams | 2,749 | 69.3 years |
| Davis | 1,649 | 70.1 years |
| Jackson | 1,551 | 70.5 years |
| Miller | 1,478 | 73.5 years |
| Thomas | 1,416 | 71.2 years |
| Taylor | 1,365 | 71.0 years |
| Businesses in Baltimore city, MD | ||||
| Name | Count | Name | Count | |
|---|---|---|---|---|
| 7-Eleven | 43 | Justice | 2 | |
| ALDI | 2 | KFC | 12 | |
| ALDO | 2 | Kmart | 4 | |
| AMF Bowling | 3 | Kroger | 1 | |
| AT&T | 12 | LA Fitness | 2 | |
| Ace Hardware | 3 | Lane Bryant | 1 | |
| Advance Auto Parts | 10 | Lane Furniture | 3 | |
| Aeropostale | 1 | LensCrafters | 2 | |
| Aerosoles | 1 | Levi Strauss & Co. | 1 | |
| American Eagle Outfitters | 1 | Little Caesars Pizza | 3 | |
| Ann Taylor | 2 | Long John Silver's | 3 | |
| Applebee's | 2 | Lowe's | 1 | |
| Arby's | 3 | Macy's | 1 | |
| AutoZone | 4 | Marriott | 8 | |
| Avenue | 2 | Marshalls | 1 | |
| Bakers | 1 | MasterBrand Cabinets | 29 | |
| Bally Total Fitness | 2 | Mazda | 1 | |
| Banana Republic | 1 | McDonald's | 36 | |
| Barnes & Noble | 3 | Men's Wearhouse | 3 | |
| Baskin-Robbins | 12 | Motel 6 | 1 | |
| Bath & Body Works | 4 | Motherhood Maternity | 1 | |
| Bebe | 1 | New Balance | 7 | |
| Bed Bath & Beyond | 1 | New York & Co | 1 | |
| Ben & Jerry's | 1 | Nike | 50 | |
| Best Western | 2 | Nissan | 2 | |
| Blockbuster | 4 | Office Depot | 2 | |
| Brooks Brothers | 1 | Old Navy | 1 | |
| Brunswick Bowling & Billiards | 1 | Olive Garden | 1 | |
| Buffalo Wild Wings | 1 | Outback | 2 | |
| Burger King | 18 | Outback Steakhouse | 2 | |
| CVS | 15 | Pac Sun | 1 | |
| Caribou Coffee | 1 | Panda Express | 1 | |
| Casual Male XL | 1 | Panera Bread | 5 | |
| Chick-Fil-A | 4 | Papa John's Pizza | 7 | |
| Chico's | 3 | Payless | 12 | |
| Chipotle | 3 | Penske | 2 | |
| Chuck E. Cheese's | 1 | PetSmart | 1 | |
| Cinnabon | 1 | Pier 1 Imports | 2 | |
| Cold Stone Creamery | 4 | Pizza Hut | 4 | |
| ColorTyme | 2 | Popeyes | 8 | |
| Cricket Wireless | 38 | Qdoba Mexican Grill | 2 | |
| Curves | 3 | Quality | 1 | |
| DHL | 10 | Quiznos | 9 | |
| Dairy Queen | 1 | RadioShack | 11 | |
| Days Inn | 2 | Ramada | 1 | |
| Decora Cabinetry | 2 | Red Lobster | 1 | |
| Dennys | 2 | Rite Aid | 38 | |
| Domino's Pizza | 3 | Rodeway Inn | 1 | |
| DressBarn | 1 | Ruby Tuesday | 3 | |
| Dressbarn | 1 | Rue21 | 1 | |
| Dunkin Donuts | 26 | Ryder Rental & Truck Leasing | 2 | |
| Econo Lodge | 1 | SAS Shoes | 2 | |
| Express | 1 | Safeway | 4 | |
| Famous Footwear | 2 | Sears | 10 | |
| Fashion Bug | 2 | Sephora | 1 | |
| FedEx | 117 | Sheraton | 2 | |
| Finish Line | 1 | Sleep Inn | 1 | |
| Firestone Complete Auto Care | 5 | Spencer Gifts | 1 | |
| Foot Locker | 10 | Sprint Nextel | 6 | |
| Ford | 1 | Staples | 4 | |
| Forever 21 | 3 | Starbucks | 21 | |
| GNC | 16 | Subway | 52 | |
| GameStop | 12 | T-Mobile | 16 | |
| Gap | 2 | Taco Bell | 6 | |
| Giant | 10 | Talbots | 1 | |
| Goodwill | 1 | Target | 3 | |
| Gymboree | 1 | The Cheesecake Factory | 1 | |
| H&M | 2 | The Limited | 1 | |
| H&R Block | 19 | The Room Place | 1 | |
| Haagen-Dazs | 1 | Torrid | 1 | |
| Haworth | 1 | Toys"R"Us | 2 | |
| Hilton | 8 | Trader Joe's | 1 | |
| Holiday Inn | 4 | True Value | 1 | |
| Hollister Co. | 1 | U-Haul | 18 | |
| Home Depot | 2 | UPS | 97 | |
| Hot Topic | 1 | Urban Outfitters | 1 | |
| Houlihan's | 1 | Value City Furniture | 2 | |
| Howard Johnson | 1 | Vans | 4 | |
| Hyatt | 1 | Verizon Wireless | 6 | |
| Hyundai | 1 | Victoria's Secret | 2 | |
| IHOP | 2 | Vons | 4 | |
| IKEA | 1 | Walgreens | 9 | |
| J. Jill | 1 | Walmart | 3 | |
| JCPenney | 2 | Wendy's | 12 | |
| JoS. A. Bank | 1 | Wet Seal | 2 | |
| Jones New York | 6 | Whole Foods Market | 2 | |
| Journeys | 1 | YMCA | 11 | |
| Just Tires | 1 | |||
Baltimore city on our top lists:
- #2 on the list of "Top 101 counties with the highest number of infant deaths per 1000 residents 2007-2013 (pop. 50,000+)"
- #6 on the list of "Top 101 counties with highest percentage of residents voting for Obama (Democrat) in the 2012 Presidential Election (pop. 50,000+)"
- #10 on the list of "Top 101 counties with highest percentage of residents voting for Obama (Democrat) in the 2012 Presidential Election"
- #12 on the list of "Top 101 counties with the most Black Protestant adherents"
- #12 on the list of "Top 101 counties with the most Black Protestant adherents (pop. 50,000+)"
- #17 on the list of "Top 101 counties with the highest average weight of females"
- #20 on the list of "Top 101 counties with the most Black Protestant congregations (pop. 50,000+)"
- #20 on the list of "Top 101 counties with the largest decrease in the number of deaths per 1000 residents 2000-2006 to 2007-2013 (pop. 50,000+)"
- #20 on the list of "Top 101 counties with the most Black Protestant congregations"
- #24 on the list of "Top 101 counties with the lowest percentage of residents that keep firearms around their homes"
- #41 on the list of "Top 101 counties with the most Mainline Protestant congregations"
- #42 on the list of "Top 101 counties with the most Mainline Protestant congregations (pop. 50,000+)"
- #50 on the list of "Top 101 counties with the most Catholic congregations (pop. 50,000+)"
- #51 on the list of "Top 101 counties with the most Orthodox adherents"
- #51 on the list of "Top 101 counties with the most Orthodox adherents (pop. 50,000+)"
- #52 on the list of "Top 101 counties with the most Catholic congregations"
- #56 on the list of "Top 101 counties with the lowest percentage of residents that visited a dentist within the past year"
- #62 on the list of "Top 101 counties with the largest increase in the number of infant deaths per 1000 residents 2000-2006 to 2007-2013 (pop. 50,000+)"
- #71 on the list of "Top 101 counties with the lowest percentage of residents that exercised in the past month"
- #80 on the list of "Top 101 counties with the largest increase in the number of births per 1000 residents 2000-2006 to 2007-2013 (pop 50,000+)"