Harford County, Maryland (MD)
County owner-occupied free and clear houses and condos in 2010: 15,764
County owner-occupied houses and condos in 2000: 62,119
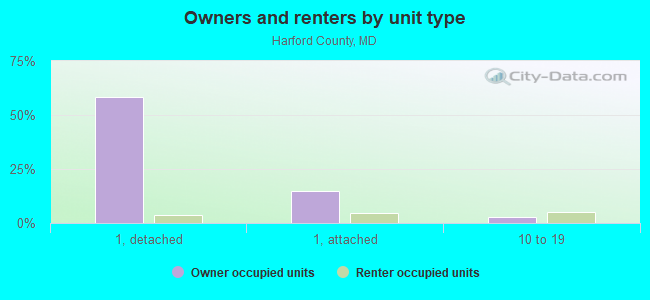
Renter-occupied apartments: 18,387 (it was 17,548 in 2000)
| % of renters here: | 22% |
| State: | 32% |
Land area: 440 sq. mi.
Water area: 86.4 sq. mi.
Population density: 599 people per square mile (high).
Industries providing employment: Educational, health and social services (24.3%), Professional, scientific, management, administrative, and waste management services (13.6%), Public administration (13.0%), Retail trade (10.9%).
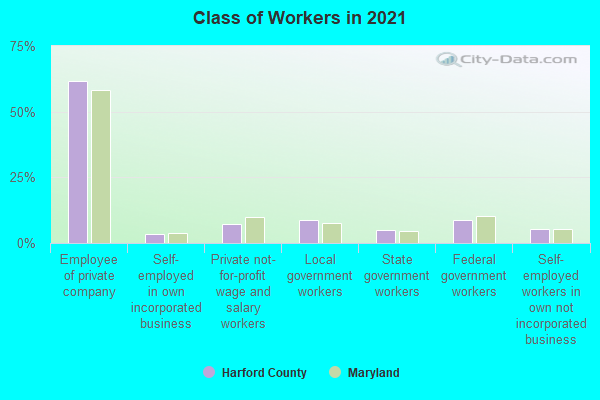
Type of workers:
- Private wage or salary: 73%
- Government: 23%
- Self-employed, not incorporated: 4%
- Unpaid family work: 0%
- OSM Map
- General Map
- Google Map
- MSN Map

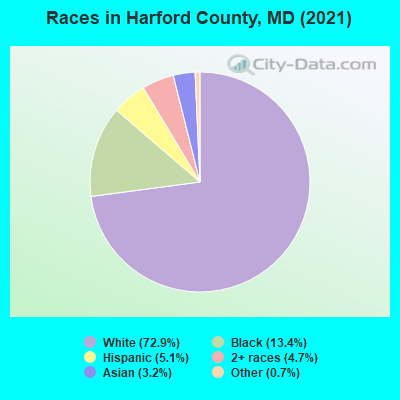
- 189,18471.7%White Non-Hispanic Alone
- 36,92014.0%Black Non-Hispanic Alone
- 14,0245.3%Hispanic or Latino
- 13,2965.0%Two or more races
- 8,3533.2%Asian alone
- 1,6930.6%Some other race alone
- 3610.1%Native Hawaiian and Other
Pacific Islander alone - 360.01%American Indian and Alaska Native alone
| Median resident age: | 41.0 years |
| Maryland median age: | 39.7 years |
| Males: 131,080 | |
| Females: 132,787 |

 | NYC wants to dump at least 200 illegal aliens in Harford County (81 replies) |
| Md Redistricting Plans, Proposals, & Dreams (87 replies) |
| Moving to Maryland (20 replies) |
| Harford County, Maryland (2 replies) |
| Harford County - What is Bel Air, MD like? (3 replies) |
| Fixie or BMX riding (Baltimore/Harford County) (1 reply) |
| Harford County: | 2.0 people |
| Maryland: | 3 people |
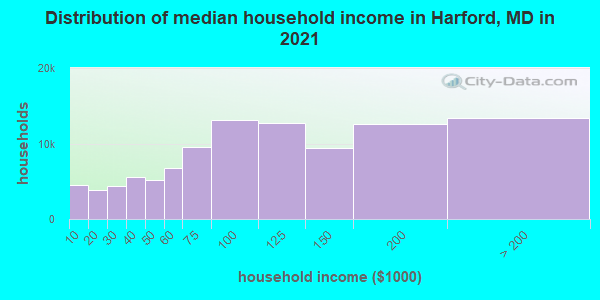
Estimated median household income in 2022: $100,915 ($57,234 in 1999)
| This county: | $100,915 |
| Maryland: | $94,991 |
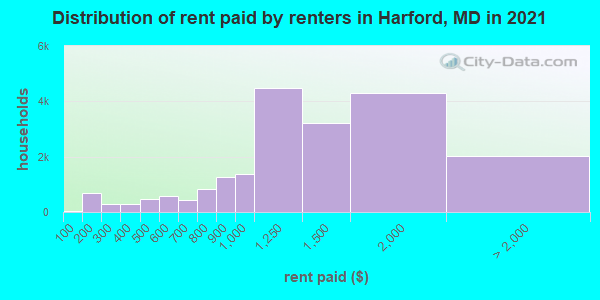
Median contract rent in 2022 for apartments: $1,310 (lower quartile is $923, upper quartile is $1,702)
| This county: | $1310 |
| State: | $1388 |
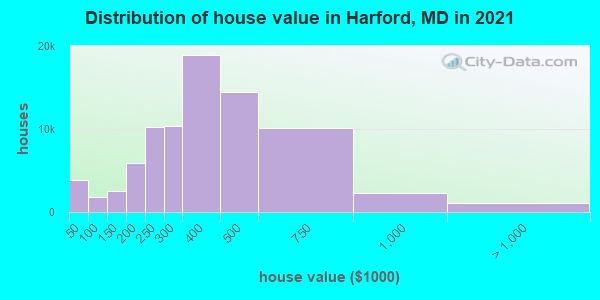
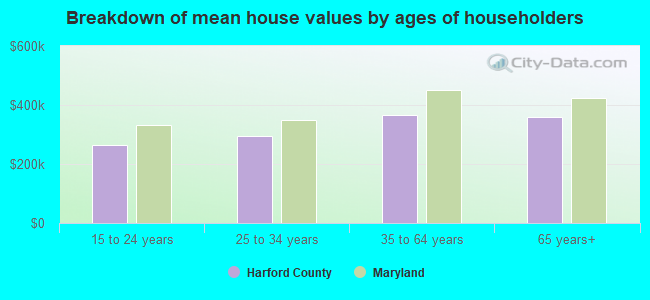
Estimated median house or condo value in 2022: $359,300 (it was $145,500 in 2000)
| Harford: | $359,300 |
| Maryland: | $398,100 |
Mean price in 2022:
Median monthly housing costs for homes and condos with a mortgage: $1,850Detached houses: $509,158
Here: $509,158 State: $526,819 Townhouses or other attached units: $349,595
Here: $349,595 State: $328,305 In 2-unit structures: $311,721
Here: $311,721 State: $346,599 In 3-to-4-unit structures: $366,789
Here: $366,789 State: $295,378 In 5-or-more-unit structures: $302,058
Here: $302,058 State: $350,378 Mobile homes: $108,190
Here: $108,190 State: $89,353
Median monthly housing costs for units without a mortgage: $604
Institutionalized population: 1,291
Crime in 2020 (reported by the sheriff's office or county police, not the county total):
- Murders: 1
- Rapes: 15
- Robberies: 11
- Assaults: 117
- Burglaries: 114
- Thefts: 598
- Auto thefts: 52
Crime in 2019 (reported by the sheriff's office or county police, not the county total):
- Murders: 7
- Rapes: 32
- Robberies: 45
- Assaults: 170
- Burglaries: 257
- Thefts: 1275
- Auto thefts: 92
Health of residents in Harford County based on CDC Behavioral Risk Factor Surveillance System Survey Questionnaires from 2013 to 2021:
General health status score of residents in this county from 1 (poor) to 5 (excellent) is 3.5. This is about average.73.7% of residents exercised in the past month. This is about average.
41.4% of residents smoked 100+ cigarettes in their lives. This is about average.
56.5% of adult residents drank alcohol in the past 30 days. This is less than average.
72.1% of residents visited a dentist within the past year. This is about average.
Average weight of males is 198 pounds. This is about average.
Average weight of females is 166 pounds. This is about average.
Health of residents in Harford County based on CDC Behavioral Risk Factor Surveillance System Survey Questionnaires from 2003 to 2012:
General health status score of residents in this county from 1 (poor) to 5 (excellent) is 3.6. This is better than average.73.8% of residents exercised in the past month. This is about average.
48.3% of residents smoked 100+ cigarettes in their lives. This is about average.
99.7% of adult residents drank alcohol in the past 30 days. This is more than average.
76.4% of residents visited a dentist within the past year. This is about average.
Average weight of males is 199 pounds. This is about average.
Average weight of females is 160 pounds. This is about average.
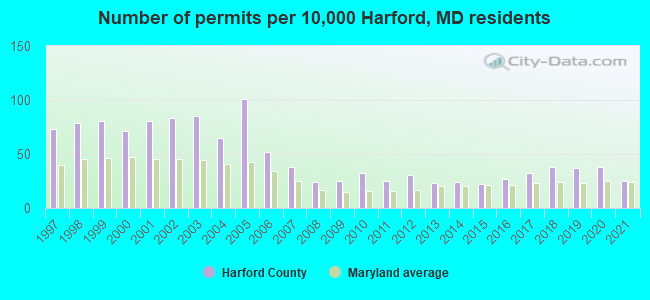
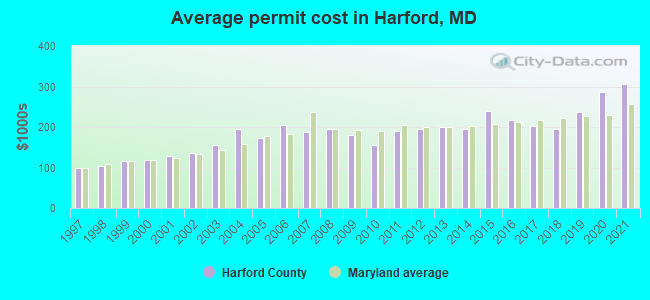
Single-family new house construction building permits:
- 2022: 301 buildings, average cost: $388,600
- 2021: 552 buildings, average cost: $307,300
- 2020: 833 buildings, average cost: $286,400
- 2019: 806 buildings, average cost: $235,600
- 2018: 838 buildings, average cost: $195,400
- 2017: 708 buildings, average cost: $202,500
- 2016: 599 buildings, average cost: $216,700
- 2015: 481 buildings, average cost: $238,800
- 2014: 525 buildings, average cost: $196,400
- 2013: 512 buildings, average cost: $201,000
- 2012: 683 buildings, average cost: $195,000
- 2011: 556 buildings, average cost: $190,500
- 2010: 701 buildings, average cost: $155,600
- 2009: 538 buildings, average cost: $180,800
- 2008: 531 buildings, average cost: $195,000
- 2007: 824 buildings, average cost: $187,200
- 2006: 1135 buildings, average cost: $203,600
- 2005: 2216 buildings, average cost: $171,800
- 2004: 1430 buildings, average cost: $194,800
- 2003: 1852 buildings, average cost: $155,600
- 2002: 1814 buildings, average cost: $135,800
- 2001: 1765 buildings, average cost: $127,500
- 2000: 1546 buildings, average cost: $119,400
- 1999: 1772 buildings, average cost: $114,900
- 1998: 1729 buildings, average cost: $103,600
- 1997: 1593 buildings, average cost: $99,400
Median real estate property taxes paid for housing units with mortgages in 2022: $3,158 (0.9%)
Median real estate property taxes paid for housing units with no mortgage in 2022: $2,929 (0.8%)
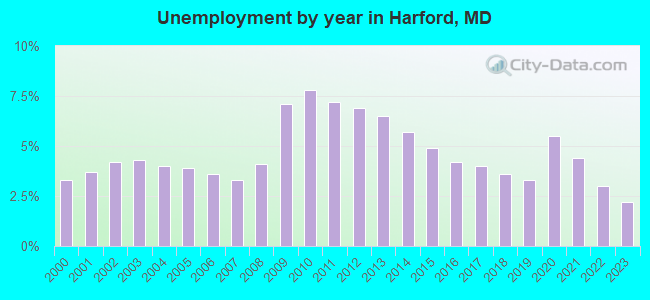
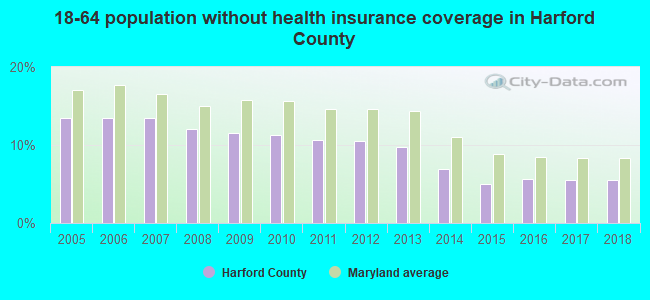
| Harford County: | 7.5% |
| Maryland: | 9.6% |
Median age of residents in 2022: 41.0 years old
(Males: 40.1 years old, Females: 42.2 years old)
(Median age for: White residents: 43.6 years old, Black residents: 36.7 years old, American Indian residents: 37.4 years old, Asian residents: 43.8 years old, Hispanic or Latino residents: 28.1 years old, Other race residents: 35.6 years old)
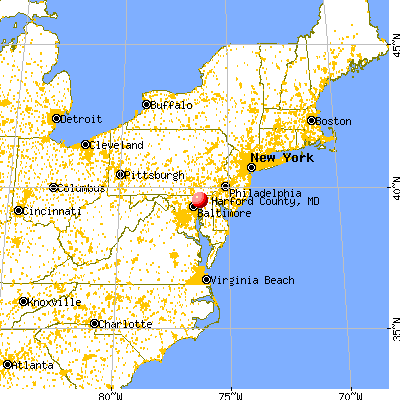
Area name: Baltimore-Towson, MD HUD Metro FMR Area
Fair market rent in 2006 for a 1-bedroom apartment in Harford County is $791 a month.
Fair market rent for a 2-bedroom apartment is $950 a month.
Fair market rent for a 3-bedroom apartment is $1220 a month.
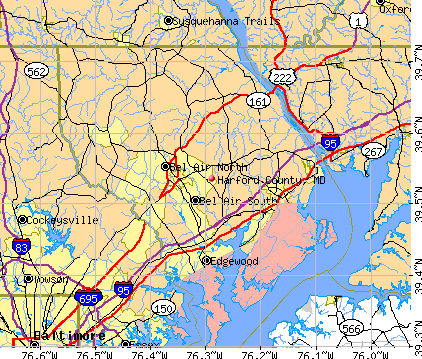
Cities in this county include: Bel Air South, Bel Air North, Edgewood, Aberdeen, Joppatowne, Havre de Grace, Bel Air, Fallston, Riverside, Aberdeen Proving Ground.
2023 air pollution in Harford County:
Particulate Matter (PM2.5) Annual: 8.0 µg/m3(standard limit: 15.0 µg/m3). Near U.S. average.
Notable locations in this county outside city limits:
Swamps: Pine Swamp (A). Display/hide its location on the map
Streams, rivers, and creeks: Ned Run (A). Display/hide its location on the map
Neighboring counties: Allegany County  , Decatur County, Indiana , Howard County, Missouri , Sutter County, California , Wetzel County, West Virginia , Lafayette County, Missouri , Vermillion County, Indiana .
| Here: | 1.9% |
| Maryland: | 2.0% |
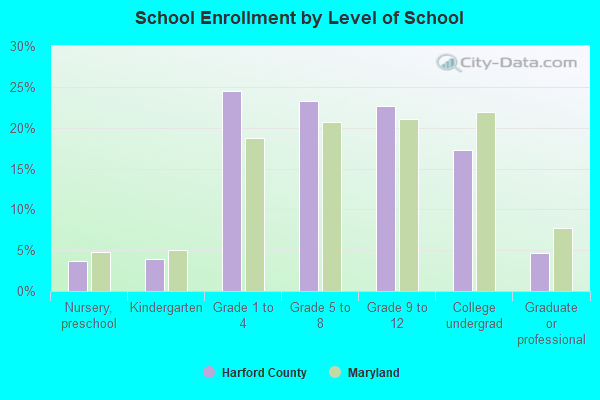
Current college students: 11,837
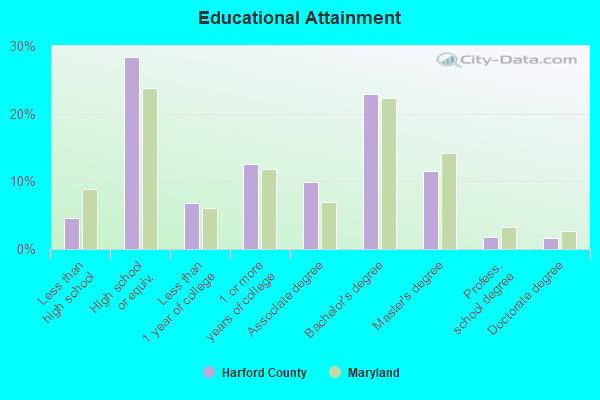
People 25 years of age or older with a high school degree or higher: 94.5%
People 25 years of age or older with a bachelor's degree or higher: 40.5%
Number of foreign born residents: 15,593 (70.6% naturalized citizens)
| Harford County: | 5.9% |
| Whole state: | 16.7% |
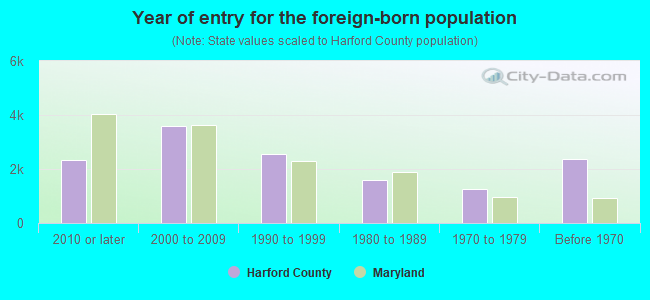
- Year of entry for the foreign-born population
- 2,6812010 or later
- 3,2582000 to 2009
- 2,9691990 to 1999
- 1,5751980 to 1989
- 1,2431970 to 1979
- 2,383Before 1970
Mean travel time to work (commute): minutes
Percentage of county residents living and working in this county: 97.3%
Housing units in structures:
- One, detached: 61,459
- One, attached: 22,972
- Two: 233
- 3 or 4: 2,092
- 5 to 9: 4,952
- 10 to 19: 6,901
- 20 to 49: 2,285
- 50 or more: 1,202
- Mobile homes: 3,059
- Boats, RVs, vans, etc.: 50
Housing units in Harford County with a mortgage: 56,083 (6,101 second mortgage, 198 home equity loan, 5,366 both second mortgage and home equity loan)
Houses without a mortgage: 1,550
| Here: | 98.2% with mortgage |
| State: | 97.5% with mortgage |
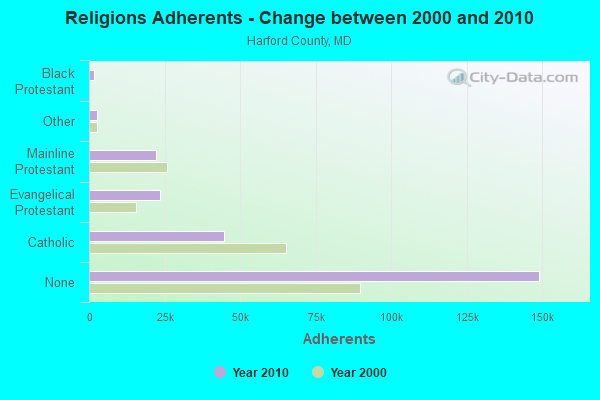
Religion statistics for Harford County
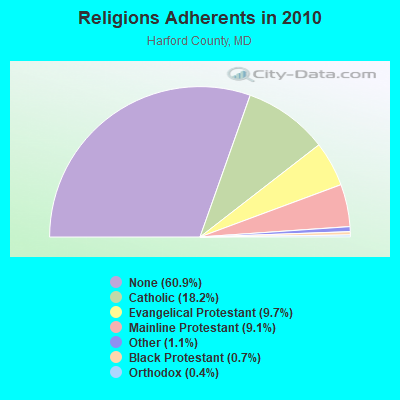
| Religion | Adherents | Congregations |
|---|---|---|
| Catholic | 44,618 | 9 |
| Evangelical Protestant | 23,645 | 97 |
| Mainline Protestant | 22,305 | 65 |
| Other | 2,675 | 10 |
| Black Protestant | 1,628 | 9 |
| Orthodox | 900 | 2 |
| None | 149,055 | - |
Source: Clifford Grammich, Kirk Hadaway, Richard Houseal, Dale E.Jones, Alexei Krindatch, Richie Stanley and Richard H.Taylor. 2012. 2010 U.S.Religion Census: Religious Congregations & Membership Study. Association of Statisticians of American Religious Bodies. Jones, Dale E., et al. 2002. Congregations and Membership in the United States 2000. Nashville, TN: Glenmary Research Center.
Food Environment Statistics:
| Harford County: | 1.46 / 10,000 pop. |
| State: | 1.96 / 10,000 pop. |
| Here: | 0.04 / 10,000 pop. |
| Maryland: | 0.07 / 10,000 pop. |
| This county: | 1.29 / 10,000 pop. |
| Maryland: | 1.22 / 10,000 pop. |
| Harford County: | 2.38 / 10,000 pop. |
| Maryland: | 2.05 / 10,000 pop. |
| This county: | 4.43 / 10,000 pop. |
| State: | 5.40 / 10,000 pop. |
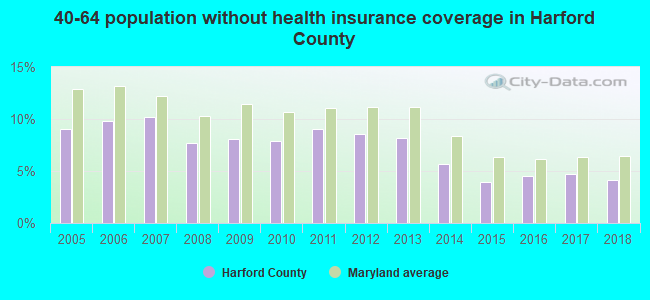
| Harford County: | 8.9% |
| Maryland: | 9.1% |
| Harford County: | 27.3% |
| State: | 26.7% |
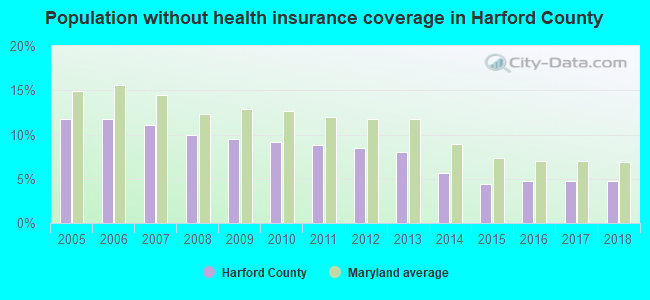
| Here: | 14.5% |
| State: | 15.5% |
Agriculture in Harford County:
Average size of farms: 119 acresAverage value of agricultural products sold per farm: $38,205
Average value of crops sold per acre for harvested cropland: $284.63
The value of nursery, greenhouse, floriculture, and sod as a percentage of the total market value of agricultural products sold: 19.36%
The value of livestock, poultry, and their products as a percentage of the total market value of agricultural products sold: 50.42%
Average total farm production expenses per farm: $40,415
Harvested cropland as a percentage of land in farms: 55.84%
Irrigated harvested cropland as a percentage of land in farms: 0.60%
Average market value of all machinery and equipment per farm: $64,258
The percentage of farms operated by a family or individual: 91.22%
Average age of principal farm operators: 56 years
Average number of cattle and calves per 100 acres of all land in farms: 19.56
Milk cows as a percentage of all cattle and calves: 24.23%
Corn for grain: 17286 harvested acres
All wheat for grain: 2445 harvested acres
Soybeans for beans: 9984 harvested acres
Vegetables: 581 harvested acres
Land in orchards: 281 acres
Earthquake activity:
Harford County-area historical earthquake activity is significantly above Maryland state average. It is 61% smaller than the overall U.S. average.On 8/23/2011 at 17:51:04, a magnitude 5.8 (5.8 MW, Depth: 3.7 mi, Class: Moderate, Intensity: VI - VII) earthquake occurred 143.3 miles away from Harford County center
On 1/16/1994 at 01:49:16, a magnitude 4.6 (4.6 MB, 4.6 LG, Depth: 3.1 mi, Class: Light, Intensity: IV - V) earthquake occurred 56.6 miles away from the county center
On 9/25/1998 at 19:52:52, a magnitude 5.2 (4.8 MB, 4.3 MS, 5.2 LG, 4.5 MW, Depth: 3.1 mi) earthquake occurred 254.8 miles away from the county center
On 1/16/1994 at 00:42:43, a magnitude 4.2 (4.2 MB, 4.0 LG, Depth: 3.1 mi) earthquake occurred 56.8 miles away from the county center
On 11/30/2017 at 21:47:31, a magnitude 4.1 (4.1 MW, Depth: 6.1 mi) earthquake occurred 51.4 miles away from Harford County center
On 8/25/2011 at 05:07:52, a magnitude 4.5 (4.5 ML, Depth: 4.2 mi) earthquake occurred 142.3 miles away from the county center
Magnitude types: regional Lg-wave magnitude (LG), body-wave magnitude (MB), local magnitude (ML), surface-wave magnitude (MS), moment magnitude (MW)
Most recent natural disasters:
- Maryland Covid-19 Pandemic, Incident Period: January 20, 2020, Major Disaster (Presidential) Declared DR-4491-MD: March 26, 2020, FEMA Id: 4491, Natural disaster type: Other
- Maryland Severe Winter Storm and Snowstorm, Incident Period: January 22, 2016 to January 23, 2016, Major Disaster (Presidential) Declared DR-4261: March 04, 2016, FEMA Id: 4261, Natural disaster type: Snowstorm, Winter Storm
- Maryland Hurricane Sandy, Incident Period: October 26, 2012 to November 08, 2012, Emergency Declared EM-3349: October 28, 2012, FEMA Id: 3349, Natural disaster type: Hurricane
- Maryland Hurricane Sandy, Incident Period: October 26, 2012 to November 04, 2012, Major Disaster (Presidential) Declared DR-4091: November 20, 2012, FEMA Id: 4091, Natural disaster type: Hurricane
- Maryland Remnants of Tropical Storm Lee, Incident Period: September 06, 2011 to September 09, 2011, Major Disaster (Presidential) Declared DR-4038: October 05, 2011, FEMA Id: 4038, Natural disaster type: Tropical Storm
- Maryland Hurricane Irene, Incident Period: August 26, 2011 to September 05, 2011, Emergency Declared EM-3335: August 27, 2011, FEMA Id: 3335, Natural disaster type: Hurricane
- Maryland Hurricane Irene, Incident Period: August 24, 2011 to September 05, 2011, Major Disaster (Presidential) Declared DR-4034: September 16, 2011, FEMA Id: 4034, Natural disaster type: Hurricane
- Maryland Severe Winter Storms and Snowstorms, Incident Period: February 05, 2010 to February 11, 2010, Major Disaster (Presidential) Declared DR-1910: May 06, 2010, FEMA Id: 1910, Natural disaster type: Snowstorm, Winter Storm
- Maryland Severe Winter Storm and Snowstorm, Incident Period: December 18, 2009 to December 20, 2009, Major Disaster (Presidential) Declared DR-1875: February 19, 2010, FEMA Id: 1875, Natural disaster type: Snowstorm, Winter Storm
- Maryland Hurricane Katrina Evacuation, Incident Period: August 29, 2005 to October 01, 2005, Emergency Declared EM-3251: September 13, 2005, FEMA Id: 3251, Natural disaster type: Hurricane
- 7 other natural disasters have been reported since 1953.
The number of natural disasters in Harford County (17) is near the US average (15).
Major Disasters (Presidential) Declared: 12
Emergencies Declared: 5
Causes of natural disasters: Hurricanes: 7, Snowstorms: 4, Winter Storms: 4, Tropical Storms: 2, Blizzard: 1, Flood: 1, Snowfall: 1, Storm: 1, Other: 1 (Note: some incidents may be assigned to more than one category).
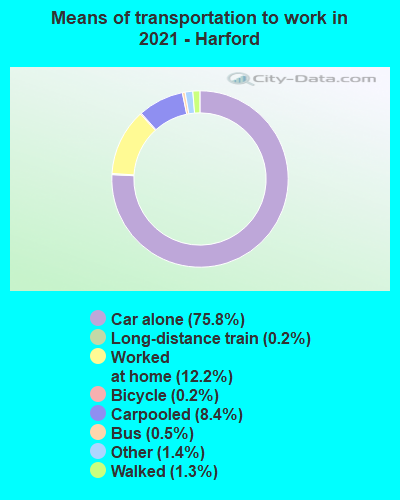
Means of transportation to work:
- Drove a car alone: 77,086 (69.7%)
- Carpooled: 9,007 (8.1%)
- Bus: 343 (0.3%)
- Long-distance train or commuter rail: 86 (0.1%)
- Ferryboat: 8 (0.0%)
- Taxicab, motorcycle, or other means: 1,792 (1.6%)
- Bicycle: 238 (0.2%)
- Walked: 1,387 (1.3%)
- Worked at home: 20,820 (18.8%)
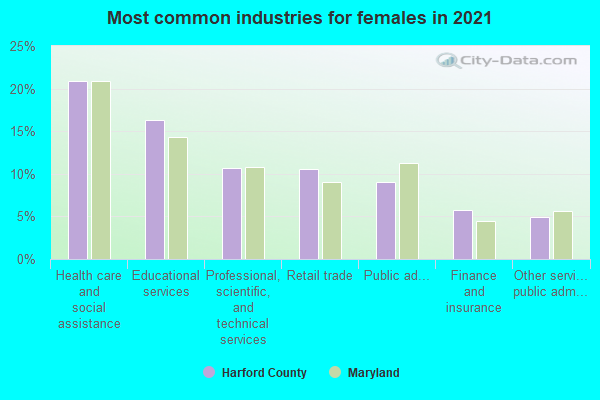
- Health care and social assistance (21%)
- Educational services (13%)
- Public administration (10%)
- Retail trade (8%)
- Professional, scientific, and technical services (6%)
- Accommodation and food services (5%)
- Finance and insurance (5%)
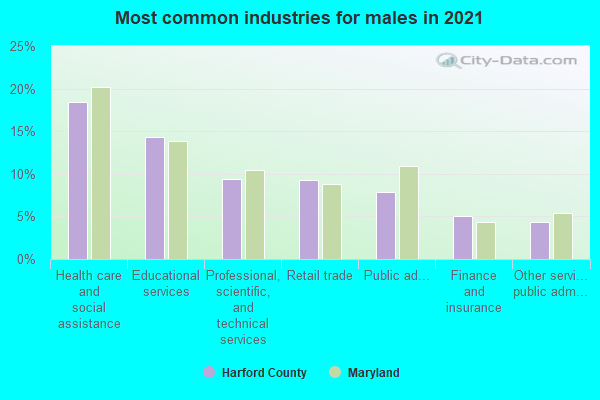
- Health care and social assistance (25%)
- Educational services (15%)
- Public administration (12%)
- Retail trade (10%)
- Professional, scientific, and technical services (7%)
- Accommodation and food services (6%)
- Finance and insurance (6%)
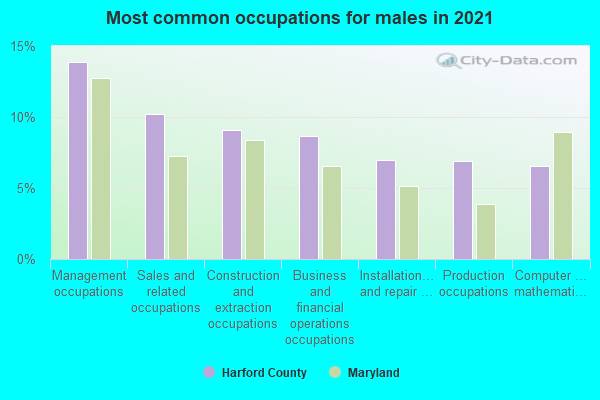
- Management occupations (16%)
- Sales and related occupations (11%)
- Computer and mathematical occupations (7%)
- Business and financial operations occupations (7%)
- Installation, maintenance, and repair occupations (7%)
- Construction and extraction occupations (6%)
- Office and administrative support occupations (6%)
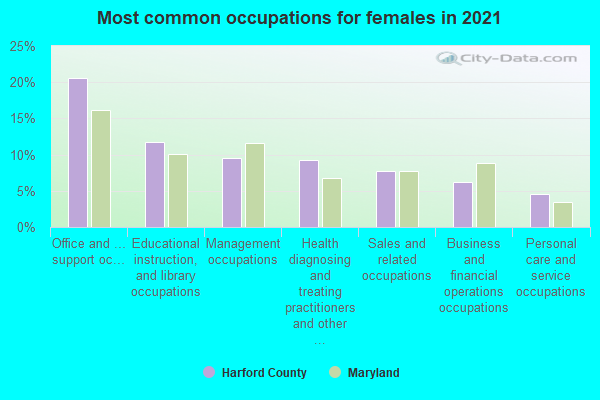
- Office and administrative support occupations (14%)
- Management occupations (13%)
- Educational instruction, and library occupations (10%)
- Business and financial operations occupations (9%)
- Sales and related occupations (9%)
- Health diagnosing and treating practitioners and other technical occupations (9%)
- Healthcare support occupations (5%)
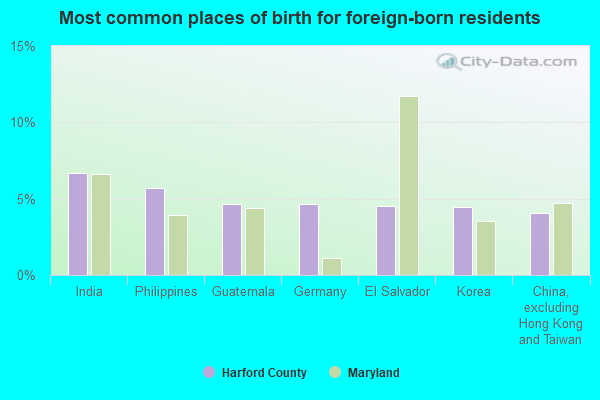
- India (7%)
- Philippines (6%)
- Ghana (5%)
- Germany (5%)
- El Salvador (5%)
- Vietnam (4%)
- China, excluding Hong Kong and Taiwan (4%)
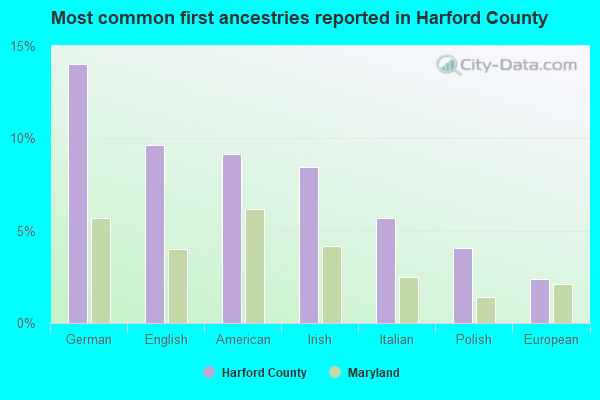
- German (13%)
- American (9%)
- English (8%)
- Irish (8%)
- Italian (6%)
- Polish (4%)
- European (2%)
People in group quarters in Harford County, Maryland in 2010:
- 962 people in military barracks and dormitories (nondisciplinary)
- 877 people in nursing facilities/skilled-nursing facilities
- 397 people in local jails and other municipal confinement facilities
- 169 people in group homes intended for adults
- 111 people in emergency and transitional shelters (with sleeping facilities) for people experiencing homelessness
- 108 people in workers' group living quarters and job corps centers
- 67 people in other noninstitutional facilities
- 35 people in residential treatment centers for adults
- 17 people in residential treatment centers for juveniles (non-correctional)
People in group quarters in Harford County, Maryland in 2000:
- 603 people in nursing homes
- 358 people in local jails and other confinement facilities (including police lockups)
- 282 people in military barracks, etc.
- 140 people in other noninstitutional group quarters
- 97 people in other group homes
- 49 people in homes or halfway houses for drug/alcohol abuse
- 7 people in homes for the mentally retarded
- 6 people in college dormitories (includes college quarters off campus)
- 6 people in religious group quarters
- 6 people in job corps and vocational training facilities
- 5 people in residential treatment centers for emotionally disturbed children
- 2 people in crews of maritime vessels
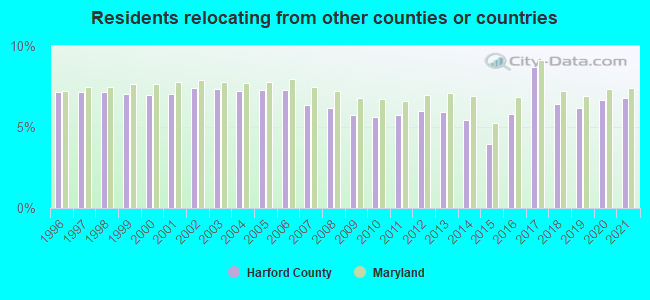
6.78% of this county's 2021 resident taxpayers lived in other counties in 2020 ($70,993 average adjusted gross income)
| Here: | 6.78% |
| Maryland average: | 7.42% |
0.05% of residents moved from foreign countries ($677 average AGI)
Harford County: 0.05% Maryland average: 0.05%
4.36% relocated from other counties in Maryland ($44,144 average AGI)
2.37% relocated from other states ($26,172 average AGI)
Harford County: 2.37% Maryland average: 3.41%
Top counties from which taxpayers relocated into this county between 2020 and 2021:
| from Baltimore County, MD | |
| from Baltimore city, MD | |
| from Cecil County, MD | |
| from Anne Arundel County, MD | |
| from York County, PA | |
| from Howard County, MD | |
| from New Castle County, DE |
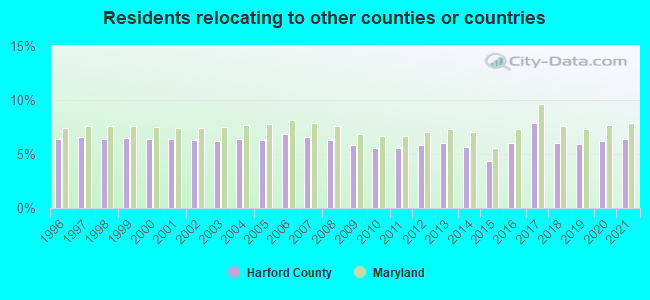
6.41% of this county's 2020 resident taxpayers moved to other counties in 2021 ($73,548 average adjusted gross income)
| Here: | 6.41% |
| Maryland average: | 7.91% |
0.03% of residents moved to foreign countries ($452 average AGI)
Harford County: 0.03% Maryland average: 0.04%
3.19% relocated to other counties in Maryland ($31,973 average AGI)
3.19% relocated to other states ($41,123 average AGI)
Harford County: 3.19% Maryland average: 3.93%
Top counties to which taxpayers relocated from this county between 2020 and 2021:
| to Baltimore County, MD | |
| to Cecil County, MD | |
| to Baltimore city, MD | |
| to York County, PA | |
| to Anne Arundel County, MD | |
| to Sussex County, DE | |
| to Howard County, MD |
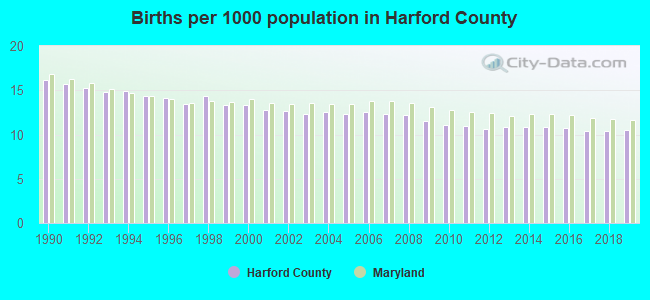
Births per 1000 population from 1990 to 1999: 14.6
Births per 1000 population from 2000 to 2009: 12.4
Births per 1000 population from 2010 to 2022: 9.0
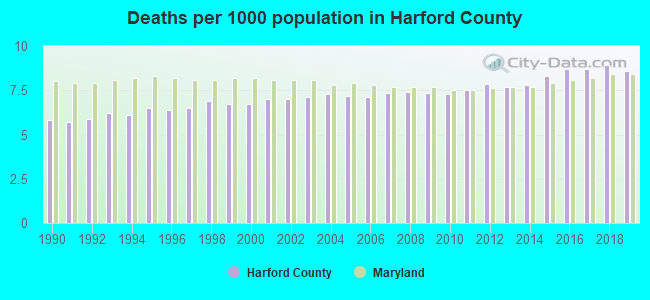
Deaths per 1000 population from 1990 to 1999: 6.3
Deaths per 1000 population from 2000 to 2009: 7.2
Deaths per 1000 population from 2010 to 2020: 8.3
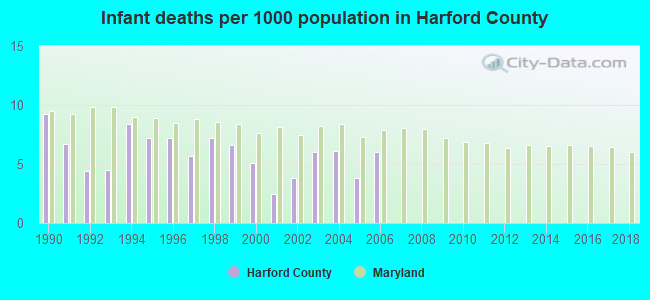
Infant deaths per 1000 live births from 1990 to 1999: 6.7
Infant deaths per 1000 live births from 2000 to 2006: 4.8
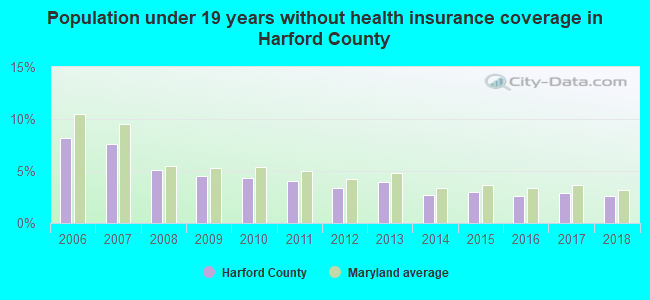
Persons under 19 years old without health insurance coverage in 2018: 2.6%
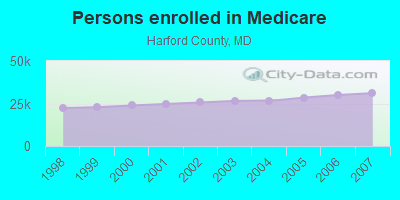
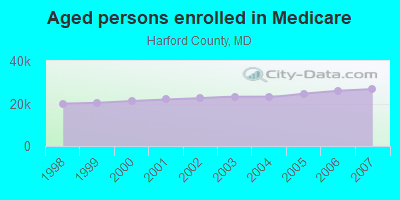
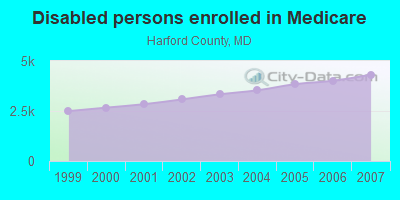
Persons enrolled in hospital insurance and/or supplemental medical insurance (Medicare) in July 1, 2007: 31,111 (26,795 aged, 4,316 disabled)
Children under 18 without health insurance coverage in 2007: 3,219 (5%)
Most common underlying causes of death in Harford County, Maryland in 1999 - 2019:
- Bronchus or lung, unspecified - Malignant neoplasms (2,671)
- Acute myocardial infarction, unspecified (2,295)
- Unspecified dementia (2,047)
- Atherosclerotic heart disease (1,970)
- Atherosclerotic cardiovascular disease, so described (1,898)
- Chronic obstructive pulmonary disease, unspecified (1,544)
- Stroke, not specified as haemorrhage or infarction (1,114)
- Alzheimer disease, unspecified (815)
- Pneumonia, unspecified (796)
- Breast, unspecified - Malignant neoplasms (704)
Population without health insurance coverage in 2000: 10%
Children under 18 without health insurance coverage in 2000: 8%
Short term general hospital admissions per 100,000 population in 2004: 7,654
Short term general hospital beds per 100,000 population in 2004: 108
Emergency room visits per 100,000 population in 2004: 35,231
General practice office based MDs per 100,000 population in 2005: 1,249
Medical specialist MDs per 100,000 population in 2005: 730
Dentists per 100,000 population in 1998: 14
Total births per 100,000 population, July 2005 - July 2006 : 45
Total deaths per 100,000 population, July 2005 - July 2006: 71
Limited-service eating places per 100,000 population in 2005 : 12
Beer, wine & liquor stores per 100,000 population in 2005: 1
Homicides per 1,000,000 population from 2000 to 2006: 27.3. This is less than state average.
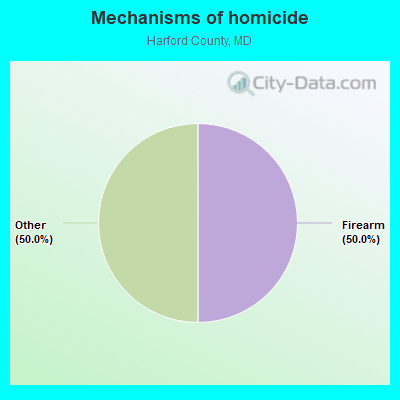
- Firearm - 13.7
- Other - 13.7
Suicides per 1,000,000 population from 2000 to 2006: 98.8. This is more than state average.
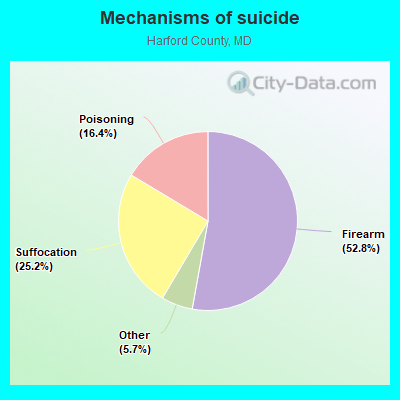
- Firearm - 52.2
- Suffocation - 24.8
- Poisoning - 16.2
- Other - 5.6
Household type by relationship:
Households: 263,867- Male householders: 51,847 (11,606 living alone), Female householders: 49,590 (13,950 living alone)
54,682 spouses (54,354 opposite-sex spouses), 7,189 unmarried partners, (7,024 opposite-sex unmarried partners), 76,113 children (73,514 natural, 633 adopted, 1,966 stepchildren), 5,493 grandchildren, 2,517 brothers or sisters, 4,306 parents, 0 foster children, 3,749 other relatives, 6,615 non-relatives
- In group quarters: 1,766
Size of family households: 29,656 2-persons, 17,199 3-persons, 13,139 4-persons, 6,415 5-persons, 2,051 6-persons, 1,426 7-or-more-persons.
Size of nonfamily households: 25,556 1-person, 4,584 2-persons, 832 3-persons, 273 4-persons, 306 5-persons.
39,870 married couples with children.
11,615 single-parent households (3,744 men, 7,871 women).
91.4% of residents of Harford speak English at home.
2.8% of residents speak Spanish at home (64% speak English very well, 17% speak English well, 15% speak English not well, 4% don't speak English at all).
2.4% of residents speak other Indo-European language at home (80% speak English very well, 14% speak English well, 4% speak English not well, 2% don't speak English at all).
1.6% of residents speak Asian or Pacific Island language at home (61% speak English very well, 26% speak English well, 10% speak English not well, 3% don't speak English at all).
1.1% of residents speak other language at home (79% speak English very well, 14% speak English well, 2% speak English not well, 5% don't speak English at all).
In fiscal year 2004:
Federal Government expenditure: $1,891,228,000 ($8,027 per capita)
Department of Defense expenditure: $1,013,587,000
Federal direct payments to individuals for retirement and disability: $584,646,000
Federal other direct payments to individuals: $181,915,000
Federal direct payments not to individuals: $3,412,000
Federal grants: $108,709,000
Federal procurement contracts: $585,442,000 ($553,923,000 Department of Defense)
Federal salaries and wages: $427,104,000 ($397,234,000 Department of Defense)
Federal Government direct loans: $2,348,000
Federal guaranteed/insured loans: $437,802,000
Federal Government insurance: $95,712,000
Population change from April 1, 2000 to July 1, 2005:
Births: 15,159| Here: | 63 per 1000 residents |
| State: | 71 per 1000 residents |
Deaths: 8,410
| Here: | 35 per 1000 residents |
| State: | 41 per 1000 residents |
Net international migration: +902
| Here: | +4 per 1000 residents |
| State: | +19 per 1000 residents |
Net internal migration: +13,333
| Here: | +56 per 1000 residents |
| State: | +2 per 1000 residents |
Total withdrawal of fresh water for public supply: 8.87 millions of gallons per day (57% from ground, 43% from surface)
| Here: | 7.5 |
| State: | 7.3 |
| Here: | 5.1 |
| State: | 4.2 |
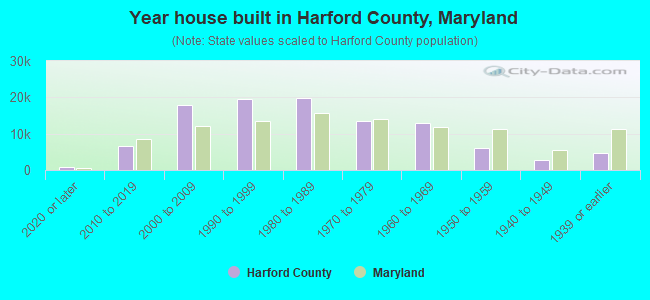
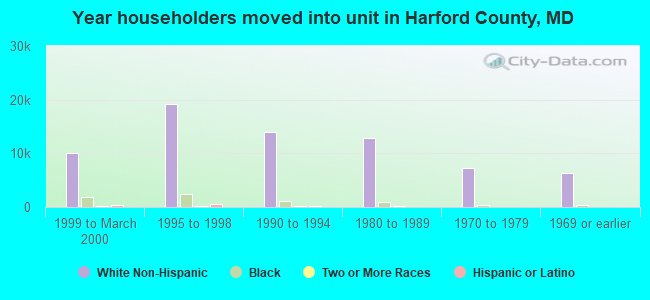
- Year house built in Harford County, Maryland
- 1,3132020 or later
- 10,0202010 to 2019
- 15,8442000 to 2009
- 20,3851990 to 1999
- 18,0741980 to 1989
- 15,8891970 to 1979
- 11,9471960 to 1969
- 6,3191950 to 1959
- 1,7681940 to 1949
- 3,6461939 or earlier
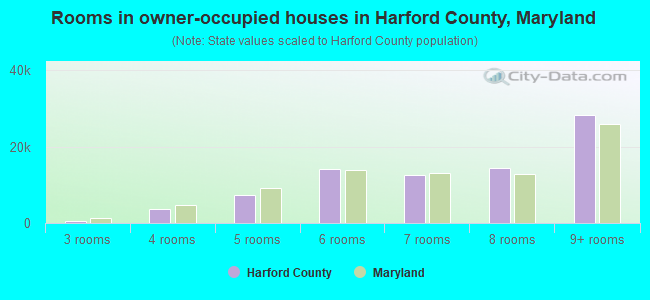
- Rooms in owner-occupied houses in Harford County, Maryland
- 4181 room
- 592 rooms
- 1,9333 rooms
- 3,7764 rooms
- 7,6385 rooms
- 14,9966 rooms
- 11,9647 rooms
- 12,1468 rooms
- 27,9639+ rooms
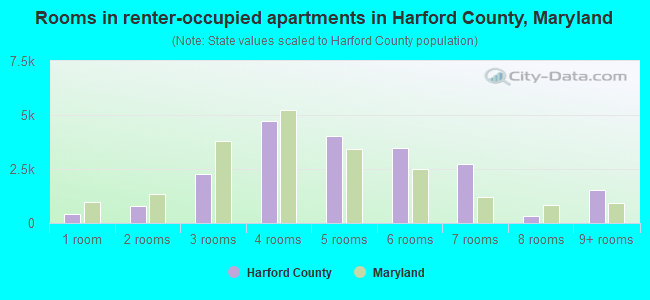
- Rooms in renter-occupied apartments in Harford County, Maryland
- 5531 room
- 1,0092 rooms
- 2,3573 rooms
- 3,7274 rooms
- 4,2125 rooms
- 2,6716 rooms
- 2,0737 rooms
- 1,9638 rooms
- 1,9799+ rooms
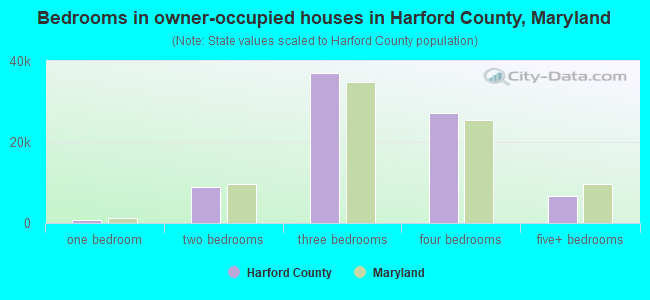
- Bedrooms in owner-occupied houses in Harford County, Maryland
- 418no bedroom
- 8321 bedroom
- 11,1182 bedrooms
- 36,8383 bedrooms
- 26,3594 bedrooms
- 5,3285+ bedrooms
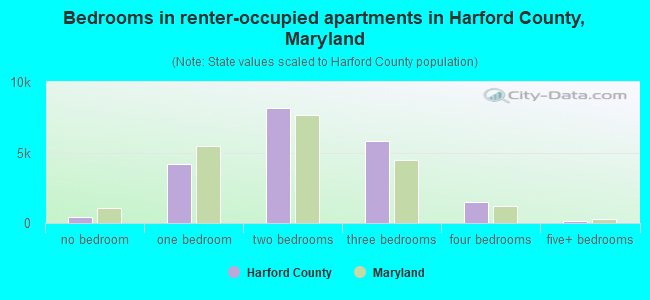
- Bedrooms in renter-occupied apartments in Harford County, Maryland
- 553no bedroom
- 4,6801 bedroom
- 7,6542 bedrooms
- 5,1103 bedrooms
- 2,0384 bedrooms
- 5095+ bedrooms
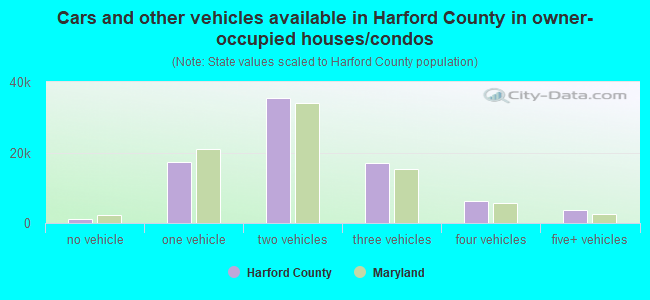
- Cars and other vehicles available in Harford County in owner-occupied houses/condos
- 1,735no vehicle
- 19,5811 vehicle
- 35,4122 vehicles
- 16,8703 vehicles
- 4,8984 vehicles
- 2,3975+ vehicles
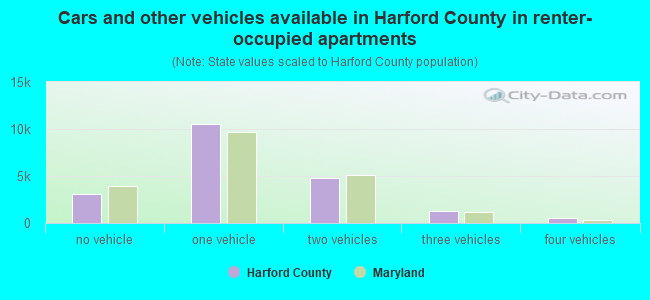
- Cars and other vehicles available in Harford County in renter-occupied apartments
- 3,413no vehicle
- 8,2151 vehicle
- 6,8992 vehicles
- 1,2743 vehicles
- 2314 vehicles
- 5125+ vehicles
89.6% of Harford County residents lived in the same house 1 years ago.
Out of people who lived in different houses, 34% lived in this county.
Out of people who lived in different counties, 76% lived in Maryland.
| Harford County: | 89.6% |
| State average: | 88.5% |
Place of birth for U.S.-born residents:
- This state: 176,616
- Other state: 67,376
- Northeast: 31,746
- Midwest: 7,510
- South: 21,038
- West: 7,082
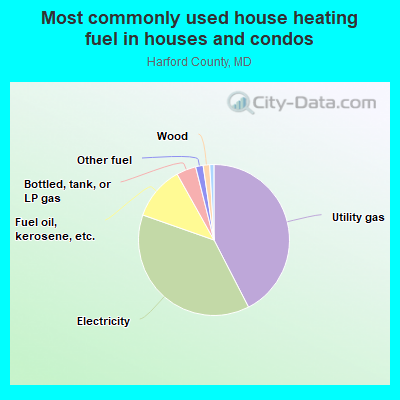
- 40.8%Utility gas
- 39.4%Electricity
- 10.2%Fuel oil, kerosene, etc.
- 7.1%Bottled, tank, or LP gas
- 1.4%Wood
- 0.5%Other fuel
- 0.3%No fuel used
- 0.2%Solar energy
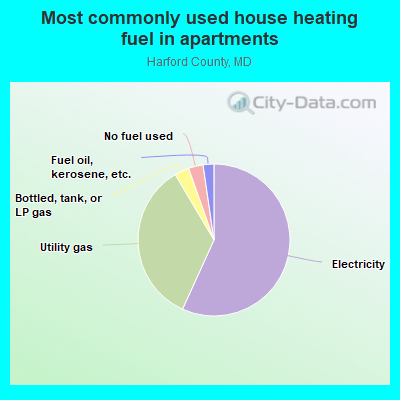
- 61.4%Electricity
- 28.4%Utility gas
- 5.2%Fuel oil, kerosene, etc.
- 3.1%Bottled, tank, or LP gas
- 0.8%Other fuel
- 0.6%No fuel used
- 0.3%Solar energy
- 0.2%Wood
Private vs. public school enrollment:
| Here: | 15.0% |
| Maryland: | 15.2% |
| Here: | 10.9% |
| Maryland: | 14.4% |
| Here: | 10.6% |
| Maryland: | 20.2% |
Harford County government finances - Expenditure in 2018:
- Bond Funds - Cash and Securities: $49,899,000
Cash and Securities: $31,025,000
- Charges - Sewerage: $25,498,000
Sewerage: $24,070,000
Higher Education - Other: $16,647,000
Higher Education - Other: $15,559,000
Solid Waste Management: $11,132,000
Solid Waste Management: $10,795,000
Other: $10,413,000
Other: $9,221,000
Elementary and Secondary Education School Lunch: $7,407,000
Elementary and Secondary Education School Lunch: $5,460,000
Higher Education Auxiliary Enterprises: $4,672,000
Higher Education Auxiliary Enterprises: $3,361,000
Regular Highways: $960,000
Parks and Recreation: $918,000
Regular Highways: $820,000
Parks and Recreation: $617,000
Elementary and Secondary Education School Tuition and Transportation: $427,000
Elementary and Secondary Education School Tuition and Transportation: $416,000
Elementary and Secondary Education - Other: $323,000
- Construction - Elementary and Secondary Education: $56,133,000
Elementary and Secondary Education: $31,308,000
- Current Operations - Elementary and Secondary Education: $505,279,000
Elementary and Secondary Education: $474,313,000
General - Other: $107,838,000
General - Other: $76,767,000
Police Protection: $67,065,000
Regular Highways: $58,745,000
Police Protection: $54,691,000
Other Higher Education: $54,088,000
Other Higher Education: $53,611,000
Regular Highways: $48,208,000
Water Utilities: $34,657,000
Water Utilities: $33,477,000
Correctional Institutions: $26,038,000
Correctional Institutions: $24,331,000
Sewerage: $18,853,000
Parks and Recreation: $17,501,000
Solid Waste Management: $17,130,000
Parks and Recreation: $15,879,000
Local Fire Protection: $15,147,000
Sewerage: $15,135,000
Solid Waste Management: $15,013,000
Housing and Community Development: $13,647,000
Housing and Community Development: $13,211,000
Judicial and Legal Services: $13,132,000
Judicial and Legal Services: $11,585,000
Central Staff Services: $10,330,000
Financial Administration: $10,229,000
Central Staff Services: $9,502,000
Financial Administration: $8,291,000
Local Fire Protection: $7,953,000
Natural Resources - Other: $7,656,000
Transit Utilities: $5,059,000
General Public Buildings: $4,593,000
General Public Buildings: $4,529,000
Higher Education Auxiliary Enterprises: $4,345,000
Natural Resources - Other: $3,869,000
Health - Other: $3,797,000
Higher Education Auxiliary Enterprises: $3,746,000
Health - Other: $3,727,000
Transit Utilities: $3,679,000
Protective Inspection and Regulation - Other: $3,315,000
Protective Inspection and Regulation - Other: $2,901,000
- Federal Intergovernmental - Other: $15,225,000
Housing and Community Development: $12,182,000
Housing and Community Development: $11,764,000
Education: $6,868,000
Education: $6,036,000
Other: $6,009,000
Highways: $4,707,000
Highways: $4,183,000
Transit Utilities: $2,507,000
Transit Utilities: $1,838,000
Natural Resources: $83,000
Natural Resources: $62,000
- General - Interest on Debt: $41,935,000
Interest on Debt: $37,376,000
- Intergovernmental to Local - Other - Libraries: $17,805,000
Other - Libraries: $17,101,000
Other - Elementary and Secondary Education: $11,967,000
Other - Elementary and Secondary Education: $11,518,000
Other - General - Other: $2,524,000
Other - General - Other: $2,362,000
- Local Intergovernmental - Education: $17,726,000
Education: $17,463,000
Other: $870,000
Other: $759,000
- Long Term Debt - Beginning Outstanding - Unspecified Public Purpose: $678,893,000
Outstanding Unspecified Public Purpose: $666,143,000
Beginning Outstanding - Unspecified Public Purpose: $663,623,000
Outstanding Unspecified Public Purpose: $660,648,000
Retired Unspecified Public Purpose: $157,117,000
Issue, Unspecified Public Purpose: $154,142,000
Outstanding Nonguaranteed - Industrial Revenue: $100,800,000
Outstanding Nonguaranteed - Industrial Revenue: $100,800,000
Beginning Outstanding - Public Debt for Private Purpose: $100,800,000
Beginning Outstanding - Public Debt for Private Purpose: $100,800,000
Retired Unspecified Public Purpose: $67,268,000
Issue, Unspecified Public Purpose: $54,518,000
- Miscellaneous - General Revenue - Other: $45,700,000
General Revenue - Other: $22,877,000
Interest Earnings: $11,267,000
Interest Earnings: $5,985,000
Fines and Forfeits: $425,000
Donations From Private Sources: $412,000
Fines and Forfeits: $398,000
Sale of Property: $383,000
Donations From Private Sources: $328,000
Rents: $278,000
Rents: $221,000
Sale of Property: $138,000
- Other Capital Outlay - Elementary and Secondary Education: $4,777,000
Elementary and Secondary Education: $3,139,000
Police Protection: $792,000
Solid Waste Management: $692,000
Other Higher Education: $546,000
Police Protection: $317,000
Other Higher Education: $287,000
General - Other: $125,000
Local Fire Protection: $111,000
Judicial and Legal Services: $100,000
Correctional Institutions: $63,000
Correctional Institutions: $54,000
Parks and Recreation: $48,000
Parks and Recreation: $42,000
Local Fire Protection: $25,000
Judicial and Legal Services: $12,000
Central Staff Services: $11,000
Transit Utilities: $9,000
General - Other: $9,000
Central Staff Services: $6,000
General Public Building: $3,000
General Public Building: $1,000
Protective Inspection and Regulation - Other: $1,000
Regular Highways: $1,000
- Other Funds - Cash and Securities: $399,111,000
Cash and Securities: $288,312,000
- Revenue - Water Utilities: $21,199,000
Water Utilities: $17,097,000
Transit Utilities: $275,000
Transit Utilities: $265,000
- Sinking Funds - Cash and Securities: $101,917,000
Cash and Securities: $101,556,000
- State Intergovernmental - Education: $270,324,000
Education: $256,853,000
Other: $12,373,000
Other: $11,338,000
Housing and Community Development: $1,434,000
Housing and Community Development: $1,274,000
Transit Utilities: $626,000
Transit Utilities: $432,000
General Local Government Support: $142,000
General Local Government Support: $61,000
- Tax - Property: $341,919,000
Property: $309,182,000
Individual Income: $245,726,000
Individual Income: $218,196,000
Documentary and Stock Transfer: $24,650,000
Documentary and Stock Transfer: $18,477,000
Other Selective Sales: $11,827,000
Public Utility License: $2,458,000
Public Utility License: $2,412,000
Other Selective Sales: $2,031,000
Other License: $1,547,000
Other License: $1,397,000
Occupation and Business License - Other: $640,000
Occupation and Business License - Other: $627,000
Amusements Sales: $548,000
Amusements Sales: $411,000
- Total Salaries and Wages: $355,654,000
: $339,574,000
Harford County government finances - Revenue in 2018:
- Bond Funds - Cash and Securities: $49,899,000
Cash and Securities: $31,025,000
- Charges - Sewerage: $25,498,000
Sewerage: $24,070,000
Higher Education - Other: $16,647,000
Higher Education - Other: $15,559,000
Solid Waste Management: $11,132,000
Solid Waste Management: $10,795,000
Other: $10,413,000
Other: $9,221,000
Elementary and Secondary Education School Lunch: $7,407,000
Elementary and Secondary Education School Lunch: $5,460,000
Higher Education Auxiliary Enterprises: $4,672,000
Higher Education Auxiliary Enterprises: $3,361,000
Regular Highways: $960,000
Parks and Recreation: $918,000
Regular Highways: $820,000
Parks and Recreation: $617,000
Elementary and Secondary Education School Tuition and Transportation: $427,000
Elementary and Secondary Education School Tuition and Transportation: $416,000
Elementary and Secondary Education - Other: $323,000
- Construction - Elementary and Secondary Education: $56,133,000
Elementary and Secondary Education: $31,308,000
- Current Operations - Elementary and Secondary Education: $505,279,000
Elementary and Secondary Education: $474,313,000
General - Other: $107,838,000
General - Other: $76,767,000
Police Protection: $67,065,000
Regular Highways: $58,745,000
Police Protection: $54,691,000
Other Higher Education: $54,088,000
Other Higher Education: $53,611,000
Regular Highways: $48,208,000
Water Utilities: $34,657,000
Water Utilities: $33,477,000
Correctional Institutions: $26,038,000
Correctional Institutions: $24,331,000
Sewerage: $18,853,000
Parks and Recreation: $17,501,000
Solid Waste Management: $17,130,000
Parks and Recreation: $15,879,000
Local Fire Protection: $15,147,000
Sewerage: $15,135,000
Solid Waste Management: $15,013,000
Housing and Community Development: $13,647,000
Housing and Community Development: $13,211,000
Judicial and Legal Services: $13,132,000
Judicial and Legal Services: $11,585,000
Central Staff Services: $10,330,000
Financial Administration: $10,229,000
Central Staff Services: $9,502,000
Financial Administration: $8,291,000
Local Fire Protection: $7,953,000
Natural Resources - Other: $7,656,000
Transit Utilities: $5,059,000
General Public Buildings: $4,593,000
General Public Buildings: $4,529,000
Higher Education Auxiliary Enterprises: $4,345,000
Natural Resources - Other: $3,869,000
Health - Other: $3,797,000
Higher Education Auxiliary Enterprises: $3,746,000
Health - Other: $3,727,000
Transit Utilities: $3,679,000
Protective Inspection and Regulation - Other: $3,315,000
Protective Inspection and Regulation - Other: $2,901,000
- Federal Intergovernmental - Other: $15,225,000
Housing and Community Development: $12,182,000
Housing and Community Development: $11,764,000
Education: $6,868,000
Education: $6,036,000
Other: $6,009,000
Highways: $4,707,000
Highways: $4,183,000
Transit Utilities: $2,507,000
Transit Utilities: $1,838,000
Natural Resources: $83,000
Natural Resources: $62,000
- General - Interest on Debt: $41,935,000
Interest on Debt: $37,376,000
- Intergovernmental to Local - Other - Libraries: $17,805,000
Other - Libraries: $17,101,000
Other - Elementary and Secondary Education: $11,967,000
Other - Elementary and Secondary Education: $11,518,000
Other - General - Other: $2,524,000
Other - General - Other: $2,362,000
- Local Intergovernmental - Education: $17,726,000
Education: $17,463,000
Other: $870,000
Other: $759,000
- Long Term Debt - Beginning Outstanding - Unspecified Public Purpose: $678,893,000
Outstanding Unspecified Public Purpose: $666,143,000
Beginning Outstanding - Unspecified Public Purpose: $663,623,000
Outstanding Unspecified Public Purpose: $660,648,000
Retired Unspecified Public Purpose: $157,117,000
Issue, Unspecified Public Purpose: $154,142,000
Outstanding Nonguaranteed - Industrial Revenue: $100,800,000
Outstanding Nonguaranteed - Industrial Revenue: $100,800,000
Beginning Outstanding - Public Debt for Private Purpose: $100,800,000
Beginning Outstanding - Public Debt for Private Purpose: $100,800,000
Retired Unspecified Public Purpose: $67,268,000
Issue, Unspecified Public Purpose: $54,518,000
- Miscellaneous - General Revenue - Other: $45,700,000
General Revenue - Other: $22,877,000
Interest Earnings: $11,267,000
Interest Earnings: $5,985,000
Fines and Forfeits: $425,000
Donations From Private Sources: $412,000
Fines and Forfeits: $398,000
Sale of Property: $383,000
Donations From Private Sources: $328,000
Rents: $278,000
Rents: $221,000
Sale of Property: $138,000
- Other Capital Outlay - Elementary and Secondary Education: $4,777,000
Elementary and Secondary Education: $3,139,000
Police Protection: $792,000
Solid Waste Management: $692,000
Other Higher Education: $546,000
Police Protection: $317,000
Other Higher Education: $287,000
General - Other: $125,000
Local Fire Protection: $111,000
Judicial and Legal Services: $100,000
Correctional Institutions: $63,000
Correctional Institutions: $54,000
Parks and Recreation: $48,000
Parks and Recreation: $42,000
Local Fire Protection: $25,000
Judicial and Legal Services: $12,000
Central Staff Services: $11,000
Transit Utilities: $9,000
General - Other: $9,000
Central Staff Services: $6,000
General Public Building: $3,000
General Public Building: $1,000
Protective Inspection and Regulation - Other: $1,000
Regular Highways: $1,000
- Other Funds - Cash and Securities: $399,111,000
Cash and Securities: $288,312,000
- Revenue - Water Utilities: $21,199,000
Water Utilities: $17,097,000
Transit Utilities: $275,000
Transit Utilities: $265,000
- Sinking Funds - Cash and Securities: $101,917,000
Cash and Securities: $101,556,000
- State Intergovernmental - Education: $270,324,000
Education: $256,853,000
Other: $12,373,000
Other: $11,338,000
Housing and Community Development: $1,434,000
Housing and Community Development: $1,274,000
Transit Utilities: $626,000
Transit Utilities: $432,000
General Local Government Support: $142,000
General Local Government Support: $61,000
- Tax - Property: $341,919,000
Property: $309,182,000
Individual Income: $245,726,000
Individual Income: $218,196,000
Documentary and Stock Transfer: $24,650,000
Documentary and Stock Transfer: $18,477,000
Other Selective Sales: $11,827,000
Public Utility License: $2,458,000
Public Utility License: $2,412,000
Other Selective Sales: $2,031,000
Other License: $1,547,000
Other License: $1,397,000
Occupation and Business License - Other: $640,000
Occupation and Business License - Other: $627,000
Amusements Sales: $548,000
Amusements Sales: $411,000
- Total Salaries and Wages: $355,654,000
: $339,574,000
Harford County government finances - Debt in 2018:
- Bond Funds - Cash and Securities: $49,899,000
Cash and Securities: $31,025,000
- Charges - Sewerage: $25,498,000
Sewerage: $24,070,000
Higher Education - Other: $16,647,000
Higher Education - Other: $15,559,000
Solid Waste Management: $11,132,000
Solid Waste Management: $10,795,000
Other: $10,413,000
Other: $9,221,000
Elementary and Secondary Education School Lunch: $7,407,000
Elementary and Secondary Education School Lunch: $5,460,000
Higher Education Auxiliary Enterprises: $4,672,000
Higher Education Auxiliary Enterprises: $3,361,000
Regular Highways: $960,000
Parks and Recreation: $918,000
Regular Highways: $820,000
Parks and Recreation: $617,000
Elementary and Secondary Education School Tuition and Transportation: $427,000
Elementary and Secondary Education School Tuition and Transportation: $416,000
Elementary and Secondary Education - Other: $323,000
- Construction - Elementary and Secondary Education: $56,133,000
Elementary and Secondary Education: $31,308,000
- Current Operations - Elementary and Secondary Education: $505,279,000
Elementary and Secondary Education: $474,313,000
General - Other: $107,838,000
General - Other: $76,767,000
Police Protection: $67,065,000
Regular Highways: $58,745,000
Police Protection: $54,691,000
Other Higher Education: $54,088,000
Other Higher Education: $53,611,000
Regular Highways: $48,208,000
Water Utilities: $34,657,000
Water Utilities: $33,477,000
Correctional Institutions: $26,038,000
Correctional Institutions: $24,331,000
Sewerage: $18,853,000
Parks and Recreation: $17,501,000
Solid Waste Management: $17,130,000
Parks and Recreation: $15,879,000
Local Fire Protection: $15,147,000
Sewerage: $15,135,000
Solid Waste Management: $15,013,000
Housing and Community Development: $13,647,000
Housing and Community Development: $13,211,000
Judicial and Legal Services: $13,132,000
Judicial and Legal Services: $11,585,000
Central Staff Services: $10,330,000
Financial Administration: $10,229,000
Central Staff Services: $9,502,000
Financial Administration: $8,291,000
Local Fire Protection: $7,953,000
Natural Resources - Other: $7,656,000
Transit Utilities: $5,059,000
General Public Buildings: $4,593,000
General Public Buildings: $4,529,000
Higher Education Auxiliary Enterprises: $4,345,000
Natural Resources - Other: $3,869,000
Health - Other: $3,797,000
Higher Education Auxiliary Enterprises: $3,746,000
Health - Other: $3,727,000
Transit Utilities: $3,679,000
Protective Inspection and Regulation - Other: $3,315,000
Protective Inspection and Regulation - Other: $2,901,000
- Federal Intergovernmental - Other: $15,225,000
Housing and Community Development: $12,182,000
Housing and Community Development: $11,764,000
Education: $6,868,000
Education: $6,036,000
Other: $6,009,000
Highways: $4,707,000
Highways: $4,183,000
Transit Utilities: $2,507,000
Transit Utilities: $1,838,000
Natural Resources: $83,000
Natural Resources: $62,000
- General - Interest on Debt: $41,935,000
Interest on Debt: $37,376,000
- Intergovernmental to Local - Other - Libraries: $17,805,000
Other - Libraries: $17,101,000
Other - Elementary and Secondary Education: $11,967,000
Other - Elementary and Secondary Education: $11,518,000
Other - General - Other: $2,524,000
Other - General - Other: $2,362,000
- Local Intergovernmental - Education: $17,726,000
Education: $17,463,000
Other: $870,000
Other: $759,000
- Long Term Debt - Beginning Outstanding - Unspecified Public Purpose: $678,893,000
Outstanding Unspecified Public Purpose: $666,143,000
Beginning Outstanding - Unspecified Public Purpose: $663,623,000
Outstanding Unspecified Public Purpose: $660,648,000
Retired Unspecified Public Purpose: $157,117,000
Issue, Unspecified Public Purpose: $154,142,000
Outstanding Nonguaranteed - Industrial Revenue: $100,800,000
Outstanding Nonguaranteed - Industrial Revenue: $100,800,000
Beginning Outstanding - Public Debt for Private Purpose: $100,800,000
Beginning Outstanding - Public Debt for Private Purpose: $100,800,000
Retired Unspecified Public Purpose: $67,268,000
Issue, Unspecified Public Purpose: $54,518,000
- Miscellaneous - General Revenue - Other: $45,700,000
General Revenue - Other: $22,877,000
Interest Earnings: $11,267,000
Interest Earnings: $5,985,000
Fines and Forfeits: $425,000
Donations From Private Sources: $412,000
Fines and Forfeits: $398,000
Sale of Property: $383,000
Donations From Private Sources: $328,000
Rents: $278,000
Rents: $221,000
Sale of Property: $138,000
- Other Capital Outlay - Elementary and Secondary Education: $4,777,000
Elementary and Secondary Education: $3,139,000
Police Protection: $792,000
Solid Waste Management: $692,000
Other Higher Education: $546,000
Police Protection: $317,000
Other Higher Education: $287,000
General - Other: $125,000
Local Fire Protection: $111,000
Judicial and Legal Services: $100,000
Correctional Institutions: $63,000
Correctional Institutions: $54,000
Parks and Recreation: $48,000
Parks and Recreation: $42,000
Local Fire Protection: $25,000
Judicial and Legal Services: $12,000
Central Staff Services: $11,000
Transit Utilities: $9,000
General - Other: $9,000
Central Staff Services: $6,000
General Public Building: $3,000
General Public Building: $1,000
Protective Inspection and Regulation - Other: $1,000
Regular Highways: $1,000
- Other Funds - Cash and Securities: $399,111,000
Cash and Securities: $288,312,000
- Revenue - Water Utilities: $21,199,000
Water Utilities: $17,097,000
Transit Utilities: $275,000
Transit Utilities: $265,000
- Sinking Funds - Cash and Securities: $101,917,000
Cash and Securities: $101,556,000
- State Intergovernmental - Education: $270,324,000
Education: $256,853,000
Other: $12,373,000
Other: $11,338,000
Housing and Community Development: $1,434,000
Housing and Community Development: $1,274,000
Transit Utilities: $626,000
Transit Utilities: $432,000
General Local Government Support: $142,000
General Local Government Support: $61,000
- Tax - Property: $341,919,000
Property: $309,182,000
Individual Income: $245,726,000
Individual Income: $218,196,000
Documentary and Stock Transfer: $24,650,000
Documentary and Stock Transfer: $18,477,000
Other Selective Sales: $11,827,000
Public Utility License: $2,458,000
Public Utility License: $2,412,000
Other Selective Sales: $2,031,000
Other License: $1,547,000
Other License: $1,397,000
Occupation and Business License - Other: $640,000
Occupation and Business License - Other: $627,000
Amusements Sales: $548,000
Amusements Sales: $411,000
- Total Salaries and Wages: $355,654,000
: $339,574,000
Harford County government finances - Cash and Securities in 2018:
- Bond Funds - Cash and Securities: $49,899,000
Cash and Securities: $31,025,000
- Charges - Sewerage: $25,498,000
Sewerage: $24,070,000
Higher Education - Other: $16,647,000
Higher Education - Other: $15,559,000
Solid Waste Management: $11,132,000
Solid Waste Management: $10,795,000
Other: $10,413,000
Other: $9,221,000
Elementary and Secondary Education School Lunch: $7,407,000
Elementary and Secondary Education School Lunch: $5,460,000
Higher Education Auxiliary Enterprises: $4,672,000
Higher Education Auxiliary Enterprises: $3,361,000
Regular Highways: $960,000
Parks and Recreation: $918,000
Regular Highways: $820,000
Parks and Recreation: $617,000
Elementary and Secondary Education School Tuition and Transportation: $427,000
Elementary and Secondary Education School Tuition and Transportation: $416,000
Elementary and Secondary Education - Other: $323,000
- Construction - Elementary and Secondary Education: $56,133,000
Elementary and Secondary Education: $31,308,000
- Current Operations - Elementary and Secondary Education: $505,279,000
Elementary and Secondary Education: $474,313,000
General - Other: $107,838,000
General - Other: $76,767,000
Police Protection: $67,065,000
Regular Highways: $58,745,000
Police Protection: $54,691,000
Other Higher Education: $54,088,000
Other Higher Education: $53,611,000
Regular Highways: $48,208,000
Water Utilities: $34,657,000
Water Utilities: $33,477,000
Correctional Institutions: $26,038,000
Correctional Institutions: $24,331,000
Sewerage: $18,853,000
Parks and Recreation: $17,501,000
Solid Waste Management: $17,130,000
Parks and Recreation: $15,879,000
Local Fire Protection: $15,147,000
Sewerage: $15,135,000
Solid Waste Management: $15,013,000
Housing and Community Development: $13,647,000
Housing and Community Development: $13,211,000
Judicial and Legal Services: $13,132,000
Judicial and Legal Services: $11,585,000
Central Staff Services: $10,330,000
Financial Administration: $10,229,000
Central Staff Services: $9,502,000
Financial Administration: $8,291,000
Local Fire Protection: $7,953,000
Natural Resources - Other: $7,656,000
Transit Utilities: $5,059,000
General Public Buildings: $4,593,000
General Public Buildings: $4,529,000
Higher Education Auxiliary Enterprises: $4,345,000
Natural Resources - Other: $3,869,000
Health - Other: $3,797,000
Higher Education Auxiliary Enterprises: $3,746,000
Health - Other: $3,727,000
Transit Utilities: $3,679,000
Protective Inspection and Regulation - Other: $3,315,000
Protective Inspection and Regulation - Other: $2,901,000
- Federal Intergovernmental - Other: $15,225,000
Housing and Community Development: $12,182,000
Housing and Community Development: $11,764,000
Education: $6,868,000
Education: $6,036,000
Other: $6,009,000
Highways: $4,707,000
Highways: $4,183,000
Transit Utilities: $2,507,000
Transit Utilities: $1,838,000
Natural Resources: $83,000
Natural Resources: $62,000
- General - Interest on Debt: $41,935,000
Interest on Debt: $37,376,000
- Intergovernmental to Local - Other - Libraries: $17,805,000
Other - Libraries: $17,101,000
Other - Elementary and Secondary Education: $11,967,000
Other - Elementary and Secondary Education: $11,518,000
Other - General - Other: $2,524,000
Other - General - Other: $2,362,000
- Local Intergovernmental - Education: $17,726,000
Education: $17,463,000
Other: $870,000
Other: $759,000
- Long Term Debt - Beginning Outstanding - Unspecified Public Purpose: $678,893,000
Outstanding Unspecified Public Purpose: $666,143,000
Beginning Outstanding - Unspecified Public Purpose: $663,623,000
Outstanding Unspecified Public Purpose: $660,648,000
Retired Unspecified Public Purpose: $157,117,000
Issue, Unspecified Public Purpose: $154,142,000
Outstanding Nonguaranteed - Industrial Revenue: $100,800,000
Outstanding Nonguaranteed - Industrial Revenue: $100,800,000
Beginning Outstanding - Public Debt for Private Purpose: $100,800,000
Beginning Outstanding - Public Debt for Private Purpose: $100,800,000
Retired Unspecified Public Purpose: $67,268,000
Issue, Unspecified Public Purpose: $54,518,000
- Miscellaneous - General Revenue - Other: $45,700,000
General Revenue - Other: $22,877,000
Interest Earnings: $11,267,000
Interest Earnings: $5,985,000
Fines and Forfeits: $425,000
Donations From Private Sources: $412,000
Fines and Forfeits: $398,000
Sale of Property: $383,000
Donations From Private Sources: $328,000
Rents: $278,000
Rents: $221,000
Sale of Property: $138,000
- Other Capital Outlay - Elementary and Secondary Education: $4,777,000
Elementary and Secondary Education: $3,139,000
Police Protection: $792,000
Solid Waste Management: $692,000
Other Higher Education: $546,000
Police Protection: $317,000
Other Higher Education: $287,000
General - Other: $125,000
Local Fire Protection: $111,000
Judicial and Legal Services: $100,000
Correctional Institutions: $63,000
Correctional Institutions: $54,000
Parks and Recreation: $48,000
Parks and Recreation: $42,000
Local Fire Protection: $25,000
Judicial and Legal Services: $12,000
Central Staff Services: $11,000
Transit Utilities: $9,000
General - Other: $9,000
Central Staff Services: $6,000
General Public Building: $3,000
General Public Building: $1,000
Protective Inspection and Regulation - Other: $1,000
Regular Highways: $1,000
- Other Funds - Cash and Securities: $399,111,000
Cash and Securities: $288,312,000
- Revenue - Water Utilities: $21,199,000
Water Utilities: $17,097,000
Transit Utilities: $275,000
Transit Utilities: $265,000
- Sinking Funds - Cash and Securities: $101,917,000
Cash and Securities: $101,556,000
- State Intergovernmental - Education: $270,324,000
Education: $256,853,000
Other: $12,373,000
Other: $11,338,000
Housing and Community Development: $1,434,000
Housing and Community Development: $1,274,000
Transit Utilities: $626,000
Transit Utilities: $432,000
General Local Government Support: $142,000
General Local Government Support: $61,000
- Tax - Property: $341,919,000
Property: $309,182,000
Individual Income: $245,726,000
Individual Income: $218,196,000
Documentary and Stock Transfer: $24,650,000
Documentary and Stock Transfer: $18,477,000
Other Selective Sales: $11,827,000
Public Utility License: $2,458,000
Public Utility License: $2,412,000
Other Selective Sales: $2,031,000
Other License: $1,547,000
Other License: $1,397,000
Occupation and Business License - Other: $640,000
Occupation and Business License - Other: $627,000
Amusements Sales: $548,000
Amusements Sales: $411,000
- Total Salaries and Wages: $355,654,000
: $339,574,000
Supplemental Security Income (SSI) in 2006:
- Total number of recipients: 2,343
- Number of aged recipients: 225
- Number of blind and disabled recipients: 2,118
- Number of recipients under 18: 444
- Number of recipients between 18 and 64: 1,473
- Number of recipients older than 64: 426
- Number of recipients also receiving OASDI: 754
- Amount of payments (thousands of dollars): 1,092
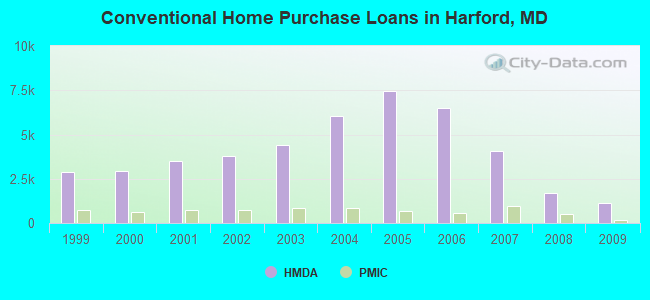
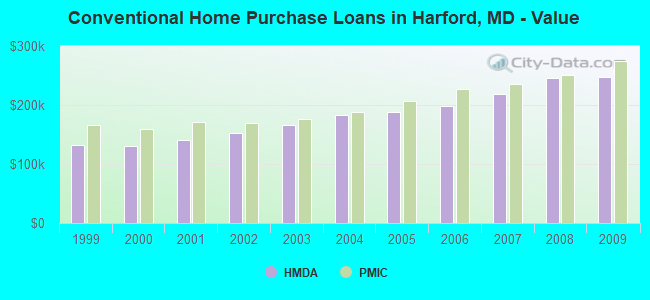
| Home Mortgage Disclosure Act Aggregated Statistics For Year 2009 (Based on 44 full tracts) | ||||||||||||||
| A) FHA, FSA/RHS & VA Home Purchase Loans | B) Conventional Home Purchase Loans | C) Refinancings | D) Home Improvement Loans | E) Loans on Dwellings For 5+ Families | F) Non-occupant Loans on < 5 Family Dwellings (A B C & D) | G) Loans On Manufactured Home Dwelling (A B C & D) | ||||||||
|---|---|---|---|---|---|---|---|---|---|---|---|---|---|---|
| Number | Average Value | Number | Average Value | Number | Average Value | Number | Average Value | Number | Average Value | Number | Average Value | Number | Average Value | |
| LOANS ORIGINATED | 1,547 | $240,504 | 1,156 | $247,815 | 8,266 | $234,708 | 417 | $116,062 | 4 | $5,687,500 | 483 | $218,634 | 44 | $98,182 |
| APPLICATIONS APPROVED, NOT ACCEPTED | 67 | $224,000 | 104 | $281,567 | 649 | $234,519 | 63 | $46,476 | 0 | $0 | 35 | $175,486 | 14 | $92,500 |
| APPLICATIONS DENIED | 152 | $247,664 | 145 | $190,428 | 2,386 | $245,049 | 196 | $63,235 | 5 | $5,811,000 | 127 | $180,827 | 62 | $78,645 |
| APPLICATIONS WITHDRAWN | 164 | $246,085 | 162 | $236,988 | 1,760 | $251,452 | 61 | $129,475 | 0 | $0 | 69 | $175,507 | 6 | $155,500 |
| FILES CLOSED FOR INCOMPLETENESS | 29 | $216,690 | 20 | $261,000 | 470 | $251,549 | 20 | $117,600 | 0 | $0 | 35 | $261,314 | 3 | $114,667 |
| Private Mortgage Insurance Companies Aggregated Statistics For Year 2009 (Based on 43 full tracts) | ||||||||
| A) Conventional Home Purchase Loans | B) Refinancings | C) Non-occupant Loans on < 5 Family Dwellings (A & B) | D) Loans On Manufactured Home Dwelling (A & B) | |||||
|---|---|---|---|---|---|---|---|---|
| Number | Average Value | Number | Average Value | Number | Average Value | Number | Average Value | |
| LOANS ORIGINATED | 160 | $274,462 | 153 | $286,314 | 0 | $0 | 0 | $0 |
| APPLICATIONS APPROVED, NOT ACCEPTED | 39 | $324,410 | 50 | $276,100 | 4 | $195,500 | 0 | $0 |
| APPLICATIONS DENIED | 21 | $244,238 | 40 | $261,800 | 0 | $0 | 1 | $247,000 |
| APPLICATIONS WITHDRAWN | 7 | $293,000 | 22 | $288,864 | 0 | $0 | 0 | $0 |
| FILES CLOSED FOR INCOMPLETENESS | 6 | $352,167 | 1 | $288,000 | 1 | $54,000 | 0 | $0 |
| Most common first names in Harford County, MD among deceased individuals | ||
| Name | Count | Lived (average) |
|---|---|---|
| John | 682 | 74.6 years |
| William | 675 | 74.3 years |
| Mary | 633 | 79.6 years |
| James | 487 | 72.4 years |
| Charles | 445 | 73.9 years |
| Robert | 417 | 70.7 years |
| George | 338 | 75.5 years |
| Margaret | 323 | 81.0 years |
| Helen | 309 | 80.5 years |
| Joseph | 300 | 75.7 years |
| Most common last names in Harford County, MD among deceased individuals | ||
| Last name | Count | Lived (average) |
|---|---|---|
| Smith | 204 | 76.1 years |
| Johnson | 174 | 72.8 years |
| Jones | 162 | 74.4 years |
| Brown | 136 | 74.0 years |
| Miller | 121 | 76.0 years |
| Williams | 104 | 74.6 years |
| Taylor | 97 | 73.2 years |
| Wilson | 85 | 76.7 years |
| Hall | 85 | 74.1 years |
| Davis | 80 | 73.3 years |
| Businesses in Harford County, MD | ||||
| Name | Count | Name | Count | |
|---|---|---|---|---|
| 7-Eleven | 17 | Lane Bryant | 1 | |
| ALDI | 1 | Lane Furniture | 1 | |
| AT&T | 3 | Little Caesars Pizza | 3 | |
| Ace Hardware | 1 | Lowe's | 1 | |
| Advance Auto Parts | 4 | Macy's | 1 | |
| Aeropostale | 1 | Marriott | 3 | |
| American Eagle Outfitters | 1 | Marshalls | 1 | |
| Applebee's | 2 | MasterBrand Cabinets | 23 | |
| Arby's | 2 | Mazda | 2 | |
| AutoZone | 2 | McDonald's | 10 | |
| BMW | 1 | Men's Wearhouse | 2 | |
| Baja Fresh Mexican Grill | 1 | Motherhood Maternity | 1 | |
| Barnes & Noble | 1 | New Balance | 1 | |
| Baskin-Robbins | 3 | New York & Co | 1 | |
| Bath & Body Works | 1 | Nike | 14 | |
| Bed Bath & Beyond | 1 | Nissan | 1 | |
| Best Western | 1 | Office Depot | 1 | |
| Blockbuster | 1 | Old Navy | 1 | |
| Budget Car Rental | 1 | Outback | 1 | |
| Buffalo Wild Wings | 1 | Outback Steakhouse | 1 | |
| Burger King | 10 | Pac Sun | 1 | |
| CVS | 5 | Panera Bread | 2 | |
| Charlotte Russe | 1 | Papa John's Pizza | 4 | |
| Chevrolet | 1 | Payless | 2 | |
| Chick-Fil-A | 1 | Penske | 2 | |
| Chipotle | 1 | PetSmart | 2 | |
| Chuck E. Cheese's | 1 | Pier 1 Imports | 1 | |
| Cinnabon | 1 | Pizza Hut | 7 | |
| Clarion | 1 | Popeyes | 1 | |
| Cold Stone Creamery | 2 | Qdoba Mexican Grill | 1 | |
| ColorTyme | 1 | Quiznos | 1 | |
| Cracker Barrel | 1 | RadioShack | 3 | |
| Cricket Wireless | 3 | Ramada | 1 | |
| Curves | 3 | Red Lobster | 1 | |
| DHL | 1 | Red Robin | 1 | |
| Dairy Queen | 1 | Red Roof Inn | 1 | |
| Days Inn | 2 | Rite Aid | 11 | |
| Deb | 1 | Ruby Tuesday | 2 | |
| Decora Cabinetry | 4 | Ryder Rental & Truck Leasing | 1 | |
| Dennys | 1 | Safeway | 1 | |
| Domino's Pizza | 3 | Sears | 2 | |
| DressBarn | 2 | Sleep Inn | 1 | |
| Dressbarn | 2 | Spencer Gifts | 1 | |
| Dunkin Donuts | 8 | Sprint Nextel | 2 | |
| Extended Stay America | 1 | Staples | 1 | |
| Fashion Bug | 1 | Starbucks | 7 | |
| FedEx | 27 | Subaru | 1 | |
| Finish Line | 1 | Subway | 14 | |
| Firestone Complete Auto Care | 2 | Super 8 | 3 | |
| Ford | 2 | T-Mobile | 6 | |
| GNC | 10 | T.G.I. Driday's | 1 | |
| GameStop | 3 | T.J.Maxx | 1 | |
| Giant | 2 | Taco Bell | 4 | |
| Goodwill | 3 | Talbots | 1 | |
| H&R Block | 7 | Target | 3 | |
| Hilton | 1 | The Room Place | 2 | |
| Holiday Inn | 3 | Toys"R"Us | 1 | |
| Hollister Co. | 1 | Travelodge | 1 | |
| Home Depot | 3 | True Value | 5 | |
| Hot Topic | 1 | U-Haul | 12 | |
| Hyundai | 1 | UPS | 27 | |
| JoS. A. Bank | 1 | Vans | 1 | |
| Jones New York | 2 | Verizon Wireless | 2 | |
| Journeys | 1 | Victoria's Secret | 1 | |
| Justice | 1 | Volkswagen | 1 | |
| KFC | 4 | Vons | 1 | |
| Kincaid | 1 | Waffle House | 4 | |
| Kohl's | 2 | Walgreens | 6 | |
| Kroger | 1 | Walmart | 2 | |
| La Quinta | 2 | Wendy's | 6 | |
| La-Z-Boy | 1 | Wingate | 1 | |
Harford County on our top lists:
- #28 on the list of "Top 101 counties with the highest percentage of residents that drank alcohol in the past 30 days"
- #65 on the list of "Top 101 counties with the highest Particulate Matter (PM2.5) Annual air pollution readings in 2012 (µg/m3)"
- #79 on the list of "Top 101 counties with the highest percentage of residents that visited a dentist within the past year"
- #81 on the list of "Top 101 counties with the best general health status score of residents (1-5), 3 years of data"
- #98 on the list of "Top 101 counties with the largest increase in the number of deaths per 1000 residents 2000-2006 to 2007-2013 (pop. 50,000+)"