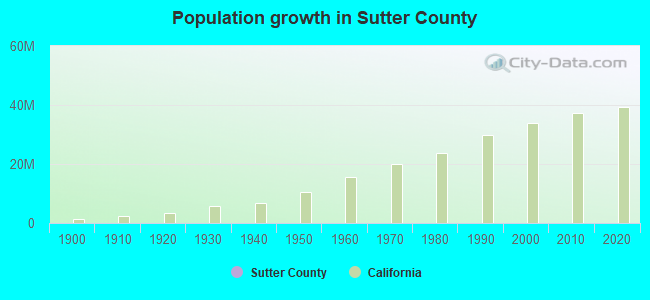
Sutter County, California (CA)
County owner-occupied free and clear houses and condos in 2010: 4,933
County owner-occupied houses and condos in 2000: 16,615
Renter-occupied apartments: 12,225 (it was 10,418 in 2000)
| % of renters here: | 39% |
| State: | 44% |
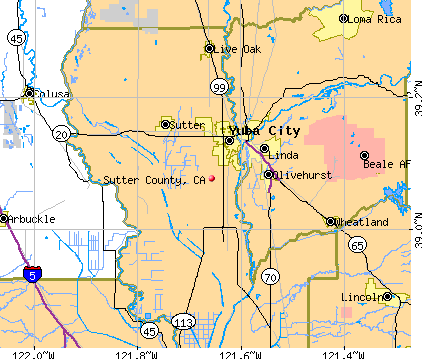
Land area: 603 sq. mi.
Water area: 6.0 sq. mi.
Population density: 163 people per square mile (high).
Industries providing employment: Educational, health and social services (20.9%), Retail trade (13.2%).
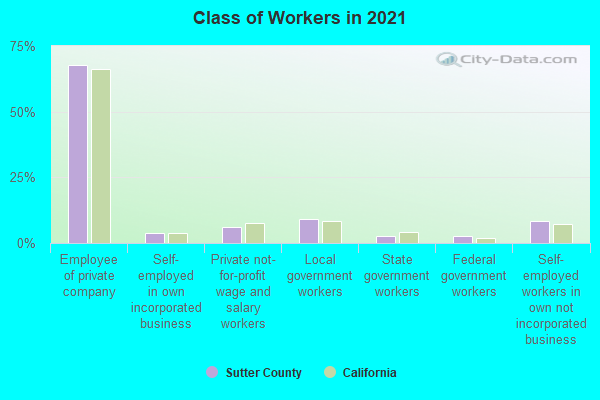
Type of workers:
- Private wage or salary: 74%
- Government: 18%
- Self-employed, not incorporated: 8%
- Unpaid family work: 0%
- OSM Map
- General Map
- Google Map
- MSN Map

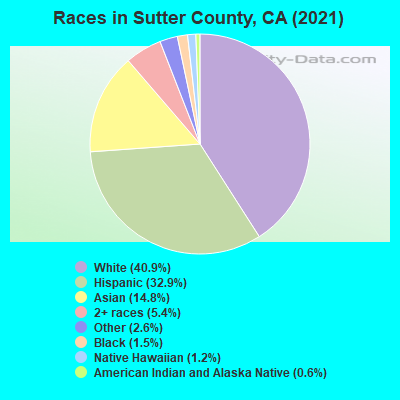
- 39,74940.4%White Non-Hispanic Alone
- 32,75833.3%Hispanic or Latino
- 17,16617.4%Asian alone
- 4,5694.6%Two or more races
- 2,0512.1%Black Non-Hispanic Alone
- 1,3141.3%Some other race alone
- 4650.5%Native Hawaiian and Other
Pacific Islander alone - 4310.4%American Indian and Alaska Native alone
| Median resident age: | 38.4 years |
| California median age: | 37.9 years |
| Males: 50,253 | |
| Females: 48,250 |


| Sutter County: | 2.0 people |
| California: | 3 people |
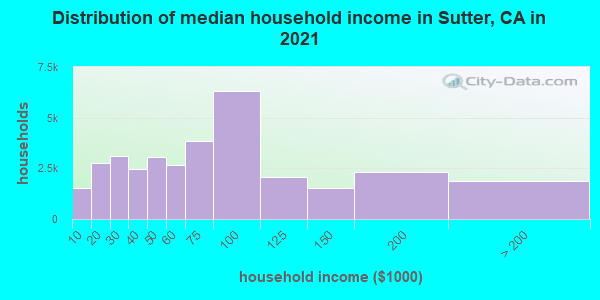
Estimated median household income in 2022: $65,018 ($38,375 in 1999)
| This county: | $65,018 |
| California: | $91,551 |
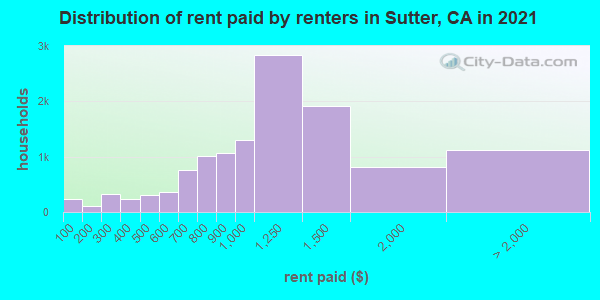
Median contract rent in 2022 for apartments: $1,168 (lower quartile is $886, upper quartile is $1,460)
| This county: | $1168 |
| State: | $1719 |
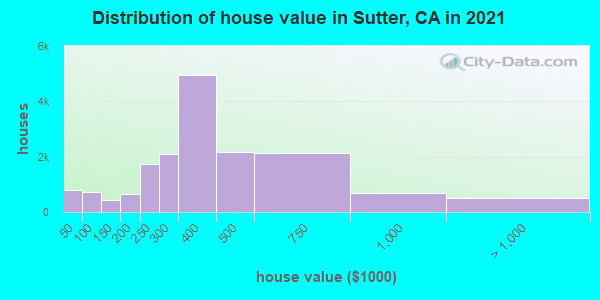
Estimated median house or condo value in 2022: $433,100 (it was $119,900 in 2000)
| Sutter: | $433,100 |
| California: | $715,900 |
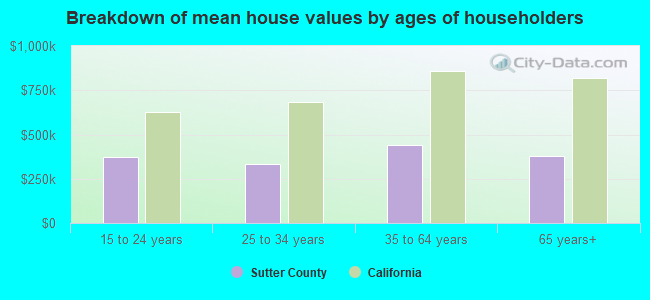
Mean price in 2022:
Median monthly housing costs for homes and condos with a mortgage: $1,971Detached houses: $500,791
Here: $500,791 State: $988,808 Townhouses or other attached units: $492,332
Here: $492,332 State: $838,546 In 2-unit structures: $1,037,854
Here: $1,037,854 State: $1,138,100 In 3-to-4-unit structures: $172,512
Here: $172,512 State: $824,253 In 5-or-more-unit structures: $165,844
Here: $165,844 State: $730,996 Mobile homes: $158,826
Here: $158,826 State: $184,506 Occupied boats, RVs, vans, etc.: $69,481
Here: $69,481 State: $204,957
Median monthly housing costs for units without a mortgage: $665
Institutionalized population: 860
Crime in 2020 (reported by the sheriff's office or county police, not the county total):
- Murders: 1
- Rapes: 4
- Robberies: 12
- Assaults: 52
- Burglaries: 145
- Thefts: 318
- Auto thefts: 67
Crime in 2019 (reported by the sheriff's office or county police, not the county total):
- Murders: 1
- Rapes: 4
- Robberies: 13
- Assaults: 59
- Burglaries: 167
- Thefts: 350
- Auto thefts: 59
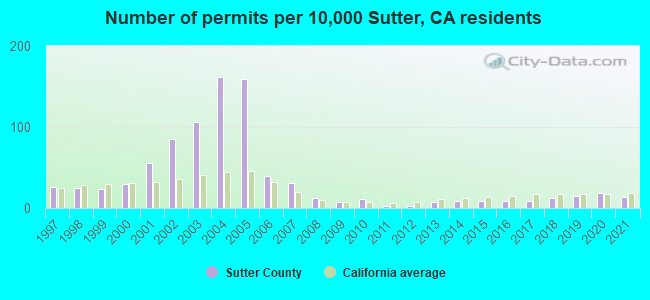
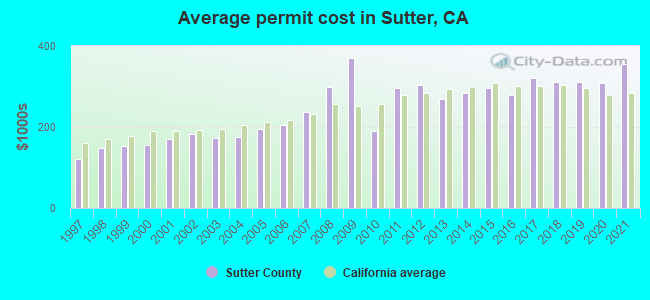
Single-family new house construction building permits:
- 2022: 125 buildings, average cost: $413,500
- 2021: 106 buildings, average cost: $355,400
- 2020: 144 buildings, average cost: $308,500
- 2019: 116 buildings, average cost: $310,400
- 2018: 97 buildings, average cost: $310,000
- 2017: 74 buildings, average cost: $321,300
- 2016: 70 buildings, average cost: $280,400
- 2015: 70 buildings, average cost: $296,700
- 2014: 69 buildings, average cost: $283,800
- 2013: 55 buildings, average cost: $267,700
- 2012: 23 buildings, average cost: $303,000
- 2011: 21 buildings, average cost: $295,600
- 2010: 88 buildings, average cost: $189,000
- 2009: 59 buildings, average cost: $370,400
- 2008: 98 buildings, average cost: $299,000
- 2007: 245 buildings, average cost: $237,700
- 2006: 318 buildings, average cost: $204,300
- 2005: 1258 buildings, average cost: $196,000
- 2004: 1275 buildings, average cost: $175,500
- 2003: 833 buildings, average cost: $173,400
- 2002: 669 buildings, average cost: $183,000
- 2001: 434 buildings, average cost: $170,200
- 2000: 238 buildings, average cost: $156,000
- 1999: 180 buildings, average cost: $153,100
- 1998: 196 buildings, average cost: $147,400
- 1997: 204 buildings, average cost: $122,100
Median real estate property taxes paid for housing units with mortgages in 2022: $2,996 (0.7%)
Median real estate property taxes paid for housing units with no mortgage in 2022: $2,536 (0.7%)
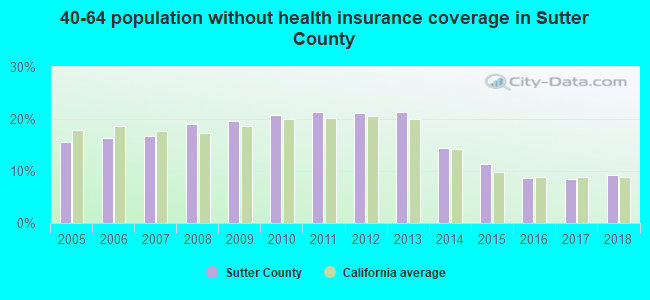
| Sutter County: | 15.9% |
| California: | 12.2% |
Median age of residents in 2022: 38.4 years old
(Males: 36.6 years old, Females: 39.6 years old)
(Median age for: White residents: 46.3 years old, Black residents: 30.8 years old, American Indian residents: 24.4 years old, Asian residents: 44.5 years old, Hispanic or Latino residents: 28.6 years old, Other race residents: 27.8 years old)
Area name: Yuba City, CA MSA
Fair market rent in 2006 for a 1-bedroom apartment in Sutter County is $493 a month.
Fair market rent for a 2-bedroom apartment is $606 a month.
Fair market rent for a 3-bedroom apartment is $882 a month.
Cities in this county include: Yuba City, South Yuba City, Tierra Buena, Sutter, South Sutter, Yuba Rural, Meridian-Robbins, Meridian, Rio Oso, Robbins.
| Zip code | City | Number of tests | Number of tests >= 4 pCi/L |
|---|---|---|---|
| 95659 | Nicolaus | 1 | 0 |
| 95674 | Rio Oso | 3 | 0 |
| 95953 | Live Oak | 7 | 0 |
| 95991 | Yuba City | 19 | 3 |
| 95992 | Yuba City | 1 | 0 |
| 95993 | Yuba City | 12 | 3 |
2023 air pollution in Sutter County:
Nitrogen Dioxide: 0.01 ppm (standard limit: 0.053 ppm). Above U.S. average.
Ozone (1-hour): 0.045 ppm (standard limit: 0.12 ppm). Above U.S. average.
Particulate Matter (PM10) Annual: 14.0 µg/m3. Near U.S. average.
Particulate Matter (PM2.5) Annual: 6.0 µg/m3(standard limit: 15.0 µg/m3). Near U.S. average.
Neighboring counties: Harford County, Maryland  , Decatur County, Indiana , Campbell County, Kentucky , Randolph County, West Virginia , Lafayette County, Missouri , Owen County, Indiana .
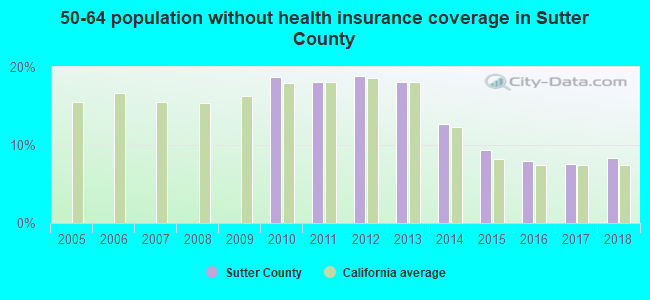
| Here: | 8.7% |
| California: | 5.1% |
Current college students: 4,072
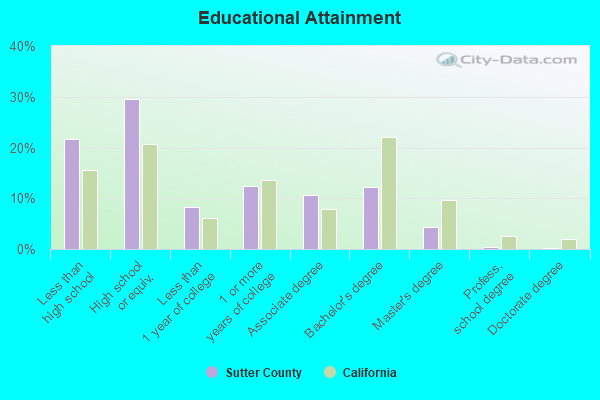
People 25 years of age or older with a high school degree or higher: 79.8%
People 25 years of age or older with a bachelor's degree or higher: 21.9%
Number of foreign born residents: 21,030 (50.0% naturalized citizens)
| Sutter County: | 21.3% |
| Whole state: | 26.7% |
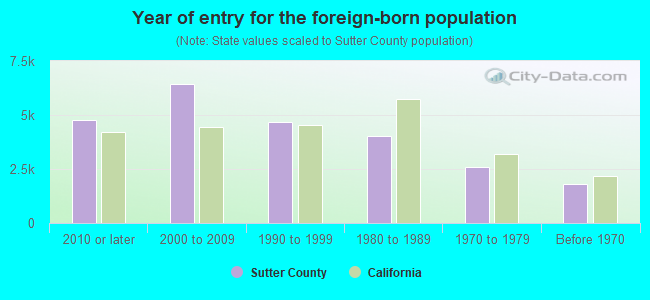
- Year of entry for the foreign-born population
- 5,7472010 or later
- 5,8022000 to 2009
- 4,4281990 to 1999
- 4,0231980 to 1989
- 2,6101970 to 1979
- 1,819Before 1970
Mean travel time to work (commute): minutes
Percentage of county residents living and working in this county: 99.1%
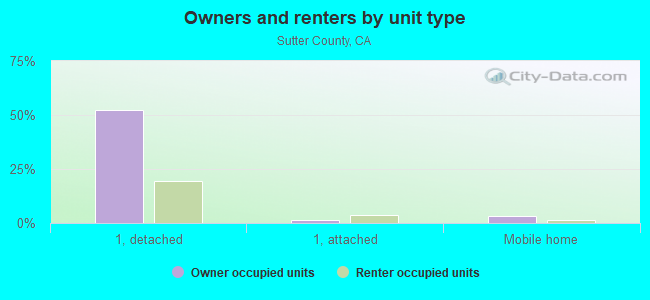
Housing units in structures:
- One, detached: 26,341
- One, attached: 1,626
- Two: 691
- 3 or 4: 760
- 5 to 9: 653
- 10 to 19: 738
- 20 to 49: 1,401
- 50 or more: 796
- Mobile homes: 1,683
- Boats, RVs, vans, etc.: 85
Housing units in Sutter County with a mortgage: 12,268 (678 second mortgage, 72 home equity loan, 495 both second mortgage and home equity loan)
Houses without a mortgage: 136
| Here: | 8.1% with mortgage |
| State: | 98.6% with mortgage |
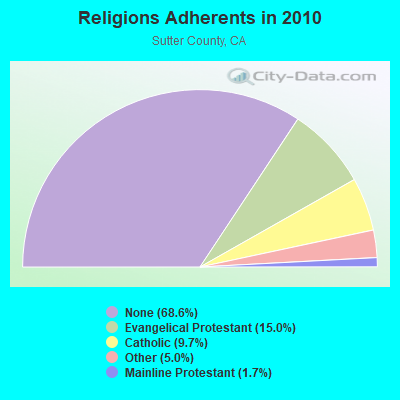
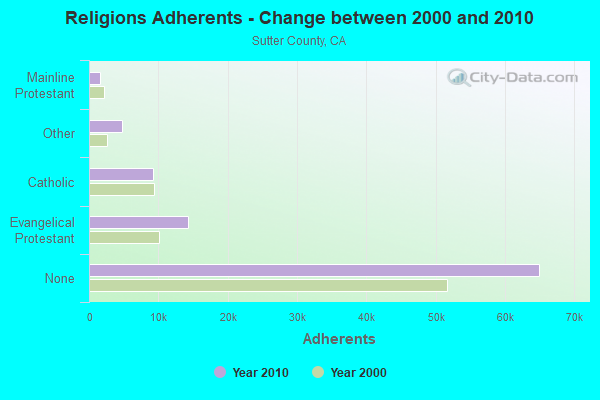
Religion statistics for Sutter County
| Religion | Adherents | Congregations |
|---|---|---|
| Evangelical Protestant | 14,212 | 43 |
| Catholic | 9,181 | 3 |
| Other | 4,765 | 17 |
| Mainline Protestant | 1,624 | 7 |
| None | 64,955 | - |
Source: Clifford Grammich, Kirk Hadaway, Richard Houseal, Dale E.Jones, Alexei Krindatch, Richie Stanley and Richard H.Taylor. 2012. 2010 U.S.Religion Census: Religious Congregations & Membership Study. Association of Statisticians of American Religious Bodies. Jones, Dale E., et al. 2002. Congregations and Membership in the United States 2000. Nashville, TN: Glenmary Research Center.
Food Environment Statistics:
| Sutter County: | 2.29 / 10,000 pop. |
| State: | 2.14 / 10,000 pop. |
| Here: | 0.11 / 10,000 pop. |
| California: | 0.04 / 10,000 pop. |
| This county: | 1.42 / 10,000 pop. |
| California: | 0.62 / 10,000 pop. |
| Sutter County: | 2.08 / 10,000 pop. |
| California: | 1.49 / 10,000 pop. |
| This county: | 6.66 / 10,000 pop. |
| State: | 7.42 / 10,000 pop. |
| Sutter County: | 7.4% |
| California: | 7.3% |
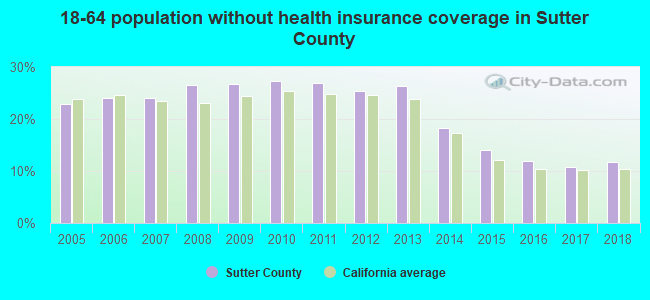
| Sutter County: | 24.5% |
| State: | 21.3% |
| Here: | 16.2% |
| State: | 17.9% |
Agriculture in Sutter County:
Average size of farms: 267 acresAverage value of agricultural products sold per farm: $180,173
Average value of crops sold per acre for harvested cropland: $914.02
The value of nursery, greenhouse, floriculture, and sod as a percentage of the total market value of agricultural products sold: 2.76%
The value of livestock, poultry, and their products as a percentage of the total market value of agricultural products sold: 2.30%
Harvested cropland as a percentage of land in farms: 72.02%
Irrigated harvested cropland as a percentage of land in farms: 90.35%
Average market value of all machinery and equipment per farm: $118,498
The percentage of farms operated by a family or individual: 73.62%
Average age of principal farm operators: 55 years
Average number of cattle and calves per 100 acres of all land in farms: 2.78
Corn for grain: 6212 harvested acres
All wheat for grain: 11303 harvested acres
Upland cotton: 2080 harvested acres
Vegetables: 12,933 harvested acres
Land in orchards: 80,467 acres
Earthquake activity:
Sutter County-area historical earthquake activity is significantly above California state average. It is 7310% greater than the overall U.S. average.On 4/18/1906 at 13:12:21, a magnitude 7.9 (7.9 UK, Class: Major, Intensity: VIII - XII) earthquake occurred 104.0 miles away from Sutter County center, causing $524,000,000 total damage
On 1/31/1922 at 13:17:28, a magnitude 7.6 (7.6 UK) earthquake occurred 235.2 miles away from the county center
On 10/3/1915 at 06:52:48, a magnitude 7.6 (7.6 UK) earthquake occurred 241.9 miles away from the county center
On 4/25/1992 at 18:06:04, a magnitude 7.2 (6.3 MB, 7.1 MS, 7.2 MW, 7.1 MW, Depth: 9.4 mi) earthquake occurred 155.6 miles away from the county center, causing $75,000,000 total damage
On 10/18/1989 at 00:04:15, a magnitude 7.1 (6.5 MB, 7.1 MS, 6.9 MW, 7.0 ML) earthquake occurred 136.1 miles away from Sutter County center, causing 62 deaths (62 shaking deaths) and 3757 injuries, causing $1,305,032,704 total damage
On 12/21/1932 at 06:10:09, a magnitude 7.2 (7.2 UK) earthquake occurred 196.6 miles away from the county center
Magnitude types: body-wave magnitude (MB), local magnitude (ML), surface-wave magnitude (MS), moment magnitude (MW)
Most recent natural disasters:
- California Covid-19 Pandemic, Incident Period: January 20, 2020, FEMA Id: 4482, Natural disaster type: Other
- California Severe Winter Storms, Flooding, Mudslides, Incident Period: February 1, 2017 - February 23, 2017, FEMA Id: 4308, Natural disaster type: Winter Storm, Mudslide, Flood
- California Severe Winter Storms, Flooding, And Mudslides, Incident Period: January 3, 2017 - January 12, 2017, FEMA Id: 4301, Natural disaster type: Winter Storm, Mudslide, Flood
- California Severe Storms, Flooding, Mudslides, and Landslides, Incident Period: December 17, 2005 to January 03, 2006, Major Disaster (Presidential) Declared DR-1628: February 03, 2006, FEMA Id: 1628, Natural disaster type: Storm, Mudslide, Landslide, Flood
- California Hurricane Katrina Evacuation, Incident Period: August 29, 2005 to October 01, 2005, Emergency Declared EM-3248: September 13, 2005, FEMA Id: 3248, Natural disaster type: Hurricane
- California Severe Winter Storms and Flooding, Incident Period: February 02, 1998 to April 30, 1998, Major Disaster (Presidential) Declared DR-1203: February 09, 1998, FEMA Id: 1203, Natural disaster type: Winter Storm, Flood
- California Severe Storms/Flooding, Incident Period: December 28, 1996 to April 01, 1997, Major Disaster (Presidential) Declared DR-1155: January 04, 1997, FEMA Id: 1155, Natural disaster type: Storm, Flood
- California Severe Winter Storms, Flooding, Landslides, Mud Flows, Incident Period: February 13, 1995 to April 19, 1995, Major Disaster (Presidential) Declared DR-1046: March 12, 1995, FEMA Id: 1046, Natural disaster type: Winter Storm, Landslide, Flood
- California Severe Winter Storms, Flooding, Landslides, Mud Flows, Incident Period: January 03, 1995 to February 10, 1995, Major Disaster (Presidential) Declared DR-1044: January 10, 1995, FEMA Id: 1044, Natural disaster type: Winter Storm, Landslide, Flood
- California Severe Freeze, Incident Period: December 19, 1990 to January 03, 1991, Major Disaster (Presidential) Declared DR-894: February 11, 1991, FEMA Id: 894, Natural disaster type: Freeze
- 5 other natural disasters have been reported since 1953.
The number of natural disasters in Sutter County (15) is near the US average (15).
Major Disasters (Presidential) Declared: 10
Emergencies Declared: 2
Causes of natural disasters: Floods: 11, Storms: 5, Winter Storms: 5, Landslides: 3, Mudslides: 3, Drought: 1, Freeze: 1, Heavy Rain: 1, Hurricane: 1, Tornado: 1, Other: 1 (Note: some incidents may be assigned to more than one category).
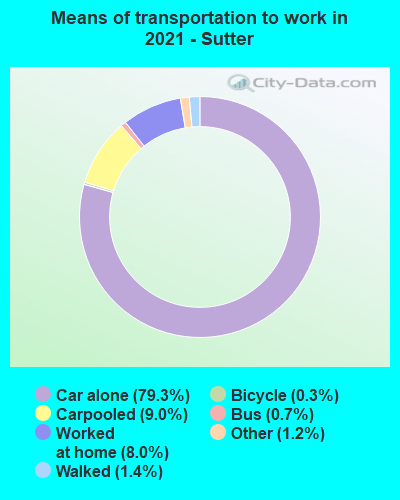
Means of transportation to work:
- Drove a car alone: 26,831 (74.7%)
- Carpooled: 3,692 (10.3%)
- Bus: 181 (0.5%)
- Taxicab, motorcycle, or other means: 355 (1.0%)
- Bicycle: 148 (0.4%)
- Walked: 667 (1.9%)
- Worked at home: 3,696 (10.3%)

- Health care and social assistance (15%)
- Retail trade (11%)
- Educational services (9%)
- Accommodation and food services (7%)
- Agriculture, forestry, fishing and hunting (5%)
- Transportation and warehousing (4%)
- Other services, except public administration (4%)
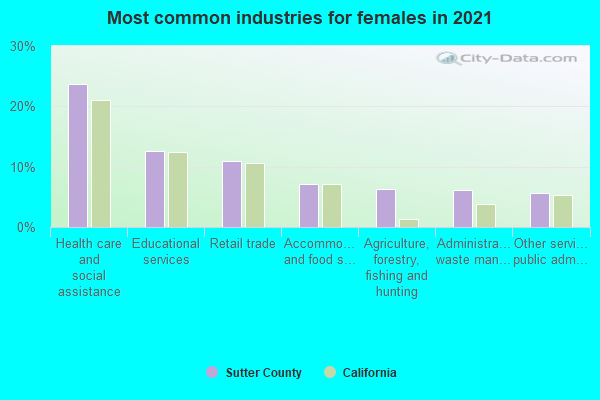
- Health care and social assistance (21%)
- Retail trade (15%)
- Educational services (13%)
- Accommodation and food services (9%)
- Agriculture, forestry, fishing and hunting (6%)
- Transportation and warehousing (6%)
- Other services, except public administration (6%)
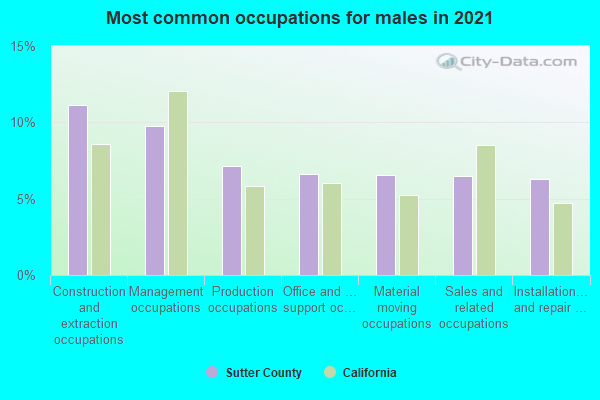
- Construction and extraction occupations (14%)
- Farming, fishing, and forestry occupations (11%)
- Management occupations (10%)
- Sales and related occupations (8%)
- Transportation occupations (8%)
- Installation, maintenance, and repair occupations (6%)
- Material moving occupations (6%)
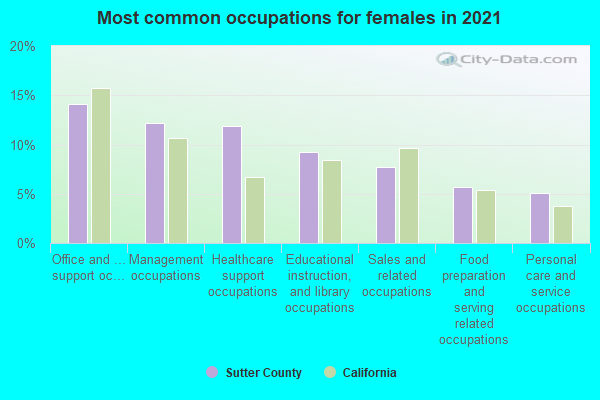
- Office and administrative support occupations (15%)
- Sales and related occupations (11%)
- Food preparation and serving related occupations (9%)
- Educational instruction, and library occupations (9%)
- Management occupations (9%)
- Healthcare support occupations (8%)
- Personal care and service occupations (7%)
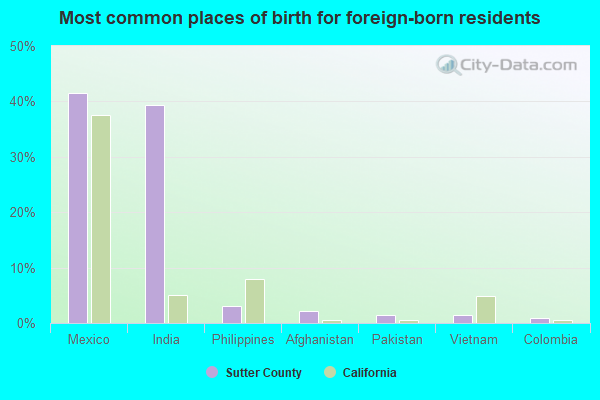
- Mexico (40%)
- India (38%)
- Afghanistan (3%)
- Pakistan (3%)
- Philippines (3%)
- Laos (2%)
- Vietnam (1%)
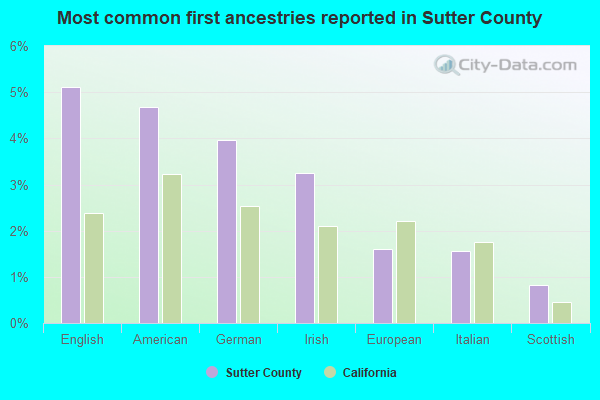
- English (5%)
- American (5%)
- German (3%)
- Irish (3%)
- Italian (2%)
- European (1%)
- Afghan (1%)
People in group quarters in Sutter County, California in 2010:
- 341 people in nursing facilities/skilled-nursing facilities
- 304 people in state prisons
- 195 people in local jails and other municipal confinement facilities
- 56 people in workers' group living quarters and job corps centers
- 53 people in other noninstitutional facilities
- 52 people in group homes intended for adults
- 39 people in residential treatment centers for adults
- 10 people in group homes for juveniles (non-correctional)
- 10 people in hospitals with patients who have no usual home elsewhere
People in group quarters in Sutter County, California in 2000:
- 536 people in nursing homes
- 252 people in local jails and other confinement facilities (including police lockups)
- 244 people in other noninstitutional group quarters
- 198 people in federal prisons and detention centers
- 55 people in agriculture workers' dormitories on farms
- 52 people in mental (psychiatric) hospitals or wards
- 33 people in other nonhousehold living situations
- 5 people in homes for the mentally retarded
- 4 people in other types of correctional institutions
- 2 people in other group homes
- 2 people in religious group quarters
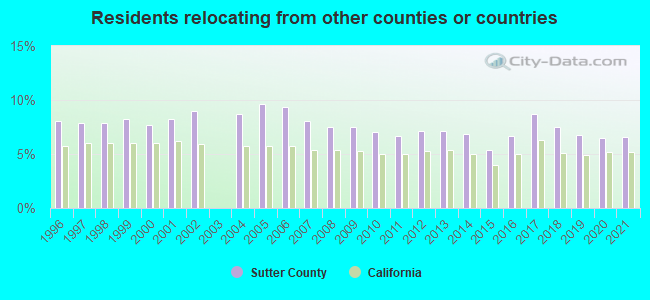
6.54% of this county's 2021 resident taxpayers lived in other counties in 2020 ($49,648 average adjusted gross income)
| Here: | 6.54% |
| California average: | 5.19% |
10 or fewer of this county's residents moved from foreign countries.
5.53% relocated from other counties in California ($43,156 average AGI)
1.01% relocated from other states ($6,492 average AGI)
Sutter County: 1.01% California average: 1.56%
Top counties from which taxpayers relocated into this county between 2020 and 2021:
| from Yuba County, CA | |
| from Sacramento County, CA | |
| from Butte County, CA | |
| from Placer County, CA | |
| from Yolo County, CA | |
| from Santa Clara County, CA | |
| from Alameda County, CA |
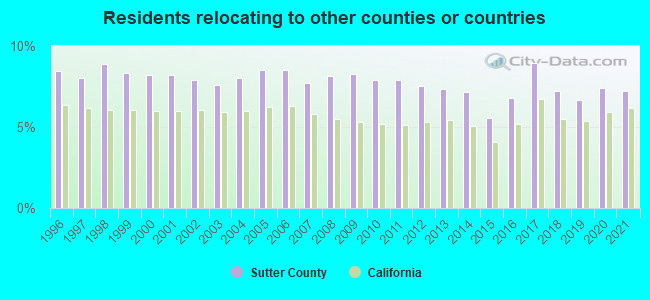
7.24% of this county's 2020 resident taxpayers moved to other counties in 2021 ($54,707 average adjusted gross income)
| Here: | 7.24% |
| California average: | 6.14% |
10 or fewer of this county's residents moved to foreign countries.
5.30% relocated to other counties in California ($38,693 average AGI)
1.94% relocated to other states ($16,013 average AGI)
Sutter County: 1.94% California average: 2.55%
Top counties to which taxpayers relocated from this county between 2020 and 2021:
| to Yuba County, CA | |
| to Sacramento County, CA | |
| to Butte County, CA | |
| to Placer County, CA | |
| to Yolo County, CA | |
| to San Joaquin County, CA | |
| to Nevada County, CA |
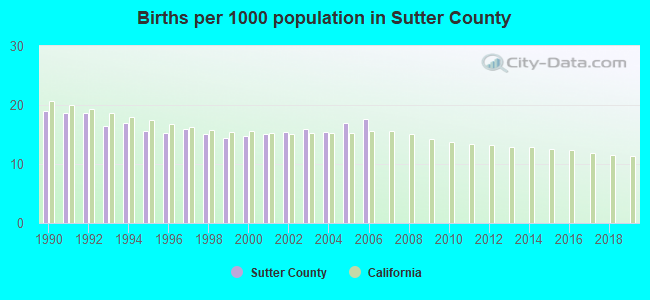
Births per 1000 population from 1990 to 1999: 16.6
Births per 1000 population from 2000 to 2006: 15.9
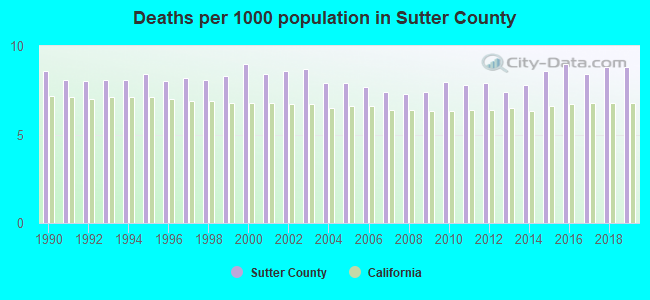
Deaths per 1000 population from 1990 to 1999: 8.2
Deaths per 1000 population from 2000 to 2009: 8.0
Deaths per 1000 population from 2010 to 2020: 8.4
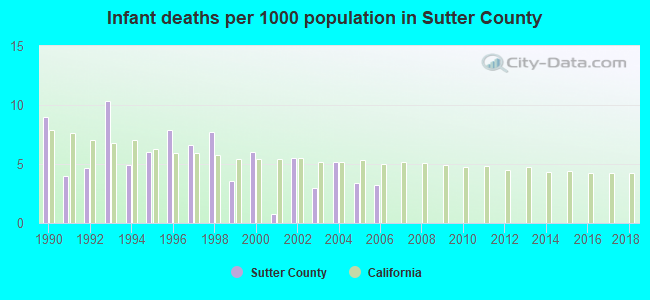
Infant deaths per 1000 live births from 1990 to 1999: 6.5
Infant deaths per 1000 live births from 2000 to 2006: 3.9
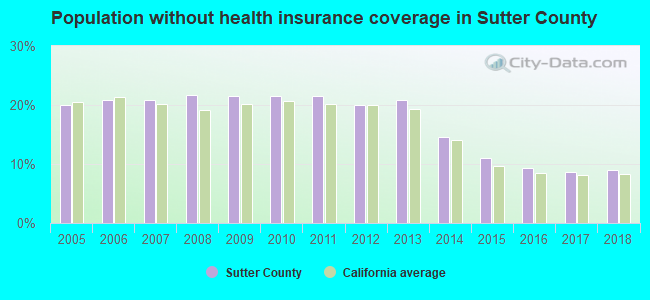
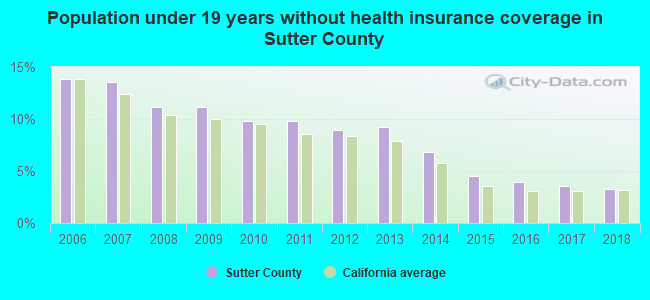
Persons under 19 years old without health insurance coverage in 2018: 3.3%
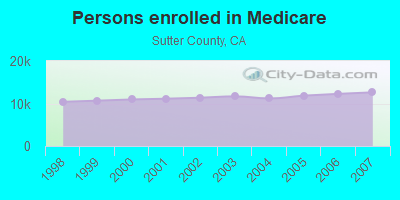
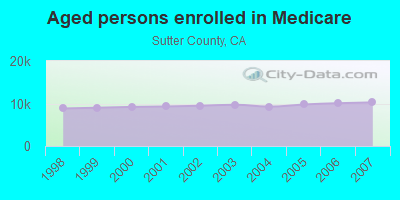
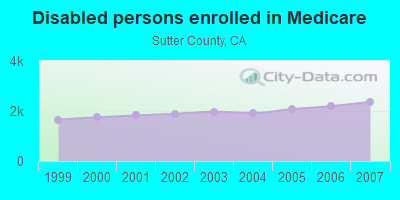
Persons enrolled in hospital insurance and/or supplemental medical insurance (Medicare) in July 1, 2007: 12,627 (10,264 aged, 2,363 disabled)
Children under 18 without health insurance coverage in 2007: 3,206 (13%)
Most common underlying causes of death in Sutter County, California in 1999 - 2019:
- Atherosclerotic heart disease (1,570)
- Bronchus or lung, unspecified - Malignant neoplasms (905)
- Acute myocardial infarction, unspecified (737)
- Chronic obstructive pulmonary disease, unspecified (701)
- Stroke, not specified as haemorrhage or infarction (496)
- Alzheimer disease, unspecified (424)
- Pneumonia, unspecified (378)
- Unspecified dementia (327)
- Atherosclerotic cardiovascular disease, so described (254)
- Congestive heart failure (209)
Population without health insurance coverage in 2000: 20%
Children under 18 without health insurance coverage in 2000: 16%
Homicides per 1,000,000 population from 2000 to 2006: 56.1. This is less than state average.
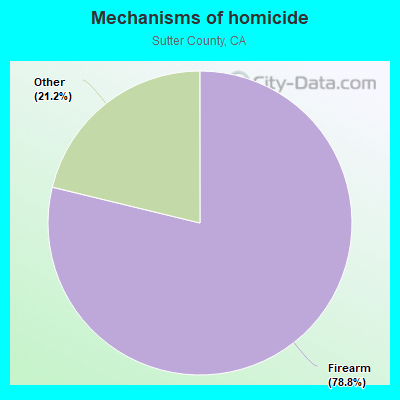
- Firearm - 44.2
- Other - 11.9
Suicides per 1,000,000 population from 2000 to 2006: 110.6. This is less than state average.
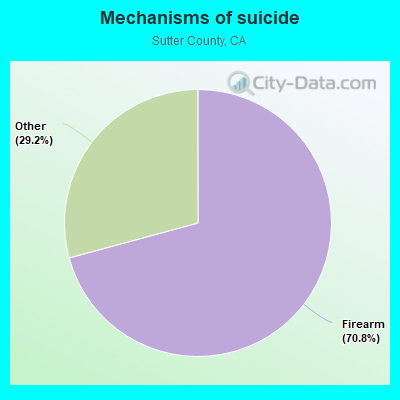
- Firearm - 78.3
- Other - 32.3
Household type by relationship:
Households: 98,503- Male householders: 16,807 (3,017 living alone), Female householders: 16,925 (5,357 living alone)
15,110 spouses (15,084 opposite-sex spouses), 1,716 unmarried partners, (1,696 opposite-sex unmarried partners), 29,473 children (28,023 natural, 634 adopted, 816 stepchildren), 3,848 grandchildren, 2,663 brothers or sisters, 2,743 parents, 268 foster children, 3,415 other relatives, 4,585 non-relatives
- In group quarters: 950
Size of family households: 10,270 2-persons, 4,446 3-persons, 3,274 4-persons, 2,772 5-persons, 1,896 6-persons, 995 7-or-more-persons.
Size of nonfamily households: 8,374 1-person, 910 2-persons, 529 3-persons, 266 4-persons.
11,781 married couples with children.
6,994 single-parent households (3,278 men, 3,716 women).
63.9% of residents of Sutter speak English at home.
19.8% of residents speak Spanish at home (59% speak English very well, 15% speak English well, 16% speak English not well, 10% don't speak English at all).
14.0% of residents speak other Indo-European language at home (50% speak English very well, 19% speak English well, 18% speak English not well, 13% don't speak English at all).
2.4% of residents speak Asian or Pacific Island language at home (43% speak English very well, 31% speak English well, 16% speak English not well, 10% don't speak English at all).
0.3% of residents speak other language at home (81% speak English very well, 18% speak English well, 1% speak English not well).
In fiscal year 2004:
Federal Government expenditure: $442,271,000 ($5,098 per capita)
Department of Defense expenditure: $26,657,000
Federal direct payments to individuals for retirement and disability: $209,367,000
Federal other direct payments to individuals: $90,474,000
Federal direct payments not to individuals: $37,967,000
Federal grants: $89,488,000
Federal procurement contracts: $3,309,000 ($0,000 Department of Defense)
Federal salaries and wages: $11,666,000 ($1,009,000 Department of Defense)
Federal Government direct loans: $8,600,000
Federal guaranteed/insured loans: $63,446,000
Federal Government insurance: $1,408,815,000
Population change from April 1, 2000 to July 1, 2005:
Births: 6,607| Here: | 74 per 1000 residents |
| State: | 77 per 1000 residents |
Deaths: 3,777
| Here: | 42 per 1000 residents |
| State: | 34 per 1000 residents |
Net international migration: +2,976
| Here: | +33 per 1000 residents |
| State: | +39 per 1000 residents |
Net internal migration: +4,261
| Here: | |
| State: |
Total withdrawal of fresh water for public supply: 15.75 millions of gallons per day (38% from ground, 62% from surface)
| Here: | 6.4 |
| State: | 6.0 |
| Here: | 5.0 |
| State: | 3.9 |
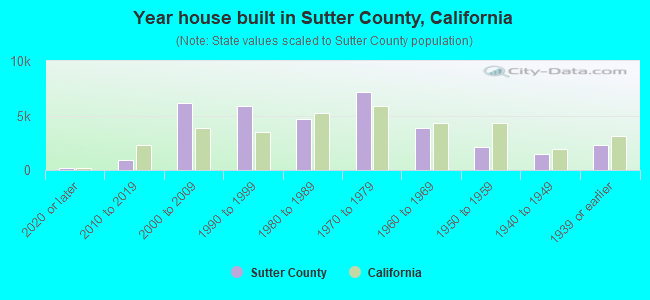
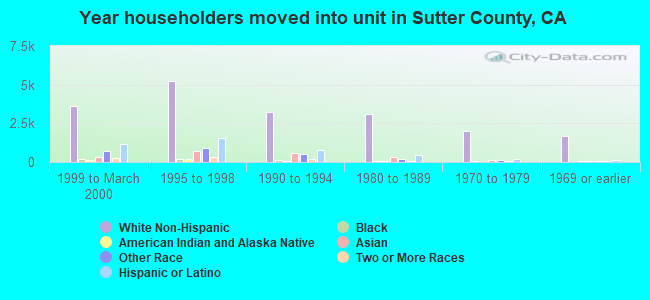
- Year house built in Sutter County, California
- 2232020 or later
- 1,5742010 to 2019
- 6,2872000 to 2009
- 5,4551990 to 1999
- 4,2561980 to 1989
- 5,2621970 to 1979
- 5,6641960 to 1969
- 2,7051950 to 1959
- 1,0401940 to 1949
- 2,3081939 or earlier
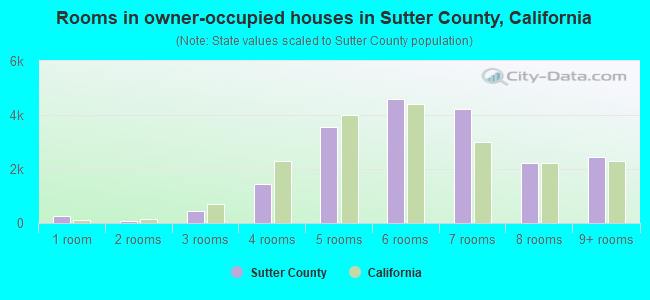
- Rooms in owner-occupied houses in Sutter County, California
- 2931 room
- 922 rooms
- 5593 rooms
- 2,0794 rooms
- 3,9405 rooms
- 3,6506 rooms
- 4,0527 rooms
- 2,1318 rooms
- 3,6119+ rooms
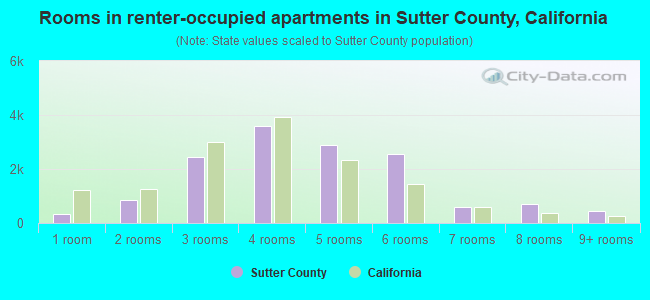
- Rooms in renter-occupied apartments in Sutter County, California
- 1101 room
- 6702 rooms
- 1,2733 rooms
- 3,2214 rooms
- 3,0485 rooms
- 2,5656 rooms
- 1,3767 rooms
- 7498 rooms
- 3139+ rooms
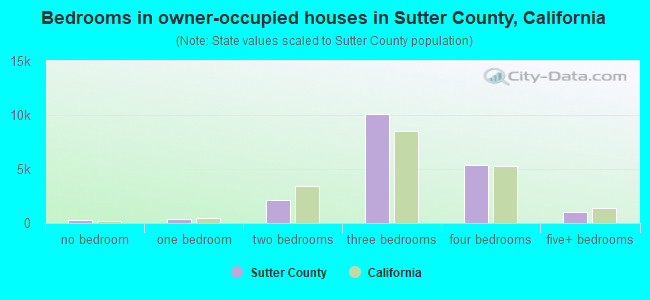
- Bedrooms in owner-occupied houses in Sutter County, California
- 293no bedroom
- 2011 bedroom
- 2,6302 bedrooms
- 10,8243 bedrooms
- 5,0634 bedrooms
- 1,3965+ bedrooms
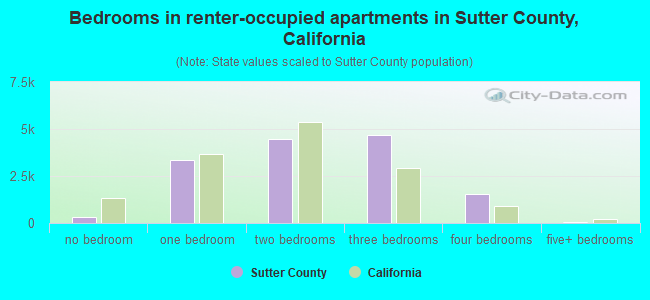
- Bedrooms in renter-occupied apartments in Sutter County, California
- 110no bedroom
- 2,5661 bedroom
- 3,5302 bedrooms
- 5,2403 bedrooms
- 1,5364 bedrooms
- 3435+ bedrooms
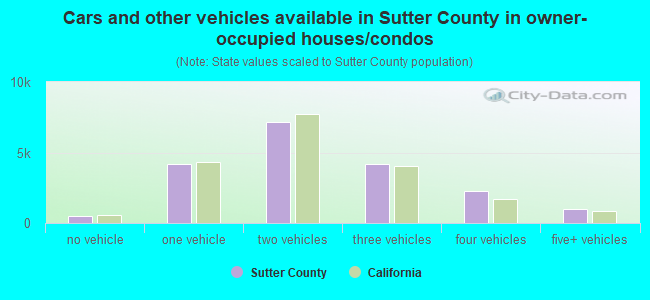
- Cars and other vehicles available in Sutter County in owner-occupied houses/condos
- 1,344no vehicle
- 4,0871 vehicle
- 7,8182 vehicles
- 4,4523 vehicles
- 1,0534 vehicles
- 1,6535+ vehicles
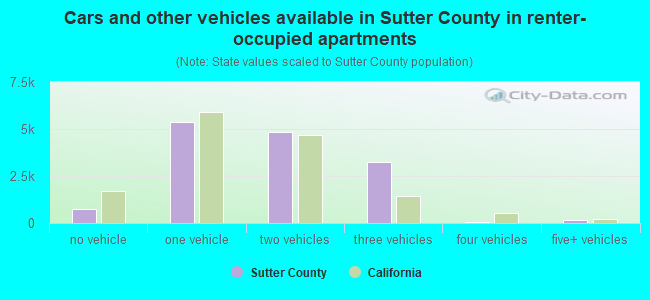
- Cars and other vehicles available in Sutter County in renter-occupied apartments
- 806no vehicle
- 4,5351 vehicle
- 5,6122 vehicles
- 1,7473 vehicles
- 4344 vehicles
- 1915+ vehicles
86.9% of Sutter County residents lived in the same house 1 years ago.
Out of people who lived in different houses, 32% lived in this county.
Out of people who lived in different counties, 86% lived in California.
| Sutter County: | 86.9% |
| State average: | 88.9% |
Place of birth for U.S.-born residents:
- This state: 63,690
- Other state: 12,548
- Northeast: 1,329
- Midwest: 3,939
- South: 4,154
- West: 3,126
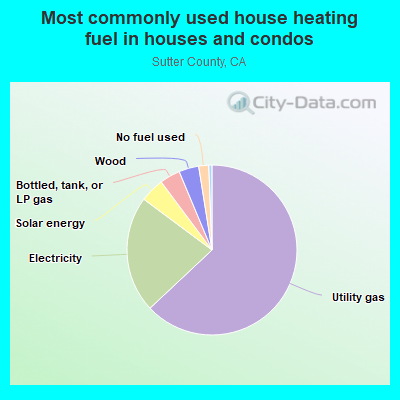
- 62.4%Utility gas
- 24.0%Electricity
- 5.4%Bottled, tank, or LP gas
- 3.3%No fuel used
- 2.5%Solar energy
- 1.6%Wood
- 0.8%Other fuel
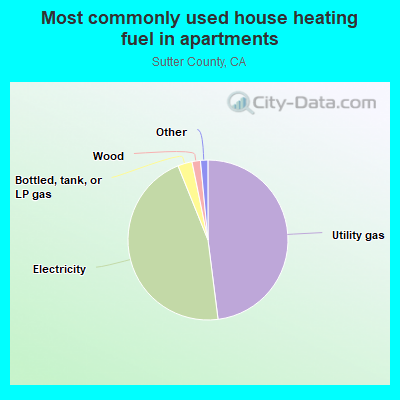
- 65.0%Utility gas
- 34.2%Electricity
- 0.4%Wood
- 0.4%Bottled, tank, or LP gas
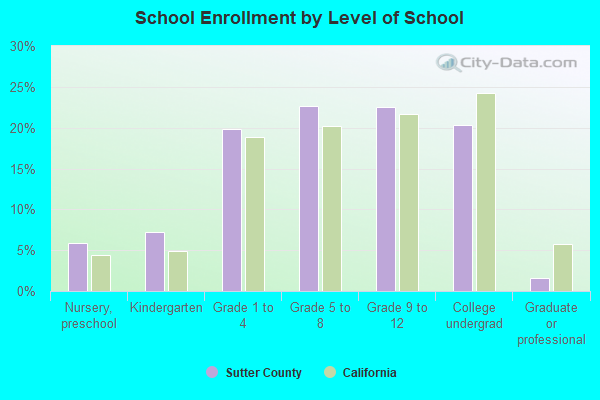
Private vs. public school enrollment:
| Here: | 5.1% |
| California: | 10.5% |
| Here: | 5.5% |
| California: | 8.5% |
| Here: | 22.7% |
| California: | 15.9% |
Sutter County government finances - Expenditure in 2020:
- Charges - Other: $28,010,000
Other: $10,618,000
Air Transportation: $6,142,000
Housing and Community Development: $5,015,000
Air Transportation: $4,833,000
Solid Waste Management: $3,774,000
Solid Waste Management: $3,562,000
Natural Resources - Other: $397,000
- Construction - Air Transportation: $21,603,000
Air Transportation: $8,633,000
General Public Buildings: $1,436,000
Regular Highways: $1,181,000
Parks and Recreation: $607,000
Health - Other: $344,000
Transit Utilities: $154,000
Natural Resources - Other: $80,000
Housing and Community Development: $29,000
- Current Operations - General - Other: $19,683,000
General - Other: $16,088,000
Transit Utilities: $9,787,000
Police Protection: $9,348,000
Transit Utilities: $9,007,000
Police Protection: $7,968,000
Health - Other: $7,458,000
Public Welfare - Other: $7,373,000
Regular Highways: $7,046,000
Health - Other: $6,855,000
Regular Highways: $6,826,000
Public Welfare - Other: $6,568,000
Housing and Community Development: $6,096,000
Central Staff Services: $5,026,000
Central Staff Services: $4,936,000
Financial Administration: $4,771,000
Air Transportation: $4,686,000
General Public Buildings: $4,675,000
Air Transportation: $4,432,000
General Public Buildings: $3,786,000
Correctional Institutions: $3,495,000
Solid Waste Management: $3,400,000
Correctional Institutions: $3,280,000
Financial Administration: $2,437,000
Solid Waste Management: $1,918,000
Parks and Recreation: $1,467,000
Natural Resources - Other: $1,384,000
Housing and Community Development: $1,336,000
Judicial and Legal Services: $1,297,000
Judicial and Legal Services: $924,000
Protective Inspection and Regulation - Other: $875,000
Parks and Recreation: $793,000
Protective Inspection and Regulation - Other: $776,000
- Federal Intergovernmental - Air Transportation: $17,712,000
Transit Utilities: $9,930,000
Air Transportation: $7,600,000
Other: $1,769,000
Other: $1,645,000
Transit Utilities: $1,540,000
Health and Hospitals: $628,000
Public Welfare: $585,000
Public Welfare: $529,000
Health and Hospitals: $509,000
Natural Resources: $56,000
Highways: $38,000
Highways: $23,000
Natural Resources: $7,000
- General - Interest on Debt: $850,000
Interest on Debt: $761,000
- Intergovernmental to Local - Other - Judicial and Legal Services: $1,957,000
Other - Judicial and Legal Services: $1,626,000
Other - Police Protection: $1,435,000
Other - Police Protection: $1,360,000
Other - Regular Highways: $1,156,000
Other - Regular Highways: $1,061,000
Other - General - Other: $1,047,000
- Intergovernmental to State - Solid Waste Management: $87,000
- Local Intergovernmental - Highways: $2,992,000
Highways: $2,392,000
Housing and Community Development: $450,000
Other: $434,000
Other: $154,000
Health and Hospitals: $33,000
Public Welfare: $5,000
- Long Term Debt - Outstanding Nonguaranteed - Industrial Revenue: $62,210,000
Beginning Outstanding - Public Debt for Private Purpose: $62,210,000
Beginning Outstanding - Public Debt for Private Purpose: $62,210,000
Outstanding Nonguaranteed - Industrial Revenue: $62,210,000
Outstanding Unspecified Public Purpose: $20,515,000
Beginning Outstanding - Unspecified Public Purpose: $17,225,000
Outstanding Unspecified Public Purpose: $15,210,000
Beginning Outstanding - Unspecified Public Purpose: $13,145,000
Issue, Unspecified Public Purpose: $8,310,000
Retired Unspecified Public Purpose: $2,015,000
Retired Unspecified Public Purpose: $940,000
- Miscellaneous - Donations From Private Sources: $4,469,000
Interest Earnings: $3,880,000
Rents: $3,413,000
Interest Earnings: $944,000
General Revenue - Other: $795,000
Sale of Property: $701,000
Donations From Private Sources: $684,000
Sale of Property: $644,000
Fines and Forfeits: $184,000
Fines and Forfeits: $180,000
Rents: $168,000
- Other Capital Outlay - General - Other: $17,550,000
Regular Highways: $4,357,000
General Public Building: $3,687,000
Parks and Recreation: $1,926,000
Transit Utilities: $1,583,000
Transit Utilities: $1,433,000
Financial Administration: $1,193,000
General Public Building: $712,000
Housing and Community Development: $172,000
Police Protection: $143,000
Police Protection: $100,000
General - Other: $100,000
Natural Resources - Other: $68,000
Regular Highways: $65,000
Solid Waste Management: $64,000
Health - Other: $50,000
Financial Administration: $50,000
Parks and Recreation: $22,000
Housing and Community Development: $15,000
- Other Funds - Cash and Securities: $114,621,000
Cash and Securities: $108,029,000
- Revenue - Transit Utilities: $2,320,000
Transit Utilities: $2,195,000
- Sinking Funds - Cash and Securities: $62,210,000
Cash and Securities: $62,210,000
- State Intergovernmental - Other: $3,535,000
Public Welfare: $2,809,000
Public Welfare: $2,712,000
Other: $2,039,000
General Local Government Support: $1,963,000
General Local Government Support: $1,854,000
Health and Hospitals: $1,154,000
Health and Hospitals: $1,150,000
Highways: $543,000
Highways: $527,000
Transit Utilities: $104,000
- Tax - General Sales and Gross Receipts: $30,772,000
Property: $26,232,000
Property: $24,974,000
General Sales and Gross Receipts: $22,564,000
Other License: $1,963,000
Other License: $1,957,000
Motor Vehicle License: $1,544,000
Alcoholic Beverage License: $25,000
Motor Vehicle License: $17,000
- Total Salaries and Wages: $53,726,000
: $38,560,000
Sutter County government finances - Revenue in 2020:
- Charges - Other: $28,010,000
Other: $10,618,000
Air Transportation: $6,142,000
Housing and Community Development: $5,015,000
Air Transportation: $4,833,000
Solid Waste Management: $3,774,000
Solid Waste Management: $3,562,000
Natural Resources - Other: $397,000
- Construction - Air Transportation: $21,603,000
Air Transportation: $8,633,000
General Public Buildings: $1,436,000
Regular Highways: $1,181,000
Parks and Recreation: $607,000
Health - Other: $344,000
Transit Utilities: $154,000
Natural Resources - Other: $80,000
Housing and Community Development: $29,000
- Current Operations - General - Other: $19,683,000
General - Other: $16,088,000
Transit Utilities: $9,787,000
Police Protection: $9,348,000
Transit Utilities: $9,007,000
Police Protection: $7,968,000
Health - Other: $7,458,000
Public Welfare - Other: $7,373,000
Regular Highways: $7,046,000
Health - Other: $6,855,000
Regular Highways: $6,826,000
Public Welfare - Other: $6,568,000
Housing and Community Development: $6,096,000
Central Staff Services: $5,026,000
Central Staff Services: $4,936,000
Financial Administration: $4,771,000
Air Transportation: $4,686,000
General Public Buildings: $4,675,000
Air Transportation: $4,432,000
General Public Buildings: $3,786,000
Correctional Institutions: $3,495,000
Solid Waste Management: $3,400,000
Correctional Institutions: $3,280,000
Financial Administration: $2,437,000
Solid Waste Management: $1,918,000
Parks and Recreation: $1,467,000
Natural Resources - Other: $1,384,000
Housing and Community Development: $1,336,000
Judicial and Legal Services: $1,297,000
Judicial and Legal Services: $924,000
Protective Inspection and Regulation - Other: $875,000
Parks and Recreation: $793,000
Protective Inspection and Regulation - Other: $776,000
- Federal Intergovernmental - Air Transportation: $17,712,000
Transit Utilities: $9,930,000
Air Transportation: $7,600,000
Other: $1,769,000
Other: $1,645,000
Transit Utilities: $1,540,000
Health and Hospitals: $628,000
Public Welfare: $585,000
Public Welfare: $529,000
Health and Hospitals: $509,000
Natural Resources: $56,000
Highways: $38,000
Highways: $23,000
Natural Resources: $7,000
- General - Interest on Debt: $850,000
Interest on Debt: $761,000
- Intergovernmental to Local - Other - Judicial and Legal Services: $1,957,000
Other - Judicial and Legal Services: $1,626,000
Other - Police Protection: $1,435,000
Other - Police Protection: $1,360,000
Other - Regular Highways: $1,156,000
Other - Regular Highways: $1,061,000
Other - General - Other: $1,047,000
- Intergovernmental to State - Solid Waste Management: $87,000
- Local Intergovernmental - Highways: $2,992,000
Highways: $2,392,000
Housing and Community Development: $450,000
Other: $434,000
Other: $154,000
Health and Hospitals: $33,000
Public Welfare: $5,000
- Long Term Debt - Outstanding Nonguaranteed - Industrial Revenue: $62,210,000
Beginning Outstanding - Public Debt for Private Purpose: $62,210,000
Beginning Outstanding - Public Debt for Private Purpose: $62,210,000
Outstanding Nonguaranteed - Industrial Revenue: $62,210,000
Outstanding Unspecified Public Purpose: $20,515,000
Beginning Outstanding - Unspecified Public Purpose: $17,225,000
Outstanding Unspecified Public Purpose: $15,210,000
Beginning Outstanding - Unspecified Public Purpose: $13,145,000
Issue, Unspecified Public Purpose: $8,310,000
Retired Unspecified Public Purpose: $2,015,000
Retired Unspecified Public Purpose: $940,000
- Miscellaneous - Donations From Private Sources: $4,469,000
Interest Earnings: $3,880,000
Rents: $3,413,000
Interest Earnings: $944,000
General Revenue - Other: $795,000
Sale of Property: $701,000
Donations From Private Sources: $684,000
Sale of Property: $644,000
Fines and Forfeits: $184,000
Fines and Forfeits: $180,000
Rents: $168,000
- Other Capital Outlay - General - Other: $17,550,000
Regular Highways: $4,357,000
General Public Building: $3,687,000
Parks and Recreation: $1,926,000
Transit Utilities: $1,583,000
Transit Utilities: $1,433,000
Financial Administration: $1,193,000
General Public Building: $712,000
Housing and Community Development: $172,000
Police Protection: $143,000
Police Protection: $100,000
General - Other: $100,000
Natural Resources - Other: $68,000
Regular Highways: $65,000
Solid Waste Management: $64,000
Health - Other: $50,000
Financial Administration: $50,000
Parks and Recreation: $22,000
Housing and Community Development: $15,000
- Other Funds - Cash and Securities: $114,621,000
Cash and Securities: $108,029,000
- Revenue - Transit Utilities: $2,320,000
Transit Utilities: $2,195,000
- Sinking Funds - Cash and Securities: $62,210,000
Cash and Securities: $62,210,000
- State Intergovernmental - Other: $3,535,000
Public Welfare: $2,809,000
Public Welfare: $2,712,000
Other: $2,039,000
General Local Government Support: $1,963,000
General Local Government Support: $1,854,000
Health and Hospitals: $1,154,000
Health and Hospitals: $1,150,000
Highways: $543,000
Highways: $527,000
Transit Utilities: $104,000
- Tax - General Sales and Gross Receipts: $30,772,000
Property: $26,232,000
Property: $24,974,000
General Sales and Gross Receipts: $22,564,000
Other License: $1,963,000
Other License: $1,957,000
Motor Vehicle License: $1,544,000
Alcoholic Beverage License: $25,000
Motor Vehicle License: $17,000
- Total Salaries and Wages: $53,726,000
: $38,560,000
Sutter County government finances - Debt in 2020:
- Charges - Other: $28,010,000
Other: $10,618,000
Air Transportation: $6,142,000
Housing and Community Development: $5,015,000
Air Transportation: $4,833,000
Solid Waste Management: $3,774,000
Solid Waste Management: $3,562,000
Natural Resources - Other: $397,000
- Construction - Air Transportation: $21,603,000
Air Transportation: $8,633,000
General Public Buildings: $1,436,000
Regular Highways: $1,181,000
Parks and Recreation: $607,000
Health - Other: $344,000
Transit Utilities: $154,000
Natural Resources - Other: $80,000
Housing and Community Development: $29,000
- Current Operations - General - Other: $19,683,000
General - Other: $16,088,000
Transit Utilities: $9,787,000
Police Protection: $9,348,000
Transit Utilities: $9,007,000
Police Protection: $7,968,000
Health - Other: $7,458,000
Public Welfare - Other: $7,373,000
Regular Highways: $7,046,000
Health - Other: $6,855,000
Regular Highways: $6,826,000
Public Welfare - Other: $6,568,000
Housing and Community Development: $6,096,000
Central Staff Services: $5,026,000
Central Staff Services: $4,936,000
Financial Administration: $4,771,000
Air Transportation: $4,686,000
General Public Buildings: $4,675,000
Air Transportation: $4,432,000
General Public Buildings: $3,786,000
Correctional Institutions: $3,495,000
Solid Waste Management: $3,400,000
Correctional Institutions: $3,280,000
Financial Administration: $2,437,000
Solid Waste Management: $1,918,000
Parks and Recreation: $1,467,000
Natural Resources - Other: $1,384,000
Housing and Community Development: $1,336,000
Judicial and Legal Services: $1,297,000
Judicial and Legal Services: $924,000
Protective Inspection and Regulation - Other: $875,000
Parks and Recreation: $793,000
Protective Inspection and Regulation - Other: $776,000
- Federal Intergovernmental - Air Transportation: $17,712,000
Transit Utilities: $9,930,000
Air Transportation: $7,600,000
Other: $1,769,000
Other: $1,645,000
Transit Utilities: $1,540,000
Health and Hospitals: $628,000
Public Welfare: $585,000
Public Welfare: $529,000
Health and Hospitals: $509,000
Natural Resources: $56,000
Highways: $38,000
Highways: $23,000
Natural Resources: $7,000
- General - Interest on Debt: $850,000
Interest on Debt: $761,000
- Intergovernmental to Local - Other - Judicial and Legal Services: $1,957,000
Other - Judicial and Legal Services: $1,626,000
Other - Police Protection: $1,435,000
Other - Police Protection: $1,360,000
Other - Regular Highways: $1,156,000
Other - Regular Highways: $1,061,000
Other - General - Other: $1,047,000
- Intergovernmental to State - Solid Waste Management: $87,000
- Local Intergovernmental - Highways: $2,992,000
Highways: $2,392,000
Housing and Community Development: $450,000
Other: $434,000
Other: $154,000
Health and Hospitals: $33,000
Public Welfare: $5,000
- Long Term Debt - Outstanding Nonguaranteed - Industrial Revenue: $62,210,000
Beginning Outstanding - Public Debt for Private Purpose: $62,210,000
Beginning Outstanding - Public Debt for Private Purpose: $62,210,000
Outstanding Nonguaranteed - Industrial Revenue: $62,210,000
Outstanding Unspecified Public Purpose: $20,515,000
Beginning Outstanding - Unspecified Public Purpose: $17,225,000
Outstanding Unspecified Public Purpose: $15,210,000
Beginning Outstanding - Unspecified Public Purpose: $13,145,000
Issue, Unspecified Public Purpose: $8,310,000
Retired Unspecified Public Purpose: $2,015,000
Retired Unspecified Public Purpose: $940,000
- Miscellaneous - Donations From Private Sources: $4,469,000
Interest Earnings: $3,880,000
Rents: $3,413,000
Interest Earnings: $944,000
General Revenue - Other: $795,000
Sale of Property: $701,000
Donations From Private Sources: $684,000
Sale of Property: $644,000
Fines and Forfeits: $184,000
Fines and Forfeits: $180,000
Rents: $168,000
- Other Capital Outlay - General - Other: $17,550,000
Regular Highways: $4,357,000
General Public Building: $3,687,000
Parks and Recreation: $1,926,000
Transit Utilities: $1,583,000
Transit Utilities: $1,433,000
Financial Administration: $1,193,000
General Public Building: $712,000
Housing and Community Development: $172,000
Police Protection: $143,000
Police Protection: $100,000
General - Other: $100,000
Natural Resources - Other: $68,000
Regular Highways: $65,000
Solid Waste Management: $64,000
Health - Other: $50,000
Financial Administration: $50,000
Parks and Recreation: $22,000
Housing and Community Development: $15,000
- Other Funds - Cash and Securities: $114,621,000
Cash and Securities: $108,029,000
- Revenue - Transit Utilities: $2,320,000
Transit Utilities: $2,195,000
- Sinking Funds - Cash and Securities: $62,210,000
Cash and Securities: $62,210,000
- State Intergovernmental - Other: $3,535,000
Public Welfare: $2,809,000
Public Welfare: $2,712,000
Other: $2,039,000
General Local Government Support: $1,963,000
General Local Government Support: $1,854,000
Health and Hospitals: $1,154,000
Health and Hospitals: $1,150,000
Highways: $543,000
Highways: $527,000
Transit Utilities: $104,000
- Tax - General Sales and Gross Receipts: $30,772,000
Property: $26,232,000
Property: $24,974,000
General Sales and Gross Receipts: $22,564,000
Other License: $1,963,000
Other License: $1,957,000
Motor Vehicle License: $1,544,000
Alcoholic Beverage License: $25,000
Motor Vehicle License: $17,000
- Total Salaries and Wages: $53,726,000
: $38,560,000
Sutter County government finances - Cash and Securities in 2020:
- Charges - Other: $28,010,000
Other: $10,618,000
Air Transportation: $6,142,000
Housing and Community Development: $5,015,000
Air Transportation: $4,833,000
Solid Waste Management: $3,774,000
Solid Waste Management: $3,562,000
Natural Resources - Other: $397,000
- Construction - Air Transportation: $21,603,000
Air Transportation: $8,633,000
General Public Buildings: $1,436,000
Regular Highways: $1,181,000
Parks and Recreation: $607,000
Health - Other: $344,000
Transit Utilities: $154,000
Natural Resources - Other: $80,000
Housing and Community Development: $29,000
- Current Operations - General - Other: $19,683,000
General - Other: $16,088,000
Transit Utilities: $9,787,000
Police Protection: $9,348,000
Transit Utilities: $9,007,000
Police Protection: $7,968,000
Health - Other: $7,458,000
Public Welfare - Other: $7,373,000
Regular Highways: $7,046,000
Health - Other: $6,855,000
Regular Highways: $6,826,000
Public Welfare - Other: $6,568,000
Housing and Community Development: $6,096,000
Central Staff Services: $5,026,000
Central Staff Services: $4,936,000
Financial Administration: $4,771,000
Air Transportation: $4,686,000
General Public Buildings: $4,675,000
Air Transportation: $4,432,000
General Public Buildings: $3,786,000
Correctional Institutions: $3,495,000
Solid Waste Management: $3,400,000
Correctional Institutions: $3,280,000
Financial Administration: $2,437,000
Solid Waste Management: $1,918,000
Parks and Recreation: $1,467,000
Natural Resources - Other: $1,384,000
Housing and Community Development: $1,336,000
Judicial and Legal Services: $1,297,000
Judicial and Legal Services: $924,000
Protective Inspection and Regulation - Other: $875,000
Parks and Recreation: $793,000
Protective Inspection and Regulation - Other: $776,000
- Federal Intergovernmental - Air Transportation: $17,712,000
Transit Utilities: $9,930,000
Air Transportation: $7,600,000
Other: $1,769,000
Other: $1,645,000
Transit Utilities: $1,540,000
Health and Hospitals: $628,000
Public Welfare: $585,000
Public Welfare: $529,000
Health and Hospitals: $509,000
Natural Resources: $56,000
Highways: $38,000
Highways: $23,000
Natural Resources: $7,000
- General - Interest on Debt: $850,000
Interest on Debt: $761,000
- Intergovernmental to Local - Other - Judicial and Legal Services: $1,957,000
Other - Judicial and Legal Services: $1,626,000
Other - Police Protection: $1,435,000
Other - Police Protection: $1,360,000
Other - Regular Highways: $1,156,000
Other - Regular Highways: $1,061,000
Other - General - Other: $1,047,000
- Intergovernmental to State - Solid Waste Management: $87,000
- Local Intergovernmental - Highways: $2,992,000
Highways: $2,392,000
Housing and Community Development: $450,000
Other: $434,000
Other: $154,000
Health and Hospitals: $33,000
Public Welfare: $5,000
- Long Term Debt - Outstanding Nonguaranteed - Industrial Revenue: $62,210,000
Beginning Outstanding - Public Debt for Private Purpose: $62,210,000
Beginning Outstanding - Public Debt for Private Purpose: $62,210,000
Outstanding Nonguaranteed - Industrial Revenue: $62,210,000
Outstanding Unspecified Public Purpose: $20,515,000
Beginning Outstanding - Unspecified Public Purpose: $17,225,000
Outstanding Unspecified Public Purpose: $15,210,000
Beginning Outstanding - Unspecified Public Purpose: $13,145,000
Issue, Unspecified Public Purpose: $8,310,000
Retired Unspecified Public Purpose: $2,015,000
Retired Unspecified Public Purpose: $940,000
- Miscellaneous - Donations From Private Sources: $4,469,000
Interest Earnings: $3,880,000
Rents: $3,413,000
Interest Earnings: $944,000
General Revenue - Other: $795,000
Sale of Property: $701,000
Donations From Private Sources: $684,000
Sale of Property: $644,000
Fines and Forfeits: $184,000
Fines and Forfeits: $180,000
Rents: $168,000
- Other Capital Outlay - General - Other: $17,550,000
Regular Highways: $4,357,000
General Public Building: $3,687,000
Parks and Recreation: $1,926,000
Transit Utilities: $1,583,000
Transit Utilities: $1,433,000
Financial Administration: $1,193,000
General Public Building: $712,000
Housing and Community Development: $172,000
Police Protection: $143,000
Police Protection: $100,000
General - Other: $100,000
Natural Resources - Other: $68,000
Regular Highways: $65,000
Solid Waste Management: $64,000
Health - Other: $50,000
Financial Administration: $50,000
Parks and Recreation: $22,000
Housing and Community Development: $15,000
- Other Funds - Cash and Securities: $114,621,000
Cash and Securities: $108,029,000
- Revenue - Transit Utilities: $2,320,000
Transit Utilities: $2,195,000
- Sinking Funds - Cash and Securities: $62,210,000
Cash and Securities: $62,210,000
- State Intergovernmental - Other: $3,535,000
Public Welfare: $2,809,000
Public Welfare: $2,712,000
Other: $2,039,000
General Local Government Support: $1,963,000
General Local Government Support: $1,854,000
Health and Hospitals: $1,154,000
Health and Hospitals: $1,150,000
Highways: $543,000
Highways: $527,000
Transit Utilities: $104,000
- Tax - General Sales and Gross Receipts: $30,772,000
Property: $26,232,000
Property: $24,974,000
General Sales and Gross Receipts: $22,564,000
Other License: $1,963,000
Other License: $1,957,000
Motor Vehicle License: $1,544,000
Alcoholic Beverage License: $25,000
Motor Vehicle License: $17,000
- Total Salaries and Wages: $53,726,000
: $38,560,000
Supplemental Security Income (SSI) in 2006:
- Total number of recipients: 3,523
- Number of aged recipients: 927
- Number of blind and disabled recipients: 2,596
- Number of recipients under 18: 259
- Number of recipients between 18 and 64: 1,832
- Number of recipients older than 64: 1,432
- Number of recipients also receiving OASDI: 1,858
- Amount of payments (thousands of dollars): 1,895
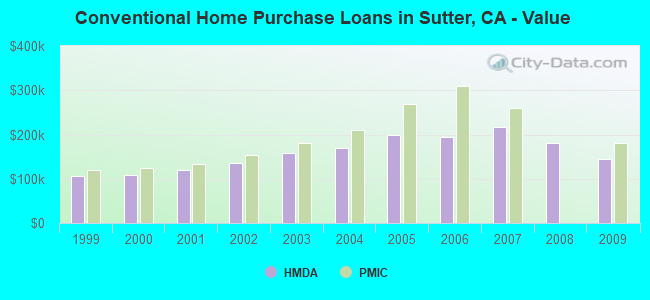
| Home Mortgage Disclosure Act Aggregated Statistics For Year 2009 (Based on 18 full tracts) | ||||||||||||||
| A) FHA, FSA/RHS & VA Home Purchase Loans | B) Conventional Home Purchase Loans | C) Refinancings | D) Home Improvement Loans | E) Loans on Dwellings For 5+ Families | F) Non-occupant Loans on < 5 Family Dwellings (A B C & D) | G) Loans On Manufactured Home Dwelling (A B C & D) | ||||||||
|---|---|---|---|---|---|---|---|---|---|---|---|---|---|---|
| Number | Average Value | Number | Average Value | Number | Average Value | Number | Average Value | Number | Average Value | Number | Average Value | Number | Average Value | |
| LOANS ORIGINATED | 496 | $170,095 | 374 | $144,350 | 815 | $180,753 | 46 | $115,174 | 1 | $310,000 | 153 | $111,359 | 8 | $168,375 |
| APPLICATIONS APPROVED, NOT ACCEPTED | 28 | $180,179 | 35 | $180,743 | 85 | $198,682 | 8 | $42,250 | 0 | $0 | 12 | $116,167 | 2 | $186,500 |
| APPLICATIONS DENIED | 72 | $169,736 | 92 | $164,957 | 412 | $203,796 | 40 | $78,825 | 2 | $1,700,000 | 51 | $128,392 | 7 | $139,571 |
| APPLICATIONS WITHDRAWN | 72 | $187,708 | 61 | $161,803 | 259 | $193,807 | 15 | $95,133 | 0 | $0 | 39 | $128,000 | 2 | $121,000 |
| FILES CLOSED FOR INCOMPLETENESS | 12 | $179,667 | 13 | $176,154 | 72 | $199,056 | 8 | $165,750 | 0 | $0 | 5 | $123,600 | 1 | $262,000 |
| Private Mortgage Insurance Companies Aggregated Statistics For Year 2009 (Based on 15 full tracts) | ||||
| A) Conventional Home Purchase Loans | B) Refinancings | |||
|---|---|---|---|---|
| Number | Average Value | Number | Average Value | |
| LOANS ORIGINATED | 56 | $180,411 | 7 | $210,429 |
| APPLICATIONS APPROVED, NOT ACCEPTED | 22 | $200,136 | 10 | $245,000 |
| APPLICATIONS DENIED | 13 | $215,231 | 2 | $301,000 |
| APPLICATIONS WITHDRAWN | 1 | $160,000 | 3 | $267,667 |
| FILES CLOSED FOR INCOMPLETENESS | 1 | $219,000 | 0 | $0 |
| Most common first names in Sutter County, CA among deceased individuals | ||
| Name | Count | Lived (average) |
|---|---|---|
| John | 342 | 75.4 years |
| William | 271 | 75.8 years |
| Robert | 261 | 70.7 years |
| James | 260 | 71.1 years |
| Mary | 260 | 79.8 years |
| Charles | 209 | 74.3 years |
| George | 188 | 76.6 years |
| Frank | 116 | 77.2 years |
| Dorothy | 116 | 78.1 years |
| Richard | 112 | 66.2 years |
| Most common last names in Sutter County, CA among deceased individuals | ||
| Last name | Count | Lived (average) |
|---|---|---|
| Smith | 160 | 74.8 years |
| Johnson | 142 | 77.1 years |
| Singh | 117 | 75.5 years |
| Williams | 92 | 74.3 years |
| Davis | 85 | 72.7 years |
| Brown | 82 | 75.6 years |
| Jones | 76 | 73.6 years |
| Kaur | 62 | 77.7 years |
| Thompson | 53 | 73.8 years |
| Clark | 52 | 78.7 years |
| Businesses in Sutter County, CA | ||||
| Name | Count | Name | Count | |
|---|---|---|---|---|
| 7-Eleven | 5 | Kohl's | 1 | |
| 99 Cents Only Stores | 1 | Kroger | 5 | |
| AT&T | 2 | La-Z-Boy | 1 | |
| American Eagle Outfitters | 1 | Lane Furniture | 3 | |
| Applebee's | 1 | Little Caesars Pizza | 2 | |
| AutoZone | 1 | Long John Silver's | 1 | |
| Baskin-Robbins | 1 | Lowe's | 1 | |
| Bath & Body Works | 1 | Marshalls | 1 | |
| Bed Bath & Beyond | 1 | Mazda | 1 | |
| Best Western | 1 | McDonald's | 4 | |
| Blockbuster | 1 | New Balance | 1 | |
| Burger King | 2 | Nike | 6 | |
| CVS | 1 | Office Depot | 1 | |
| Carl\s Jr. | 2 | Pac Sun | 1 | |
| Chevrolet | 1 | Payless | 3 | |
| Chipotle | 1 | Penske | 1 | |
| Circle K | 2 | PetSmart | 1 | |
| Curves | 1 | Pier 1 Imports | 1 | |
| DHL | 2 | Pizza Hut | 1 | |
| Dairy Queen | 1 | Quality | 1 | |
| Days Inn | 1 | Quiznos | 2 | |
| Domino's Pizza | 1 | RadioShack | 2 | |
| Econo Lodge | 1 | Red Robin | 1 | |
| Famous Footwear | 1 | Rite Aid | 1 | |
| Fashion Bug | 1 | Rue21 | 1 | |
| FedEx | 7 | SONIC Drive-In | 1 | |
| Finish Line | 1 | Sam's Club | 1 | |
| Foot Locker | 1 | Sears | 2 | |
| Ford | 1 | Spencer Gifts | 1 | |
| Forever 21 | 1 | Sprint Nextel | 2 | |
| GNC | 1 | Staples | 1 | |
| GameStop | 2 | Starbucks | 6 | |
| Goodwill | 8 | Subway | 4 | |
| H&R Block | 1 | T-Mobile | 4 | |
| Hilton | 1 | Taco Bell | 2 | |
| Home Depot | 1 | Target | 1 | |
| HomeTown Buffet | 1 | Toyota | 1 | |
| Honda | 1 | Toys"R"Us | 1 | |
| Hot Topic | 1 | True Value | 2 | |
| IHOP | 1 | U-Haul | 2 | |
| JCPenney | 1 | UPS | 12 | |
| Jamba Juice | 1 | Vans | 2 | |
| Jones New York | 2 | Verizon Wireless | 2 | |
| Journeys | 1 | Walgreens | 3 | |
| KFC | 1 | Walmart | 1 | |
| Kmart | 1 | Wendy's | 1 | |
Sutter County on our top lists:
- #3 on the list of "Top 101 counties with the highest Ozone (1-hour) air pollution readings in 2012 (ppm)"
- #34 on the list of "Top 101 counties with the highest Nitrogen Dioxide air pollution readings in 2012 (ppm)"
- #64 on the list of "Top 101 counties with the largest number of people moving out compared to moving in (pop. 50,000+)"
- #66 on the list of "Top 101 counties with the largest decrease in the number of deaths per 1000 residents 2000-2006 to 2007-2013 (pop. 50,000+)"
- #92 on the list of "Top 101 counties with the lowest Particulate Matter (PM2.5) Annual air pollution readings in 2012 (µg/m3)"
- #94 on the list of "Top 101 counties with the highest percentage of residents relocating from foreign countries between 2010 and 2011 (pop. 50,000+)"