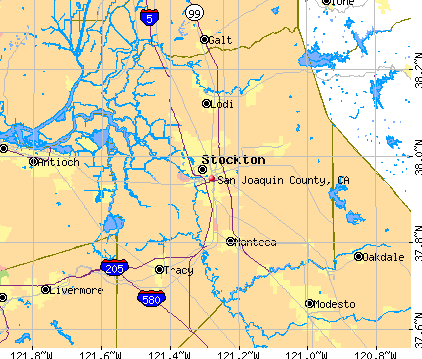
San Joaquin County, California (CA)
County owner-occupied free and clear houses and condos in 2010: 27,256
County owner-occupied houses and condos in 2000: 109,671
Renter-occupied apartments: 87,737 (it was 71,958 in 2000)
| % of renters here: | 40% |
| State: | 44% |
Land area: 1399 sq. mi.
Water area: 27.0 sq. mi.
Population density: 567 people per square mile (high).
Industries providing employment: Educational, health and social services (19.9%), Retail trade (12.0%), Professional, scientific, management, administrative, and waste management services (10.7%), Manufacturing (10.4%).
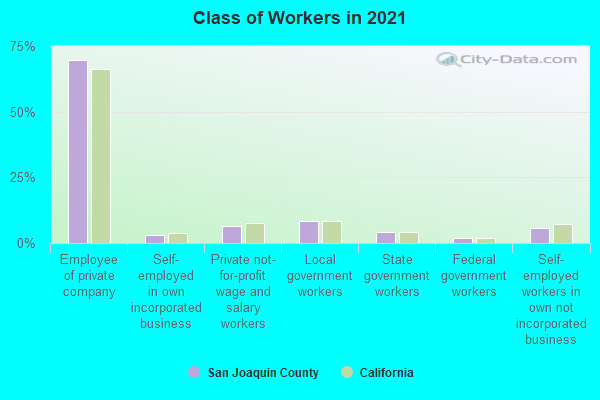
Type of workers:
- Private wage or salary: 80%
- Government: 14%
- Self-employed, not incorporated: 7%
- Unpaid family work: 0%
- OSM Map
- General Map
- Google Map
- MSN Map

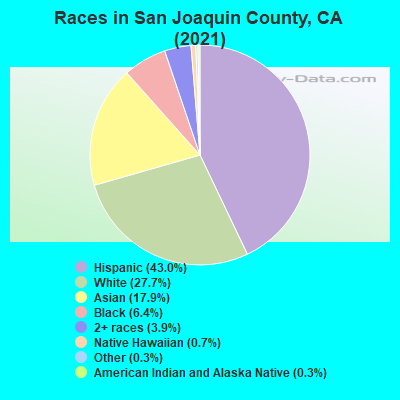
- 341,75443.1%Hispanic or Latino
- 209,60226.4%White Non-Hispanic Alone
- 145,02818.3%Asian alone
- 56,2817.1%Black Non-Hispanic Alone
- 29,2923.7%Two or more races
- 5,7730.7%Some other race alone
- 3,3100.4%Native Hawaiian and Other
Pacific Islander alone - 2,1890.3%American Indian and Alaska Native alone
| Median resident age: | 35.2 years |
| California median age: | 37.9 years |
| Males: 397,943 | |
| Females: 395,286 |

 | Coronavirus (12544 replies) |
| Hey California stop the mask madness.... (1058 replies) |
| California RECALL Megathread! (1307 replies) |
| Growth of Afghan communities in California (81 replies) |
| April 2021: CA Median Home Price Soars to $813,980; Sales Climb 65.1% Year-Over-Year (81 replies) |
| Can we get a Central Valley Bakersfield-Fresno-Stockton forum in this joint? (62 replies) |
| San Joaquin County: | 3.0 people |
| California: | 3 people |
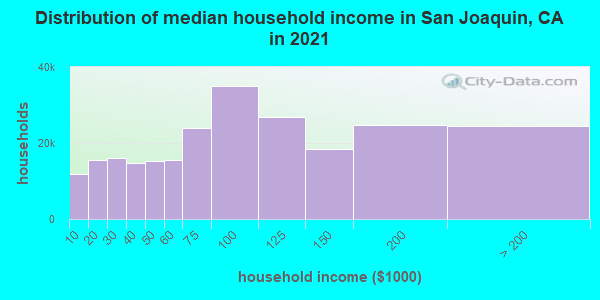
Estimated median household income in 2022: $86,056 ($41,282 in 1999)
| This county: | $86,056 |
| California: | $91,551 |
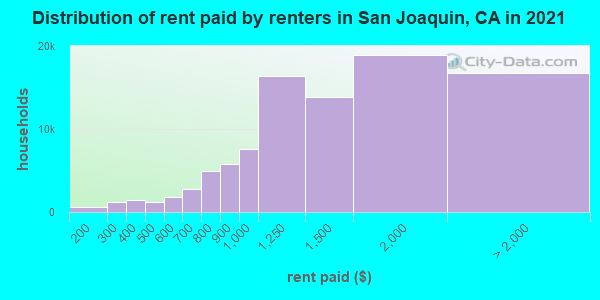
Median contract rent in 2022 for apartments: $1,330 (lower quartile is $972, upper quartile is $1,806)
| This county: | $1330 |
| State: | $1719 |
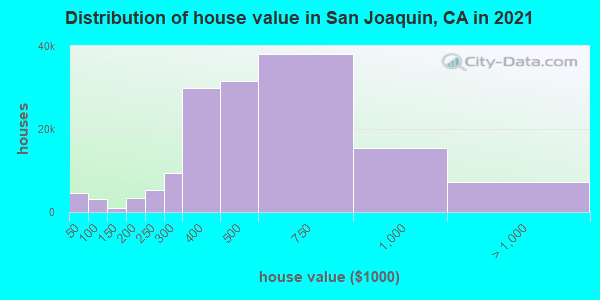
Estimated median house or condo value in 2022: $535,800 (it was $139,800 in 2000)
| San Joaquin: | $535,800 |
| California: | $715,900 |
Mean price in 2022:
Median monthly housing costs for homes and condos with a mortgage: $2,234Detached houses: $579,147
Here: $579,147 State: $988,808 Townhouses or other attached units: $413,977
Here: $413,977 State: $838,546 In 2-unit structures: $846,717
Here: $846,717 State: $1,138,100 In 3-to-4-unit structures: $323,925
Here: $323,925 State: $824,253 In 5-or-more-unit structures: $223,694
Here: $223,694 State: $730,996 Mobile homes: $155,998
Here: $155,998 State: $184,506 Occupied boats, RVs, vans, etc.: $9,512
Here: $9,512 State: $204,957
Median monthly housing costs for units without a mortgage: $677
Institutionalized population: 8,828
Crime in 2020 (reported by the sheriff's office or county police, not the county total):
- Murders: 16
- Rapes: 18
- Robberies: 150
- Assaults: 638
- Burglaries: 600
- Thefts: 1880
- Auto thefts: 172
Crime in 2019 (reported by the sheriff's office or county police, not the county total):
- Murders: 5
- Rapes: 35
- Robberies: 162
- Assaults: 701
- Burglaries: 719
- Thefts: 1589
- Auto thefts: 131
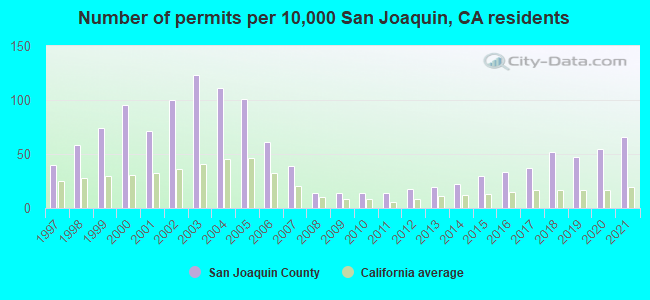
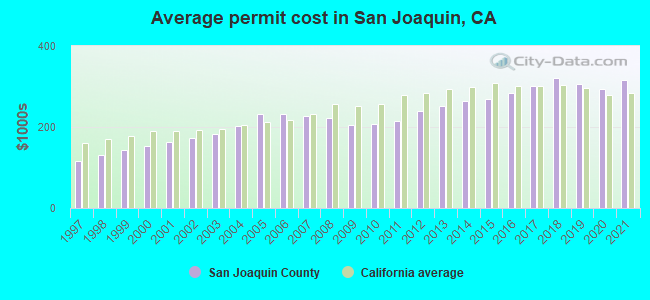
Single-family new house construction building permits:
- 2022: 3163 buildings, average cost: $353,600
- 2021: 3718 buildings, average cost: $316,100
- 2020: 3086 buildings, average cost: $293,500
- 2019: 2628 buildings, average cost: $307,100
- 2018: 2920 buildings, average cost: $322,300
- 2017: 2107 buildings, average cost: $300,500
- 2016: 1862 buildings, average cost: $284,600
- 2015: 1708 buildings, average cost: $269,500
- 2014: 1245 buildings, average cost: $262,700
- 2013: 1062 buildings, average cost: $251,300
- 2012: 1006 buildings, average cost: $239,200
- 2011: 781 buildings, average cost: $214,100
- 2010: 801 buildings, average cost: $206,600
- 2009: 792 buildings, average cost: $206,100
- 2008: 765 buildings, average cost: $222,500
- 2007: 2201 buildings, average cost: $226,800
- 2006: 3461 buildings, average cost: $232,400
- 2005: 5684 buildings, average cost: $231,100
- 2004: 6229 buildings, average cost: $201,900
- 2003: 6935 buildings, average cost: $182,600
- 2002: 5654 buildings, average cost: $172,100
- 2001: 4005 buildings, average cost: $163,500
- 2000: 5350 buildings, average cost: $154,200
- 1999: 4189 buildings, average cost: $141,800
- 1998: 3275 buildings, average cost: $131,700
- 1997: 2229 buildings, average cost: $115,400
Median real estate property taxes paid for housing units with mortgages in 2022: $4,048 (0.7%)
Median real estate property taxes paid for housing units with no mortgage in 2022: $3,043 (0.6%)
| San Joaquin County: | 12.1% |
| California: | 12.2% |
Median age of residents in 2022: 35.2 years old
(Males: 34.5 years old, Females: 36.2 years old)
(Median age for: White residents: 46.8 years old, Black residents: 33.6 years old, American Indian residents: 38.0 years old, Asian residents: 36.2 years old, Hispanic or Latino residents: 28.7 years old, Other race residents: 30.6 years old)
Area name: Stockton, CA MSA
Fair market rent in 2006 for a 1-bedroom apartment in San Joaquin County is $686 a month.
Fair market rent for a 2-bedroom apartment is $846 a month.
Fair market rent for a 3-bedroom apartment is $1162 a month.
Cities in this county include: Stockton, Lodi, Tracy, Manteca, Lathrop, Ripon, Garden Acres, Mountain House, Country Club, August.
| Zip code | City | Number of tests | Number of tests >= 4 pCi/L |
|---|---|---|---|
| 95204 | Stockton | 10 | 0 |
| 95205 | Stockton | 8 | 1 |
| 95206 | Stockton | 5 | 0 |
| 95207 | Stockton | 37 | 12 |
| 95209 | Stockton | 8 | 2 |
| 95210 | Stockton | 3 | 1 |
| 95212 | Stockton | 2 | 0 |
| 95215 | Stockton | 1 | 0 |
| 95219 | Stockton | 5 | 0 |
| 95220 | Acampo | 4 | 0 |
| 95227 | Clements | 1 | 0 |
| 95236 | Linden | 3 | 1 |
| 95237 | Lockeford | 1 | 0 |
| 95240 | Lodi | 15 | 2 |
| 95242 | Lodi | 8 | 3 |
| 95258 | Woodbridge | 1 | 0 |
| 95269 | Stockton | 2 | 1 |
| 95290 | Stockton | 1 | 0 |
| 95304 | Banta | 1 | 0 |
| 95320 | Escalon | 4 | 1 |
| 95330 | Lathrop | 2 | 0 |
| 95336 | Manteca | 3 | 0 |
| 95337 | Manteca | 4 | 1 |
| 95366 | Ripon | 7 | 0 |
| 95376 | Tracy | 12 | 1 |
| 95377 | Tracy | 2 | 0 |
2023 air pollution in San Joaquin County:
Carbon Monoxide: 0.248 ppm (standard limit: 9 ppm). Near U.S. average.
Nitrogen Dioxide: 0.01 ppm (standard limit: 0.053 ppm). Above U.S. average.
Ozone (1-hour): 0.027 ppm (standard limit: 0.12 ppm). Below U.S. average.
Particulate Matter (PM10) Annual: 17.7 µg/m3. Near U.S. average.
Particulate Matter (PM2.5) Annual: 8.7 µg/m3(standard limit: 15.0 µg/m3). Near U.S. average.
Neighboring counties: Garfield County, Utah  , Logan County, West Virginia , Franklin County, Missouri , Tuolumne County , Owen County, Kentucky .
| Here: | 6.8% |
| California: | 5.1% |
Current college students: 33,087
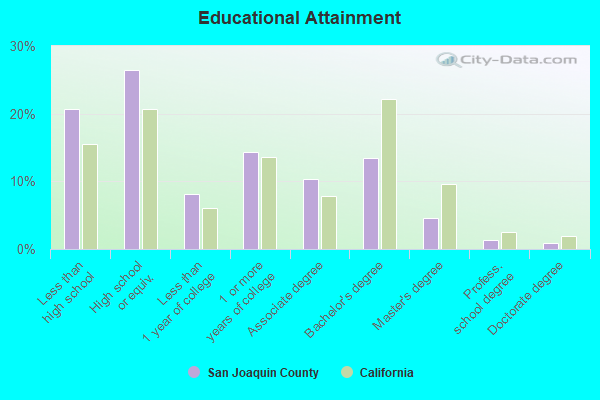
People 25 years of age or older with a high school degree or higher: 80.9%
People 25 years of age or older with a bachelor's degree or higher: 22.9%
Number of foreign born residents: 199,734 (50.8% naturalized citizens)
| San Joaquin County: | 25.2% |
| Whole state: | 26.7% |
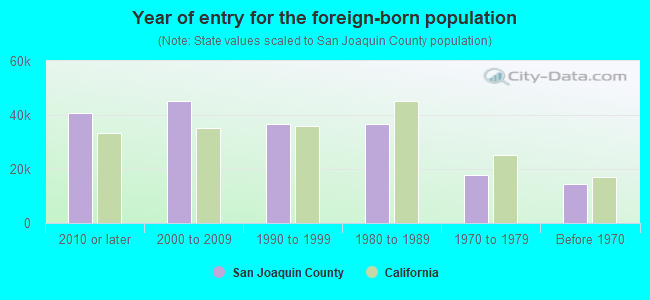
- Year of entry for the foreign-born population
- 57,2552010 or later
- 46,9512000 to 2009
- 42,0181990 to 1999
- 36,7991980 to 1989
- 17,6851970 to 1979
- 14,603Before 1970
Mean travel time to work (commute): ! minutes
Percentage of county residents living and working in this county: 99.7%
Housing units in structures:
- One, detached: 196,422
- One, attached: 13,969
- Two: 3,606
- 3 or 4: 8,509
- 5 to 9: 8,660
- 10 to 19: 5,152
- 20 to 49: 5,283
- 50 or more: 9,527
- Mobile homes: 8,242
- Boats, RVs, vans, etc.: 122
Housing units in San Joaquin County with a mortgage: 108,092 (8,514 second mortgage, 239 home equity loan, 6,989 both second mortgage and home equity loan)
Houses without a mortgage: 1,226
| Here: | 99.1% with mortgage |
| State: | 98.6% with mortgage |
Religion statistics for San Joaquin County
| Religion | Adherents | Congregations |
|---|---|---|
| Catholic | 183,692 | 18 |
| Evangelical Protestant | 67,940 | 304 |
| Other | 33,949 | 68 |
| Mainline Protestant | 12,067 | 43 |
| Black Protestant | 3,251 | 17 |
| Orthodox | 1,368 | 2 |
| None | 383,039 | - |
Source: Clifford Grammich, Kirk Hadaway, Richard Houseal, Dale E.Jones, Alexei Krindatch, Richie Stanley and Richard H.Taylor. 2012. 2010 U.S.Religion Census: Religious Congregations & Membership Study. Association of Statisticians of American Religious Bodies. Jones, Dale E., et al. 2002. Congregations and Membership in the United States 2000. Nashville, TN: Glenmary Research Center.
Food Environment Statistics:
| San Joaquin County: | 2.34 / 10,000 pop. |
| State: | 2.14 / 10,000 pop. |
| Here: | 0.04 / 10,000 pop. |
| California: | 0.04 / 10,000 pop. |
| This county: | 0.67 / 10,000 pop. |
| California: | 0.62 / 10,000 pop. |
| San Joaquin County: | 2.02 / 10,000 pop. |
| California: | 1.49 / 10,000 pop. |
| This county: | 5.23 / 10,000 pop. |
| State: | 7.42 / 10,000 pop. |
| San Joaquin County: | 7.1% |
| California: | 7.3% |
| San Joaquin County: | 29.2% |
| State: | 21.3% |
| Here: | 16.5% |
| State: | 17.9% |
Agriculture in San Joaquin County:
Average size of farms: 202 acresAverage value of agricultural products sold per farm: $303,640
Average value of crops sold per acre for harvested cropland: $1755.07
The value of nursery, greenhouse, floriculture, and sod as a percentage of the total market value of agricultural products sold: 10.69%
The value of livestock, poultry, and their products as a percentage of the total market value of agricultural products sold: 25.74%
Average total farm production expenses per farm: $244,010
Harvested cropland as a percentage of land in farms: 63.65%
Irrigated harvested cropland as a percentage of land in farms: 94.49%
Average market value of all machinery and equipment per farm: $91,721
The percentage of farms operated by a family or individual: 79.88%
Average age of principal farm operators: 57 years
Average number of cattle and calves per 100 acres of all land in farms: 26.87
Milk cows as a percentage of all cattle and calves: 47.41%
Corn for grain: 52748 harvested acres
All wheat for grain: 26715 harvested acres
Vegetables: 83,102 harvested acres
Land in orchards: 193,693 acres
Earthquake activity:
San Joaquin County-area historical earthquake activity is significantly above California state average. It is 7973% greater than the overall U.S. average.On 4/18/1906 at 13:12:21, a magnitude 7.9 (7.9 UK, Class: Major, Intensity: VIII - XII) earthquake occurred 93.8 miles away from San Joaquin County center, causing $524,000,000 total damage
On 10/18/1989 at 00:04:15, a magnitude 7.1 (6.5 MB, 7.1 MS, 6.9 MW, 7.0 ML) earthquake occurred 63.7 miles away from the county center, causing 62 deaths (62 shaking deaths) and 3757 injuries, causing $1,305,032,704 total damage
On 7/21/1952 at 11:52:14, a magnitude 7.7 (7.7 UK) earthquake occurred 240.0 miles away from the county center, causing $50,000,000 total damage
On 11/4/1927 at 13:51:53, a magnitude 7.5 (7.5 UK) earthquake occurred 210.1 miles away from the county center
On 10/3/1915 at 06:52:48, a magnitude 7.6 (7.6 UK) earthquake occurred 268.8 miles away from San Joaquin County center
On 12/21/1932 at 06:10:09, a magnitude 7.2 (7.2 UK) earthquake occurred 178.0 miles away from the county center
Magnitude types: body-wave magnitude (MB), local magnitude (ML), surface-wave magnitude (MS), moment magnitude (MW)
Most recent natural disasters:
- California Covid-19 Pandemic, Incident Period: January 20, 2020, FEMA Id: 4482, Natural disaster type: Other
- California Severe Winter Storms, Flooding, Mudslides, Incident Period: February 1, 2017 - February 23, 2017, FEMA Id: 4308, Natural disaster type: Winter Storm, Mudslide, Flood
- California Severe Storms, Flooding, Landslides, and Mudslides, Incident Period: March 29, 2006 to April 16, 2006, Major Disaster (Presidential) Declared DR-1646: June 05, 2006, FEMA Id: 1646, Natural disaster type: Storm, Mudslide, Landslide, Flood
- California Severe Storms, Flooding, Mudslides, and Landslides, Incident Period: December 17, 2005 to January 03, 2006, Major Disaster (Presidential) Declared DR-1628: February 03, 2006, FEMA Id: 1628, Natural disaster type: Storm, Mudslide, Landslide, Flood
- California Hurricane Katrina Evacuation, Incident Period: August 29, 2005 to October 01, 2005, Emergency Declared EM-3248: September 13, 2005, FEMA Id: 3248, Natural disaster type: Hurricane
- California Flooding As A Result Of A Levee Break, Incident Period: June 03, 2004 to July 12, 2004, Major Disaster (Presidential) Declared DR-1529: June 30, 2004, FEMA Id: 1529, Natural disaster type: Flood
- California Severe Winter Storms and Flooding, Incident Period: February 02, 1998 to April 30, 1998, Major Disaster (Presidential) Declared DR-1203: February 09, 1998, FEMA Id: 1203, Natural disaster type: Winter Storm, Flood
- California Severe Storms/Flooding, Incident Period: December 28, 1996 to April 01, 1997, Major Disaster (Presidential) Declared DR-1155: January 04, 1997, FEMA Id: 1155, Natural disaster type: Storm, Flood
- California Severe Winter Storms, Flooding, Landslides, Mud Flows, Incident Period: February 13, 1995 to April 19, 1995, Major Disaster (Presidential) Declared DR-1046: March 12, 1995, FEMA Id: 1046, Natural disaster type: Winter Storm, Landslide, Flood
- California Severe Freeze, Incident Period: December 19, 1990 to January 03, 1991, Major Disaster (Presidential) Declared DR-894: February 11, 1991, FEMA Id: 894, Natural disaster type: Freeze
- 10 other natural disasters have been reported since 1953.
The number of natural disasters in San Joaquin County (20) is greater than the US average (15).
Major Disasters (Presidential) Declared: 15
Emergencies Declared: 3
Causes of natural disasters: Floods: 13, Storms: 7, Mudslides: 4, Landslides: 3, Winter Storms: 3, Drought: 1, Earthquake: 1, Freeze: 1, Heavy Rain: 1, Hurricane: 1, Tornado: 1, Wind: 1, Other: 2 (Note: some incidents may be assigned to more than one category).
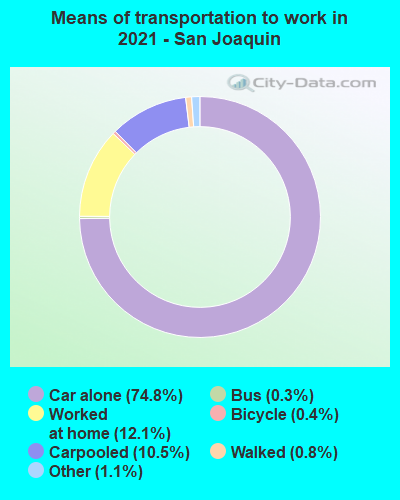
Means of transportation to work:
- Drove a car alone: 229,346 (72.0%)
- Carpooled: 41,997 (13.2%)
- Bus: 844 (0.3%)
- Subway or elevated rail: 86 (0.0%)
- Long-distance train or commuter rail: 114 (0.0%)
- Taxicab, motorcycle, or other means: 3,977 (1.2%)
- Bicycle: 955 (0.3%)
- Walked: 3,216 (1.0%)
- Worked at home: 37,857 (11.9%)
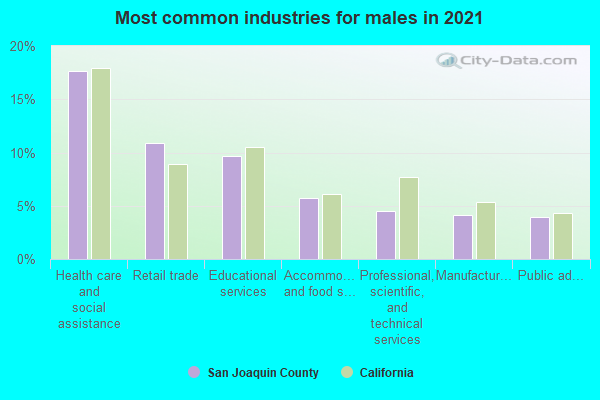
- Health care and social assistance (17%)
- Educational services (11%)
- Retail trade (10%)
- Accommodation and food services (6%)
- Manufacturing (5%)
- Transportation and warehousing (5%)
- Other services, except public administration (4%)
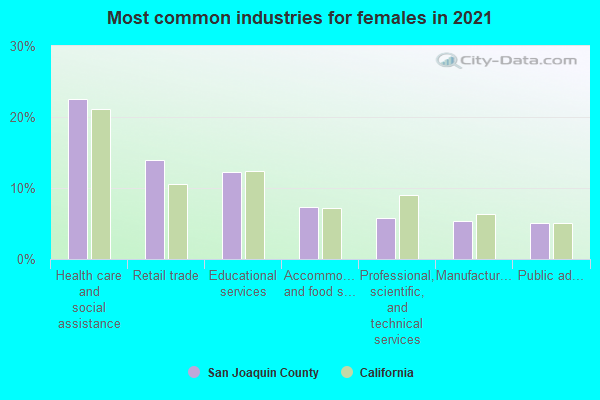
- Health care and social assistance (20%)
- Educational services (13%)
- Retail trade (13%)
- Accommodation and food services (8%)
- Manufacturing (7%)
- Transportation and warehousing (6%)
- Other services, except public administration (5%)
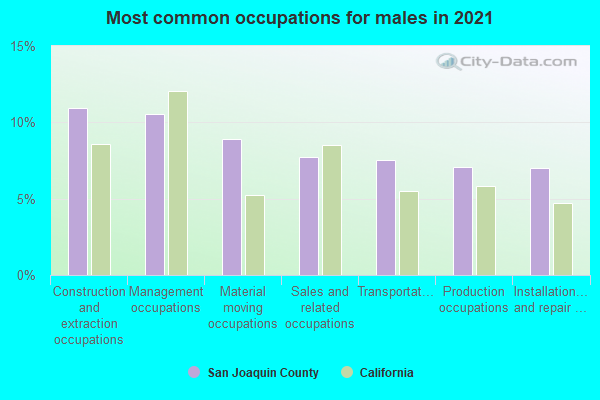
- Construction and extraction occupations (11%)
- Material moving occupations (10%)
- Transportation occupations (9%)
- Management occupations (8%)
- Production occupations (8%)
- Sales and related occupations (7%)
- Office and administrative support occupations (5%)
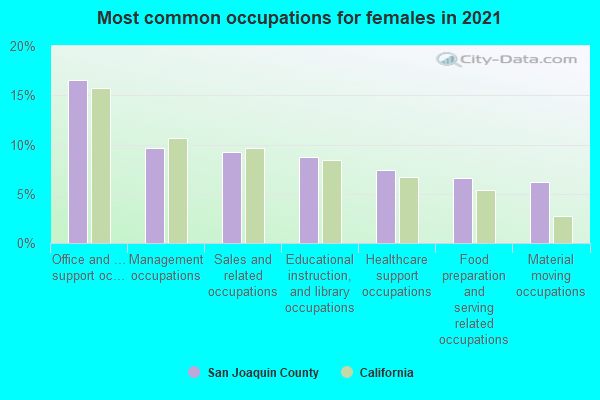
- Office and administrative support occupations (18%)
- Sales and related occupations (10%)
- Educational instruction, and library occupations (8%)
- Healthcare support occupations (7%)
- Management occupations (7%)
- Food preparation and serving related occupations (6%)
- Material moving occupations (6%)
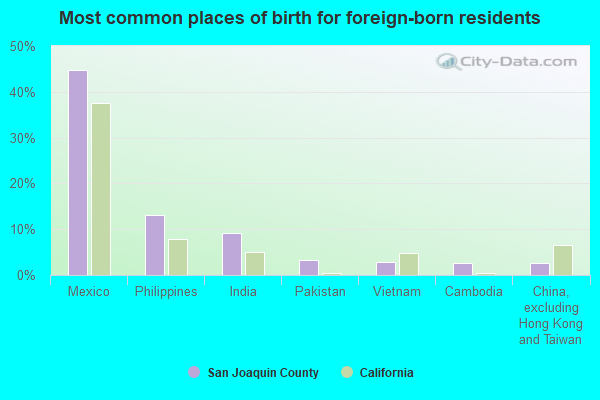
- Mexico (45%)
- Philippines (13%)
- India (11%)
- Pakistan (4%)
- Vietnam (3%)
- Cambodia (3%)
- China, excluding Hong Kong and Taiwan (2%)
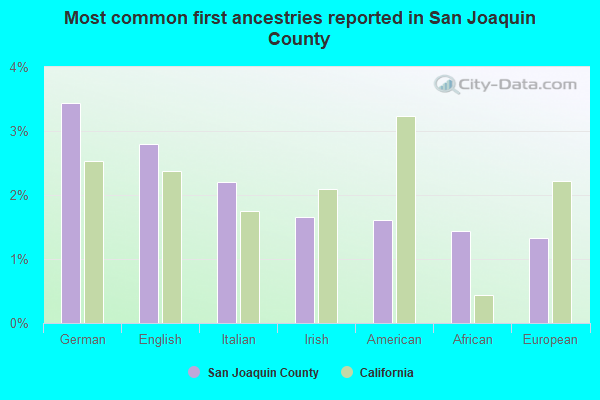
- German (3%)
- English (3%)
- Italian (2%)
- American (2%)
- Irish (2%)
- European (1%)
- Portuguese (1%)
People in group quarters in San Joaquin County, California in 2010:
- 3,757 people in state prisons
- 2,735 people in nursing facilities/skilled-nursing facilities
- 2,194 people in college/university student housing
- 1,253 people in local jails and other municipal confinement facilities
- 1,071 people in workers' group living quarters and job corps centers
- 880 people in group homes intended for adults
- 604 people in correctional facilities intended for juveniles
- 572 people in emergency and transitional shelters (with sleeping facilities) for people experiencing homelessness
- 521 people in other noninstitutional facilities
- 288 people in residential treatment centers for adults
- 152 people in residential treatment centers for juveniles (non-correctional)
- 105 people in correctional residential facilities
- 100 people in group homes for juveniles (non-correctional)
- 70 people in residential schools for people with disabilities
- 32 people in mental (psychiatric) hospitals and psychiatric units in other hospitals
- 20 people in in-patient hospice facilities
People in group quarters in San Joaquin County, California in 2000:
- 5,393 people in state prisons
- 2,859 people in nursing homes
- 2,205 people in agriculture workers' dormitories on farms
- 1,922 people in other noninstitutional group quarters
- 1,854 people in college dormitories (includes college quarters off campus)
- 1,311 people in local jails and other confinement facilities (including police lockups)
- 963 people in unknown juvenile institutions
- 637 people in other nonhousehold living situations
- 406 people in other types of correctional institutions
- 323 people in homes for the mentally ill
- 296 people in homes for the mentally retarded
- 183 people in short-term care, detention or diagnostic centers for delinquent children
- 103 people in homes or halfway houses for drug/alcohol abuse
- 96 people in wards in general hospitals for patients who have no usual home elsewhere
- 53 people in mental (psychiatric) hospitals or wards
- 41 people in religious group quarters
- 36 people in halfway houses
- 35 people in other workers' dormitories
- 34 people in other group homes
- 12 people in homes for abused, dependent, and neglected children
- 6 people in homes for the physically handicapped
- 3 people in military barracks, etc.
6.18% of this county's 2021 resident taxpayers lived in other counties in 2020 ($75,687 average adjusted gross income)
| Here: | 6.18% |
| California average: | 5.19% |
0.01% of residents moved from foreign countries ($71 average AGI)
San Joaquin County: 0.01% California average: 0.03%
5.28% relocated from other counties in California ($68,199 average AGI)
0.88% relocated from other states ($7,417 average AGI)
San Joaquin County: 0.88% California average: 1.56%
Top counties from which taxpayers relocated into this county between 2020 and 2021:
| from Alameda County, CA | |
| from Santa Clara County, CA | |
| from Stanislaus County, CA | |
| from Sacramento County, CA | |
| from Contra Costa County, CA | |
| from San Mateo County, CA | |
| from Los Angeles County, CA |
5.64% of this county's 2020 resident taxpayers moved to other counties in 2021 ($66,959 average adjusted gross income)
| Here: | 5.64% |
| California average: | 6.14% |
0.01% of residents moved to foreign countries ($82 average AGI)
San Joaquin County: 0.01% California average: 0.02%
3.91% relocated to other counties in California ($43,559 average AGI)
1.72% relocated to other states ($23,319 average AGI)
San Joaquin County: 1.72% California average: 2.55%
Top counties to which taxpayers relocated from this county between 2020 and 2021:
| to Stanislaus County, CA | |
| to Sacramento County, CA | |
| to Alameda County, CA | |
| to Santa Clara County, CA | |
| to Contra Costa County, CA | |
| to Calaveras County, CA | |
| to Los Angeles County, CA |
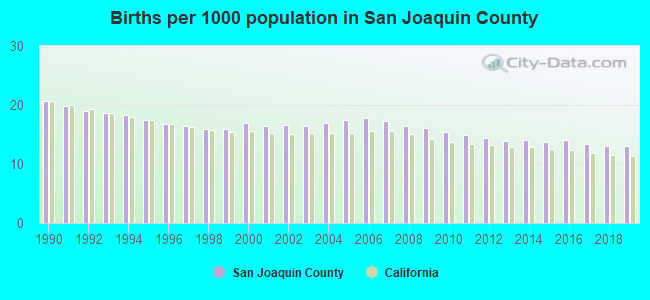
Births per 1000 population from 1990 to 1999: 17.9
Births per 1000 population from 2000 to 2009: 16.9
Births per 1000 population from 2010 to 2022: 11.7
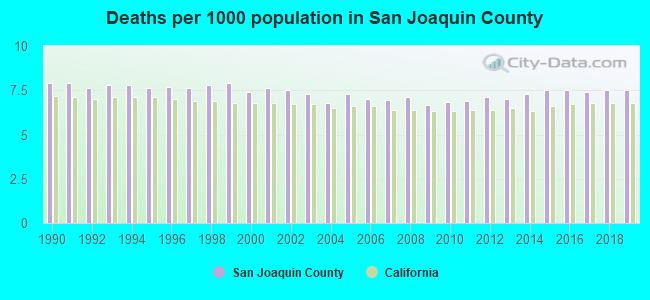
Deaths per 1000 population from 1990 to 1999: 7.8
Deaths per 1000 population from 2000 to 2009: 7.2
Deaths per 1000 population from 2010 to 2020: 7.4
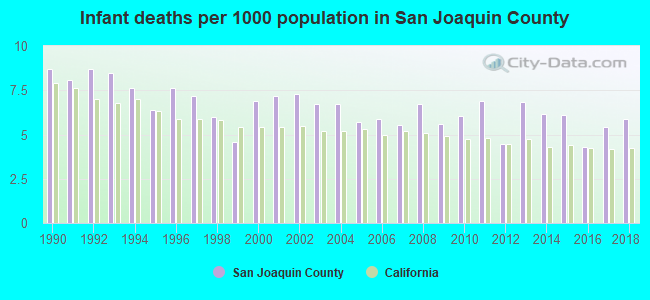
Infant deaths per 1000 live births from 1990 to 1999: 7.3
Infant deaths per 1000 live births from 2000 to 2009: 6.4
Infant deaths per 1000 live births from 2010 to 2021: 5.7
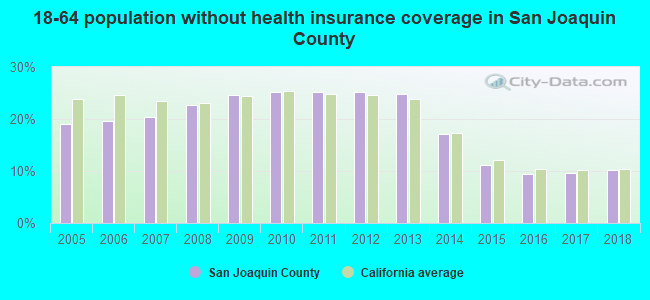
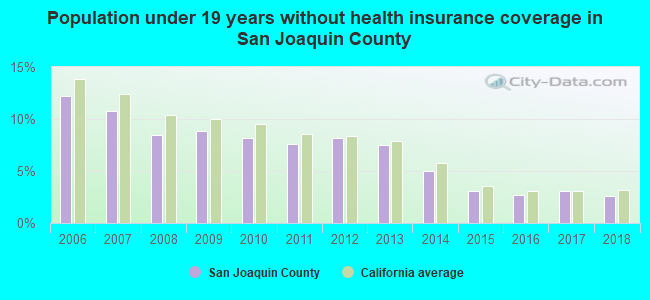
Persons under 19 years old without health insurance coverage in 2018: 2.6%
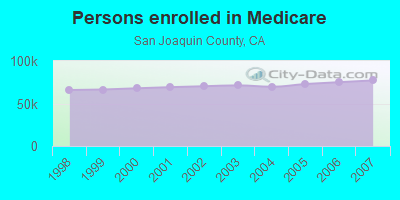
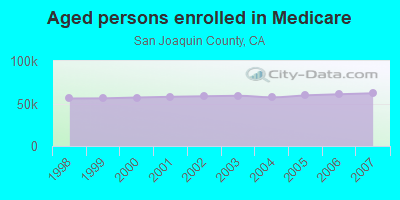
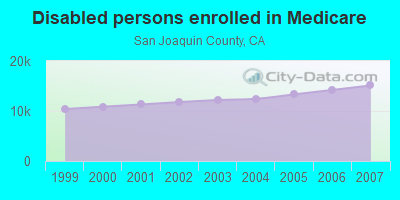
Persons enrolled in hospital insurance and/or supplemental medical insurance (Medicare) in July 1, 2007: 77,152 (62,044 aged, 15,108 disabled)
Children under 18 without health insurance coverage in 2007: 19,825 (10%)
Most common underlying causes of death in San Joaquin County, California in 1999 - 2019:
- Atherosclerotic heart disease (10,470)
- Bronchus or lung, unspecified - Malignant neoplasms (5,507)
- Acute myocardial infarction, unspecified (4,517)
- Chronic obstructive pulmonary disease, unspecified (4,391)
- Alzheimer disease, unspecified (4,307)
- Stroke, not specified as haemorrhage or infarction (2,948)
- Congestive heart failure (2,173)
- Unspecified diabetes mellitus, without complications (1,665)
- Breast, unspecified - Malignant neoplasms (1,634)
- Atherosclerotic cardiovascular disease, so described (1,624)
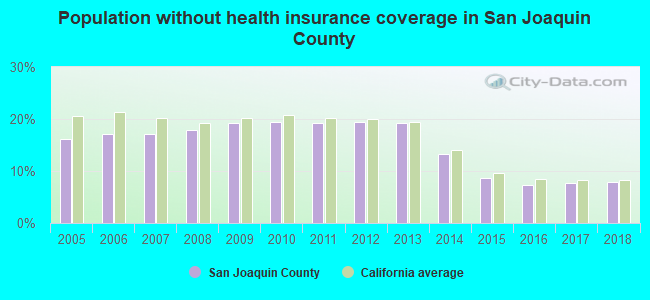
Population without health insurance coverage in 2000: 19%
Children under 18 without health insurance coverage in 2000: 14%
Homicides per 1,000,000 population from 2000 to 2006: 75.5. This is less than state average.
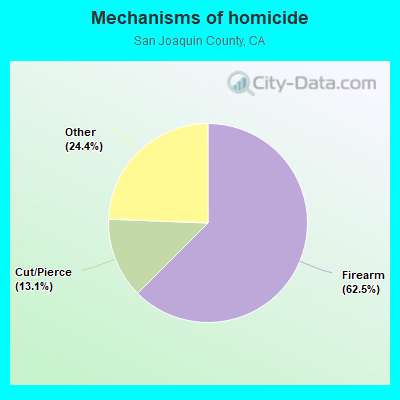
- Firearm - 47.2
- Cut/Pierce - 9.9
- Other - 18.4
Suicides per 1,000,000 population from 2000 to 2006: 81.0. This is less than state average.
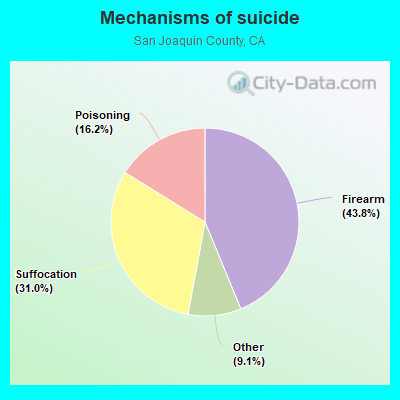
- Firearm - 35.5
- Suffocation - 25.1
- Poisoning - 13.1
- Other - 7.4
Household type by relationship:
Households: 793,229- Male householders: 119,651 (21,711 living alone), Female householders: 122,252 (27,598 living alone)
123,070 spouses (121,988 opposite-sex spouses), 16,317 unmarried partners, (15,972 opposite-sex unmarried partners), 280,324 children (262,951 natural, 6,646 adopted, 10,727 stepchildren), 24,167 grandchildren, 15,520 brothers or sisters, 26,238 parents, 396 foster children, 29,066 other relatives, 22,548 non-relatives
- In group quarters: 13,680
Size of family households: 54,859 2-persons, 41,431 3-persons, 38,208 4-persons, 23,410 5-persons, 12,170 6-persons, 10,637 7-or-more-persons.
Size of nonfamily households: 49,309 1-person, 9,821 2-persons, 1,015 3-persons, 753 4-persons, 132 5-persons, 137 6-persons, 21 7-or-more-persons.
123,635 married couples with children.
52,269 single-parent households (16,685 men, 35,584 women).
56.6% of residents of San Joaquin speak English at home.
27.9% of residents speak Spanish at home (60% speak English very well, 15% speak English well, 14% speak English not well, 11% don't speak English at all).
5.4% of residents speak other Indo-European language at home (64% speak English very well, 21% speak English well, 12% speak English not well, 3% don't speak English at all).
9.2% of residents speak Asian or Pacific Island language at home (56% speak English very well, 22% speak English well, 18% speak English not well, 5% don't speak English at all).
0.9% of residents speak other language at home (58% speak English very well, 31% speak English well, 6% speak English not well, 5% don't speak English at all).
In fiscal year 2004:
Federal Government expenditure: $2,799,182,000 ($4,307 per capita)
Department of Defense expenditure: $163,823,000
Federal direct payments to individuals for retirement and disability: $1,149,718,000
Federal other direct payments to individuals: $580,832,000
Federal direct payments not to individuals: $39,000,000
Federal grants: $743,722,000
Federal procurement contracts: $92,791,000 ($37,486,000 Department of Defense)
Federal salaries and wages: $193,118,000 ($82,104,000 Department of Defense)
Federal Government direct loans: $74,592,000
Federal guaranteed/insured loans: $293,843,000
Federal Government insurance: $1,024,128,000
Population change from April 1, 2000 to July 1, 2005:
Births: 53,041| Here: | 80 per 1000 residents |
| State: | 77 per 1000 residents |
Deaths: 23,655
| Here: | 36 per 1000 residents |
| State: | 34 per 1000 residents |
Net international migration: +17,183
| Here: | +26 per 1000 residents |
| State: | +39 per 1000 residents |
Net internal migration: +54,561
| Here: | |
| State: |
Total withdrawal of fresh water for public supply: 98.79 millions of gallons per day (59% from ground, 41% from surface)
| Here: | 6.1 |
| State: | 6.0 |
| Here: | 4.5 |
| State: | 3.9 |
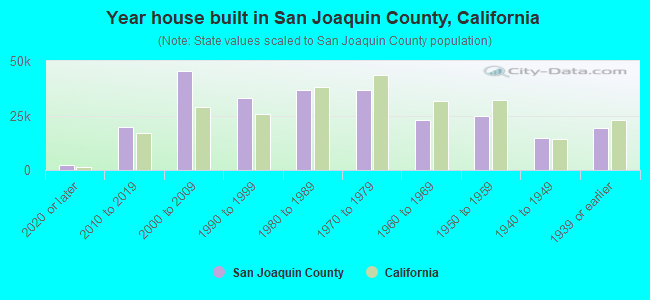
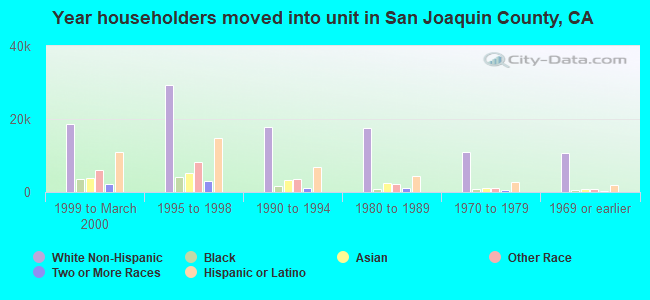
- Year house built in San Joaquin County, California
- 5,7092020 or later
- 20,8532010 to 2019
- 45,4892000 to 2009
- 33,8181990 to 1999
- 36,9381980 to 1989
- 40,5931970 to 1979
- 22,9841960 to 1969
- 24,5261950 to 1959
- 12,1601940 to 1949
- 16,4221939 or earlier
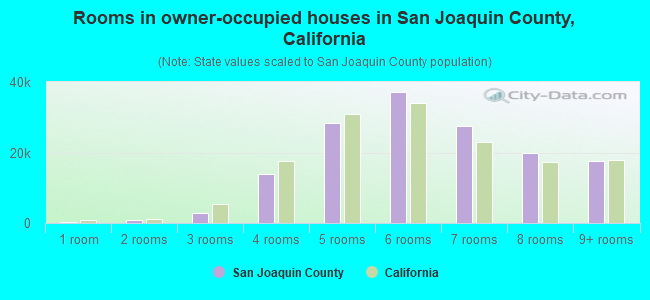
- Rooms in owner-occupied houses in San Joaquin County, California
- 6101 room
- 4582 rooms
- 3,6453 rooms
- 15,1134 rooms
- 36,5055 rooms
- 35,5256 rooms
- 22,7097 rooms
- 19,5628 rooms
- 19,0199+ rooms
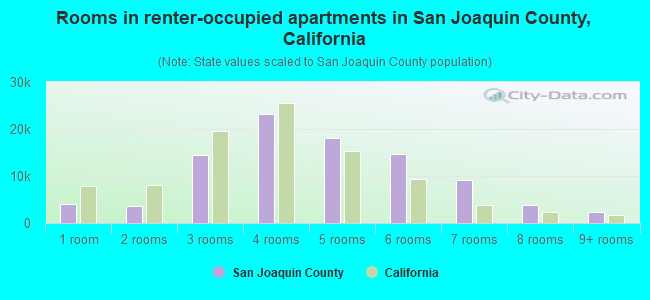
- Rooms in renter-occupied apartments in San Joaquin County, California
- 4,9081 room
- 3,4232 rooms
- 12,5763 rooms
- 23,6344 rooms
- 17,1005 rooms
- 13,1986 rooms
- 6,0017 rooms
- 5,3738 rooms
- 2,5449+ rooms
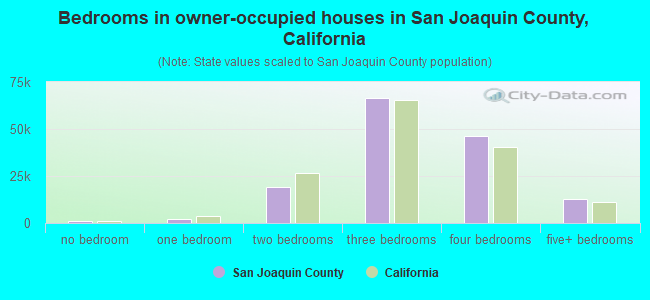
- Bedrooms in owner-occupied houses in San Joaquin County, California
- 1,050no bedroom
- 1,3561 bedroom
- 18,7592 bedrooms
- 71,9203 bedrooms
- 45,0204 bedrooms
- 15,0415+ bedrooms
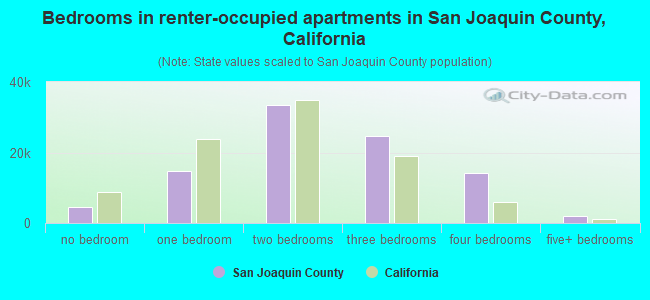
- Bedrooms in renter-occupied apartments in San Joaquin County, California
- 5,573no bedroom
- 13,0941 bedroom
- 31,2812 bedrooms
- 25,2743 bedrooms
- 10,9994 bedrooms
- 2,5365+ bedrooms
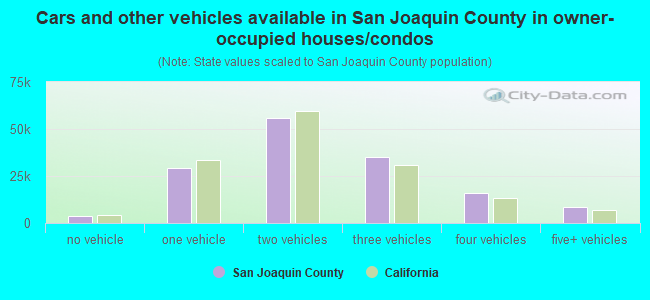
- Cars and other vehicles available in San Joaquin County in owner-occupied houses/condos
- 4,224no vehicle
- 31,5621 vehicle
- 58,2112 vehicles
- 33,6283 vehicles
- 15,2354 vehicles
- 10,2865+ vehicles
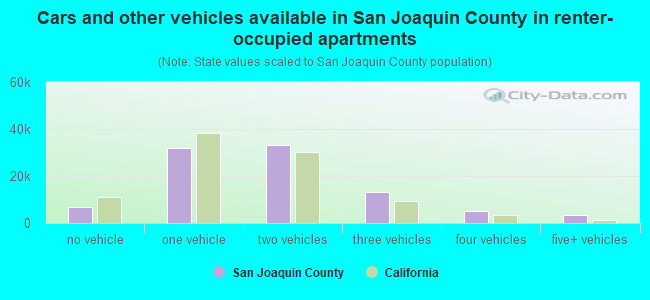
- Cars and other vehicles available in San Joaquin County in renter-occupied apartments
- 8,311no vehicle
- 33,0321 vehicle
- 28,7482 vehicles
- 11,9733 vehicles
- 4,3564 vehicles
- 2,3375+ vehicles
89.4% of San Joaquin County residents lived in the same house 1 years ago.
Out of people who lived in different houses, 37% lived in this county.
Out of people who lived in different counties, 90% lived in California.
| San Joaquin County: | 89.4% |
| State average: | 88.9% |
Place of birth for U.S.-born residents:
- This state: 511,914
- Other state: 65,331
- Northeast: 10,178
- Midwest: 18,398
- South: 19,608
- West: 17,147
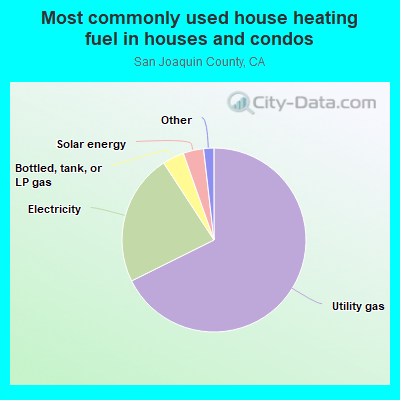
- 65.9%Utility gas
- 24.2%Electricity
- 4.1%Bottled, tank, or LP gas
- 3.2%Solar energy
- 1.4%Wood
- 0.7%No fuel used
- 0.5%Other fuel
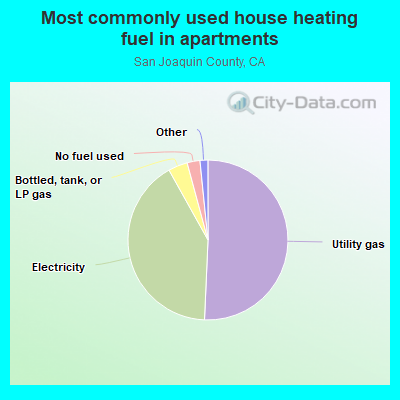
- 50.0%Utility gas
- 41.2%Electricity
- 3.7%Bottled, tank, or LP gas
- 3.5%No fuel used
- 0.6%Solar energy
- 0.6%Other fuel
- 0.5%Wood
Private vs. public school enrollment:
| Here: | 6.5% |
| California: | 10.5% |
| Here: | 4.1% |
| California: | 8.5% |
| Here: | 16.5% |
| California: | 15.9% |

San Joaquin County government finances - Expenditure in 2018:
- Assistance and Subsidies - Public Welfare, Cash Assistance Programs - Other: $230,985,000
Public Welfare, Cash Assistance Programs - Other: $191,467,000
- Bond Funds - Cash and Securities: $5,740,000
Cash and Securities: $2,678,000
- Charges - Hospital Public: $365,278,000
Hospital Public: $335,472,000
Other: $172,052,000
Other: $159,378,000
Solid Waste Management: $34,975,000
Elementary and Secondary Education - Other: $31,835,000
Solid Waste Management: $31,501,000
Elementary and Secondary Education - Other: $29,178,000
Sewerage: $6,862,000
Sewerage: $4,334,000
Air Transportation: $4,278,000
Air Transportation: $3,946,000
Natural Resources - Other: $2,381,000
Natural Resources - Other: $2,339,000
Parks and Recreation: $2,010,000
Parks and Recreation: $1,442,000
Regular Highways: $188,000
Regular Highways: $75,000
Elementary and Secondary Education School Lunch: $35,000
Elementary and Secondary Education School Lunch: $31,000
- Construction - Regular Highways: $25,582,000
Hospitals: $20,700,000
Hospitals: $20,550,000
Elementary and Secondary Education: $17,358,000
Elementary and Secondary Education: $6,680,000
Natural Resources - Other: $1,126,000
General - Other: $47,000
General - Other: $44,000
Parks and Recreation: $24,000
- Current Operations - Hospitals: $344,380,000
Hospitals: $306,771,000
Health - Other: $226,013,000
Elementary and Secondary Education: $193,938,000
Health - Other: $187,787,000
Elementary and Secondary Education: $170,988,000
Public Welfare - Other: $147,171,000
Public Welfare - Other: $136,881,000
Police Protection: $70,425,000
Judicial and Legal Services: $69,879,000
Judicial and Legal Services: $67,505,000
Correctional Institutions: $67,322,000
General - Other: $64,726,000
Police Protection: $63,165,000
Correctional Institutions: $60,188,000
General - Other: $58,652,000
Corrections - Other: $30,386,000
Solid Waste Management: $25,022,000
Regular Highways: $24,892,000
Corrections - Other: $24,763,000
Solid Waste Management: $20,965,000
Natural Resources - Other: $20,905,000
Regular Highways: $20,676,000
Central Staff Services: $17,890,000
Natural Resources - Other: $16,998,000
Financial Administration: $14,424,000
Financial Administration: $13,976,000
Central Staff Services: $9,848,000
Water Utilities: $8,704,000
Water Utilities: $7,863,000
Sewerage: $7,697,000
Sewerage: $7,382,000
Libraries: $5,708,000
Air Transportation: $5,053,000
Libraries: $5,050,000
Protective Inspection and Regulation - Other: $4,949,000
Parks and Recreation: $4,522,000
Parks and Recreation: $3,936,000
Air Transportation: $3,033,000
Protective Inspection and Regulation - Other: $197,000
Public Welfare, Vendor Payments for Other Purposes: $33,000
Public Welfare, Vendor Payments for Other Purposes: $31,000
- Federal Intergovernmental - Other: $56,835,000
Other: $28,418,000
Highways: $26,651,000
Highways: $25,254,000
Education: $24,604,000
Education: $23,106,000
Housing and Community Development: $13,235,000
Air Transportation: $1,542,000
Housing and Community Development: $1,501,000
Air Transportation: $1,281,000
General Local Government Support: $6,000
General Local Government Support: $6,000
- General - Interest on Debt: $14,966,000
Interest on Debt: $7,606,000
- Intergovernmental to Local - Other - Elementary and Secondary Education: $51,877,000
Other - Elementary and Secondary Education: $44,721,000
- Intergovernmental to State - Judicial and Legal Services: $9,205,000
Judicial and Legal Services: $8,702,000
- Local Intergovernmental - Education: $50,523,000
Education: $41,121,000
Other: $5,583,000
Housing and Community Development: $5,096,000
Housing and Community Development: $4,690,000
Other: $3,838,000
- Long Term Debt - Beginning Outstanding - Unspecified Public Purpose: $628,780,000
Beginning Outstanding - Unspecified Public Purpose: $595,760,000
Outstanding Unspecified Public Purpose: $595,745,000
Outstanding Unspecified Public Purpose: $555,666,000
Retired Unspecified Public Purpose: $47,296,000
Retired Unspecified Public Purpose: $45,897,000
Beginning Outstanding - Public Debt for Private Purpose: $37,225,000
Outstanding Nonguaranteed - Industrial Revenue: $34,325,000
Beginning Outstanding - Public Debt for Private Purpose: $31,425,000
Outstanding Nonguaranteed - Industrial Revenue: $28,525,000
Issue, Unspecified Public Purpose: $14,261,000
Issue, Unspecified Public Purpose: $5,804,000
Retired Nonguaranteed - Public Debt for Private Purpose: $2,900,000
Retired Nonguaranteed - Public Debt for Private Purpose: $2,900,000
- Miscellaneous - Special Assessments: $30,702,000
Special Assessments: $30,617,000
Interest Earnings: $28,003,000
General Revenue - Other: $14,245,000
General Revenue - Other: $14,239,000
Interest Earnings: $10,236,000
Fines and Forfeits: $5,941,000
Fines and Forfeits: $5,217,000
Rents: $1,550,000
Rents: $730,000
Royalties: $37,000
Royalties: $35,000
Sale of Property: $3,000
- Other Capital Outlay - Regular Highways: $28,887,000
General - Other: $9,321,000
General - Other: $9,256,000
General Public Building: $8,641,000
Police Protection: $6,921,000
Public Welfare - Other: $2,263,000
Elementary and Secondary Education: $2,119,000
Health - Other: $1,896,000
Air Transportation: $1,662,000
Air Transportation: $1,518,000
Elementary and Secondary Education: $1,236,000
Health - Other: $1,031,000
Public Welfare - Other: $815,000
Water Utilities: $704,000
Parks and Recreation: $700,000
Water Utilities: $648,000
Police Protection: $586,000
Central Staff Services: $224,000
Corrections - Other: $157,000
Judicial and Legal Services: $125,000
Protective Inspection and Regulation - Other: $78,000
Correctional Institutions: $57,000
Sewerage: $48,000
Regular Highways: $31,000
Sewerage: $29,000
Financial Administration: $18,000
Parks and Recreation: $14,000
Solid Waste Management: $8,000
Solid Waste Management: $8,000
- Other Funds - Cash and Securities: $1,566,596,000
Cash and Securities: $417,978,000
- Revenue - Water Utilities: $10,258,000
Water Utilities: $6,532,000
- Sinking Funds - Cash and Securities: $67,616,000
Cash and Securities: $29,892,000
- State Intergovernmental - Other: $319,622,000
Other: $275,373,000
Public Welfare: $242,655,000
Public Welfare: $230,095,000
Health and Hospitals: $174,421,000
Education: $148,949,000
Education: $131,777,000
Health and Hospitals: $115,639,000
Highways: $31,096,000
Highways: $18,397,000
General Local Government Support: $2,571,000
General Local Government Support: $2,337,000
Water Utilities: $3,000
Water Utilities: $3,000
Sewerage: $1,000
Sewerage: $1,000
- Tax - Property: $292,502,000
Property: $266,679,000
General Sales and Gross Receipts: $27,360,000
General Sales and Gross Receipts: $21,077,000
Other: $11,572,000
Other: $10,796,000
Occupation and Business License - Other: $6,155,000
Documentary and Stock Transfer: $4,550,000
Documentary and Stock Transfer: $4,422,000
Occupation and Business License - Other: $4,363,000
Public Utilities Sales: $3,518,000
Public Utilities Sales: $3,058,000
Other License: $1,845,000
Other License: $1,774,000
Other Selective Sales: $700,000
Other Selective Sales: $594,000
- Total Salaries and Wages: $83,338,000
: $71,210,000
- Water Utilities - Interest on Debt: $4,281,000
Interest on Debt: $2,428,000
San Joaquin County government finances - Revenue in 2018:
- Assistance and Subsidies - Public Welfare, Cash Assistance Programs - Other: $230,985,000
Public Welfare, Cash Assistance Programs - Other: $191,467,000
- Bond Funds - Cash and Securities: $5,740,000
Cash and Securities: $2,678,000
- Charges - Hospital Public: $365,278,000
Hospital Public: $335,472,000
Other: $172,052,000
Other: $159,378,000
Solid Waste Management: $34,975,000
Elementary and Secondary Education - Other: $31,835,000
Solid Waste Management: $31,501,000
Elementary and Secondary Education - Other: $29,178,000
Sewerage: $6,862,000
Sewerage: $4,334,000
Air Transportation: $4,278,000
Air Transportation: $3,946,000
Natural Resources - Other: $2,381,000
Natural Resources - Other: $2,339,000
Parks and Recreation: $2,010,000
Parks and Recreation: $1,442,000
Regular Highways: $188,000
Regular Highways: $75,000
Elementary and Secondary Education School Lunch: $35,000
Elementary and Secondary Education School Lunch: $31,000
- Construction - Regular Highways: $25,582,000
Hospitals: $20,700,000
Hospitals: $20,550,000
Elementary and Secondary Education: $17,358,000
Elementary and Secondary Education: $6,680,000
Natural Resources - Other: $1,126,000
General - Other: $47,000
General - Other: $44,000
Parks and Recreation: $24,000
- Current Operations - Hospitals: $344,380,000
Hospitals: $306,771,000
Health - Other: $226,013,000
Elementary and Secondary Education: $193,938,000
Health - Other: $187,787,000
Elementary and Secondary Education: $170,988,000
Public Welfare - Other: $147,171,000
Public Welfare - Other: $136,881,000
Police Protection: $70,425,000
Judicial and Legal Services: $69,879,000
Judicial and Legal Services: $67,505,000
Correctional Institutions: $67,322,000
General - Other: $64,726,000
Police Protection: $63,165,000
Correctional Institutions: $60,188,000
General - Other: $58,652,000
Corrections - Other: $30,386,000
Solid Waste Management: $25,022,000
Regular Highways: $24,892,000
Corrections - Other: $24,763,000
Solid Waste Management: $20,965,000
Natural Resources - Other: $20,905,000
Regular Highways: $20,676,000
Central Staff Services: $17,890,000
Natural Resources - Other: $16,998,000
Financial Administration: $14,424,000
Financial Administration: $13,976,000
Central Staff Services: $9,848,000
Water Utilities: $8,704,000
Water Utilities: $7,863,000
Sewerage: $7,697,000
Sewerage: $7,382,000
Libraries: $5,708,000
Air Transportation: $5,053,000
Libraries: $5,050,000
Protective Inspection and Regulation - Other: $4,949,000
Parks and Recreation: $4,522,000
Parks and Recreation: $3,936,000
Air Transportation: $3,033,000
Protective Inspection and Regulation - Other: $197,000
Public Welfare, Vendor Payments for Other Purposes: $33,000
Public Welfare, Vendor Payments for Other Purposes: $31,000
- Federal Intergovernmental - Other: $56,835,000
Other: $28,418,000
Highways: $26,651,000
Highways: $25,254,000
Education: $24,604,000
Education: $23,106,000
Housing and Community Development: $13,235,000
Air Transportation: $1,542,000
Housing and Community Development: $1,501,000
Air Transportation: $1,281,000
General Local Government Support: $6,000
General Local Government Support: $6,000
- General - Interest on Debt: $14,966,000
Interest on Debt: $7,606,000
- Intergovernmental to Local - Other - Elementary and Secondary Education: $51,877,000
Other - Elementary and Secondary Education: $44,721,000
- Intergovernmental to State - Judicial and Legal Services: $9,205,000
Judicial and Legal Services: $8,702,000
- Local Intergovernmental - Education: $50,523,000
Education: $41,121,000
Other: $5,583,000
Housing and Community Development: $5,096,000
Housing and Community Development: $4,690,000
Other: $3,838,000
- Long Term Debt - Beginning Outstanding - Unspecified Public Purpose: $628,780,000
Beginning Outstanding - Unspecified Public Purpose: $595,760,000
Outstanding Unspecified Public Purpose: $595,745,000
Outstanding Unspecified Public Purpose: $555,666,000
Retired Unspecified Public Purpose: $47,296,000
Retired Unspecified Public Purpose: $45,897,000
Beginning Outstanding - Public Debt for Private Purpose: $37,225,000
Outstanding Nonguaranteed - Industrial Revenue: $34,325,000
Beginning Outstanding - Public Debt for Private Purpose: $31,425,000
Outstanding Nonguaranteed - Industrial Revenue: $28,525,000
Issue, Unspecified Public Purpose: $14,261,000
Issue, Unspecified Public Purpose: $5,804,000
Retired Nonguaranteed - Public Debt for Private Purpose: $2,900,000
Retired Nonguaranteed - Public Debt for Private Purpose: $2,900,000
- Miscellaneous - Special Assessments: $30,702,000
Special Assessments: $30,617,000
Interest Earnings: $28,003,000
General Revenue - Other: $14,245,000
General Revenue - Other: $14,239,000
Interest Earnings: $10,236,000
Fines and Forfeits: $5,941,000
Fines and Forfeits: $5,217,000
Rents: $1,550,000
Rents: $730,000
Royalties: $37,000
Royalties: $35,000
Sale of Property: $3,000
- Other Capital Outlay - Regular Highways: $28,887,000
General - Other: $9,321,000
General - Other: $9,256,000
General Public Building: $8,641,000
Police Protection: $6,921,000
Public Welfare - Other: $2,263,000
Elementary and Secondary Education: $2,119,000
Health - Other: $1,896,000
Air Transportation: $1,662,000
Air Transportation: $1,518,000
Elementary and Secondary Education: $1,236,000
Health - Other: $1,031,000
Public Welfare - Other: $815,000
Water Utilities: $704,000
Parks and Recreation: $700,000
Water Utilities: $648,000
Police Protection: $586,000
Central Staff Services: $224,000
Corrections - Other: $157,000
Judicial and Legal Services: $125,000
Protective Inspection and Regulation - Other: $78,000
Correctional Institutions: $57,000
Sewerage: $48,000
Regular Highways: $31,000
Sewerage: $29,000
Financial Administration: $18,000
Parks and Recreation: $14,000
Solid Waste Management: $8,000
Solid Waste Management: $8,000
- Other Funds - Cash and Securities: $1,566,596,000
Cash and Securities: $417,978,000
- Revenue - Water Utilities: $10,258,000
Water Utilities: $6,532,000
- Sinking Funds - Cash and Securities: $67,616,000
Cash and Securities: $29,892,000
- State Intergovernmental - Other: $319,622,000
Other: $275,373,000
Public Welfare: $242,655,000
Public Welfare: $230,095,000
Health and Hospitals: $174,421,000
Education: $148,949,000
Education: $131,777,000
Health and Hospitals: $115,639,000
Highways: $31,096,000
Highways: $18,397,000
General Local Government Support: $2,571,000
General Local Government Support: $2,337,000
Water Utilities: $3,000
Water Utilities: $3,000
Sewerage: $1,000
Sewerage: $1,000
- Tax - Property: $292,502,000
Property: $266,679,000
General Sales and Gross Receipts: $27,360,000
General Sales and Gross Receipts: $21,077,000
Other: $11,572,000
Other: $10,796,000
Occupation and Business License - Other: $6,155,000
Documentary and Stock Transfer: $4,550,000
Documentary and Stock Transfer: $4,422,000
Occupation and Business License - Other: $4,363,000
Public Utilities Sales: $3,518,000
Public Utilities Sales: $3,058,000
Other License: $1,845,000
Other License: $1,774,000
Other Selective Sales: $700,000
Other Selective Sales: $594,000
- Total Salaries and Wages: $83,338,000
: $71,210,000
- Water Utilities - Interest on Debt: $4,281,000
Interest on Debt: $2,428,000
San Joaquin County government finances - Debt in 2018:
- Assistance and Subsidies - Public Welfare, Cash Assistance Programs - Other: $230,985,000
Public Welfare, Cash Assistance Programs - Other: $191,467,000
- Bond Funds - Cash and Securities: $5,740,000
Cash and Securities: $2,678,000
- Charges - Hospital Public: $365,278,000
Hospital Public: $335,472,000
Other: $172,052,000
Other: $159,378,000
Solid Waste Management: $34,975,000
Elementary and Secondary Education - Other: $31,835,000
Solid Waste Management: $31,501,000
Elementary and Secondary Education - Other: $29,178,000
Sewerage: $6,862,000
Sewerage: $4,334,000
Air Transportation: $4,278,000
Air Transportation: $3,946,000
Natural Resources - Other: $2,381,000
Natural Resources - Other: $2,339,000
Parks and Recreation: $2,010,000
Parks and Recreation: $1,442,000
Regular Highways: $188,000
Regular Highways: $75,000
Elementary and Secondary Education School Lunch: $35,000
Elementary and Secondary Education School Lunch: $31,000
- Construction - Regular Highways: $25,582,000
Hospitals: $20,700,000
Hospitals: $20,550,000
Elementary and Secondary Education: $17,358,000
Elementary and Secondary Education: $6,680,000
Natural Resources - Other: $1,126,000
General - Other: $47,000
General - Other: $44,000
Parks and Recreation: $24,000
- Current Operations - Hospitals: $344,380,000
Hospitals: $306,771,000
Health - Other: $226,013,000
Elementary and Secondary Education: $193,938,000
Health - Other: $187,787,000
Elementary and Secondary Education: $170,988,000
Public Welfare - Other: $147,171,000
Public Welfare - Other: $136,881,000
Police Protection: $70,425,000
Judicial and Legal Services: $69,879,000
Judicial and Legal Services: $67,505,000
Correctional Institutions: $67,322,000
General - Other: $64,726,000
Police Protection: $63,165,000
Correctional Institutions: $60,188,000
General - Other: $58,652,000
Corrections - Other: $30,386,000
Solid Waste Management: $25,022,000
Regular Highways: $24,892,000
Corrections - Other: $24,763,000
Solid Waste Management: $20,965,000
Natural Resources - Other: $20,905,000
Regular Highways: $20,676,000
Central Staff Services: $17,890,000
Natural Resources - Other: $16,998,000
Financial Administration: $14,424,000
Financial Administration: $13,976,000
Central Staff Services: $9,848,000
Water Utilities: $8,704,000
Water Utilities: $7,863,000
Sewerage: $7,697,000
Sewerage: $7,382,000
Libraries: $5,708,000
Air Transportation: $5,053,000
Libraries: $5,050,000
Protective Inspection and Regulation - Other: $4,949,000
Parks and Recreation: $4,522,000
Parks and Recreation: $3,936,000
Air Transportation: $3,033,000
Protective Inspection and Regulation - Other: $197,000
Public Welfare, Vendor Payments for Other Purposes: $33,000
Public Welfare, Vendor Payments for Other Purposes: $31,000
- Federal Intergovernmental - Other: $56,835,000
Other: $28,418,000
Highways: $26,651,000
Highways: $25,254,000
Education: $24,604,000
Education: $23,106,000
Housing and Community Development: $13,235,000
Air Transportation: $1,542,000
Housing and Community Development: $1,501,000
Air Transportation: $1,281,000
General Local Government Support: $6,000
General Local Government Support: $6,000
- General - Interest on Debt: $14,966,000
Interest on Debt: $7,606,000
- Intergovernmental to Local - Other - Elementary and Secondary Education: $51,877,000
Other - Elementary and Secondary Education: $44,721,000
- Intergovernmental to State - Judicial and Legal Services: $9,205,000
Judicial and Legal Services: $8,702,000
- Local Intergovernmental - Education: $50,523,000
Education: $41,121,000
Other: $5,583,000
Housing and Community Development: $5,096,000
Housing and Community Development: $4,690,000
Other: $3,838,000
- Long Term Debt - Beginning Outstanding - Unspecified Public Purpose: $628,780,000
Beginning Outstanding - Unspecified Public Purpose: $595,760,000
Outstanding Unspecified Public Purpose: $595,745,000
Outstanding Unspecified Public Purpose: $555,666,000
Retired Unspecified Public Purpose: $47,296,000
Retired Unspecified Public Purpose: $45,897,000
Beginning Outstanding - Public Debt for Private Purpose: $37,225,000
Outstanding Nonguaranteed - Industrial Revenue: $34,325,000
Beginning Outstanding - Public Debt for Private Purpose: $31,425,000
Outstanding Nonguaranteed - Industrial Revenue: $28,525,000
Issue, Unspecified Public Purpose: $14,261,000
Issue, Unspecified Public Purpose: $5,804,000
Retired Nonguaranteed - Public Debt for Private Purpose: $2,900,000
Retired Nonguaranteed - Public Debt for Private Purpose: $2,900,000
- Miscellaneous - Special Assessments: $30,702,000
Special Assessments: $30,617,000
Interest Earnings: $28,003,000
General Revenue - Other: $14,245,000
General Revenue - Other: $14,239,000
Interest Earnings: $10,236,000
Fines and Forfeits: $5,941,000
Fines and Forfeits: $5,217,000
Rents: $1,550,000
Rents: $730,000
Royalties: $37,000
Royalties: $35,000
Sale of Property: $3,000
- Other Capital Outlay - Regular Highways: $28,887,000
General - Other: $9,321,000
General - Other: $9,256,000
General Public Building: $8,641,000
Police Protection: $6,921,000
Public Welfare - Other: $2,263,000
Elementary and Secondary Education: $2,119,000
Health - Other: $1,896,000
Air Transportation: $1,662,000
Air Transportation: $1,518,000
Elementary and Secondary Education: $1,236,000
Health - Other: $1,031,000
Public Welfare - Other: $815,000
Water Utilities: $704,000
Parks and Recreation: $700,000
Water Utilities: $648,000
Police Protection: $586,000
Central Staff Services: $224,000
Corrections - Other: $157,000
Judicial and Legal Services: $125,000
Protective Inspection and Regulation - Other: $78,000
Correctional Institutions: $57,000
Sewerage: $48,000
Regular Highways: $31,000
Sewerage: $29,000
Financial Administration: $18,000
Parks and Recreation: $14,000
Solid Waste Management: $8,000
Solid Waste Management: $8,000
- Other Funds - Cash and Securities: $1,566,596,000
Cash and Securities: $417,978,000
- Revenue - Water Utilities: $10,258,000
Water Utilities: $6,532,000
- Sinking Funds - Cash and Securities: $67,616,000
Cash and Securities: $29,892,000
- State Intergovernmental - Other: $319,622,000
Other: $275,373,000
Public Welfare: $242,655,000
Public Welfare: $230,095,000
Health and Hospitals: $174,421,000
Education: $148,949,000
Education: $131,777,000
Health and Hospitals: $115,639,000
Highways: $31,096,000
Highways: $18,397,000
General Local Government Support: $2,571,000
General Local Government Support: $2,337,000
Water Utilities: $3,000
Water Utilities: $3,000
Sewerage: $1,000
Sewerage: $1,000
- Tax - Property: $292,502,000
Property: $266,679,000
General Sales and Gross Receipts: $27,360,000
General Sales and Gross Receipts: $21,077,000
Other: $11,572,000
Other: $10,796,000
Occupation and Business License - Other: $6,155,000
Documentary and Stock Transfer: $4,550,000
Documentary and Stock Transfer: $4,422,000
Occupation and Business License - Other: $4,363,000
Public Utilities Sales: $3,518,000
Public Utilities Sales: $3,058,000
Other License: $1,845,000
Other License: $1,774,000
Other Selective Sales: $700,000
Other Selective Sales: $594,000
- Total Salaries and Wages: $83,338,000
: $71,210,000
- Water Utilities - Interest on Debt: $4,281,000
Interest on Debt: $2,428,000
San Joaquin County government finances - Cash and Securities in 2018:
- Assistance and Subsidies - Public Welfare, Cash Assistance Programs - Other: $230,985,000
Public Welfare, Cash Assistance Programs - Other: $191,467,000
- Bond Funds - Cash and Securities: $5,740,000
Cash and Securities: $2,678,000
- Charges - Hospital Public: $365,278,000
Hospital Public: $335,472,000
Other: $172,052,000
Other: $159,378,000
Solid Waste Management: $34,975,000
Elementary and Secondary Education - Other: $31,835,000
Solid Waste Management: $31,501,000
Elementary and Secondary Education - Other: $29,178,000
Sewerage: $6,862,000
Sewerage: $4,334,000
Air Transportation: $4,278,000
Air Transportation: $3,946,000
Natural Resources - Other: $2,381,000
Natural Resources - Other: $2,339,000
Parks and Recreation: $2,010,000
Parks and Recreation: $1,442,000
Regular Highways: $188,000
Regular Highways: $75,000
Elementary and Secondary Education School Lunch: $35,000
Elementary and Secondary Education School Lunch: $31,000
- Construction - Regular Highways: $25,582,000
Hospitals: $20,700,000
Hospitals: $20,550,000
Elementary and Secondary Education: $17,358,000
Elementary and Secondary Education: $6,680,000
Natural Resources - Other: $1,126,000
General - Other: $47,000
General - Other: $44,000
Parks and Recreation: $24,000
- Current Operations - Hospitals: $344,380,000
Hospitals: $306,771,000
Health - Other: $226,013,000
Elementary and Secondary Education: $193,938,000
Health - Other: $187,787,000
Elementary and Secondary Education: $170,988,000
Public Welfare - Other: $147,171,000
Public Welfare - Other: $136,881,000
Police Protection: $70,425,000
Judicial and Legal Services: $69,879,000
Judicial and Legal Services: $67,505,000
Correctional Institutions: $67,322,000
General - Other: $64,726,000
Police Protection: $63,165,000
Correctional Institutions: $60,188,000
General - Other: $58,652,000
Corrections - Other: $30,386,000
Solid Waste Management: $25,022,000
Regular Highways: $24,892,000
Corrections - Other: $24,763,000
Solid Waste Management: $20,965,000
Natural Resources - Other: $20,905,000
Regular Highways: $20,676,000
Central Staff Services: $17,890,000
Natural Resources - Other: $16,998,000
Financial Administration: $14,424,000
Financial Administration: $13,976,000
Central Staff Services: $9,848,000
Water Utilities: $8,704,000
Water Utilities: $7,863,000
Sewerage: $7,697,000
Sewerage: $7,382,000
Libraries: $5,708,000
Air Transportation: $5,053,000
Libraries: $5,050,000
Protective Inspection and Regulation - Other: $4,949,000
Parks and Recreation: $4,522,000
Parks and Recreation: $3,936,000
Air Transportation: $3,033,000
Protective Inspection and Regulation - Other: $197,000
Public Welfare, Vendor Payments for Other Purposes: $33,000
Public Welfare, Vendor Payments for Other Purposes: $31,000
- Federal Intergovernmental - Other: $56,835,000
Other: $28,418,000
Highways: $26,651,000
Highways: $25,254,000
Education: $24,604,000
Education: $23,106,000
Housing and Community Development: $13,235,000
Air Transportation: $1,542,000
Housing and Community Development: $1,501,000
Air Transportation: $1,281,000
General Local Government Support: $6,000
General Local Government Support: $6,000
- General - Interest on Debt: $14,966,000
Interest on Debt: $7,606,000
- Intergovernmental to Local - Other - Elementary and Secondary Education: $51,877,000
Other - Elementary and Secondary Education: $44,721,000
- Intergovernmental to State - Judicial and Legal Services: $9,205,000
Judicial and Legal Services: $8,702,000
- Local Intergovernmental - Education: $50,523,000
Education: $41,121,000
Other: $5,583,000
Housing and Community Development: $5,096,000
Housing and Community Development: $4,690,000
Other: $3,838,000
- Long Term Debt - Beginning Outstanding - Unspecified Public Purpose: $628,780,000
Beginning Outstanding - Unspecified Public Purpose: $595,760,000
Outstanding Unspecified Public Purpose: $595,745,000
Outstanding Unspecified Public Purpose: $555,666,000
Retired Unspecified Public Purpose: $47,296,000
Retired Unspecified Public Purpose: $45,897,000
Beginning Outstanding - Public Debt for Private Purpose: $37,225,000
Outstanding Nonguaranteed - Industrial Revenue: $34,325,000
Beginning Outstanding - Public Debt for Private Purpose: $31,425,000
Outstanding Nonguaranteed - Industrial Revenue: $28,525,000
Issue, Unspecified Public Purpose: $14,261,000
Issue, Unspecified Public Purpose: $5,804,000
Retired Nonguaranteed - Public Debt for Private Purpose: $2,900,000
Retired Nonguaranteed - Public Debt for Private Purpose: $2,900,000
- Miscellaneous - Special Assessments: $30,702,000
Special Assessments: $30,617,000
Interest Earnings: $28,003,000
General Revenue - Other: $14,245,000
General Revenue - Other: $14,239,000
Interest Earnings: $10,236,000
Fines and Forfeits: $5,941,000
Fines and Forfeits: $5,217,000
Rents: $1,550,000
Rents: $730,000
Royalties: $37,000
Royalties: $35,000
Sale of Property: $3,000
- Other Capital Outlay - Regular Highways: $28,887,000
General - Other: $9,321,000
General - Other: $9,256,000
General Public Building: $8,641,000
Police Protection: $6,921,000
Public Welfare - Other: $2,263,000
Elementary and Secondary Education: $2,119,000
Health - Other: $1,896,000
Air Transportation: $1,662,000
Air Transportation: $1,518,000
Elementary and Secondary Education: $1,236,000
Health - Other: $1,031,000
Public Welfare - Other: $815,000
Water Utilities: $704,000
Parks and Recreation: $700,000
Water Utilities: $648,000
Police Protection: $586,000
Central Staff Services: $224,000
Corrections - Other: $157,000
Judicial and Legal Services: $125,000
Protective Inspection and Regulation - Other: $78,000
Correctional Institutions: $57,000
Sewerage: $48,000
Regular Highways: $31,000
Sewerage: $29,000
Financial Administration: $18,000
Parks and Recreation: $14,000
Solid Waste Management: $8,000
Solid Waste Management: $8,000
- Other Funds - Cash and Securities: $1,566,596,000
Cash and Securities: $417,978,000
- Revenue - Water Utilities: $10,258,000
Water Utilities: $6,532,000
- Sinking Funds - Cash and Securities: $67,616,000
Cash and Securities: $29,892,000
- State Intergovernmental - Other: $319,622,000
Other: $275,373,000
Public Welfare: $242,655,000
Public Welfare: $230,095,000
Health and Hospitals: $174,421,000
Education: $148,949,000
Education: $131,777,000
Health and Hospitals: $115,639,000
Highways: $31,096,000
Highways: $18,397,000
General Local Government Support: $2,571,000
General Local Government Support: $2,337,000
Water Utilities: $3,000
Water Utilities: $3,000
Sewerage: $1,000
Sewerage: $1,000
- Tax - Property: $292,502,000
Property: $266,679,000
General Sales and Gross Receipts: $27,360,000
General Sales and Gross Receipts: $21,077,000
Other: $11,572,000
Other: $10,796,000
Occupation and Business License - Other: $6,155,000
Documentary and Stock Transfer: $4,550,000
Documentary and Stock Transfer: $4,422,000
Occupation and Business License - Other: $4,363,000
Public Utilities Sales: $3,518,000
Public Utilities Sales: $3,058,000
Other License: $1,845,000
Other License: $1,774,000
Other Selective Sales: $700,000
Other Selective Sales: $594,000
- Total Salaries and Wages: $83,338,000
: $71,210,000
- Water Utilities - Interest on Debt: $4,281,000
Interest on Debt: $2,428,000
Supplemental Security Income (SSI) in 2006:
- Total number of recipients: 28,219
- Number of aged recipients: 5,071
- Number of blind and disabled recipients: 23,148
- Number of recipients under 18: 3,085
- Number of recipients between 18 and 64: 16,395
- Number of recipients older than 64: 8,739
- Number of recipients also receiving OASDI: 10,636
- Amount of payments (thousands of dollars): 17,265
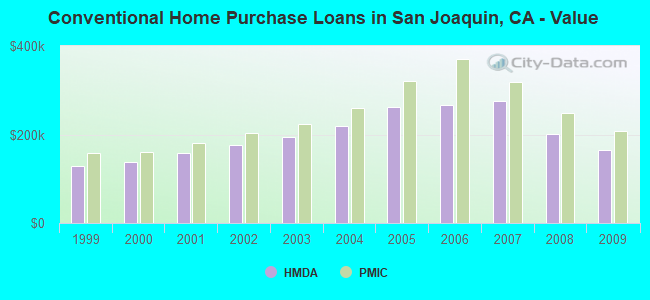
| Home Mortgage Disclosure Act Aggregated Statistics For Year 2009 (Based on 121 full tracts) | ||||||||||||||
| A) FHA, FSA/RHS & VA Home Purchase Loans | B) Conventional Home Purchase Loans | C) Refinancings | D) Home Improvement Loans | E) Loans on Dwellings For 5+ Families | F) Non-occupant Loans on < 5 Family Dwellings (A B C & D) | G) Loans On Manufactured Home Dwelling (A B C & D) | ||||||||
|---|---|---|---|---|---|---|---|---|---|---|---|---|---|---|
| Number | Average Value | Number | Average Value | Number | Average Value | Number | Average Value | Number | Average Value | Number | Average Value | Number | Average Value | |
| LOANS ORIGINATED | 5,203 | $186,227 | 4,292 | $165,664 | 5,193 | $219,284 | 263 | $110,825 | 29 | $2,359,793 | 1,867 | $135,450 | 26 | $138,038 |
| APPLICATIONS APPROVED, NOT ACCEPTED | 435 | $190,324 | 540 | $168,563 | 699 | $226,989 | 40 | $88,150 | 1 | $1,125,000 | 238 | $138,067 | 9 | $117,333 |
| APPLICATIONS DENIED | 942 | $191,387 | 1,158 | $165,797 | 3,245 | $231,320 | 288 | $67,990 | 8 | $520,250 | 712 | $137,298 | 77 | $110,662 |
| APPLICATIONS WITHDRAWN | 771 | $181,520 | 705 | $167,518 | 1,824 | $217,132 | 126 | $95,238 | 5 | $609,200 | 371 | $129,350 | 19 | $138,947 |
| FILES CLOSED FOR INCOMPLETENESS | 194 | $187,191 | 179 | $173,838 | 639 | $225,127 | 29 | $135,069 | 0 | $0 | 109 | $148,982 | 3 | $73,000 |
| Private Mortgage Insurance Companies Aggregated Statistics For Year 2009 (Based on 107 full tracts) | ||||||
| A) Conventional Home Purchase Loans | B) Refinancings | C) Non-occupant Loans on < 5 Family Dwellings (A & B) | ||||
|---|---|---|---|---|---|---|
| Number | Average Value | Number | Average Value | Number | Average Value | |
| LOANS ORIGINATED | 575 | $207,610 | 66 | $257,030 | 9 | $164,444 |
| APPLICATIONS APPROVED, NOT ACCEPTED | 265 | $230,468 | 62 | $284,274 | 10 | $179,600 |
| APPLICATIONS DENIED | 126 | $203,825 | 34 | $274,824 | 5 | $185,600 |
| APPLICATIONS WITHDRAWN | 38 | $199,263 | 11 | $286,364 | 1 | $119,000 |
| FILES CLOSED FOR INCOMPLETENESS | 35 | $232,057 | 8 | $250,500 | 1 | $131,000 |
| Most common first names in San Joaquin County, CA among deceased individuals | ||
| Name | Count | Lived (average) |
|---|---|---|
| John | 2,782 | 74.8 years |
| Mary | 2,091 | 79.0 years |
| William | 1,979 | 73.8 years |
| James | 1,732 | 72.0 years |
| Robert | 1,712 | 70.0 years |
| George | 1,277 | 75.9 years |
| Charles | 1,180 | 74.8 years |
| Frank | 1,091 | 75.7 years |
| Joseph | 927 | 74.3 years |
| Helen | 888 | 79.3 years |
| Most common last names in San Joaquin County, CA among deceased individuals | ||
| Last name | Count | Lived (average) |
|---|---|---|
| Smith | 989 | 74.0 years |
| Johnson | 715 | 74.4 years |
| Williams | 572 | 74.9 years |
| Brown | 508 | 73.4 years |
| Jones | 478 | 72.9 years |
| Miller | 459 | 76.4 years |
| Wilson | 359 | 73.0 years |
| Davis | 358 | 73.5 years |
| Martin | 353 | 73.0 years |
| Garcia | 350 | 71.4 years |
| Businesses in San Joaquin County, CA | ||||
| Name | Count | Name | Count | |
|---|---|---|---|---|
| 24 Hour Fitness | 2 | Knights Inn | 2 | |
| 7-Eleven | 13 | Kohl's | 3 | |
| 99 Cents Only Stores | 4 | Kroger | 13 | |
| AT&T | 12 | La Quinta | 2 | |
| Ace Hardware | 5 | La-Z-Boy | 1 | |
| Aeropostale | 2 | Lane Bryant | 3 | |
| American Eagle Outfitters | 2 | Lane Furniture | 9 | |
| Ann Taylor | 1 | LensCrafters | 1 | |
| Applebee's | 4 | Levi Strauss & Co. | 1 | |
| Arby's | 3 | Little Caesars Pizza | 10 | |
| AutoZone | 8 | Long John Silver's | 3 | |
| Avenue | 1 | Lowe's | 3 | |
| Baja Fresh Mexican Grill | 1 | Macy's | 2 | |
| Barnes & Noble | 2 | Marriott | 2 | |
| Baskin-Robbins | 12 | Marshalls | 3 | |
| Bath & Body Works | 3 | MasterBrand Cabinets | 6 | |
| Bed Bath & Beyond | 2 | Maurices | 2 | |
| Best Western | 5 | Mazda | 2 | |
| Big O Tires | 2 | McDonald's | 29 | |
| Blockbuster | 5 | Men's Wearhouse | 1 | |
| Budget Car Rental | 2 | Microtel | 2 | |
| Buffalo Wild Wings | 1 | Motel 6 | 5 | |
| Burger King | 15 | Motherhood Maternity | 4 | |
| CVS | 10 | New Balance | 7 | |
| Carl\s Jr. | 13 | New York & Co | 1 | |
| Casual Male XL | 2 | Nike | 18 | |
| Catherines | 1 | Nissan | 2 | |
| Charlotte Russe | 1 | Office Depot | 2 | |
| Chevrolet | 3 | OfficeMax | 3 | |
| Chico's | 1 | Old Navy | 2 | |
| Chipotle | 2 | Olive Garden | 2 | |
| Chuck E. Cheese's | 1 | Outback | 1 | |
| Church's Chicken | 2 | Outback Steakhouse | 1 | |
| Cinnabon | 1 | Pac Sun | 2 | |
| Circle K | 3 | Panda Express | 7 | |
| Cold Stone Creamery | 4 | Panera Bread | 2 | |
| Coldwater Creek | 1 | Papa John's Pizza | 1 | |
| Comfort Inn | 3 | Payless | 9 | |
| Costco | 3 | Penske | 7 | |
| Curves | 6 | PetSmart | 3 | |
| DHL | 8 | Pier 1 Imports | 3 | |
| Dairy Queen | 4 | Pizza Hut | 4 | |
| Days Inn | 2 | Popeyes | 3 | |
| Decora Cabinetry | 1 | Quality | 3 | |
| Dennys | 11 | Quiznos | 6 | |
| Discount Tire | 4 | RadioShack | 9 | |
| Domino's Pizza | 4 | Red Lobster | 1 | |
| DressBarn | 2 | Red Robin | 1 | |
| Dressbarn | 2 | Red Roof Inn | 1 | |
| El Pollo Loco | 3 | Rite Aid | 9 | |
| Express | 1 | Rue21 | 2 | |
| Extended Stay America | 2 | Ryder Rental & Truck Leasing | 1 | |
| Famous Footwear | 4 | SAS Shoes | 2 | |
| Fashion Bug | 1 | SONIC Drive-In | 3 | |
| FedEx | 58 | Safeway | 3 | |
| Finish Line | 2 | Sears | 6 | |
| Firestone Complete Auto Care | 1 | Sephora | 2 | |
| Foot Locker | 3 | Skechers USA | 1 | |
| Ford | 4 | Spencer Gifts | 1 | |
| Forever 21 | 1 | Sprint Nextel | 5 | |
| Fredericks Of Hollywood | 1 | Staples | 3 | |
| GNC | 11 | Starbucks | 35 | |
| GameStop | 9 | Subway | 49 | |
| Gap | 2 | T-Mobile | 21 | |
| Goodwill | 3 | T.J.Maxx | 2 | |
| Gymboree | 1 | Taco Bell | 22 | |
| H&R Block | 20 | Talbots | 1 | |
| Haworth | 1 | Target | 6 | |
| Hilton | 6 | The Room Place | 3 | |
| Holiday Inn | 4 | Torrid | 2 | |
| Hollister Co. | 1 | Toyota | 3 | |
| Home Depot | 4 | Toys"R"Us | 4 | |
| HomeTown Buffet | 2 | Trader Joe's | 1 | |
| Honda | 3 | True Value | 2 | |
| Hot Topic | 2 | U-Haul | 17 | |
| Howard Johnson | 1 | UPS | 71 | |
| IHOP | 4 | Vans | 11 | |
| J. Jill | 1 | Verizon Wireless | 4 | |
| JCPenney | 4 | Victoria's Secret | 3 | |
| Jack In The Box | 18 | Volkswagen | 2 | |
| Jamba Juice | 7 | Vons | 5 | |
| JoS. A. Bank | 1 | Walgreens | 10 | |
| Jones New York | 15 | Walmart | 4 | |
| Journeys | 2 | Wendy's | 8 | |
| Justice | 2 | World Gym | 1 | |
| KFC | 13 | YMCA | 1 | |
| Kmart | 3 | |||
San Joaquin County on our top lists:
- #12 on the list of "Top 101 counties with the highest lead air pollution readings in 2012 (µg/m3)"
- #16 on the list of "Top 101 counties with the lowest lead air pollution readings in 2012 (µg/m3)"
- #31 on the list of "Top 101 counties with the highest Particulate Matter (PM2.5) Annual air pollution readings in 2012 (µg/m3)"
- #38 on the list of "Top 101 counties with the highest ground withdrawal of fresh water for public supply"
- #38 on the list of "Top 101 counties with the highest ground withdrawal of fresh water for public supply (pop. 50,000+)"
- #46 on the list of "Top 101 counties with the lowest Ozone (1-hour) air pollution readings in 2012 (ppm)"
- #52 on the list of "Top 101 counties with the highest Particulate Matter (PM10) Annual air pollution readings in 2012 (µg/m3)"
- #53 on the list of "Top 101 counties with the highest carbon monoxide air pollution readings in 2012 (ppm)"
- #72 on the list of "Top 101 counties with the highest number of births per 1000 residents 2007-2013"
- #72 on the list of "Top 101 counties with the highest number of births per 1000 residents 2007-2013 (pop 50,000+)"
- #75 on the list of "Top 101 counties with the most Catholic adherents"
- #75 on the list of "Top 101 counties with the most Catholic adherents (pop. 50,000+)"
- #75 on the list of "Top 101 counties with the most Evangelical Protestant congregations (pop. 50,000+)"
- #76 on the list of "Top 101 counties with the most Evangelical Protestant congregations"
- #78 on the list of "Top 101 counties with the most Other adherents (pop. 50,000+)"
- #81 on the list of "Top 101 counties with the highest total withdrawal of fresh water for public supply (pop. 50,000+)"
- #81 on the list of "Top 101 counties with the most Other adherents"
- #83 on the list of "Top 101 counties with the highest total withdrawal of fresh water for public supply"
- #87 on the list of "Top 101 counties with the highest Nitrogen Dioxide air pollution readings in 2012 (ppm)"
- #93 on the list of "Top 101 counties with the most Other congregations (pop. 50,000+)"