Contra Costa County, California (CA)
County owner-occupied free and clear houses and condos in 2010: 49,083
County owner-occupied houses and condos in 2000: 238,413
Renter-occupied apartments: 123,460 (it was 105,716 in 2000)
| % of renters here: | 31% |
| State: | 44% |
Land area: 720 sq. mi.
Water area: 82.2 sq. mi.
Population density: 1607 people per square mile (very high).
Industries providing employment: Educational, health and social services (22.2%), Professional, scientific, management, administrative, and waste management services (17.8%), Retail trade (10.8%).
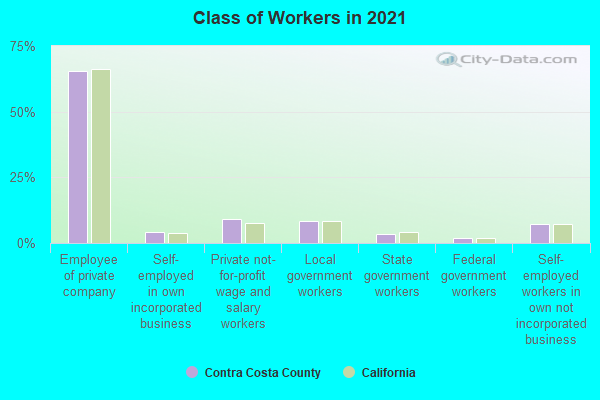
Type of workers:
- Private wage or salary: 77%
- Government: 15%
- Self-employed, not incorporated: 7%
- Unpaid family work: 0%
- OSM Map
- General Map
- Google Map
- MSN Map

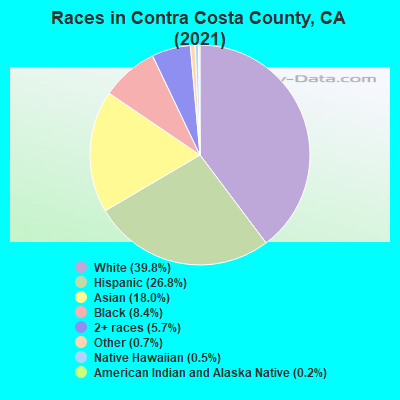
- 444,48938.4%White Non-Hispanic Alone
- 311,80827.0%Hispanic or Latino
- 219,99219.0%Asian alone
- 96,1668.3%Black Non-Hispanic Alone
- 65,9295.7%Two or more races
- 11,2701.0%Some other race alone
- 5,5220.5%Native Hawaiian and Other
Pacific Islander alone - 1,7900.2%American Indian and Alaska Native alone
| Median resident age: | 40.5 years |
| California median age: | 37.9 years |
| Males: 569,707 | |
| Females: 587,259 |

 | Where Do Foodies Of East Contra Costa County Hangout? (1 reply) |
| Don’t make $235,000? Good luck buying a home in the Bay Area (106 replies) |
| San Joaquin Valley Gentrification thread(Fresno, Merced, Stockton, Bakersfield) (340 replies) |
| Coronavirus (12544 replies) |
| They Said the Recall Was Going To Be A Circus... (906 replies) |
| Demographics and changes in the outer East Bay (675 replies) |
| Contra Costa County: | 2.0 people |
| California: | 3 people |
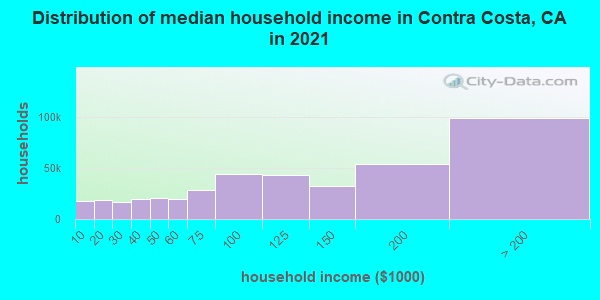
Estimated median household income in 2022: $120,061 ($63,675 in 1999)
| This county: | $120,061 |
| California: | $91,551 |
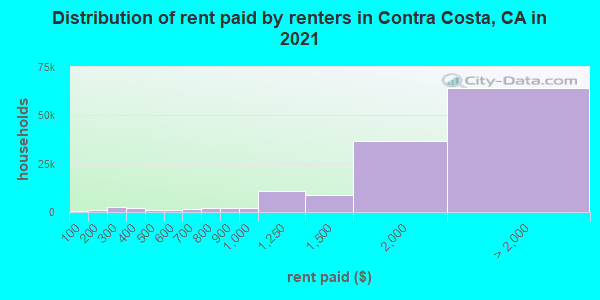
Median contract rent in 2022 for apartments: $1,971 (lower quartile is $1,514, upper quartile is $2,630)
| This county: | $1971 |
| State: | $1719 |
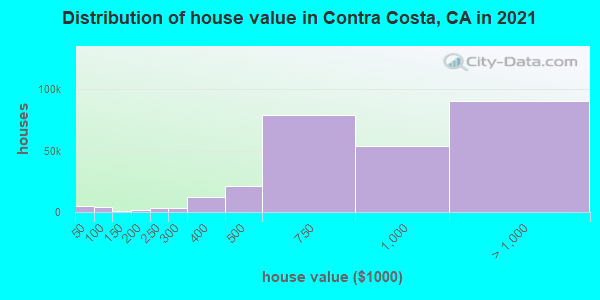
Estimated median house or condo value in 2022: $865,800 (it was $253,800 in 2000)
| Contra Costa: | $865,800 |
| California: | $715,900 |
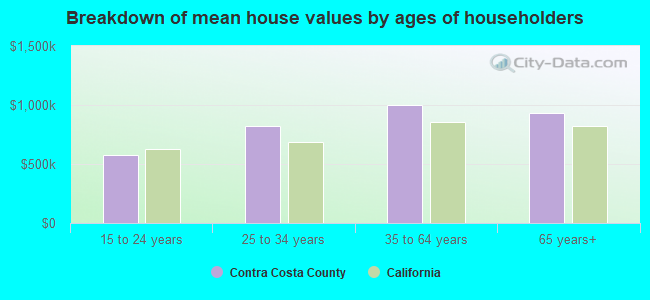
Mean price in 2022:
Median monthly housing costs for homes and condos with a mortgage: $3,107Detached houses: $1,180,100
Here: $1,180,100 State: $988,808 Townhouses or other attached units: $865,348
Here: $865,348 State: $838,546 In 2-unit structures: $602,949
Here: $602,949 State: $1,138,100 In 3-to-4-unit structures: $772,223
Here: $772,223 State: $824,253 In 5-or-more-unit structures: $695,046
Here: $695,046 State: $730,996 Mobile homes: $193,193
Here: $193,193 State: $184,506 Occupied boats, RVs, vans, etc.: $261,954
Here: $261,954 State: $204,957
Median monthly housing costs for units without a mortgage: $894
Institutionalized population: 5,346
Crime in 2020 (reported by the sheriff's office or county police, not the county total):
- Murders: 4
- Rapes: 14
- Robberies: 82
- Assaults: 198
- Burglaries: 304
- Thefts: 827
- Auto thefts: 47
Crime in 2019 (reported by the sheriff's office or county police, not the county total):
- Murders: 8
- Rapes: 28
- Robberies: 89
- Assaults: 207
- Burglaries: 411
- Thefts: 1053
- Auto thefts: 35
Health of residents in Contra Costa County based on CDC Behavioral Risk Factor Surveillance System Survey Questionnaires from 2003 to 2012:
General health status score of residents in this county from 1 (poor) to 5 (excellent) is 3.7. This is better than average.80.3% of residents exercised in the past month. This is about average.
42.5% of residents smoked 100+ cigarettes in their lives. This is about average.
87.8% of adult residents drank alcohol in the past 30 days. This is more than average.
80.2% of residents visited a dentist within the past year. This is more than average.
Average weight of males is 195 pounds. This is about average.
Average weight of females is 155 pounds. This is less than average.
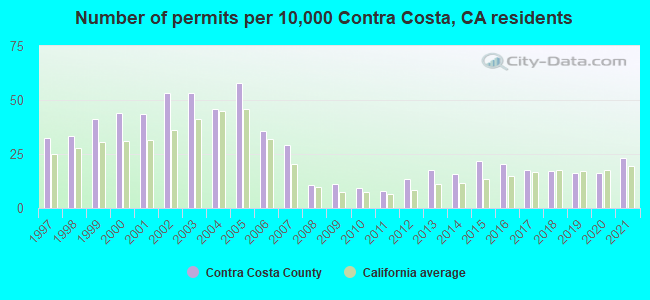
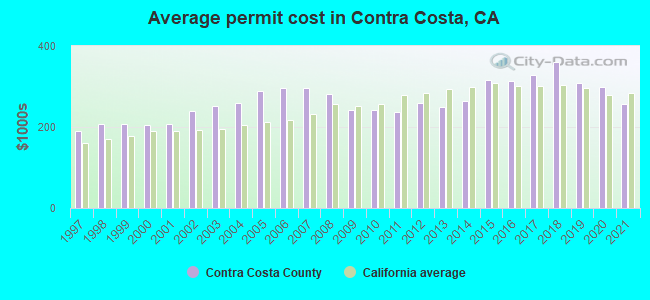
Single-family new house construction building permits:
- 2022: 1412 buildings, average cost: $280,500
- 2021: 2216 buildings, average cost: $256,200
- 2020: 1552 buildings, average cost: $298,200
- 2019: 1549 buildings, average cost: $308,200
- 2018: 1627 buildings, average cost: $361,200
- 2017: 1683 buildings, average cost: $327,800
- 2016: 1924 buildings, average cost: $313,600
- 2015: 2072 buildings, average cost: $317,400
- 2014: 1503 buildings, average cost: $265,000
- 2013: 1681 buildings, average cost: $249,700
- 2012: 1268 buildings, average cost: $258,500
- 2011: 729 buildings, average cost: $235,700
- 2010: 890 buildings, average cost: $243,200
- 2009: 1076 buildings, average cost: $240,500
- 2008: 1023 buildings, average cost: $280,700
- 2007: 2753 buildings, average cost: $297,100
- 2006: 3368 buildings, average cost: $296,100
- 2005: 5513 buildings, average cost: $288,700
- 2004: 4345 buildings, average cost: $259,700
- 2003: 5033 buildings, average cost: $252,000
- 2002: 5071 buildings, average cost: $238,900
- 2001: 4144 buildings, average cost: $206,600
- 2000: 4185 buildings, average cost: $204,900
- 1999: 3909 buildings, average cost: $206,600
- 1998: 3144 buildings, average cost: $206,900
- 1997: 3078 buildings, average cost: $190,600
Median real estate property taxes paid for housing units with mortgages in 2022: $7,416 (0.8%)
Median real estate property taxes paid for housing units with no mortgage in 2022: $5,047 (0.6%)
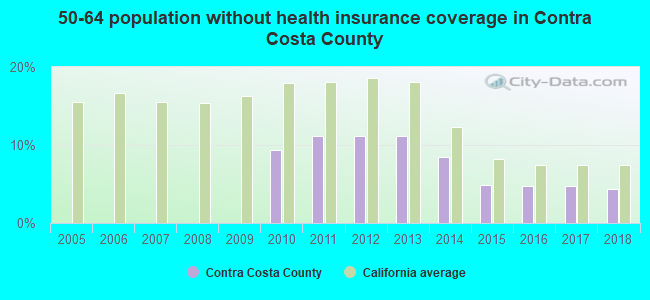
| Contra Costa County: | 8.7% |
| California: | 12.2% |
Median age of residents in 2022: 40.5 years old
(Males: 39.6 years old, Females: 41.6 years old)
(Median age for: White residents: 50.0 years old, Black residents: 38.3 years old, American Indian residents: 32.5 years old, Asian residents: 42.2 years old, Hispanic or Latino residents: 32.0 years old, Other race residents: 33.2 years old)
Area name: Oakland-Fremont, CA HUD Metro FMR Area
Fair market rent in 2006 for a 1-bedroom apartment in Contra Costa County is $1045 a month.
Fair market rent for a 2-bedroom apartment is $1238 a month.
Fair market rent for a 3-bedroom apartment is $1679 a month.
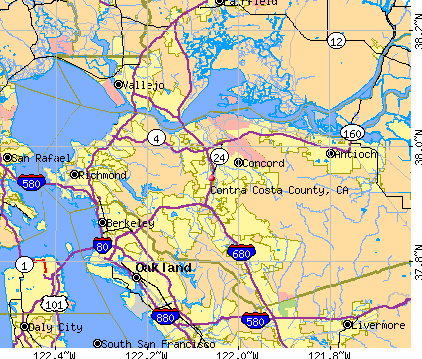
Cities in this county include: Central Contra Costa, West Contra Costa, Concord, Richmond, Antioch, East Contra Costa, Walnut Creek, Pittsburg, San Ramon, Danville.
| Zip code | City | Number of tests | Number of tests >= 4 pCi/L |
|---|---|---|---|
| 94506 | Danville | 19 | 1 |
| 94507 | Alamo | 5 | 0 |
| 94509 | Antioch | 8 | 0 |
| 94511 | Bethel Island | 2 | 0 |
| 94513 | Brentwood | 5 | 0 |
| 94514 | Byron | 8 | 0 |
| 94516 | Canyon | 2 | 0 |
| 94517 | Clayton | 6 | 0 |
| 94518 | Concord | 19 | 1 |
| 94519 | Concord | 5 | 0 |
| 94520 | Concord | 16 | 0 |
| 94521 | Concord | 17 | 3 |
| 94523 | Pleasant Hill | 25 | 1 |
| 94524 | Concord | 27 | 0 |
| 94525 | Crockett | 1 | 0 |
| 94526 | Danville | 41 | 0 |
| 94528 | Diablo | 3 | 0 |
| 94530 | El Cerrito | 20 | 0 |
| 94531 | Antioch | 2 | 0 |
| 94547 | Hercules | 7 | 0 |
| 94549 | Lafayette | 72 | 2 |
| 94553 | Martinez | 22 | 3 |
| 94556 | Moraga | 19 | 0 |
| 94561 | Oakley | 3 | 0 |
| 94563 | Orinda | 31 | 0 |
| 94564 | Pinole | 11 | 0 |
| 94565 | Pittsburg | 29 | 2 |
| 94583 | San Ramon | 40 | 3 |
| 94595 | Walnut Creek | 6 | 0 |
| 94596 | Walnut Creek | 36 | 1 |
| 94597 | Walnut Creek | 38 | 2 |
| 94598 | Walnut Creek | 27 | 3 |
| 94801 | Richmond | 5 | 0 |
| 94803 | El Sobrante | 7 | 0 |
| 94804 | Richmond | 31 | 0 |
| 94805 | Richmond | 10 | 1 |
| 94806 | San Pablo | 28 | 0 |
2023 air pollution in Contra Costa County:
Carbon Monoxide: 0.206 ppm (standard limit: 9 ppm). Near U.S. average.
Nitrogen Dioxide: 0.00 ppm (standard limit: 0.053 ppm). Below U.S. average.
Ozone (1-hour): 0.025 ppm (standard limit: 0.12 ppm). Below U.S. average.
Particulate Matter (PM2.5) Annual: 5.9 µg/m3(standard limit: 15.0 µg/m3). Near U.S. average.
Sulfur Oxides Annual: 0.001 ppm (standard limit: 0.03 ppm). Near U.S. average.
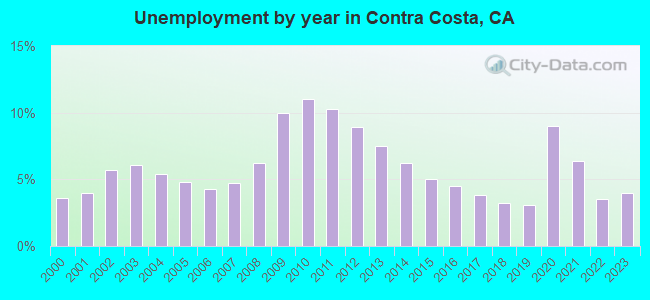
| Here: | 4.5% |
| California: | 5.1% |
Current college students: 61,975
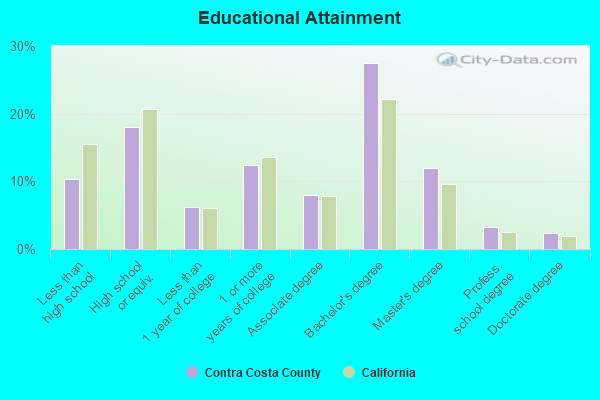
People 25 years of age or older with a high school degree or higher: 89.4%
People 25 years of age or older with a bachelor's degree or higher: 45.1%
Number of foreign born residents: 312,050 (59.8% naturalized citizens)
| Contra Costa County: | 27.0% |
| Whole state: | 26.7% |
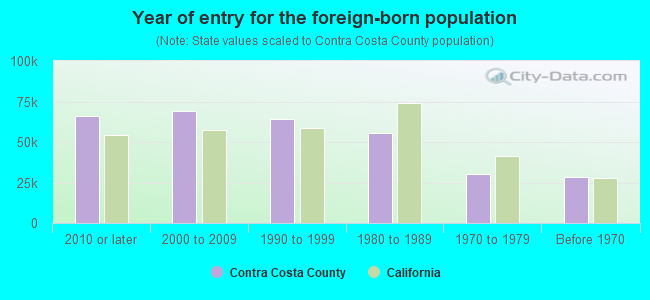
- Year of entry for the foreign-born population
- 81,2692010 or later
- 74,1002000 to 2009
- 63,2391990 to 1999
- 55,4141980 to 1989
- 30,4381970 to 1979
- 28,404Before 1970
Mean travel time to work (commute): " minutes
Percentage of county residents living and working in this county: 99.8%
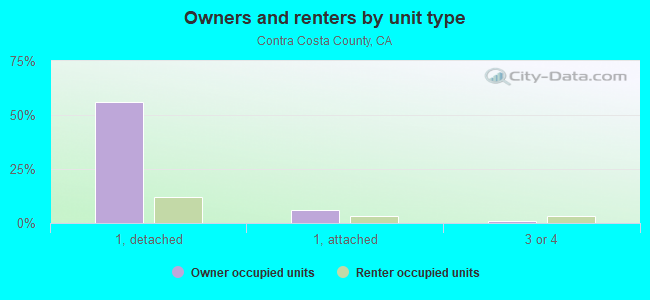
Housing units in structures:
- One, detached: 296,223
- One, attached: 34,385
- Two: 5,085
- 3 or 4: 18,399
- 5 to 9: 15,879
- 10 to 19: 12,141
- 20 to 49: 15,079
- 50 or more: 27,390
- Mobile homes: 5,017
- Boats, RVs, vans, etc.: 453
Housing units in Contra Costa County with a mortgage: 204,285 (23,214 second mortgage, 1,094 home equity loan, 20,041 both second mortgage and home equity loan)
Houses without a mortgage: 3,488
| Here: | 98.6% with mortgage |
| State: | 98.6% with mortgage |
Religion statistics for Contra Costa County


| Religion | Adherents | Congregations |
|---|---|---|
| Catholic | 228,400 | 34 |
| Evangelical Protestant | 81,120 | 352 |
| Other | 48,553 | 123 |
| Mainline Protestant | 32,693 | 101 |
| Black Protestant | 10,395 | 34 |
| Orthodox | 2,435 | 8 |
| None | 645,429 | - |
Source: Clifford Grammich, Kirk Hadaway, Richard Houseal, Dale E.Jones, Alexei Krindatch, Richie Stanley and Richard H.Taylor. 2012. 2010 U.S.Religion Census: Religious Congregations & Membership Study. Association of Statisticians of American Religious Bodies. Jones, Dale E., et al. 2002. Congregations and Membership in the United States 2000. Nashville, TN: Glenmary Research Center.
Food Environment Statistics:
| Contra Costa County: | 1.78 / 10,000 pop. |
| State: | 2.14 / 10,000 pop. |
| Here: | 0.05 / 10,000 pop. |
| California: | 0.04 / 10,000 pop. |
| This county: | 0.51 / 10,000 pop. |
| California: | 0.62 / 10,000 pop. |
| Contra Costa County: | 1.75 / 10,000 pop. |
| California: | 1.49 / 10,000 pop. |
| This county: | 6.73 / 10,000 pop. |
| State: | 7.42 / 10,000 pop. |
| Contra Costa County: | 7.1% |
| California: | 7.3% |
| Contra Costa County: | 22.2% |
| State: | 21.3% |
| Here: | 16.8% |
| State: | 17.9% |
Agriculture in Contra Costa County:
Average size of farms: 213 acresAverage value of agricultural products sold per farm: $152,383
Average value of crops sold per acre for harvested cropland: $3004.95
The value of nursery, greenhouse, floriculture, and sod as a percentage of the total market value of agricultural products sold: 46.69%
The value of livestock, poultry, and their products as a percentage of the total market value of agricultural products sold: 13.33%
Average total farm production expenses per farm: $119,609
Harvested cropland as a percentage of land in farms: 20.59%
Irrigated harvested cropland as a percentage of land in farms: 88.50%
Average market value of all machinery and equipment per farm: $47,274
The percentage of farms operated by a family or individual: 84.29%
Average age of principal farm operators: 58 years
Average number of cattle and calves per 100 acres of all land in farms: 16.45
Corn for grain: 3236 harvested acres
All wheat for grain: 1540 harvested acres
Vegetables: 6,141 harvested acres
Land in orchards: 5,821 acres
Earthquake activity:
Contra Costa County-area historical earthquake activity is significantly above California state average. It is 7680% greater than the overall U.S. average.On 4/18/1906 at 13:12:21, a magnitude 7.9 (7.9 UK, Class: Major, Intensity: VIII - XII) earthquake occurred 51.4 miles away from Contra Costa County center, causing $524,000,000 total damage
On 10/18/1989 at 00:04:15, a magnitude 7.1 (6.5 MB, 7.1 MS, 6.9 MW, 7.0 ML) earthquake occurred 59.7 miles away from the county center, causing 62 deaths (62 shaking deaths) and 3757 injuries, causing $1,305,032,704 total damage
On 11/4/1927 at 13:51:53, a magnitude 7.5 (7.5 UK) earthquake occurred 217.1 miles away from the county center
On 7/21/1952 at 11:52:14, a magnitude 7.7 (7.7 UK) earthquake occurred 265.3 miles away from the county center, causing $50,000,000 total damage
On 1/31/1922 at 13:17:28, a magnitude 7.6 (7.6 UK) earthquake occurred 267.0 miles away from Contra Costa County center
On 4/25/1992 at 18:06:04, a magnitude 7.2 (6.3 MB, 7.1 MS, 7.2 MW, 7.1 MW, Depth: 9.4 mi) earthquake occurred 198.3 miles away from the county center, causing $75,000,000 total damage
Magnitude types: body-wave magnitude (MB), local magnitude (ML), surface-wave magnitude (MS), moment magnitude (MW)
Most recent natural disasters:
- California Covid-19 Pandemic, Incident Period: January 20, 2020, FEMA Id: 4482, Natural disaster type: Other
- California Severe Winter Storms, Flooding, Mudslides, Incident Period: February 1, 2017 - February 23, 2017, FEMA Id: 4308, Natural disaster type: Winter Storm, Mudslide, Flood
- California Severe Winter Storms, Flooding, And Mudslides, Incident Period: January 18, 2017 - January 23, 2017, FEMA Id: 4305, Natural disaster type: Winter Storm, Mudslide, Flood
- California Severe Winter Storms, Flooding, And Mudslides, Incident Period: January 3, 2017 - January 12, 2017, FEMA Id: 4301, Natural disaster type: Winter Storm, Mudslide, Flood
- California Severe Storms, Flooding, Mudslides, and Landslides, Incident Period: December 17, 2005 to January 03, 2006, Major Disaster (Presidential) Declared DR-1628: February 03, 2006, FEMA Id: 1628, Natural disaster type: Storm, Mudslide, Landslide, Flood
- California Hurricane Katrina Evacuation, Incident Period: August 29, 2005 to October 01, 2005, Emergency Declared EM-3248: September 13, 2005, FEMA Id: 3248, Natural disaster type: Hurricane
- California Severe Winter Storms and Flooding, Incident Period: February 02, 1998 to April 30, 1998, Major Disaster (Presidential) Declared DR-1203: February 09, 1998, FEMA Id: 1203, Natural disaster type: Winter Storm, Flood
- California Severe Storms/Flooding, Incident Period: December 28, 1996 to April 01, 1997, Major Disaster (Presidential) Declared DR-1155: January 04, 1997, FEMA Id: 1155, Natural disaster type: Storm, Flood
- California Severe Winter Storms, Flooding, Landslides, Mud Flows, Incident Period: February 13, 1995 to April 19, 1995, Major Disaster (Presidential) Declared DR-1046: March 12, 1995, FEMA Id: 1046, Natural disaster type: Winter Storm, Landslide, Flood
- California Severe Winter Storms, Flooding, Landslides, Mud Flows, Incident Period: January 03, 1995 to February 10, 1995, Major Disaster (Presidential) Declared DR-1044: January 10, 1995, FEMA Id: 1044, Natural disaster type: Winter Storm, Landslide, Flood
- 8 other natural disasters have been reported since 1953.
The number of natural disasters in Contra Costa County (18) is near the US average (15).
Major Disasters (Presidential) Declared: 11
Emergencies Declared: 3
Causes of natural disasters: Floods: 13, Storms: 7, Winter Storms: 7, Mudslides: 5, Landslides: 4, Drought: 1, Earthquake: 1, Hurricane: 1, Tornado: 1, Wind: 1, Other: 1 (Note: some incidents may be assigned to more than one category).
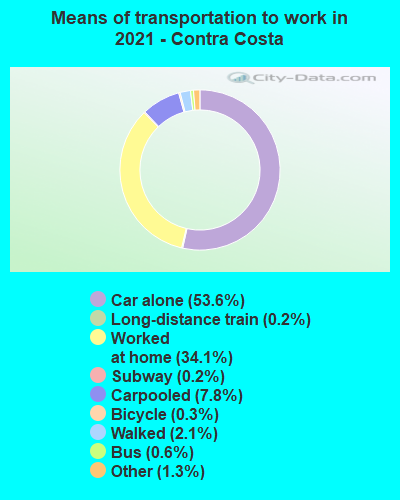
Means of transportation to work:
- Drove a car alone: 267,974 (59.0%)
- Carpooled: 44,139 (9.7%)
- Bus: 2,737 (0.6%)
- Subway or elevated rail: 1,681 (0.4%)
- Long-distance train or commuter rail: 709 (0.2%)
- Light rail, streetcar or trolley: 56 (0.0%)
- Ferryboat: 45 (0.0%)
- Taxicab, motorcycle, or other means: 6,665 (1.5%)
- Bicycle: 1,447 (0.3%)
- Walked: 13,605 (3.0%)
- Worked at home: 115,159 (25.4%)
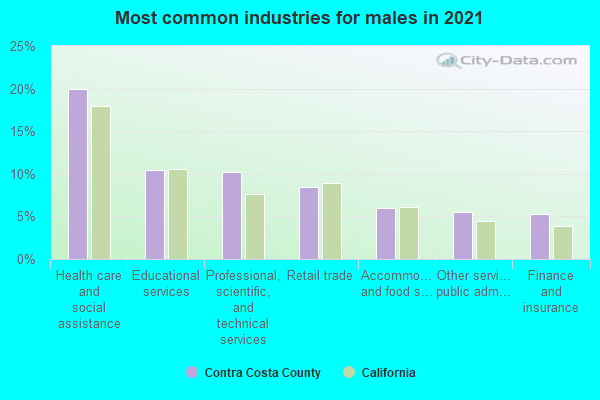
- Health care and social assistance (20%)
- Educational services (11%)
- Retail trade (10%)
- Professional, scientific, and technical services (9%)
- Accommodation and food services (5%)
- Other services, except public administration (5%)
- Finance and insurance (5%)
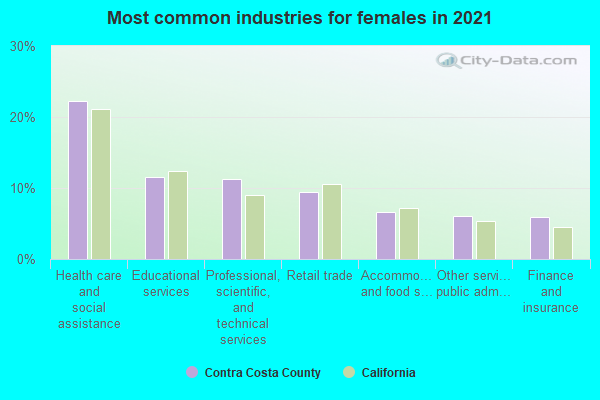
- Health care and social assistance (23%)
- Educational services (13%)
- Retail trade (11%)
- Professional, scientific, and technical services (11%)
- Accommodation and food services (6%)
- Other services, except public administration (6%)
- Finance and insurance (6%)
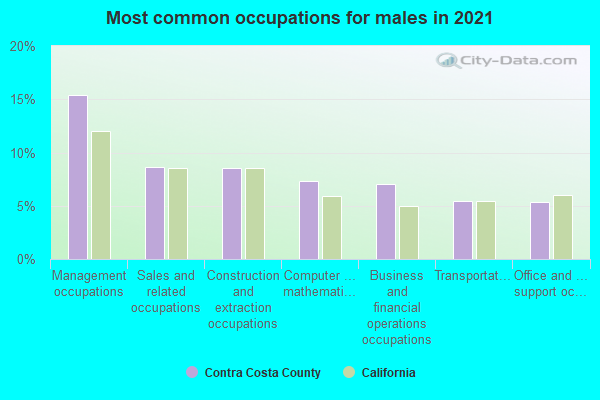
- Management occupations (16%)
- Sales and related occupations (10%)
- Construction and extraction occupations (9%)
- Computer and mathematical occupations (7%)
- Office and administrative support occupations (6%)
- Business and financial operations occupations (5%)
- Transportation occupations (5%)
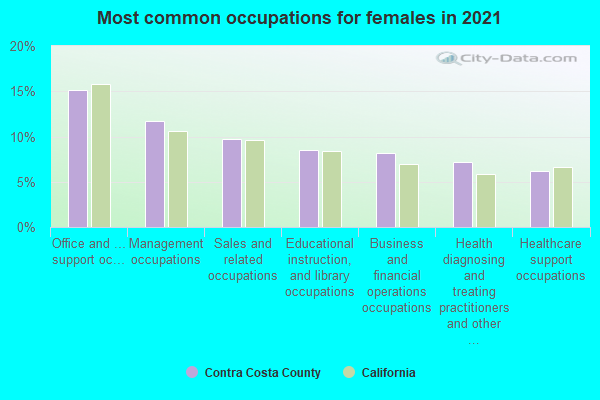
- Management occupations (13%)
- Office and administrative support occupations (13%)
- Sales and related occupations (11%)
- Educational instruction, and library occupations (10%)
- Business and financial operations occupations (9%)
- Health diagnosing and treating practitioners and other technical occupations (6%)
- Healthcare support occupations (6%)
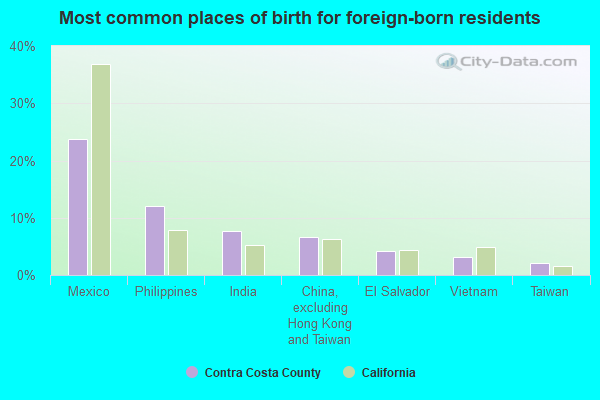
- Mexico (23%)
- Philippines (12%)
- India (9%)
- China, excluding Hong Kong and Taiwan (7%)
- El Salvador (5%)
- Vietnam (3%)
- Korea (2%)
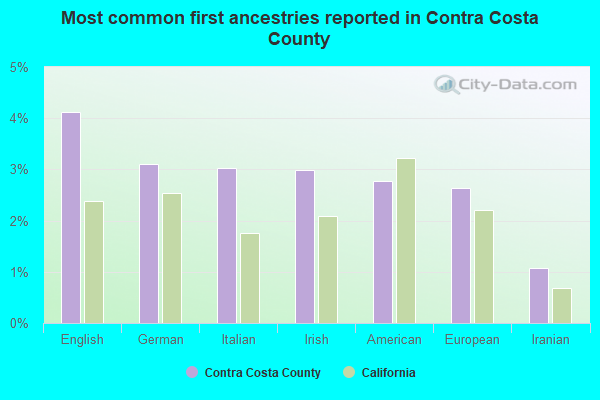
- English (4%)
- German (3%)
- Irish (3%)
- Italian (3%)
- European (3%)
- American (2%)
- Iranian (1%)
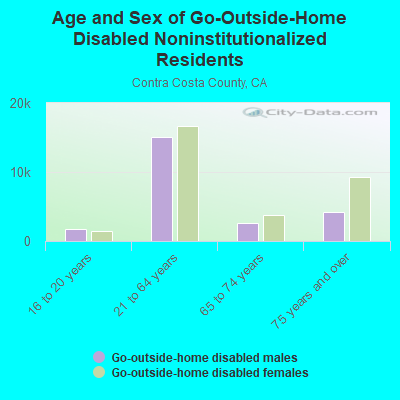
People in group quarters in Contra Costa County, California in 2010:
- 3,306 people in nursing facilities/skilled-nursing facilities
- 1,568 people in college/university student housing
- 1,368 people in local jails and other municipal confinement facilities
- 884 people in other noninstitutional facilities
- 782 people in group homes intended for adults
- 713 people in workers' group living quarters and job corps centers
- 616 people in emergency and transitional shelters (with sleeping facilities) for people experiencing homelessness
- 402 people in residential treatment centers for adults
- 304 people in correctional facilities intended for juveniles
- 218 people in group homes for juveniles (non-correctional)
- 84 people in federal detention centers
- 36 people in in-patient hospice facilities
- 21 people in residential treatment centers for juveniles (non-correctional)
- 7 people in residential schools for people with disabilities
- 3 people in maritime/merchant vessels
- 2 people in correctional residential facilities
People in group quarters in Contra Costa County, California in 2000:
- 3,106 people in other noninstitutional group quarters
- 3,081 people in nursing homes
- 1,626 people in local jails and other confinement facilities (including police lockups)
- 1,473 people in college dormitories (includes college quarters off campus)
- 400 people in other group homes
- 262 people in homes for the mentally retarded
- 213 people in homes or halfway houses for drug/alcohol abuse
- 180 people in short-term care, detention or diagnostic centers for delinquent children
- 146 people in agriculture workers' dormitories on farms
- 135 people in religious group quarters
- 124 people in homes for the mentally ill
- 100 people in training schools for juvenile delinquents
- 78 people in hospitals/wards and hospices for chronically ill
- 72 people in other hospitals or wards for chronically ill
- 67 people in homes for the physically handicapped
- 63 people in other nonhousehold living situations
- 46 people in mental (psychiatric) hospitals or wards
- 38 people in schools, hospitals, or wards for the intellectually disabled
- 35 people in halfway houses
- 31 people in institutions for the blind
- 25 people in hospitals or wards for drug/alcohol abuse
- 24 people in crews of maritime vessels
- 22 people in military barracks, etc.
- 19 people in homes for abused, dependent, and neglected children
- 17 people in residential treatment centers for emotionally disturbed children
- 16 people in unknown juvenile institutions
- 10 people in other workers' dormitories
- 6 people in hospices or homes for chronically ill
6.37% of this county's 2021 resident taxpayers lived in other counties in 2020 ($134,084 average adjusted gross income)
| Here: | 6.37% |
| California average: | 5.19% |
0.01% of residents moved from foreign countries ($98 average AGI)
Contra Costa County: 0.01% California average: 0.03%
5.25% relocated from other counties in California ($114,713 average AGI)
1.11% relocated from other states ($19,273 average AGI)
Contra Costa County: 1.11% California average: 1.56%
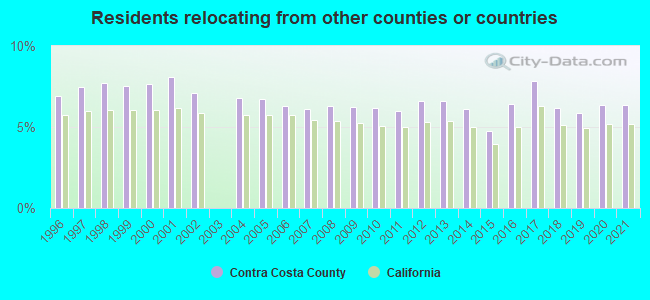
Top counties from which taxpayers relocated into this county between 2020 and 2021:
| from Alameda County, CA | |
| from San Francisco County, CA | |
| from Santa Clara County, CA | |
| from San Mateo County, CA | |
| from Solano County, CA | |
| from Los Angeles County, CA | |
| from Sacramento County, CA |
7.09% of this county's 2020 resident taxpayers moved to other counties in 2021 ($123,334 average adjusted gross income)
| Here: | 7.09% |
| California average: | 6.14% |
0.01% of residents moved to foreign countries ($92 average AGI)
Contra Costa County: 0.01% California average: 0.02%
4.61% relocated to other counties in California ($66,582 average AGI)
2.47% relocated to other states ($56,661 average AGI)
Contra Costa County: 2.47% California average: 2.55%
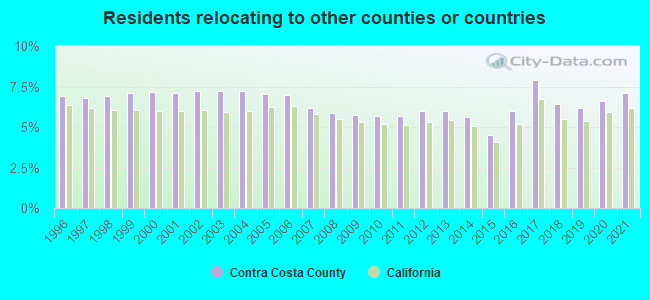
Top counties to which taxpayers relocated from this county between 2020 and 2021:
| to Alameda County, CA | |
| to Solano County, CA | |
| to San Francisco County, CA | |
| to Sacramento County, CA | |
| to San Joaquin County, CA | |
| to Santa Clara County, CA | |
| to Los Angeles County, CA |
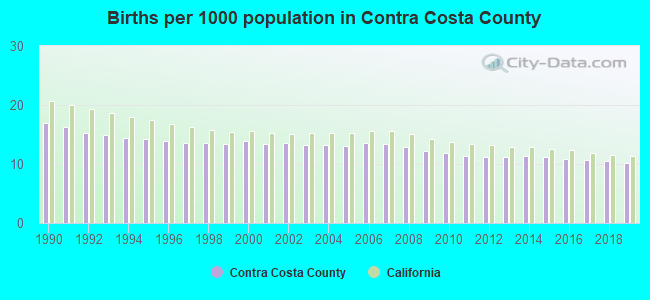
Births per 1000 population from 1990 to 1999: 14.6
Births per 1000 population from 2000 to 2009: 13.2
Births per 1000 population from 2010 to 2022: 9.2
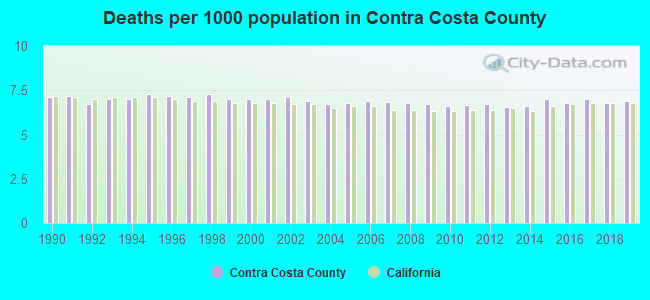
Deaths per 1000 population from 1990 to 1999: 7.1
Deaths per 1000 population from 2000 to 2009: 6.9
Deaths per 1000 population from 2010 to 2020: 6.8
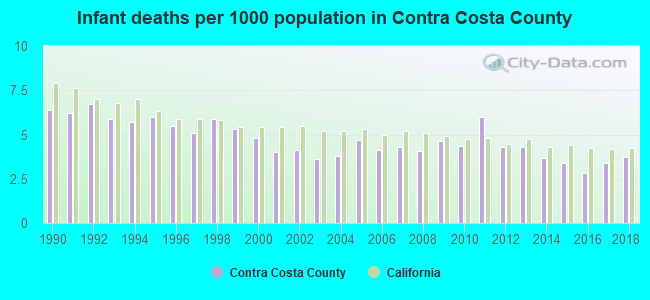
Infant deaths per 1000 live births from 1990 to 1999: 5.9
Infant deaths per 1000 live births from 2000 to 2009: 4.2
Infant deaths per 1000 live births from 2010 to 2021: 4.0
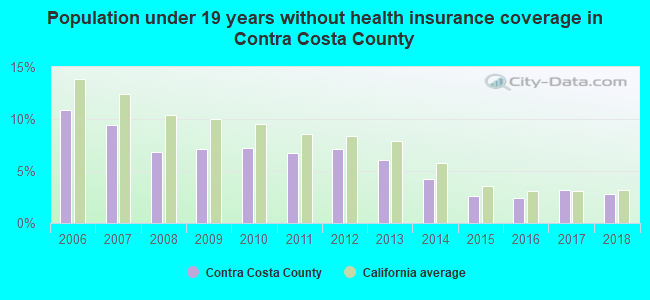
Persons under 19 years old without health insurance coverage in 2018: 2.8%
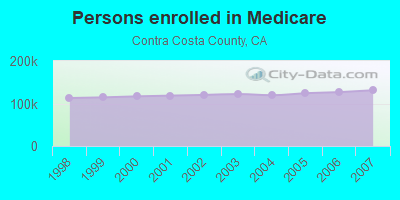
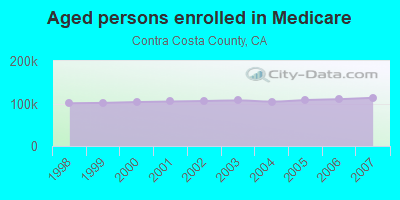
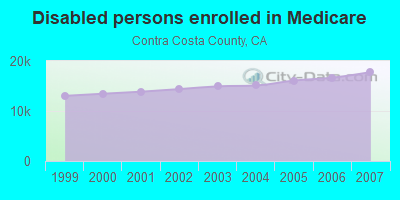
Persons enrolled in hospital insurance and/or supplemental medical insurance (Medicare) in July 1, 2007: 131,139 (113,359 aged, 17,780 disabled)
Children under 18 without health insurance coverage in 2007: 23,470 (9%)
Most common underlying causes of death in Contra Costa County, California in 1999 - 2019:
- Atherosclerotic heart disease (10,675)
- Bronchus or lung, unspecified - Malignant neoplasms (8,220)
- Alzheimer disease, unspecified (7,190)
- Acute myocardial infarction, unspecified (6,959)
- Chronic obstructive pulmonary disease, unspecified (5,676)
- Stroke, not specified as haemorrhage or infarction (4,681)
- Breast, unspecified - Malignant neoplasms (2,933)
- Congestive heart failure (2,830)
- Unspecified dementia (2,648)
- Pancreas, unspecified - Malignant neoplasms (2,463)
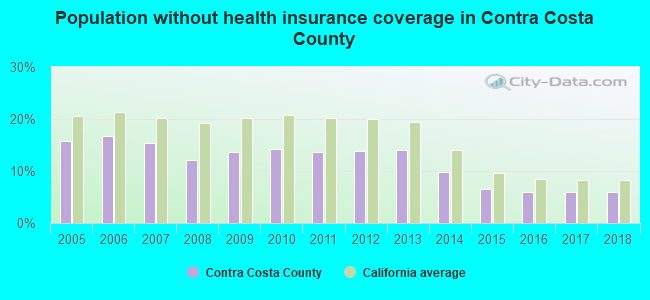
Population without health insurance coverage in 2000: 12%
Children under 18 without health insurance coverage in 2000: 10%
Homicides per 1,000,000 population from 2000 to 2006: 77.2. This is less than state average.
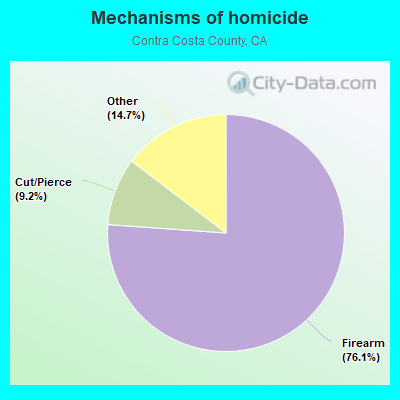
- Firearm - 58.7
- Cut/Pierce - 7.1
- Other - 11.3
Suicides per 1,000,000 population from 2000 to 2006: 90.1. This is less than state average.
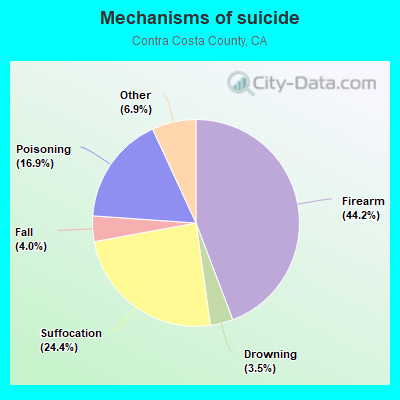
- Firearm - 39.8
- Suffocation - 21.9
- Poisoning - 15.3
- Fall - 3.6
- Drowning - 3.2
- Other - 6.2
Household type by relationship:
Households: 1,156,966- Male householders: 209,156 (37,875 living alone), Female householders: 206,038 (52,755 living alone)
223,448 spouses (220,235 opposite-sex spouses), 30,366 unmarried partners, (28,167 opposite-sex unmarried partners), 338,506 children (322,309 natural, 6,324 adopted, 9,873 stepchildren), 26,395 grandchildren, 15,995 brothers or sisters, 29,574 parents, 1,162 foster children, 28,480 other relatives, 35,250 non-relatives
- In group quarters: 12,596
Size of family households: 107,973 2-persons, 66,448 3-persons, 68,207 4-persons, 30,587 5-persons, 14,521 6-persons, 8,498 7-or-more-persons.
Size of nonfamily households: 90,630 1-person, 24,017 2-persons, 2,369 3-persons, 1,182 4-persons, 580 5-persons, 146 6-persons, 36 7-or-more-persons.
171,258 married couples with children.
47,286 single-parent households (12,192 men, 35,094 women).
62.0% of residents of Contra Costa speak English at home.
18.7% of residents speak Spanish at home (59% speak English very well, 21% speak English well, 14% speak English not well, 5% don't speak English at all).
6.5% of residents speak other Indo-European language at home (71% speak English very well, 18% speak English well, 9% speak English not well, 2% don't speak English at all).
11.2% of residents speak Asian or Pacific Island language at home (59% speak English very well, 27% speak English well, 11% speak English not well, 3% don't speak English at all).
1.6% of residents speak other language at home (76% speak English very well, 17% speak English well, 5% speak English not well, 3% don't speak English at all).
In fiscal year 2004:
Federal Government expenditure: $4,802,707,000 ($4,759 per capita)
Department of Defense expenditure: $561,658,000
Federal direct payments to individuals for retirement and disability: $1,909,613,000
Federal other direct payments to individuals: $1,027,350,000
Federal direct payments not to individuals: $14,461,000
Federal grants: $931,240,000
Federal procurement contracts: $542,164,000 ($421,076,000 Department of Defense)
Federal salaries and wages: $377,878,000 ($43,279,000 Department of Defense)
Federal Government direct loans: $0,000
Federal guaranteed/insured loans: $186,869,000
Federal Government insurance: $932,789,000
Population change from April 1, 2000 to July 1, 2005:
Births: 69,012| Here: | 68 per 1000 residents |
| State: | 77 per 1000 residents |
Deaths: 36,034
| Here: | 35 per 1000 residents |
| State: | 34 per 1000 residents |
Net international migration: +29,744
| Here: | +29 per 1000 residents |
| State: | +39 per 1000 residents |
Net internal migration: +7,146
| Here: | |
| State: |
Total withdrawal of fresh water for public supply: 159.61 millions of gallons per day (2% from ground, 98% from surface)
| Here: | 6.4 |
| State: | 6.0 |
| Here: | 4.2 |
| State: | 3.9 |
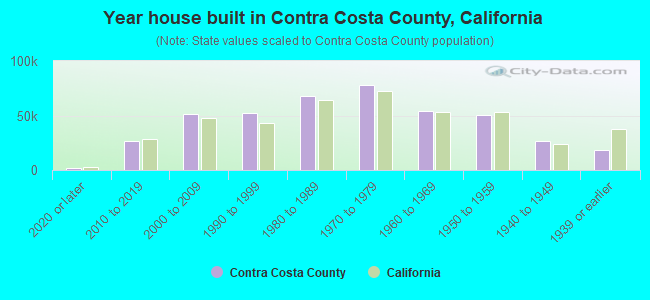
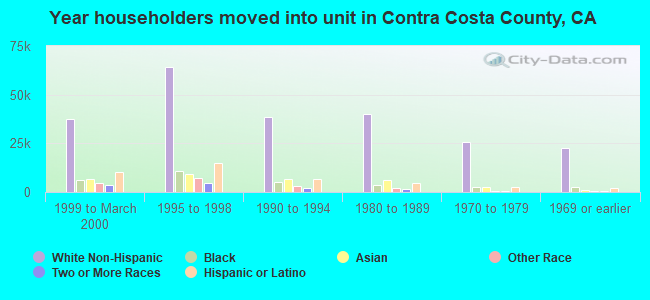
- Year house built in Contra Costa County, California
- 5,3222020 or later
- 26,4262010 to 2019
- 54,2532000 to 2009
- 50,0111990 to 1999
- 68,2871980 to 1989
- 72,5741970 to 1979
- 52,3821960 to 1969
- 54,8721950 to 1959
- 27,8531940 to 1949
- 18,0711939 or earlier
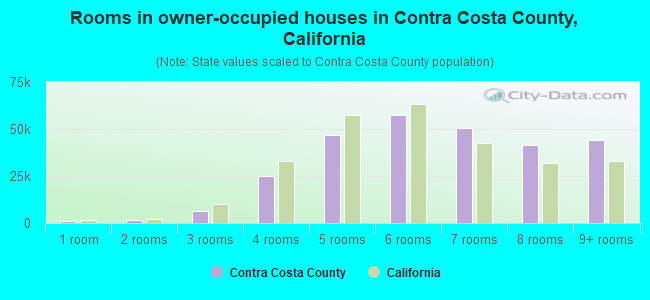
- Rooms in owner-occupied houses in Contra Costa County, California
- 8471 room
- 1,7222 rooms
- 7,5923 rooms
- 26,1764 rooms
- 52,8005 rooms
- 62,9216 rooms
- 45,9847 rooms
- 41,3418 rooms
- 46,2369+ rooms
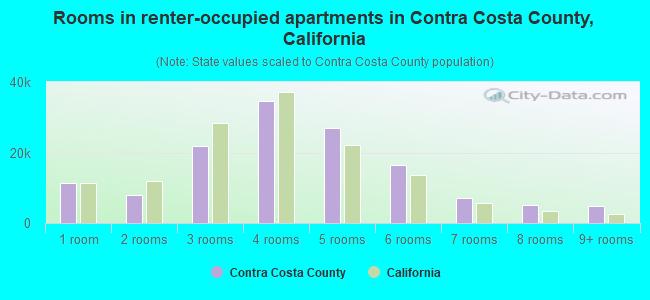
- Rooms in renter-occupied apartments in Contra Costa County, California
- 7,8291 room
- 9,1222 rooms
- 24,3763 rooms
- 34,5984 rooms
- 23,2685 rooms
- 12,2376 rooms
- 9,2797 rooms
- 4,9208 rooms
- 3,9469+ rooms
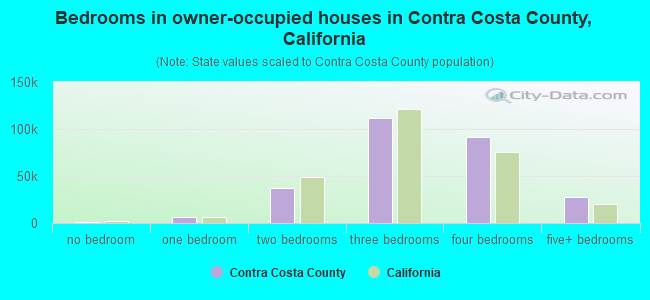
- Bedrooms in owner-occupied houses in Contra Costa County, California
- 1,206no bedroom
- 5,6551 bedroom
- 38,1872 bedrooms
- 112,9063 bedrooms
- 97,9494 bedrooms
- 29,7165+ bedrooms
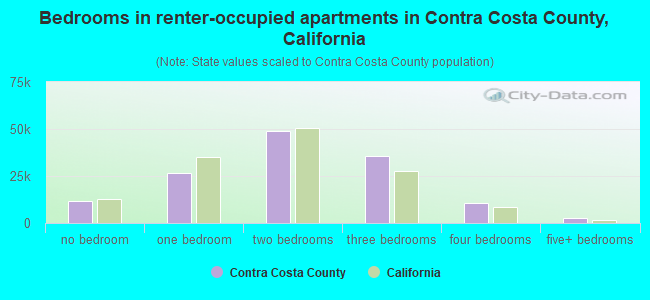
- Bedrooms in renter-occupied apartments in Contra Costa County, California
- 8,718no bedroom
- 28,2601 bedroom
- 48,5082 bedrooms
- 28,9493 bedrooms
- 11,7094 bedrooms
- 3,4315+ bedrooms
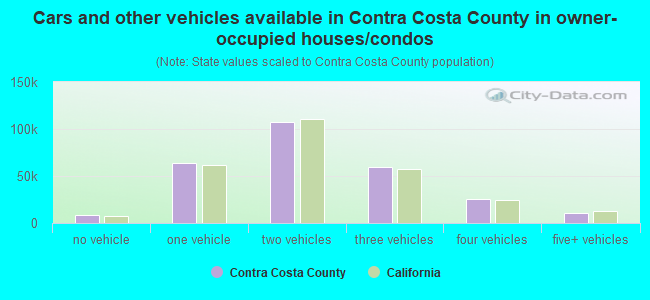
- Cars and other vehicles available in Contra Costa County in owner-occupied houses/condos
- 7,988no vehicle
- 66,9091 vehicle
- 113,1422 vehicles
- 62,5483 vehicles
- 22,4464 vehicles
- 12,5865+ vehicles
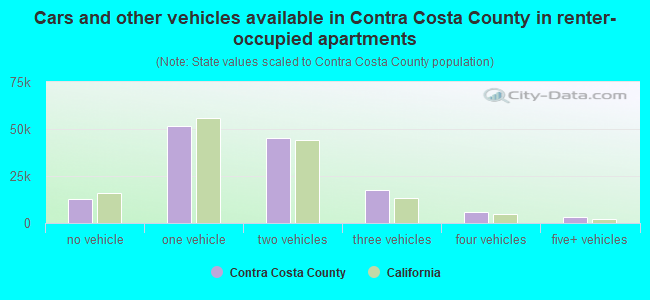
- Cars and other vehicles available in Contra Costa County in renter-occupied apartments
- 11,580no vehicle
- 48,9541 vehicle
- 45,5932 vehicles
- 17,2743 vehicles
- 4,0494 vehicles
- 2,1255+ vehicles
88.9% of Contra Costa County residents lived in the same house 1 years ago.
Out of people who lived in different houses, 35% lived in this county.
Out of people who lived in different counties, 79% lived in California.
| Contra Costa County: | 88.9% |
| State average: | 88.9% |
Place of birth for U.S.-born residents:
- This state: 642,259
- Other state: 182,943
- Northeast: 46,985
- Midwest: 54,784
- South: 48,583
- West: 32,591
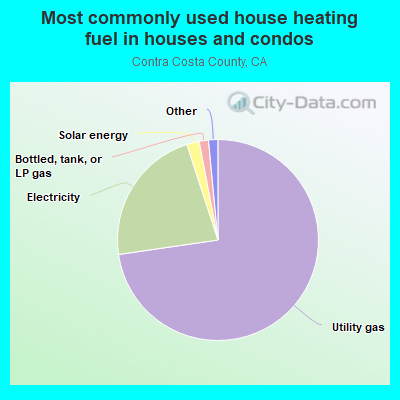
- 71.4%Utility gas
- 23.1%Electricity
- 2.1%Solar energy
- 1.9%Bottled, tank, or LP gas
- 0.8%No fuel used
- 0.6%Wood
- 0.1%Other fuel
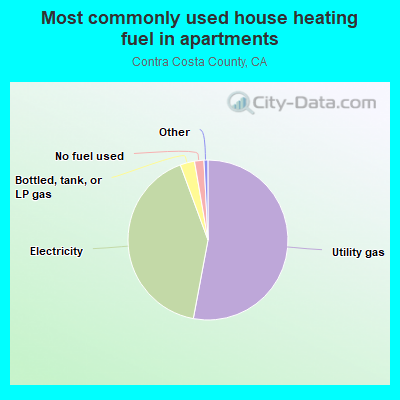
- 51.7%Utility gas
- 41.8%Electricity
- 2.9%No fuel used
- 2.7%Bottled, tank, or LP gas
- 0.4%Solar energy
- 0.3%Other fuel
- 0.1%Fuel oil, kerosene, etc.
- 0.1%Wood
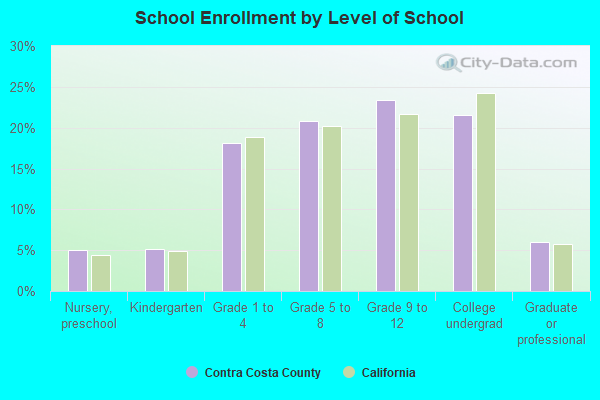
Private vs. public school enrollment:
| Here: | 12.7% |
| California: | 10.5% |
| Here: | 9.7% |
| California: | 8.5% |
| Here: | 20.2% |
| California: | 15.9% |
Contra Costa County government finances - Expenditure in 2018:
- Assistance and Subsidies - Public Welfare, Cash Assistance Programs - Other: $126,066,000
Public Welfare, Cash Assistance Programs - Other: $125,851,000
- Charges - Hospital Public: $1,531,925,000
Hospital Public: $1,498,470,000
Other: $385,384,000
Other: $337,712,000
Sewerage: $40,185,000
Sewerage: $35,257,000
Solid Waste Management: $17,586,000
Regular Highways: $5,709,000
Air Transportation: $5,263,000
Air Transportation: $5,024,000
Regular Highways: $3,051,000
Natural Resources - Other: $2,843,000
Natural Resources - Other: $2,818,000
Solid Waste Management: $1,665,000
Elementary and Secondary Education - Other: $807,000
Elementary and Secondary Education - Other: $781,000
Elementary and Secondary Education School Lunch: $10,000
Parks and Recreation: $10,000
Elementary and Secondary Education School Lunch: $3,000
- Construction - Sewerage: $5,106,000
Sewerage: $4,981,000
Local Fire Protection: $4,768,000
Local Fire Protection: $3,768,000
Elementary and Secondary Education: $710,000
Elementary and Secondary Education: $527,000
General - Other: $326,000
General - Other: $304,000
Natural Resources - Other: $132,000
- Current Operations - Hospitals: $1,360,842,000
Hospitals: $1,246,725,000
Public Welfare - Other: $330,486,000
Public Welfare - Other: $313,888,000
Health - Other: $313,002,000
Health - Other: $253,786,000
Local Fire Protection: $204,622,000
Local Fire Protection: $180,795,000
Police Protection: $155,870,000
Correctional Institutions: $125,123,000
Police Protection: $97,717,000
Correctional Institutions: $96,096,000
General - Other: $88,018,000
Judicial and Legal Services: $84,740,000
Judicial and Legal Services: $81,634,000
Elementary and Secondary Education: $79,747,000
Elementary and Secondary Education: $74,777,000
General - Other: $53,119,000
Regular Highways: $49,959,000
Regular Highways: $42,327,000
Natural Resources - Other: $39,735,000
Natural Resources - Other: $37,610,000
General Public Buildings: $36,304,000
Central Staff Services: $34,258,000
General Public Buildings: $31,906,000
Sewerage: $29,240,000
Libraries: $29,061,000
Financial Administration: $28,493,000
Sewerage: $28,159,000
Financial Administration: $28,014,000
Central Staff Services: $25,135,000
Libraries: $25,112,000
Corrections - Other: $21,280,000
Corrections - Other: $18,697,000
Protective Inspection and Regulation - Other: $10,344,000
Air Transportation: $4,538,000
Air Transportation: $3,374,000
Parks and Recreation: $1,953,000
Transit Utilities: $1,466,000
Transit Utilities: $640,000
Water Utilities: $526,000
Water Utilities: $503,000
Solid Waste Management: $354,000
Parks and Recreation: $341,000
Solid Waste Management: $335,000
Public Welfare, Vendor Payments for Other Purposes: $95,000
Public Welfare, Vendor Payments for Other Purposes: $94,000
Parking Facilities: $3,000
- Federal Intergovernmental - Other: $88,115,000
Other: $37,148,000
Highways: $12,001,000
Housing and Community Development: $8,802,000
Housing and Community Development: $8,244,000
Health and Hospitals: $7,658,000
Highways: $5,806,000
Air Transportation: $1,955,000
Air Transportation: $411,000
Sewerage: $194,000
Education: $165,000
Education: $158,000
Sewerage: $52,000
General Local Government Support: $8,000
General Local Government Support: $8,000
- General - Interest on Debt: $34,697,000
Interest on Debt: $30,648,000
- Intergovernmental to Local - Other - Elementary and Secondary Education: $56,064,000
Other - Elementary and Secondary Education: $44,086,000
Other - General - Other: $9,865,000
Other - General - Other: $9,574,000
- Intergovernmental to State - Judicial and Legal Services: $15,634,000
Judicial and Legal Services: $15,298,000
- Local Intergovernmental - Education: $26,948,000
Education: $24,412,000
Other: $12,415,000
Other: $12,407,000
Housing and Community Development: $11,512,000
Housing and Community Development: $7,864,000
Health and Hospitals: $1,321,000
Health and Hospitals: $1,219,000
Transit Utilities: $652,000
Transit Utilities: $569,000
Sewerage: $5,000
- Long Term Debt - Beginning Outstanding - Unspecified Public Purpose: $1,025,177,000
Beginning Outstanding - Unspecified Public Purpose: $858,517,000
Outstanding Unspecified Public Purpose: $838,699,000
Outstanding Unspecified Public Purpose: $728,041,000
Outstanding Nonguaranteed - Industrial Revenue: $519,398,000
Beginning Outstanding - Public Debt for Private Purpose: $421,800,000
Outstanding Nonguaranteed - Industrial Revenue: $421,800,000
Beginning Outstanding - Public Debt for Private Purpose: $389,398,000
Retired Unspecified Public Purpose: $190,287,000
Retired Unspecified Public Purpose: $130,477,000
Issue, Nonguaranteed - Public Debt for Private Purpose: $130,000,000
Issue, Unspecified Public Purpose: $3,808,000
- Miscellaneous - Interest Earnings: $42,742,000
Special Assessments: $40,117,000
Special Assessments: $38,011,000
Rents: $26,953,000
General Revenue - Other: $24,432,000
General Revenue - Other: $20,550,000
Interest Earnings: $20,198,000
Fines and Forfeits: $9,537,000
Fines and Forfeits: $7,884,000
Rents: $1,776,000
Sale of Property: $587,000
Sale of Property: $13,000
- Other Capital Outlay - General - Other: $54,905,000
General - Other: $54,521,000
Police Protection: $12,364,000
General Public Building: $7,929,000
Hospitals: $7,000,000
Hospitals: $5,746,000
Air Transportation: $3,591,000
Air Transportation: $3,281,000
Correctional Institutions: $1,459,000
Police Protection: $1,027,000
Regular Highways: $1,009,000
Central Staff Services: $781,000
Health - Other: $769,000
Public Welfare - Other: $718,000
Health - Other: $668,000
Elementary and Secondary Education: $528,000
Sewerage: $528,000
Sewerage: $323,000
Libraries: $193,000
Regular Highways: $164,000
Elementary and Secondary Education: $157,000
Public Welfare - Other: $146,000
Judicial and Legal Services: $132,000
Natural Resources - Other: $108,000
Financial Administration: $71,000
- Other Funds - Cash and Securities: $1,170,519,000
Cash and Securities: $943,150,000
- Revenue - Transit Utilities: $8,000
- Sinking Funds - Cash and Securities: $534,678,000
Cash and Securities: $434,949,000
- State Intergovernmental - Public Welfare: $407,193,000
Public Welfare: $402,066,000
Health and Hospitals: $313,891,000
Health and Hospitals: $204,685,000
Other: $190,327,000
Other: $176,670,000
Education: $95,115,000
Education: $79,032,000
Highways: $36,371,000
Highways: $24,344,000
General Local Government Support: $3,789,000
General Local Government Support: $2,559,000
Sewerage: $26,000
Sewerage: $25,000
Water Utilities: $5,000
Water Utilities: $5,000
- Tax - Property: $800,743,000
Property: $605,581,000
Occupation and Business License - Other: $17,392,000
General Sales and Gross Receipts: $16,697,000
Other License: $15,412,000
General Sales and Gross Receipts: $14,267,000
Occupation and Business License - Other: $12,623,000
Public Utilities Sales: $12,000,000
Public Utilities Sales: $11,854,000
Documentary and Stock Transfer: $10,860,000
Documentary and Stock Transfer: $10,266,000
Other: $8,836,000
Other License: $6,406,000
Other Selective Sales: $3,330,000
Other Selective Sales: $3,170,000
- Total Salaries and Wages: $37,966,000
: $33,591,000
Contra Costa County government finances - Revenue in 2018:
- Assistance and Subsidies - Public Welfare, Cash Assistance Programs - Other: $126,066,000
Public Welfare, Cash Assistance Programs - Other: $125,851,000
- Charges - Hospital Public: $1,531,925,000
Hospital Public: $1,498,470,000
Other: $385,384,000
Other: $337,712,000
Sewerage: $40,185,000
Sewerage: $35,257,000
Solid Waste Management: $17,586,000
Regular Highways: $5,709,000
Air Transportation: $5,263,000
Air Transportation: $5,024,000
Regular Highways: $3,051,000
Natural Resources - Other: $2,843,000
Natural Resources - Other: $2,818,000
Solid Waste Management: $1,665,000
Elementary and Secondary Education - Other: $807,000
Elementary and Secondary Education - Other: $781,000
Elementary and Secondary Education School Lunch: $10,000
Parks and Recreation: $10,000
Elementary and Secondary Education School Lunch: $3,000
- Construction - Sewerage: $5,106,000
Sewerage: $4,981,000
Local Fire Protection: $4,768,000
Local Fire Protection: $3,768,000
Elementary and Secondary Education: $710,000
Elementary and Secondary Education: $527,000
General - Other: $326,000
General - Other: $304,000
Natural Resources - Other: $132,000
- Current Operations - Hospitals: $1,360,842,000
Hospitals: $1,246,725,000
Public Welfare - Other: $330,486,000
Public Welfare - Other: $313,888,000
Health - Other: $313,002,000
Health - Other: $253,786,000
Local Fire Protection: $204,622,000
Local Fire Protection: $180,795,000
Police Protection: $155,870,000
Correctional Institutions: $125,123,000
Police Protection: $97,717,000
Correctional Institutions: $96,096,000
General - Other: $88,018,000
Judicial and Legal Services: $84,740,000
Judicial and Legal Services: $81,634,000
Elementary and Secondary Education: $79,747,000
Elementary and Secondary Education: $74,777,000
General - Other: $53,119,000
Regular Highways: $49,959,000
Regular Highways: $42,327,000
Natural Resources - Other: $39,735,000
Natural Resources - Other: $37,610,000
General Public Buildings: $36,304,000
Central Staff Services: $34,258,000
General Public Buildings: $31,906,000
Sewerage: $29,240,000
Libraries: $29,061,000
Financial Administration: $28,493,000
Sewerage: $28,159,000
Financial Administration: $28,014,000
Central Staff Services: $25,135,000
Libraries: $25,112,000
Corrections - Other: $21,280,000
Corrections - Other: $18,697,000
Protective Inspection and Regulation - Other: $10,344,000
Air Transportation: $4,538,000
Air Transportation: $3,374,000
Parks and Recreation: $1,953,000
Transit Utilities: $1,466,000
Transit Utilities: $640,000
Water Utilities: $526,000
Water Utilities: $503,000
Solid Waste Management: $354,000
Parks and Recreation: $341,000
Solid Waste Management: $335,000
Public Welfare, Vendor Payments for Other Purposes: $95,000
Public Welfare, Vendor Payments for Other Purposes: $94,000
Parking Facilities: $3,000
- Federal Intergovernmental - Other: $88,115,000
Other: $37,148,000
Highways: $12,001,000
Housing and Community Development: $8,802,000
Housing and Community Development: $8,244,000
Health and Hospitals: $7,658,000
Highways: $5,806,000
Air Transportation: $1,955,000
Air Transportation: $411,000
Sewerage: $194,000
Education: $165,000
Education: $158,000
Sewerage: $52,000
General Local Government Support: $8,000
General Local Government Support: $8,000
- General - Interest on Debt: $34,697,000
Interest on Debt: $30,648,000
- Intergovernmental to Local - Other - Elementary and Secondary Education: $56,064,000
Other - Elementary and Secondary Education: $44,086,000
Other - General - Other: $9,865,000
Other - General - Other: $9,574,000
- Intergovernmental to State - Judicial and Legal Services: $15,634,000
Judicial and Legal Services: $15,298,000
- Local Intergovernmental - Education: $26,948,000
Education: $24,412,000
Other: $12,415,000
Other: $12,407,000
Housing and Community Development: $11,512,000
Housing and Community Development: $7,864,000
Health and Hospitals: $1,321,000
Health and Hospitals: $1,219,000
Transit Utilities: $652,000
Transit Utilities: $569,000
Sewerage: $5,000
- Long Term Debt - Beginning Outstanding - Unspecified Public Purpose: $1,025,177,000
Beginning Outstanding - Unspecified Public Purpose: $858,517,000
Outstanding Unspecified Public Purpose: $838,699,000
Outstanding Unspecified Public Purpose: $728,041,000
Outstanding Nonguaranteed - Industrial Revenue: $519,398,000
Beginning Outstanding - Public Debt for Private Purpose: $421,800,000
Outstanding Nonguaranteed - Industrial Revenue: $421,800,000
Beginning Outstanding - Public Debt for Private Purpose: $389,398,000
Retired Unspecified Public Purpose: $190,287,000
Retired Unspecified Public Purpose: $130,477,000
Issue, Nonguaranteed - Public Debt for Private Purpose: $130,000,000
Issue, Unspecified Public Purpose: $3,808,000
- Miscellaneous - Interest Earnings: $42,742,000
Special Assessments: $40,117,000
Special Assessments: $38,011,000
Rents: $26,953,000
General Revenue - Other: $24,432,000
General Revenue - Other: $20,550,000
Interest Earnings: $20,198,000
Fines and Forfeits: $9,537,000
Fines and Forfeits: $7,884,000
Rents: $1,776,000
Sale of Property: $587,000
Sale of Property: $13,000
- Other Capital Outlay - General - Other: $54,905,000
General - Other: $54,521,000
Police Protection: $12,364,000
General Public Building: $7,929,000
Hospitals: $7,000,000
Hospitals: $5,746,000
Air Transportation: $3,591,000
Air Transportation: $3,281,000
Correctional Institutions: $1,459,000
Police Protection: $1,027,000
Regular Highways: $1,009,000
Central Staff Services: $781,000
Health - Other: $769,000
Public Welfare - Other: $718,000
Health - Other: $668,000
Elementary and Secondary Education: $528,000
Sewerage: $528,000
Sewerage: $323,000
Libraries: $193,000
Regular Highways: $164,000
Elementary and Secondary Education: $157,000
Public Welfare - Other: $146,000
Judicial and Legal Services: $132,000
Natural Resources - Other: $108,000
Financial Administration: $71,000
- Other Funds - Cash and Securities: $1,170,519,000
Cash and Securities: $943,150,000
- Revenue - Transit Utilities: $8,000
- Sinking Funds - Cash and Securities: $534,678,000
Cash and Securities: $434,949,000
- State Intergovernmental - Public Welfare: $407,193,000
Public Welfare: $402,066,000
Health and Hospitals: $313,891,000
Health and Hospitals: $204,685,000
Other: $190,327,000
Other: $176,670,000
Education: $95,115,000
Education: $79,032,000
Highways: $36,371,000
Highways: $24,344,000
General Local Government Support: $3,789,000
General Local Government Support: $2,559,000
Sewerage: $26,000
Sewerage: $25,000
Water Utilities: $5,000
Water Utilities: $5,000
- Tax - Property: $800,743,000
Property: $605,581,000
Occupation and Business License - Other: $17,392,000
General Sales and Gross Receipts: $16,697,000
Other License: $15,412,000
General Sales and Gross Receipts: $14,267,000
Occupation and Business License - Other: $12,623,000
Public Utilities Sales: $12,000,000
Public Utilities Sales: $11,854,000
Documentary and Stock Transfer: $10,860,000
Documentary and Stock Transfer: $10,266,000
Other: $8,836,000
Other License: $6,406,000
Other Selective Sales: $3,330,000
Other Selective Sales: $3,170,000
- Total Salaries and Wages: $37,966,000
: $33,591,000
Contra Costa County government finances - Debt in 2018:
- Assistance and Subsidies - Public Welfare, Cash Assistance Programs - Other: $126,066,000
Public Welfare, Cash Assistance Programs - Other: $125,851,000
- Charges - Hospital Public: $1,531,925,000
Hospital Public: $1,498,470,000
Other: $385,384,000
Other: $337,712,000
Sewerage: $40,185,000
Sewerage: $35,257,000
Solid Waste Management: $17,586,000
Regular Highways: $5,709,000
Air Transportation: $5,263,000
Air Transportation: $5,024,000
Regular Highways: $3,051,000
Natural Resources - Other: $2,843,000
Natural Resources - Other: $2,818,000
Solid Waste Management: $1,665,000
Elementary and Secondary Education - Other: $807,000
Elementary and Secondary Education - Other: $781,000
Elementary and Secondary Education School Lunch: $10,000
Parks and Recreation: $10,000
Elementary and Secondary Education School Lunch: $3,000
- Construction - Sewerage: $5,106,000
Sewerage: $4,981,000
Local Fire Protection: $4,768,000
Local Fire Protection: $3,768,000
Elementary and Secondary Education: $710,000
Elementary and Secondary Education: $527,000
General - Other: $326,000
General - Other: $304,000
Natural Resources - Other: $132,000
- Current Operations - Hospitals: $1,360,842,000
Hospitals: $1,246,725,000
Public Welfare - Other: $330,486,000
Public Welfare - Other: $313,888,000
Health - Other: $313,002,000
Health - Other: $253,786,000
Local Fire Protection: $204,622,000
Local Fire Protection: $180,795,000
Police Protection: $155,870,000
Correctional Institutions: $125,123,000
Police Protection: $97,717,000
Correctional Institutions: $96,096,000
General - Other: $88,018,000
Judicial and Legal Services: $84,740,000
Judicial and Legal Services: $81,634,000
Elementary and Secondary Education: $79,747,000
Elementary and Secondary Education: $74,777,000
General - Other: $53,119,000
Regular Highways: $49,959,000
Regular Highways: $42,327,000
Natural Resources - Other: $39,735,000
Natural Resources - Other: $37,610,000
General Public Buildings: $36,304,000
Central Staff Services: $34,258,000
General Public Buildings: $31,906,000
Sewerage: $29,240,000
Libraries: $29,061,000
Financial Administration: $28,493,000
Sewerage: $28,159,000
Financial Administration: $28,014,000
Central Staff Services: $25,135,000
Libraries: $25,112,000
Corrections - Other: $21,280,000
Corrections - Other: $18,697,000
Protective Inspection and Regulation - Other: $10,344,000
Air Transportation: $4,538,000
Air Transportation: $3,374,000
Parks and Recreation: $1,953,000
Transit Utilities: $1,466,000
Transit Utilities: $640,000
Water Utilities: $526,000
Water Utilities: $503,000
Solid Waste Management: $354,000
Parks and Recreation: $341,000
Solid Waste Management: $335,000
Public Welfare, Vendor Payments for Other Purposes: $95,000
Public Welfare, Vendor Payments for Other Purposes: $94,000
Parking Facilities: $3,000
- Federal Intergovernmental - Other: $88,115,000
Other: $37,148,000
Highways: $12,001,000
Housing and Community Development: $8,802,000
Housing and Community Development: $8,244,000
Health and Hospitals: $7,658,000
Highways: $5,806,000
Air Transportation: $1,955,000
Air Transportation: $411,000
Sewerage: $194,000
Education: $165,000
Education: $158,000
Sewerage: $52,000
General Local Government Support: $8,000
General Local Government Support: $8,000
- General - Interest on Debt: $34,697,000
Interest on Debt: $30,648,000
- Intergovernmental to Local - Other - Elementary and Secondary Education: $56,064,000
Other - Elementary and Secondary Education: $44,086,000
Other - General - Other: $9,865,000
Other - General - Other: $9,574,000
- Intergovernmental to State - Judicial and Legal Services: $15,634,000
Judicial and Legal Services: $15,298,000
- Local Intergovernmental - Education: $26,948,000
Education: $24,412,000
Other: $12,415,000
Other: $12,407,000
Housing and Community Development: $11,512,000
Housing and Community Development: $7,864,000
Health and Hospitals: $1,321,000
Health and Hospitals: $1,219,000
Transit Utilities: $652,000
Transit Utilities: $569,000
Sewerage: $5,000
- Long Term Debt - Beginning Outstanding - Unspecified Public Purpose: $1,025,177,000
Beginning Outstanding - Unspecified Public Purpose: $858,517,000
Outstanding Unspecified Public Purpose: $838,699,000
Outstanding Unspecified Public Purpose: $728,041,000
Outstanding Nonguaranteed - Industrial Revenue: $519,398,000
Beginning Outstanding - Public Debt for Private Purpose: $421,800,000
Outstanding Nonguaranteed - Industrial Revenue: $421,800,000
Beginning Outstanding - Public Debt for Private Purpose: $389,398,000
Retired Unspecified Public Purpose: $190,287,000
Retired Unspecified Public Purpose: $130,477,000
Issue, Nonguaranteed - Public Debt for Private Purpose: $130,000,000
Issue, Unspecified Public Purpose: $3,808,000
- Miscellaneous - Interest Earnings: $42,742,000
Special Assessments: $40,117,000
Special Assessments: $38,011,000
Rents: $26,953,000
General Revenue - Other: $24,432,000
General Revenue - Other: $20,550,000
Interest Earnings: $20,198,000
Fines and Forfeits: $9,537,000
Fines and Forfeits: $7,884,000
Rents: $1,776,000
Sale of Property: $587,000
Sale of Property: $13,000
- Other Capital Outlay - General - Other: $54,905,000
General - Other: $54,521,000
Police Protection: $12,364,000
General Public Building: $7,929,000
Hospitals: $7,000,000
Hospitals: $5,746,000
Air Transportation: $3,591,000
Air Transportation: $3,281,000
Correctional Institutions: $1,459,000
Police Protection: $1,027,000
Regular Highways: $1,009,000
Central Staff Services: $781,000
Health - Other: $769,000
Public Welfare - Other: $718,000
Health - Other: $668,000
Elementary and Secondary Education: $528,000
Sewerage: $528,000
Sewerage: $323,000
Libraries: $193,000
Regular Highways: $164,000
Elementary and Secondary Education: $157,000
Public Welfare - Other: $146,000
Judicial and Legal Services: $132,000
Natural Resources - Other: $108,000
Financial Administration: $71,000
- Other Funds - Cash and Securities: $1,170,519,000
Cash and Securities: $943,150,000
- Revenue - Transit Utilities: $8,000
- Sinking Funds - Cash and Securities: $534,678,000
Cash and Securities: $434,949,000
- State Intergovernmental - Public Welfare: $407,193,000
Public Welfare: $402,066,000
Health and Hospitals: $313,891,000
Health and Hospitals: $204,685,000
Other: $190,327,000
Other: $176,670,000
Education: $95,115,000
Education: $79,032,000
Highways: $36,371,000
Highways: $24,344,000
General Local Government Support: $3,789,000
General Local Government Support: $2,559,000
Sewerage: $26,000
Sewerage: $25,000
Water Utilities: $5,000
Water Utilities: $5,000
- Tax - Property: $800,743,000
Property: $605,581,000
Occupation and Business License - Other: $17,392,000
General Sales and Gross Receipts: $16,697,000
Other License: $15,412,000
General Sales and Gross Receipts: $14,267,000
Occupation and Business License - Other: $12,623,000
Public Utilities Sales: $12,000,000
Public Utilities Sales: $11,854,000
Documentary and Stock Transfer: $10,860,000
Documentary and Stock Transfer: $10,266,000
Other: $8,836,000
Other License: $6,406,000
Other Selective Sales: $3,330,000
Other Selective Sales: $3,170,000
- Total Salaries and Wages: $37,966,000
: $33,591,000
Contra Costa County government finances - Cash and Securities in 2018:
- Assistance and Subsidies - Public Welfare, Cash Assistance Programs - Other: $126,066,000
Public Welfare, Cash Assistance Programs - Other: $125,851,000
- Charges - Hospital Public: $1,531,925,000
Hospital Public: $1,498,470,000
Other: $385,384,000
Other: $337,712,000
Sewerage: $40,185,000
Sewerage: $35,257,000
Solid Waste Management: $17,586,000
Regular Highways: $5,709,000
Air Transportation: $5,263,000
Air Transportation: $5,024,000
Regular Highways: $3,051,000
Natural Resources - Other: $2,843,000
Natural Resources - Other: $2,818,000
Solid Waste Management: $1,665,000
Elementary and Secondary Education - Other: $807,000
Elementary and Secondary Education - Other: $781,000
Elementary and Secondary Education School Lunch: $10,000
Parks and Recreation: $10,000
Elementary and Secondary Education School Lunch: $3,000
- Construction - Sewerage: $5,106,000
Sewerage: $4,981,000
Local Fire Protection: $4,768,000
Local Fire Protection: $3,768,000
Elementary and Secondary Education: $710,000
Elementary and Secondary Education: $527,000
General - Other: $326,000
General - Other: $304,000
Natural Resources - Other: $132,000
- Current Operations - Hospitals: $1,360,842,000
Hospitals: $1,246,725,000
Public Welfare - Other: $330,486,000
Public Welfare - Other: $313,888,000
Health - Other: $313,002,000
Health - Other: $253,786,000
Local Fire Protection: $204,622,000
Local Fire Protection: $180,795,000
Police Protection: $155,870,000
Correctional Institutions: $125,123,000
Police Protection: $97,717,000
Correctional Institutions: $96,096,000
General - Other: $88,018,000
Judicial and Legal Services: $84,740,000
Judicial and Legal Services: $81,634,000
Elementary and Secondary Education: $79,747,000
Elementary and Secondary Education: $74,777,000
General - Other: $53,119,000
Regular Highways: $49,959,000
Regular Highways: $42,327,000
Natural Resources - Other: $39,735,000
Natural Resources - Other: $37,610,000
General Public Buildings: $36,304,000
Central Staff Services: $34,258,000
General Public Buildings: $31,906,000
Sewerage: $29,240,000
Libraries: $29,061,000
Financial Administration: $28,493,000
Sewerage: $28,159,000
Financial Administration: $28,014,000
Central Staff Services: $25,135,000
Libraries: $25,112,000
Corrections - Other: $21,280,000
Corrections - Other: $18,697,000
Protective Inspection and Regulation - Other: $10,344,000
Air Transportation: $4,538,000
Air Transportation: $3,374,000
Parks and Recreation: $1,953,000
Transit Utilities: $1,466,000
Transit Utilities: $640,000
Water Utilities: $526,000
Water Utilities: $503,000
Solid Waste Management: $354,000
Parks and Recreation: $341,000
Solid Waste Management: $335,000
Public Welfare, Vendor Payments for Other Purposes: $95,000
Public Welfare, Vendor Payments for Other Purposes: $94,000
Parking Facilities: $3,000
- Federal Intergovernmental - Other: $88,115,000
Other: $37,148,000
Highways: $12,001,000
Housing and Community Development: $8,802,000
Housing and Community Development: $8,244,000
Health and Hospitals: $7,658,000
Highways: $5,806,000
Air Transportation: $1,955,000
Air Transportation: $411,000
Sewerage: $194,000
Education: $165,000
Education: $158,000
Sewerage: $52,000
General Local Government Support: $8,000
General Local Government Support: $8,000
- General - Interest on Debt: $34,697,000
Interest on Debt: $30,648,000
- Intergovernmental to Local - Other - Elementary and Secondary Education: $56,064,000
Other - Elementary and Secondary Education: $44,086,000
Other - General - Other: $9,865,000
Other - General - Other: $9,574,000
- Intergovernmental to State - Judicial and Legal Services: $15,634,000
Judicial and Legal Services: $15,298,000
- Local Intergovernmental - Education: $26,948,000
Education: $24,412,000
Other: $12,415,000
Other: $12,407,000
Housing and Community Development: $11,512,000
Housing and Community Development: $7,864,000
Health and Hospitals: $1,321,000
Health and Hospitals: $1,219,000
Transit Utilities: $652,000
Transit Utilities: $569,000
Sewerage: $5,000
- Long Term Debt - Beginning Outstanding - Unspecified Public Purpose: $1,025,177,000
Beginning Outstanding - Unspecified Public Purpose: $858,517,000
Outstanding Unspecified Public Purpose: $838,699,000
Outstanding Unspecified Public Purpose: $728,041,000
Outstanding Nonguaranteed - Industrial Revenue: $519,398,000
Beginning Outstanding - Public Debt for Private Purpose: $421,800,000
Outstanding Nonguaranteed - Industrial Revenue: $421,800,000
Beginning Outstanding - Public Debt for Private Purpose: $389,398,000
Retired Unspecified Public Purpose: $190,287,000
Retired Unspecified Public Purpose: $130,477,000
Issue, Nonguaranteed - Public Debt for Private Purpose: $130,000,000
Issue, Unspecified Public Purpose: $3,808,000
- Miscellaneous - Interest Earnings: $42,742,000
Special Assessments: $40,117,000
Special Assessments: $38,011,000
Rents: $26,953,000
General Revenue - Other: $24,432,000
General Revenue - Other: $20,550,000
Interest Earnings: $20,198,000
Fines and Forfeits: $9,537,000
Fines and Forfeits: $7,884,000
Rents: $1,776,000
Sale of Property: $587,000
Sale of Property: $13,000
- Other Capital Outlay - General - Other: $54,905,000
General - Other: $54,521,000
Police Protection: $12,364,000
General Public Building: $7,929,000
Hospitals: $7,000,000
Hospitals: $5,746,000
Air Transportation: $3,591,000
Air Transportation: $3,281,000
Correctional Institutions: $1,459,000
Police Protection: $1,027,000
Regular Highways: $1,009,000
Central Staff Services: $781,000
Health - Other: $769,000
Public Welfare - Other: $718,000
Health - Other: $668,000
Elementary and Secondary Education: $528,000
Sewerage: $528,000
Sewerage: $323,000
Libraries: $193,000
Regular Highways: $164,000
Elementary and Secondary Education: $157,000
Public Welfare - Other: $146,000
Judicial and Legal Services: $132,000
Natural Resources - Other: $108,000
Financial Administration: $71,000
- Other Funds - Cash and Securities: $1,170,519,000
Cash and Securities: $943,150,000
- Revenue - Transit Utilities: $8,000
- Sinking Funds - Cash and Securities: $534,678,000
Cash and Securities: $434,949,000
- State Intergovernmental - Public Welfare: $407,193,000
Public Welfare: $402,066,000
Health and Hospitals: $313,891,000
Health and Hospitals: $204,685,000
Other: $190,327,000
Other: $176,670,000
Education: $95,115,000
Education: $79,032,000
Highways: $36,371,000
Highways: $24,344,000
General Local Government Support: $3,789,000
General Local Government Support: $2,559,000
Sewerage: $26,000
Sewerage: $25,000
Water Utilities: $5,000
Water Utilities: $5,000
- Tax - Property: $800,743,000
Property: $605,581,000
Occupation and Business License - Other: $17,392,000
General Sales and Gross Receipts: $16,697,000
Other License: $15,412,000
General Sales and Gross Receipts: $14,267,000
Occupation and Business License - Other: $12,623,000
Public Utilities Sales: $12,000,000
Public Utilities Sales: $11,854,000
Documentary and Stock Transfer: $10,860,000
Documentary and Stock Transfer: $10,266,000
Other: $8,836,000
Other License: $6,406,000
Other Selective Sales: $3,330,000
Other Selective Sales: $3,170,000
- Total Salaries and Wages: $37,966,000
: $33,591,000
Supplemental Security Income (SSI) in 2006:
- Total number of recipients: 23,974
- Number of aged recipients: 5,677
- Number of blind and disabled recipients: 18,297
- Number of recipients under 18: 2,114
- Number of recipients between 18 and 64: 13,216
- Number of recipients older than 64: 8,644
- Number of recipients also receiving OASDI: 8,200
- Amount of payments (thousands of dollars): 14,854
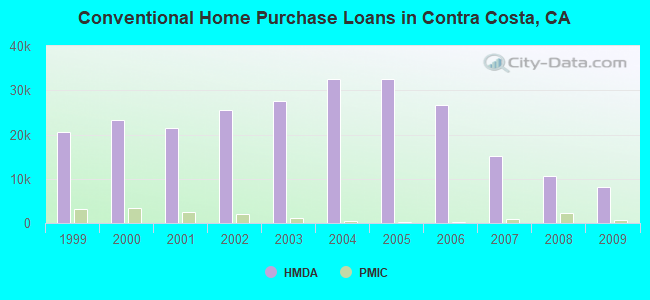
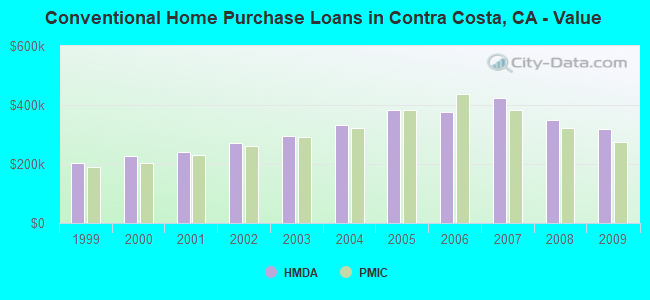
| Home Mortgage Disclosure Act Aggregated Statistics For Year 2009 (Based on 168 full tracts) | ||||||||||||||
| A) FHA, FSA/RHS & VA Home Purchase Loans | B) Conventional Home Purchase Loans | C) Refinancings | D) Home Improvement Loans | E) Loans on Dwellings For 5+ Families | F) Non-occupant Loans on < 5 Family Dwellings (A B C & D) | G) Loans On Manufactured Home Dwelling (A B C & D) | ||||||||
|---|---|---|---|---|---|---|---|---|---|---|---|---|---|---|
| Number | Average Value | Number | Average Value | Number | Average Value | Number | Average Value | Number | Average Value | Number | Average Value | Number | Average Value | |
| LOANS ORIGINATED | 5,268 | $277,143 | 8,134 | $319,886 | 27,209 | $351,229 | 1,049 | $232,018 | 35 | $2,499,657 | 2,614 | $208,880 | 28 | $155,357 |
| APPLICATIONS APPROVED, NOT ACCEPTED | 523 | $271,562 | 1,135 | $317,034 | 3,132 | $372,554 | 133 | $177,767 | 1 | $6,641,000 | 421 | $205,437 | 15 | $85,933 |
| APPLICATIONS DENIED | 1,084 | $268,492 | 1,934 | $278,444 | 8,283 | $370,311 | 492 | $147,089 | 10 | $792,000 | 1,165 | $201,198 | 57 | $99,614 |
| APPLICATIONS WITHDRAWN | 719 | $273,840 | 1,219 | $313,805 | 4,596 | $356,642 | 279 | $181,419 | 2 | $16,450,000 | 522 | $200,469 | 7 | $97,143 |
| FILES CLOSED FOR INCOMPLETENESS | 235 | $251,698 | 285 | $335,607 | 1,563 | $371,182 | 116 | $173,957 | 0 | $0 | 136 | $242,993 | 3 | $63,667 |
| Private Mortgage Insurance Companies Aggregated Statistics For Year 2009 (Based on 152 full tracts) | ||||||
| A) Conventional Home Purchase Loans | B) Refinancings | C) Non-occupant Loans on < 5 Family Dwellings (A & B) | ||||
|---|---|---|---|---|---|---|
| Number | Average Value | Number | Average Value | Number | Average Value | |
| LOANS ORIGINATED | 790 | $275,787 | 151 | $346,046 | 4 | $94,000 |
| APPLICATIONS APPROVED, NOT ACCEPTED | 399 | $295,742 | 106 | $367,943 | 8 | $266,500 |
| APPLICATIONS DENIED | 164 | $278,396 | 56 | $360,250 | 2 | $94,000 |
| APPLICATIONS WITHDRAWN | 95 | $311,158 | 34 | $331,676 | 0 | $0 |
| FILES CLOSED FOR INCOMPLETENESS | 48 | $318,125 | 6 | $265,667 | 3 | $209,333 |
| Most common first names in Contra Costa County, CA among deceased individuals | ||
| Name | Count | Lived (average) |
|---|---|---|
| John | 4,641 | 74.4 years |
| Mary | 3,959 | 80.4 years |
| William | 3,778 | 74.7 years |
| Robert | 3,367 | 71.4 years |
| James | 2,875 | 71.5 years |
| George | 2,350 | 75.8 years |
| Charles | 2,158 | 73.8 years |
| Helen | 1,960 | 80.9 years |
| Dorothy | 1,848 | 78.7 years |
| Margaret | 1,845 | 80.4 years |
| Most common last names in Contra Costa County, CA among deceased individuals | ||
| Last name | Count | Lived (average) |
|---|---|---|
| Smith | 1,593 | 75.2 years |
| Johnson | 1,354 | 75.2 years |
| Williams | 1,020 | 73.3 years |
| Brown | 946 | 74.7 years |
| Jones | 888 | 74.7 years |
| Anderson | 802 | 77.6 years |
| Miller | 793 | 76.9 years |
| Davis | 773 | 74.5 years |
| Wilson | 568 | 75.5 years |
| Martin | 528 | 76.3 years |
| Businesses in Contra Costa County, CA | ||||
| Name | Count | Name | Count | |
|---|---|---|---|---|
| 24 Hour Fitness | 8 | Jamba Juice | 16 | |
| 7-Eleven | 38 | JoS. A. Bank | 2 | |
| 99 Cents Only Stores | 5 | Johnny Rockets | 1 | |
| ALDO | 1 | Jones New York | 18 | |
| AMF Bowling | 1 | Journeys | 2 | |
| AT&T | 21 | Justice | 3 | |
| Abercrombie & Fitch | 1 | KFC | 16 | |
| Ace Hardware | 17 | Kincaid | 1 | |
| Aeropostale | 2 | Kmart | 4 | |
| American Eagle Outfitters | 2 | Kohl's | 2 | |
| Ann Taylor | 2 | Kroger | 8 | |
| Apple Store | 1 | La-Z-Boy | 1 | |
| Applebee's | 4 | Lane Bryant | 2 | |
| Ashley Furniture | 1 | Lane Furniture | 8 | |
| Audi | 1 | LensCrafters | 4 | |
| AutoZone | 9 | Little Caesars Pizza | 14 | |
| Avenue | 4 | Long John Silver's | 2 | |
| BMW | 1 | Lowe's | 3 | |
| Baja Fresh Mexican Grill | 5 | Macy's | 4 | |
| Bakers | 1 | Marriott | 6 | |
| Bally Total Fitness | 1 | Marshalls | 4 | |
| Banana Republic | 2 | MasterBrand Cabinets | 35 | |
| Barnes & Noble | 4 | Mazda | 1 | |
| Baskin-Robbins | 12 | McDonald's | 32 | |
| Bath & Body Works | 4 | Men's Wearhouse | 6 | |
| Bebe | 1 | Motel 6 | 4 | |
| Bed Bath & Beyond | 3 | Motherhood Maternity | 6 | |
| Best Western | 3 | New Balance | 22 | |
| Big O Tires | 13 | Nike | 72 | |
| Blockbuster | 13 | Nissan | 4 | |
| Brookstone | 1 | Nordstrom | 1 | |
| Budget Car Rental | 3 | Office Depot | 3 | |
| Burger King | 26 | OfficeMax | 1 | |
| CVS | 31 | Old Navy | 2 | |
| Carl\s Jr. | 9 | Olive Garden | 1 | |
| Casual Male XL | 1 | Outback | 3 | |
| Charlotte Russe | 1 | Outback Steakhouse | 3 | |
| Chevrolet | 2 | Pac Sun | 3 | |
| Chico's | 4 | Panda Express | 10 | |
| Chipotle | 5 | Panera Bread | 2 | |
| Chuck E. Cheese's | 3 | Papa John's Pizza | 1 | |
| Church's Chicken | 2 | Payless | 13 | |
| Cinnabon | 2 | Penske | 4 | |
| Circle K | 2 | PetSmart | 4 | |
| Clarks | 1 | Pier 1 Imports | 4 | |
| Cold Stone Creamery | 8 | Pizza Hut | 5 | |
| Coldwater Creek | 2 | Plato's Closet | 1 | |
| Comfort Suites | 1 | Popeyes | 2 | |
| Costco | 4 | Pottery Barn | 1 | |
| Crate & Barrel | 1 | Quiznos | 17 | |
| Curves | 11 | RadioShack | 17 | |
| DHL | 7 | Ramada | 1 | |
| Dairy Queen | 4 | Red Lobster | 1 | |
| Days Inn | 5 | Red Robin | 2 | |
| Decora Cabinetry | 12 | Rite Aid | 14 | |
| Dennys | 7 | Rue21 | 1 | |
| Discount Tire | 5 | SAS Shoes | 5 | |
| Domino's Pizza | 9 | Safeway | 15 | |
| DressBarn | 2 | Sam's Club | 1 | |
| Dressbarn | 2 | Sears | 12 | |
| El Pollo Loco | 3 | Sephora | 2 | |
| Ethan Allen | 1 | Skechers USA | 2 | |
| Express | 2 | Spencer Gifts | 1 | |
| Extended Stay America | 3 | Sprint Nextel | 11 | |
| Famous Footwear | 1 | Staples | 7 | |
| Fashion Bug | 1 | Starbucks | 79 | |
| FedEx | 122 | Subaru | 1 | |
| Finish Line | 2 | Subway | 22 | |
| Firestone Complete Auto Care | 4 | Super 8 | 2 | |
| Foot Locker | 4 | T-Mobile | 23 | |
| Ford | 5 | T.J.Maxx | 4 | |
| Forever 21 | 3 | Taco Bell | 23 | |
| Fredericks Of Hollywood | 1 | Talbots | 2 | |
| GNC | 18 | Target | 7 | |
| GameStop | 14 | The Cheesecake Factory | 1 | |
| Gap | 2 | The Room Place | 4 | |
| Goodwill | 4 | Torrid | 1 | |
| Gymboree | 3 | Toyota | 4 | |
| H&M | 2 | Toys"R"Us | 6 | |
| H&R Block | 22 | Trader Joe's | 8 | |
| Haagen-Dazs | 3 | True Value | 2 | |
| Hilton | 4 | U-Haul | 23 | |
| Holiday Inn | 5 | UPS | 130 | |
| Hollister Co. | 2 | Urban Outfitters | 1 | |
| Home Depot | 7 | Vans | 26 | |
| HomeTown Buffet | 2 | Verizon Wireless | 5 | |
| Homestead Studio Suites | 1 | Victoria's Secret | 4 | |
| Honda | 2 | Volkswagen | 2 | |
| Hot Topic | 2 | Vons | 30 | |
| Hyatt | 1 | Walgreens | 22 | |
| IHOP | 6 | Walmart | 4 | |
| J. Jill | 2 | Wendy's | 9 | |
| J.Crew | 1 | Wet Seal | 1 | |
| JCPenney | 5 | Whole Foods Market | 2 | |
| Jack In The Box | 15 | YMCA | 3 | |
Contra Costa County on our top lists:
- #10 on the list of "Top 101 counties with the largest increase in the number of infant deaths per 1000 residents 2000-2006 to 2007-2013 (pop. 50,000+)"
- #15 on the list of "Top 101 counties with the lowest Sulfur Oxides Annual air pollution readings in 2012 (µg/m3)"
- #17 on the list of "Top 101 counties with the highest Nitrogen Dioxide air pollution readings in 2012 (ppm)"
- #31 on the list of "Top 101 counties with the highest percentage of residents that drank alcohol in the past 30 days"
- #34 on the list of "Top 101 counties with the highest surface withdrawal of fresh water for public supply (pop. 50,000+)"
- #35 on the list of "Top 101 counties with the highest surface withdrawal of fresh water for public supply"
- #38 on the list of "Top 101 counties with the highest percentage of residents that visited a dentist within the past year"
- #38 on the list of "Top 101 counties with the most Other congregations (pop. 50,000+)"
- #39 on the list of "Top 101 counties with the most Other congregations"
- #42 on the list of "Top 101 counties with the lowest average weight of females"
- #50 on the list of "Top 101 counties with the highest total withdrawal of fresh water for public supply (pop. 50,000+)"
- #51 on the list of "Top 101 counties with the lowest number of infant deaths per 1000 residents 2007-2013 (pop. 50,000+)"
- #51 on the list of "Top 101 counties with the highest total withdrawal of fresh water for public supply"
- #52 on the list of "Top 101 counties with the highest percentage of residents that exercised in the past month"
- #53 on the list of "Top 101 counties with the most Other adherents"
- #53 on the list of "Top 101 counties with the most Other adherents (pop. 50,000+)"
- #54 on the list of "Top 101 counties with the lowest Particulate Matter (PM10) Annual air pollution readings in 2012 (µg/m3)"
- #57 on the list of "Top 101 counties with the most Evangelical Protestant congregations"
- #57 on the list of "Top 101 counties with the most Evangelical Protestant congregations (pop. 50,000+)"
- #60 on the list of "Top 101 counties with the most Catholic adherents"