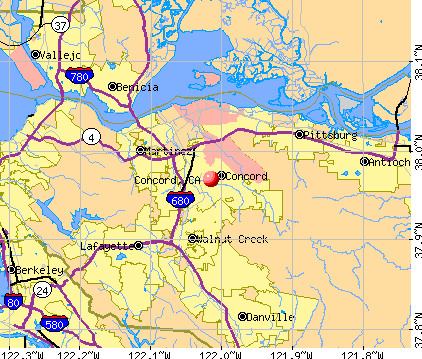
Concord, California
Concord: At the entrance to Memory Gardens
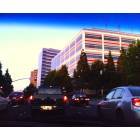
Concord: concord buildings from the top of a parking structure
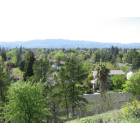
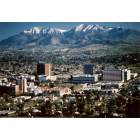
Concord: View of Concord/Walnut Creek from Lime Ridge Open Space, March 2007
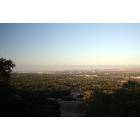
Concord: Mt. Diablo at sunrise
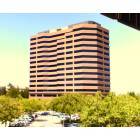
Concord: tall building
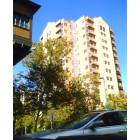
Concord: apartment building concord
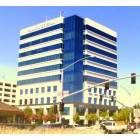
Concord: metroplex
Concord: downtown area concord
Concord: Concord, CA; Pleasant Hill and Walnut Creek also in view
Concord: downtown concord
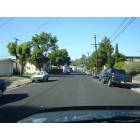
Concord: North Concord barrio
- see
26
more - add
your
Submit your own pictures of this city and show them to the world
- OSM Map
- General Map
- Google Map
- MSN Map
Population change since 2000: +0.7%
 |
| Males: 63,164 | |
| Females: 59,461 |
| Median resident age: | 40.4 years |
| California median age: | 37.9 years |
Zip codes: 94518, 94519, 94523, 94598.
Concord Zip Code Map| Concord: | $104,523 |
| CA: | $91,551 |
Estimated per capita income in 2022: $48,906 (it was $24,727 in 2000)
Concord city income, earnings, and wages data
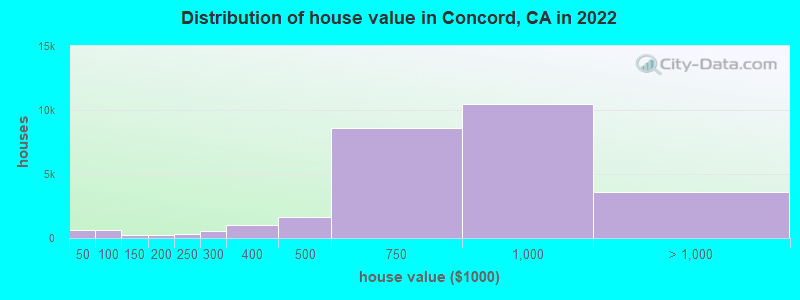
Estimated median house or condo value in 2022: $805,300 (it was $220,500 in 2000)
| Concord: | $805,300 |
| CA: | $715,900 |
Mean prices in 2022: all housing units: $860,998; detached houses: $929,891; townhouses or other attached units: $668,455; in 2-unit structures: $560,073; in 3-to-4-unit structures: $610,091; in 5-or-more-unit structures: $608,863; mobile homes: $293,585
Median gross rent in 2022: $2,042.
(7.0% for White Non-Hispanic residents, 10.4% for Black residents, 11.2% for Hispanic or Latino residents, 8.4% for American Indian residents, 11.6% for Native Hawaiian and other Pacific Islander residents, 12.5% for other race residents, 10.7% for two or more races residents)
Detailed information about poverty and poor residents in Concord, CA


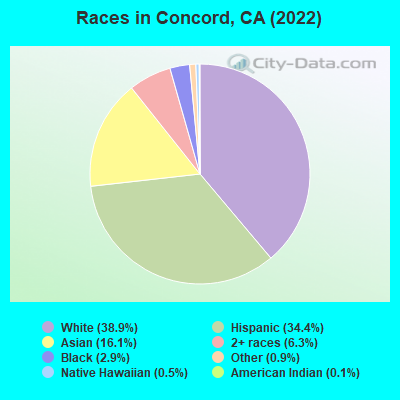
- 47,66538.9%White alone
- 42,17934.4%Hispanic
- 19,73316.1%Asian alone
- 7,7516.3%Two or more races
- 3,5112.9%Black alone
- 1,0470.9%Other race alone
- 5660.5%Native Hawaiian and Other
Pacific Islander alone - 1640.1%American Indian alone
According to our research of California and other state lists, there were 149 registered sex offenders living in Concord, California as of April 27, 2024.
The ratio of all residents to sex offenders in Concord is 864 to 1.
The ratio of registered sex offenders to all residents in this city is near the state average.
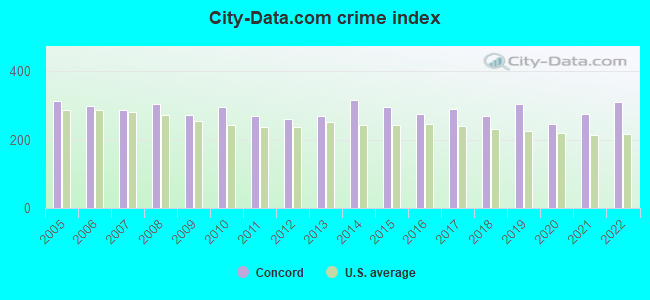
The City-Data.com crime index weighs serious crimes and violent crimes more heavily. Higher means more crime, U.S. average is 246.1. It adjusts for the number of visitors and daily workers commuting into cities.
- means the value is smaller than the state average.- means the value is about the same as the state average.
- means the value is bigger than the state average.
- means the value is much bigger than the state average.
Crime rate in Concord detailed stats: murders, rapes, robberies, assaults, burglaries, thefts, arson
Full-time law enforcement employees in 2021, including police officers: 169 (131 officers - 111 male; 20 female).
| Officers per 1,000 residents here: | 1.01 |
| California average: | 2.30 |
 Recent articles from our blog. Our writers, many of them Ph.D. graduates or candidates, create easy-to-read articles on a wide variety of topics.

 | Your thoughts about Concord (50 replies) |
| Are there any decent elementary schools in Concord? (22 replies) |
| Grid of railroad tracks west of Concord High School (6 replies) |
| Demographics and changes in the outer East Bay (675 replies) |
| Best place to purchase Condo...Concord, PH or Martinez (19 replies) |
| Commute to Vacaville from Concord or Sacramento? (7 replies) |
Latest news from Concord, CA collected exclusively by city-data.com from local newspapers, TV, and radio stations
Ancestries: English (4.0%), Irish (3.5%), European (3.4%), American (3.3%), Italian (2.9%), German (2.9%).
Current Local Time: PST time zone
Elevation: 80 feet
Land area: 30.1 square miles.
Population density: 4,069 people per square mile (average).
31,927 residents are foreign born (12.5% Latin America, 9.6% Asia).
| This city: | 25.7% |
| California: | 26.5% |
Median real estate property taxes paid for housing units with mortgages in 2022: $5,450 (0.7%)
Median real estate property taxes paid for housing units with no mortgage in 2022: $3,317 (0.4%)
Nearest city with pop. 200,000+: Central Contra Costa, CA (3.8 miles  , pop. 459,252).
Nearest city with pop. 1,000,000+: Los Angeles, CA (336.9 miles , pop. 3,694,820).
Nearest cities:
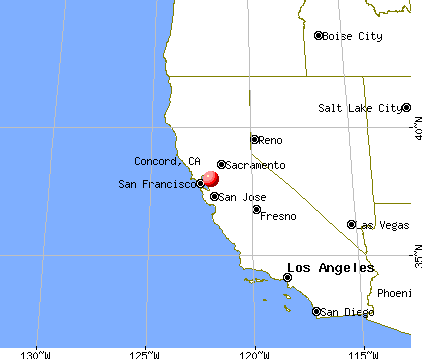
), ), ), )Latitude: 37.97 N, Longitude: 122.02 W
Daytime population change due to commuting: -102 (-0.1%)
Workers who live and work in this city: 23,249 (37.8%)
Area code: 925
Detailed articles:
- Concord: Introduction
- Concord Basic Facts
- Concord: Communications
- Concord: Convention Facilities
- Concord: Economy
- Concord: Education and Research
- Concord: Geography and Climate
- Concord: Health Care
- Concord: History
- Concord: Municipal Government
- Concord: Population Profile
- Concord: Recreation
- Concord: Transportation
Concord tourist attractions:
Concord, California accommodation & food services, waste management - Economy and Business Data
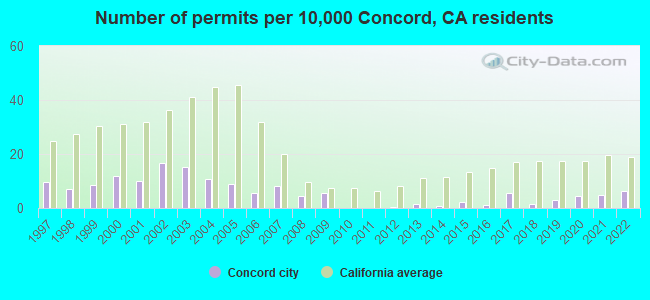
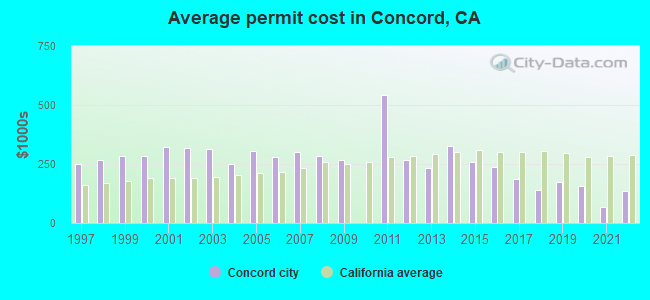
Single-family new house construction building permits:
- 2022: 77 buildings, average cost: $134,600
- 2021: 60 buildings, average cost: $68,500
- 2020: 52 buildings, average cost: $157,500
- 2019: 38 buildings, average cost: $172,600
- 2018: 18 buildings, average cost: $140,600
- 2017: 69 buildings, average cost: $185,200
- 2016: 15 buildings, average cost: $238,300
- 2015: 25 buildings, average cost: $258,300
- 2014: 7 buildings, average cost: $325,400
- 2013: 20 buildings, average cost: $230,900
- 2012: 4 buildings, average cost: $267,100
- 2011: 2 buildings, average cost: $542,900
- 2009: 69 buildings, average cost: $266,100
- 2008: 54 buildings, average cost: $284,700
- 2007: 101 buildings, average cost: $299,200
- 2006: 66 buildings, average cost: $278,900
- 2005: 110 buildings, average cost: $303,400
- 2004: 131 buildings, average cost: $249,400
- 2003: 183 buildings, average cost: $314,700
- 2002: 201 buildings, average cost: $315,500
- 2001: 120 buildings, average cost: $320,200
- 2000: 143 buildings, average cost: $285,800
- 1999: 102 buildings, average cost: $286,300
- 1998: 85 buildings, average cost: $267,500
- 1997: 118 buildings, average cost: $251,900
| Here: | 3.9% |
| California: | 5.1% |
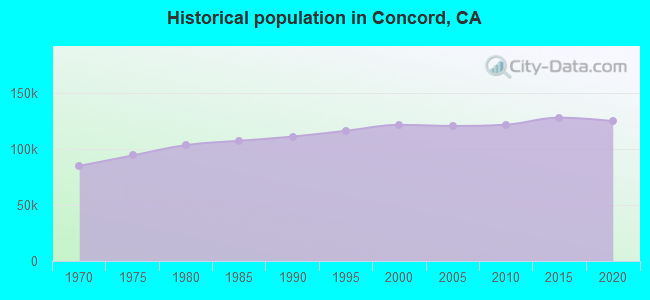
Population change in the 1990s: +9,824 (+8.8%).
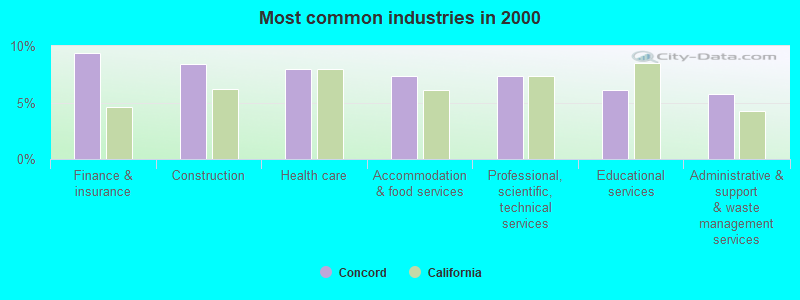
- Finance & insurance (9.4%)
- Construction (8.4%)
- Health care (8.0%)
- Accommodation & food services (7.4%)
- Professional, scientific, technical services (7.4%)
- Educational services (6.1%)
- Administrative & support & waste management services (5.7%)
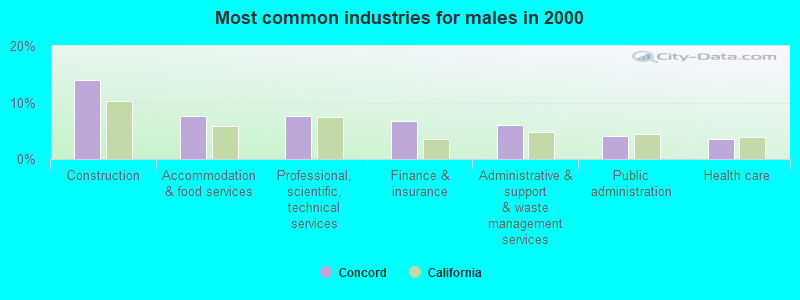
- Construction (14.1%)
- Accommodation & food services (7.7%)
- Professional, scientific, technical services (7.6%)
- Finance & insurance (6.7%)
- Administrative & support & waste management services (6.0%)
- Public administration (4.0%)
- Health care (3.5%)
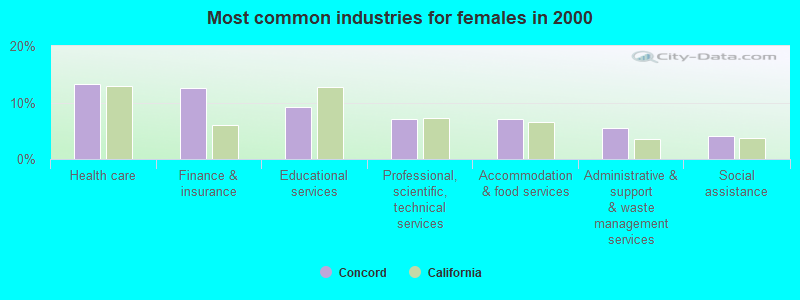
- Health care (13.2%)
- Finance & insurance (12.5%)
- Educational services (9.2%)
- Professional, scientific, technical services (7.0%)
- Accommodation & food services (7.0%)
- Administrative & support & waste management services (5.5%)
- Social assistance (4.2%)
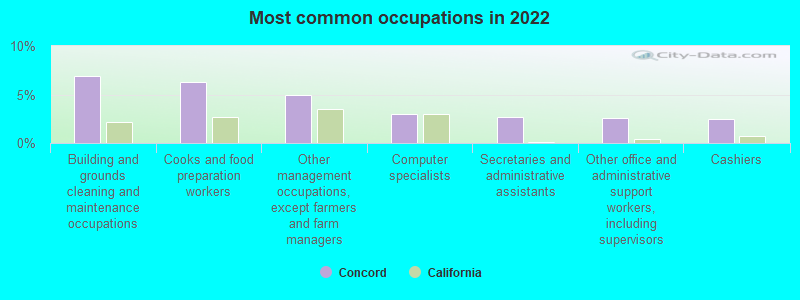
- Building and grounds cleaning and maintenance occupations (6.9%)
- Cooks and food preparation workers (6.3%)
- Other management occupations, except farmers and farm managers (4.9%)
- Computer specialists (3.0%)
- Secretaries and administrative assistants (2.7%)
- Other office and administrative support workers, including supervisors (2.6%)
- Cashiers (2.5%)
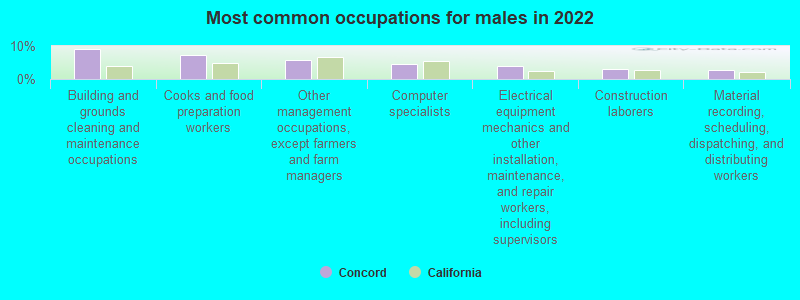
- Building and grounds cleaning and maintenance occupations (9.2%)
- Cooks and food preparation workers (7.3%)
- Other management occupations, except farmers and farm managers (5.6%)
- Computer specialists (4.6%)
- Electrical equipment mechanics and other installation, maintenance, and repair workers, including supervisors (3.9%)
- Construction laborers (2.9%)
- Material recording, scheduling, dispatching, and distributing workers (2.8%)
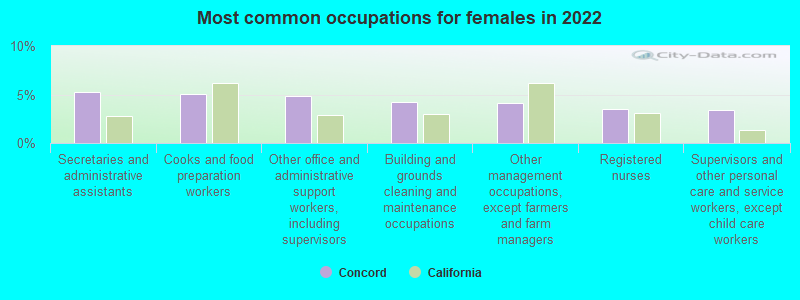
- Secretaries and administrative assistants (5.2%)
- Cooks and food preparation workers (5.0%)
- Other office and administrative support workers, including supervisors (4.8%)
- Building and grounds cleaning and maintenance occupations (4.3%)
- Other management occupations, except farmers and farm managers (4.1%)
- Registered nurses (3.5%)
- Supervisors and other personal care and service workers, except child care workers (3.4%)
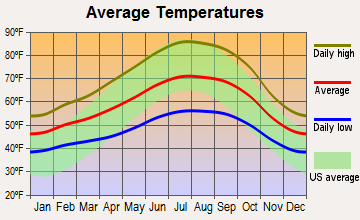
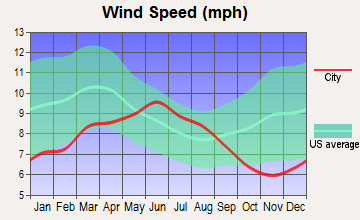
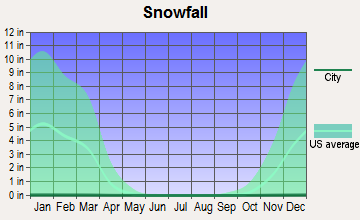
Average climate in Concord, California
Based on data reported by over 4,000 weather stations


|
|


(lower is better)
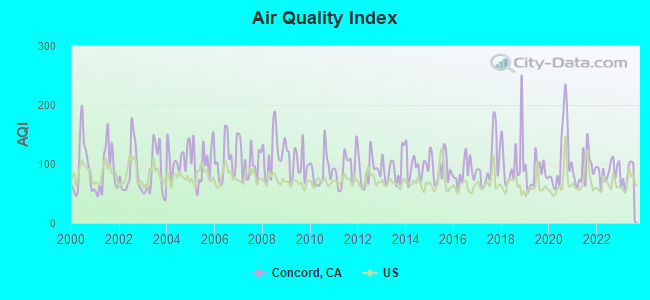
Air Quality Index (AQI) level in 2023 was 81.2. This is about average.
| City: | 81.2 |
| U.S.: | 72.6 |
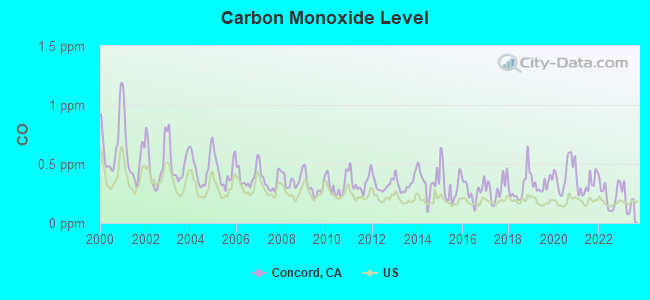
Carbon Monoxide (CO) [ppm] level in 2023 was 0.191. This is better than average. Closest monitor was 2.3 miles away from the city center.
| City: | 0.191 |
| U.S.: | 0.251 |
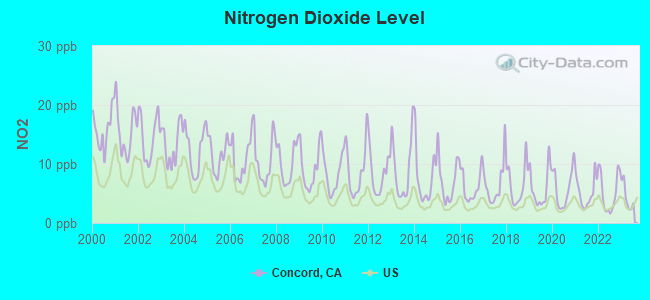
Nitrogen Dioxide (NO2) [ppb] level in 2023 was 4.39. This is about average. Closest monitor was 2.3 miles away from the city center.
| City: | 4.39 |
| U.S.: | 5.11 |
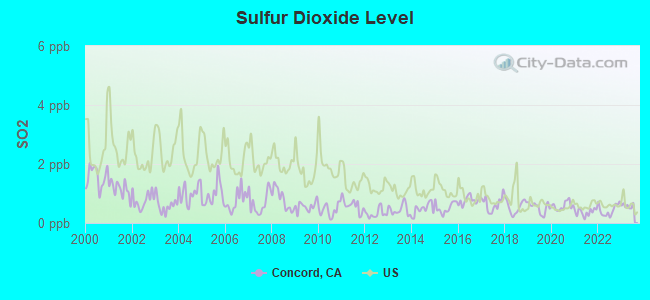
Sulfur Dioxide (SO2) [ppb] level in 2023 was 0.582. This is significantly better than average. Closest monitor was 2.3 miles away from the city center.
| City: | 0.582 |
| U.S.: | 1.515 |
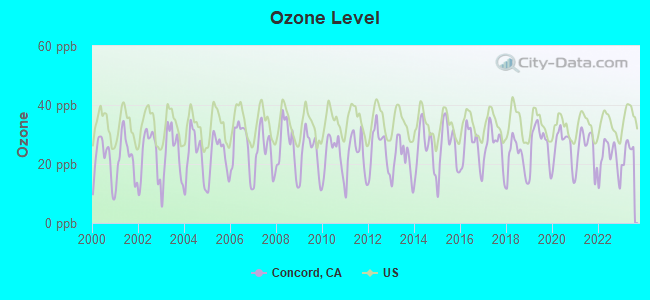
Ozone [ppb] level in 2023 was 24.3. This is better than average. Closest monitor was 2.3 miles away from the city center.
| City: | 24.3 |
| U.S.: | 33.3 |
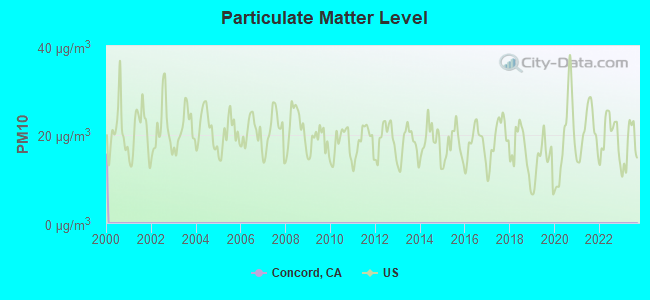
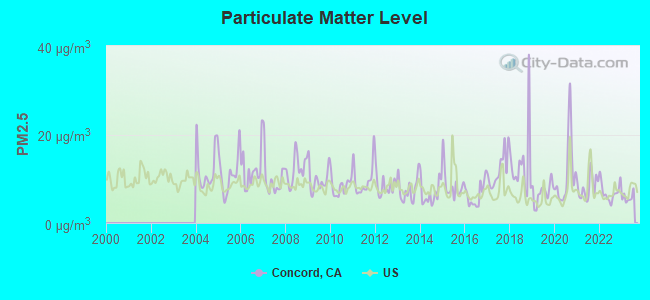
Particulate Matter (PM2.5) [µg/m3] level in 2023 was 5.74. This is significantly better than average. Closest monitor was 2.3 miles away from the city center.
| City: | 5.74 |
| U.S.: | 8.11 |
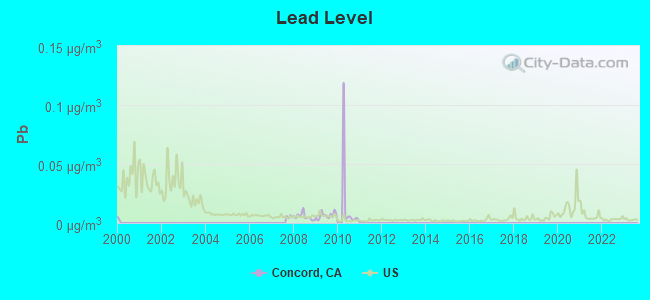
Lead (Pb) [µg/m3] level in 2010 was 0.0166. This is significantly worse than average. Closest monitor was 2.3 miles away from the city center.
| City: | 0.0166 |
| U.S.: | 0.0093 |
Earthquake activity:
Concord-area historical earthquake activity is significantly above California state average. It is 7706% greater than the overall U.S. average.On 4/18/1906 at 13:12:21, a magnitude 7.9 (7.9 UK, Class: Major, Intensity: VIII - XII) earthquake occurred 53.7 miles away from the city center, causing $524,000,000 total damage
On 10/18/1989 at 00:04:15, a magnitude 7.1 (6.5 MB, 7.1 MS, 6.9 MW, 7.0 ML) earthquake occurred 60.8 miles away from Concord center, causing 62 deaths (62 shaking deaths) and 3757 injuries, causing $1,305,032,704 total damage
On 11/4/1927 at 13:51:53, a magnitude 7.5 (7.5 UK) earthquake occurred 218.1 miles away from the city center
On 7/21/1952 at 11:52:14, a magnitude 7.7 (7.7 UK) earthquake occurred 265.0 miles away from the city center, causing $50,000,000 total damage
On 1/31/1922 at 13:17:28, a magnitude 7.6 (7.6 UK) earthquake occurred 267.4 miles away from Concord center
On 4/25/1992 at 18:06:04, a magnitude 7.2 (6.3 MB, 7.1 MS, 7.2 MW, 7.1 MW, Depth: 9.4 mi) earthquake occurred 198.2 miles away from Concord center, causing $75,000,000 total damage
Magnitude types: body-wave magnitude (MB), local magnitude (ML), surface-wave magnitude (MS), moment magnitude (MW)
Natural disasters:
The number of natural disasters in Contra Costa County (18) is near the US average (15).Major Disasters (Presidential) Declared: 11
Emergencies Declared: 3
Causes of natural disasters: Floods: 13, Storms: 7, Winter Storms: 7, Mudslides: 5, Landslides: 4, Drought: 1, Earthquake: 1, Hurricane: 1, Tornado: 1, Wind: 1, Other: 1 (Note: some incidents may be assigned to more than one category).

Main business address for: JCM PARTNERS LLC (OPERATORS OF APARTMENT BUILDINGS), CERUS CORP (BIOLOGICAL PRODUCTS (NO DIAGNOSTIC SUBSTANCES)), OCULAR SCIENCES INC /DE/ (OPHTHALMIC GOODS).
Hospitals in Concord:
- ASERACARE HOSPICE (1001 GALAXY WAY, #101)
- HAPPY VALLEY #3 (4118 PHOENIX STREET)
- HAPPY VALLEY 5 (1200 STREET ELIZABETH COURT)
- HAPPY VALLEY ICF/DD-H #4 (4160 PHOENIX STREET)
- HEARTLAND HOME HEALTH CARE AND HOSPICE (901 SUNVALLEY BOULEVARD, SUITE 22)
- JOHN MUIR BEHAVIORAL HEALTH CENTER (2740 GRANT ST)
- JOHN MUIR MEDICAL CENTER - CONCORD CAMPUS (Voluntary non-profit - Private, 2540 EAST ST)
Nursing Homes in Concord:
- KINDRED NURSING AND HEALTHCARE - BAYBERRY (1800 ADOBE STREET)
- MT DIABLO MEDICAL PAVILION D/P SNF (2740 GRANT ST)
- PARK LANE CONVALESCENT HOSPITAL (1034 OAK GROVE ROAD)
- SAN MIGUEL VILLA (1050 SAN MIGUEL ROAD)
- STONEBROOK HEALTHCARE CENTER (4367 CONCORD BLVD.)
- WILLOW PASS HEALTHCARE CENTER (3318 WILLOW PASS ROAD)
- WINDSOR MANOR REHABILITATION CENTER (3806 CLAYTON ROAD)
Dialysis Facilities in Concord:
Home Health Centers in Concord:
Airports and heliports located in Concord:
- Buchanan Field Airport (CCR) (Runways: 4, Air Taxi Ops: 3,734, Itinerant Ops: 46,077, Local Ops: 59,301, Military Ops: 303)
- Q Area Heliport (60CA)
Amtrak stations near Concord:
- 8 miles: MARTINEZ (401 FERRY ST.) . Services: ticket office, fully wheelchair accessible, enclosed waiting area, public restrooms, public payphones, full-service food facilities, free short-term parking, free long-term parking, call for taxi service, public transit connection.
- 12 miles: ANTIOCH-PITTSBURG (ANTIOCH, I ST. & SANTA FE TRACKS) . Services: public payphones, full-service food facilities, free short-term parking, free long-term parking, call for taxi service, intercity bus service, public transit connection.
- 17 miles: VALLEJO-MARINE WORLD (VALLEJO, 1000 FAIRGROUNDS DR.) - Bus Station . Services: fully wheelchair accessible, public restrooms, public payphones, snack bar, free short-term parking, free long-term parking, call for taxi service.
Colleges/Universities in Concord:
- Heald College-Concord (Full-time enrollment: 1,720; Location: 5130 Commercial Circle; Private, for-profit; Website: www.Heald.edu)
- ITT Technical Institute-Concord (Full-time enrollment: 326; Location: 1140 Galaxy Way Ste 400; Private, for-profit; Website: www.itt-tech.edu)
- Mt Diablo Adult Education (Full-time enrollment: 116; Location: Loma Vista Adult Center - 1266 San Carlos Avenue.; Public; Website: www.mdusd.k12.ca.us/adulted)
- Paris Beauty College (Full-time enrollment: 101; Location: 1655 Willow Pass Road; Private, for-profit; Website: www.Parisbeautycollege.com)
- Milan Institute of Cosmetology-Concord (Location: 2150 John Glenn Dr., Ste 200; Private, for-profit; Website: www.milaninstitute.edu)
Colleges/universities with over 2000 students nearest to Concord:
- Diablo Valley College (about 3 miles; Pleasant Hill, CA; Full-time enrollment: 13,015)
- Los Medanos College (about 9 miles; Pittsburg, CA; FT enrollment: 5,289)
- Saint Mary's College of California (about 11 miles; Moraga, CA; FT enrollment: 4,200)
- Merritt College (about 15 miles; Oakland, CA; FT enrollment: 2,842)
- University of California-Berkeley (about 15 miles; Berkeley, CA; FT enrollment: 37,127)
- Berkeley City College (about 16 miles; Berkeley, CA; FT enrollment: 3,146)
- Contra Costa College (about 18 miles; San Pablo, CA; FT enrollment: 4,249)
Biggest public high schools in Concord:
- CLAYTON VALLEY CHARTER HIGH (Students: 1,364, Location: 1101 ALBERTA WAY, Grades: 9-12, Charter school)
- MT. DIABLO HIGH (Students: 1,056, Location: 2455 GRANT ST., Grades: 9-12)
- CONCORD HIGH (Students: 1,044, Location: 4200 CONCORD BLVD., Grades: 9-12)
- FLOYD I. MARCHUS (Students: 97, Location: 2900 AVON AVE., Grades: KG-12)
- SUMMIT HIGH (CONTINUATION) (Students: 48, Location: 4200 CONCORD BLVD., Grades: 9-12)
- OLYMPIC CONTINUATION HIGH (Students: 43, Location: 2730 SALVIO ST., Grades: 9-12)
- DIABLO COMMUNITY DAY (Students: 17, Location: 1026 MOHR LN., Grades: 7-12)
- CROSSROADS HIGH (CONTINUATION) (Students: 15, Location: 2701 WILLOW PASS, Grades: 9-12)
- NUEVA VISTA HIGH (CONTINUATION) (Students: 15, Location: 4200 CONCORD BLVD., Grades: 9-12)
- YGNACIO VALLEY HIGH (Location: 755 OAK GROVE RD., Grades: 9-12)
Private high schools in Concord:
- DE LA SALLE HIGH SCHOOL (Students: 1,026, Location: 1130 WINTON DR, Grades: 9-12, Boys only)
- CARONDELET HIGH SCHOOL (Students: 803, Location: 1133 WINTON DR, Grades: 9-12, Girls only)
- CONCORD CHRISTIAN SCHOOL (Students: 83, Location: 2120 OLIVERA CT, Grades: PK-12)
- SENECA CENTER (Students: 37, Location: 2351 OLIVERA RD, Grades: 7-12)
Biggest public elementary/middle schools in Concord:
- EL DORADO MIDDLE (Students: 878, Location: 1750 W. ST., Grades: 6-8)
- PINE HOLLOW MIDDLE (Students: 694, Location: 5522 PINE HOLLOW RD., Grades: 6-8)
- OAK GROVE MIDDLE (Students: 546, Location: 2050 MINERT RD., Grades: 6-8)
- MEADOW HOMES ELEMENTARY (Students: 531, Location: 1371 DETROIT AVE., Grades: KG-5)
- HIGHLANDS ELEMENTARY (Students: 452, Location: 1326 PENNSYLVANIA BLVD., Grades: KG-5)
- CAMBRIDGE ELEMENTARY (Students: 395, Location: 1135 LACEY LN., Grades: KG-5)
- MONTE GARDENS ELEMENTARY (Students: 378, Location: 3841 LARKSPUR DR., Grades: KG-5)
- SUN TERRACE ELEMENTARY (Students: 331, Location: 2448 FLOYD LN., Grades: KG-5)
- YGNACIO VALLEY ELEMENTARY (Students: 301, Location: 2217 CHALOMAR RD., Grades: KG-5)
- EL MONTE ELEMENTARY (Students: 277, Location: 1400 DINA DR., Grades: KG-5)
Biggest private elementary/middle schools in Concord:
- TABERNACLE SCHOOL (Students: 502, Location: 4380 CONCORD BLVD, Grades: PK-8)
- ST AGNES ELEMENTARY SCHOOL (Students: 354, Location: 3886 CHESTNUT AVE, Grades: KG-8)
- ST FRANCIS OF ASSISI SCHOOL (Students: 322, Location: 866 OAK GROVE RD, Grades: KG-8)
- KINGS VALLEY CHRISTIAN SCHOOL (Students: 279, Location: 4255 CLAYTON RD, Grades: PK-8)
- CALVARY TEMPLE CHRISTIAN SCHOOL (Students: 232, Location: 4725 EVORA RD, Grades: PK-8)
- QUEEN OF ALL SAINTS SCHOOL (Students: 206, Location: 2391 GRANT ST, Grades: PK-8)
- WOOD ROSE ACADEMY (Students: 118, Location: 4347 COWELL RD, Grades: PK-8)
- YGNACIO VALLEY CHRISTIAN SCHOOL (Students: 118, Location: 4977 CONCORD BLVD, Grades: KG-8)
- THE CONCORDIA SCHOOL (Students: 75, Location: 2353 5TH AVE, Grades: PK-6)
- HOPE ACADEMY FOR DYSLEXICS (Students: 18, Location: 5353 CONCORD BLVD, Grades: 3-8)
Points of interest:
Notable locations in Concord: Concord Yard (A), Diablo Creek Golf Course (B), Solano 2 Drive-In (C), Concord Pavilion (D), Concord Station (E), Concord Branch Contra Costa County Library (F), Bay Medic Transportation (G), Federal Fire Department Station 25 (H), Contra Costa County Fire Protection District Station 8 (I), Contra Costa County Fire Protection District Station 6 (J), Contra Costa County Fire Protection District Station 10 (K), Concord City Hall (L). Display/hide their locations on the map
Shopping Centers: Ygnacio Valley Shopping Center (1), Concord Park and Shop Shopping Center (2), Willows Shopping Center (3), Terminal Center Shopping Center (4), Sun Valley Shopping Center (5), Vineyard Shopping Center (6), Treat Plaza Shopping Center (7), Dianda Plaza Shopping Center (8), Dana Plaza Shopping Center (9). Display/hide their locations on the map
Main business address in Concord include: JCM PARTNERS LLC (A), CERUS CORP (B), OCULAR SCIENCES INC /DE/ (C). Display/hide their locations on the map
Churches in Concord include: First Presbyterian Church of Concord (A), Saint Michael And All Angels Church (B), Queen of All Saints Catholic Church (C), Grace Free Will Baptist Church (D), Grace Chinese Alliance Church (E), First Christian Church (F), First Baptist Church of Concord (G), Faith Missionary Baptist Church (H), Church of Jesus Christ of Latter Day Saints (I). Display/hide their locations on the map
Cemeteries: Live Oak Cemetery (1), Saint Stephen Cemetery (2). Display/hide their locations on the map
Creeks: Galindo Creek (A), Pine Creek (B). Display/hide their locations on the map
Parks in Concord include: Cambridge Park (1), Ellis Lake Park (2), J F Baldwin Park (3), Len Hester Park (4), Meadow Homes Park (5), Olivera Park (6), Todos Santos Plaza (7), Concord Community Park (8), Ygnacio Valley Park (9). Display/hide their locations on the map
Tourist attraction: American Fine Art at Gallerie Konzeptwerk (Art Museums; Post Office Box 818 ) (1). Display/hide its approximate location on the map
Hotels: Best Western Heritage Inn (4600 Clayton Road) (1), Atrium Court Restaurant (45 John Glenn Drive) (2), Best Western Heritage Inn Concord - Hotel (4600 Clayton Road) (3). Display/hide their approximate locations on the map
Court: Federal Bureau Of Investigation (1850 Gateway Boulevard) (1). Display/hide its approximate location on the map
Birthplace of: Dave Brubeck - Musician, Mike Squires (musician) - Rock guitarist, Tom Hanks - (born 1956), actor, Andrew Dornenburg - Two-time James Beard Award-winning author, Bill Roper (video game producer) - Video game designer, Brad Bergesen - Baseball player, David Loverne - 2005 NFL player (Detroit Lions, born: May 22, 1976), Demetrius Williams - Football player, Larry Bryggman - Film actor, Matt Gutierrez - Football player.
Drinking water stations with addresses in Concord and their reported violations in the past:
PSEA CAMP ALMANOR (Population served: 40, Groundwater):Past health violations:
- MCL, Monthly (TCR) - In DEC-2008, Contaminant: Coliform. Follow-up actions: St Violation/Reminder Notice (JAN-29-2009)
- MCL, Monthly (TCR) - In DEC-2008, Contaminant: Coliform. Follow-up actions: St Violation/Reminder Notice (JAN-29-2009)
Drinking water stations with addresses in Concord that have no violations reported:
- EBRPD MORGAN TERRITORY (Population served: 25, Primary Water Source Type: Groundwater)
- LAKE ALPINE IMP. ASSOC. (Population served: 25, Primary Water Source Type: Groundwater)
- CCWD/BRENTWOOD WTP (Population served: 1, Primary Water Source Type: Surface water)
| This city: | 2.7 people |
| California: | 2.9 people |
| This city: | 67.9% |
| Whole state: | 68.7% |
| This city: | 7.8% |
| Whole state: | 7.2% |
Likely homosexual households (counted as self-reported same-sex unmarried-partner households)
- Lesbian couples: 0.6% of all households
- Gay men: 0.5% of all households
People in group quarters in Concord in 2010:
- 469 people in nursing facilities/skilled-nursing facilities
- 145 people in group homes intended for adults
- 90 people in emergency and transitional shelters (with sleeping facilities) for people experiencing homelessness
- 90 people in other noninstitutional facilities
- 74 people in workers' group living quarters and job corps centers
- 69 people in residential treatment centers for adults
- 44 people in college/university student housing
- 31 people in group homes for juveniles (non-correctional)
- 18 people in in-patient hospice facilities
- 17 people in residential treatment centers for juveniles (non-correctional)
People in group quarters in Concord in 2000:
- 706 people in nursing homes
- 445 people in other noninstitutional group quarters
- 61 people in homes or halfway houses for drug/alcohol abuse
- 29 people in homes for the mentally retarded
- 25 people in homes for the mentally ill
- 22 people in military barracks, etc.
- 21 people in college dormitories (includes college quarters off campus)
- 17 people in homes for the physically handicapped
- 16 people in religious group quarters
- 10 people in other group homes
- 2 people in other nonhousehold living situations
Banks with most branches in Concord (2011 data):
- Wells Fargo Bank, National Association: Www.Wellsfargo.com, Mount Diablo Rcbo Branch, Oak Grove Plaza Branch, Concord Branch, Clayton Valley Branch. Info updated 2011/04/05: Bank assets: $1,161,490.0 mil, Deposits: $905,653.0 mil, headquarters in Sioux Falls, SD, positive income, 6395 total offices, Holding Company: Wells Fargo & Company
- U.S. Bank National Association: Diamond Boulevard Branch, Clayton Road Branch, Willow Pass Road Safeway Branch, Concord Branch. Info updated 2012/01/30: Bank assets: $330,470.8 mil, Deposits: $236,091.5 mil, headquarters in Cincinnati, OH, positive income, 3121 total offices, Holding Company: U.S. Bancorp
- Bank of America, National Association: Clayton Branch, Concord Main Branch, Sun Valley Center Branch. Info updated 2009/11/18: Bank assets: $1,451,969.3 mil, Deposits: $1,077,176.8 mil, headquarters in Charlotte, NC, positive income, 5782 total offices, Holding Company: Bank Of America Corporation
- JPMorgan Chase Bank, National Association: Concord Branch, Salvio Street Branch, 5400 Ygnacio Valley Rd Branch. Info updated 2011/11/10: Bank assets: $1,811,678.0 mil, Deposits: $1,190,738.0 mil, headquarters in Columbus, OH, positive income, International Specialization, 5577 total offices, Holding Company: Jpmorgan Chase & Co.
- Citibank, National Association: Concord Branch at 4420 Treat Boulevard, branch established on 1921/01/01; 2950 Treat Blvd Branch at 2950 Treat Blvd, branch established on 1945/01/01. Info updated 2012/01/10: Bank assets: $1,288,658.0 mil, Deposits: $882,541.0 mil, headquarters in Sioux Falls, SD, positive income, International Specialization, 1048 total offices, Holding Company: Citigroup Inc.
- Sterling Savings Bank: Concord Branch at 1900 Grant Avenue, branch established on 2005/07/11. Info updated 2012/03/21: Bank assets: $9,207.8 mil, Deposits: $6,454.1 mil, headquarters in Spokane, WA, positive income, Commercial Lending Specialization, 192 total offices, Holding Company: Sterling Financial Corporation
- Union Bank, National Association: Concord Instore Branch at 5190 Clayton Road, branch established on 2000/07/18. Info updated 2011/09/01: Bank assets: $88,967.5 mil, Deposits: $65,286.4 mil, headquarters in San Francisco, CA, positive income, Commercial Lending Specialization, 403 total offices, Holding Company: Mitsubishi Ufj Financial Group, Inc.
- Bank of Agriculture and Commerce: Concord Branch at 1935 Diamond Blvd, branch established on 1996/09/03. Info updated 2009/08/28: Bank assets: $469.4 mil, Deposits: $403.6 mil, headquarters in Stockton, CA, positive income, Commercial Lending Specialization, 10 total offices, Holding Company: Bac Financial Inc.
- Bank of the West: Concord Branch at 1969 Diamond Boulevard, branch established on 1997/02/14. Info updated 2009/11/16: Bank assets: $62,408.3 mil, Deposits: $43,995.2 mil, headquarters in San Francisco, CA, positive income, 647 total offices, Holding Company: Bnp Paribas
- 4 other banks with 4 local branches
For population 15 years and over in Concord:
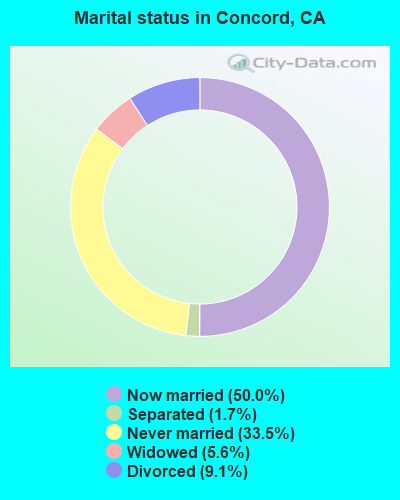
- Never married: 33.5%
- Now married: 50.0%
- Separated: 1.7%
- Widowed: 5.6%
- Divorced: 9.1%
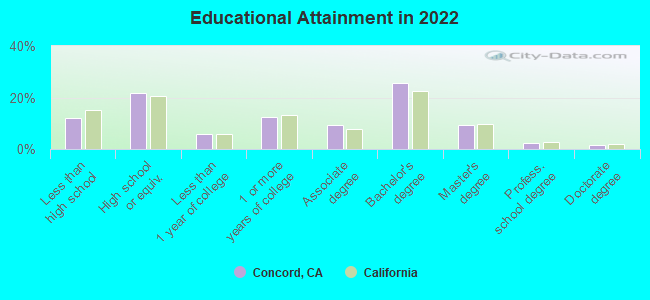
For population 25 years and over in Concord:
- High school or higher: 88.1%
- Bachelor's degree or higher: 38.7%
- Graduate or professional degree: 13.1%
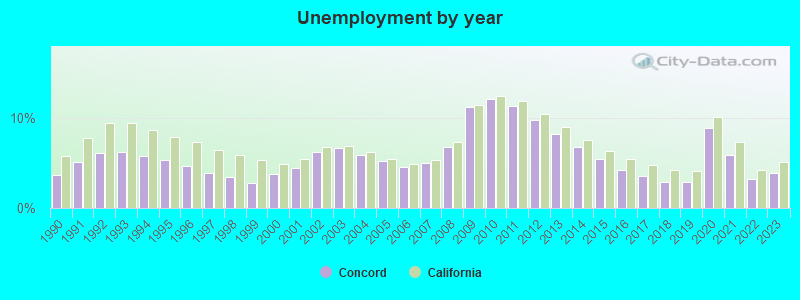
- Unemployed: 5.2%
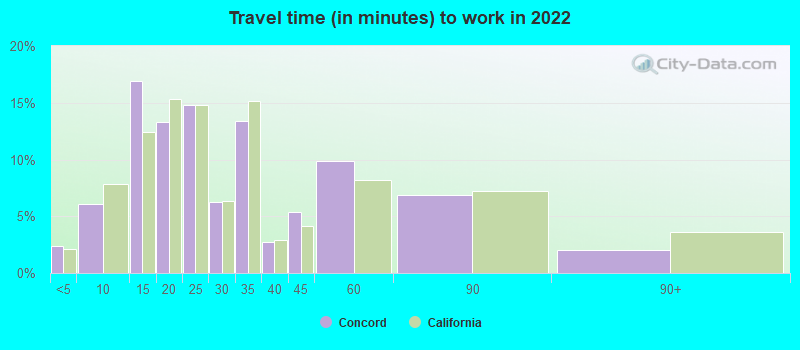
- Mean travel time to work (commute): 26.6 minutes
| Here: | 13.9 |
| California average: | 15.5 |


Graphs represent county-level data. Detailed 2008 Election Results
Neighborhoods in Concord:
(Concord, California Neighborhood Map)- Baldwin Park neighborhood
- Buchanan Field neighborhood
- CSU Hayward CCC neighborhood
- Camara neighborhood
- Cambridge Park neighborhood
- Canterbury Village neighborhood
- Clayton Valley neighborhood
- Clayton Valley Center neighborhood
- Clayton Valley Highlands neighborhood
- Colony Park neighborhood
- Concord Naval Weapons Station neighborhood
- Concord Park neighborhood
- Concord Pavilion neighborhood
- Concord Valley (Concord Valley District) neighborhood
- Cowell neighborhood
- Dana Estates neighborhood
- Diablo Creek Golf Course neighborhood
- Ellis Lake neighborhood
- Estates neighborhood
- Four Corners neighborhood
- Meadowhomes neighborhood
- North Concord (Northern Concord) neighborhood
- San Vicente neighborhood
- Southern Concord neighborhood
- Sun Terrace neighborhood
- Todos Santos neighborhood
- Ygnacio Valley neighborhood
Religion statistics for Concord, CA (based on Contra Costa County data)


| Religion | Adherents | Congregations |
|---|---|---|
| Catholic | 228,400 | 34 |
| Evangelical Protestant | 81,120 | 352 |
| Other | 48,553 | 123 |
| Mainline Protestant | 32,693 | 101 |
| Black Protestant | 10,395 | 34 |
| Orthodox | 2,435 | 8 |
| None | 645,429 | - |
Food Environment Statistics:
| Contra Costa County: | 1.78 / 10,000 pop. |
| California: | 2.14 / 10,000 pop. |
| Contra Costa County: | 0.05 / 10,000 pop. |
| California: | 0.04 / 10,000 pop. |
| This county: | 0.51 / 10,000 pop. |
| California: | 0.62 / 10,000 pop. |
| Contra Costa County: | 1.75 / 10,000 pop. |
| California: | 1.49 / 10,000 pop. |
| This county: | 6.73 / 10,000 pop. |
| State: | 7.42 / 10,000 pop. |
| Here: | 7.1% |
| California: | 7.3% |
| Here: | 22.2% |
| California: | 21.3% |
| Here: | 16.8% |
| California: | 17.9% |
Health and Nutrition:
| Concord: | 50.2% |
| California: | 49.4% |
| This city: | 48.6% |
| California: | 48.0% |
| Concord: | 28.1 |
| California: | 28.1 |
| Concord: | 20.5% |
| State: | 20.2% |
| Concord: | 10.8% |
| State: | 11.2% |
| Here: | 6.8 |
| California: | 6.8 |
| Concord: | 32.3% |
| State: | 31.5% |
| Concord: | 57.3% |
| California: | 56.4% |
| This city: | 80.6% |
| California: | 80.9% |
More about Health and Nutrition of Concord, CA Residents
| Local government employment and payroll (March 2022) | |||||
| Function | Full-time employees | Monthly full-time payroll | Average yearly full-time wage | Part-time employees | Monthly part-time payroll |
|---|---|---|---|---|---|
| Police Protection - Officers | 166 | $2,073,575 | $149,897 | 0 | $0 |
| Police - Other | 59 | $368,240 | $74,896 | 19 | $43,889 |
| Streets and Highways | 53 | $336,671 | $76,227 | 9 | $39,375 |
| Other Government Administration | 36 | $288,599 | $96,200 | 8 | $30,031 |
| Financial Administration | 33 | $254,550 | $92,564 | 3 | $13,600 |
| Parks and Recreation | 27 | $194,136 | $86,283 | 150 | $187,643 |
| Other and Unallocable | 21 | $126,442 | $72,253 | 4 | $16,231 |
| Sewerage | 11 | $53,634 | $58,510 | 0 | $0 |
| Housing and Community Development (Local) | 4 | $45,249 | $135,747 | 1 | $3,073 |
| Solid Waste Management | 2 | $12,238 | $73,428 | 0 | $0 |
| Judicial and Legal | 2 | $27,082 | $162,492 | 0 | $0 |
| Totals for Government | 414 | $3,780,416 | $109,577 | 194 | $333,842 |
Concord government finances - Expenditure in 2017 (per resident):
- Construction - Central Staff Services: $3,916,000 ($31.93)
Housing and Community Development: $2,881,000 ($23.49)
Regular Highways: $1,311,000 ($10.69)
Sewerage: $937,000 ($7.64)
Police Protection: $636,000 ($5.19)
Parks and Recreation: $398,000 ($3.25)
- Current Operations - Police Protection: $52,855,000 ($431.03)
Regular Highways: $29,599,000 ($241.38)
Sewerage: $22,685,000 ($184.99)
Transit Utilities: $20,236,000 ($165.02)
Central Staff Services: $17,641,000 ($143.86)
Parks and Recreation: $10,266,000 ($83.72)
Financial Administration: $8,754,000 ($71.39)
Judicial and Legal Services: $1,229,000 ($10.02)
Housing and Community Development: $751,000 ($6.12)
Protective Inspection and Regulation - Other: $352,000 ($2.87)
General - Other: $36,000 ($0.29)
- General - Interest on Debt: $2,547,000 ($20.77)
- Other Capital Outlay - Sewerage: $1,668,000 ($13.60)
Parks and Recreation: $1,330,000 ($10.85)
General - Other: $516,000 ($4.21)
General Public Building: $120,000 ($0.98)
- Total Salaries and Wages: $2,147,000 ($17.51)
Concord government finances - Revenue in 2017 (per resident):
- Charges - Sewerage: $29,922,000 ($244.01)
Other: $11,468,000 ($93.52)
Parks and Recreation: $4,225,000 ($34.45)
Regular Highways: $1,043,000 ($8.51)
- Federal Intergovernmental - Transit Utilities: $11,939,000 ($97.36)
Other: $2,509,000 ($20.46)
Housing and Community Development: $1,068,000 ($8.71)
- Local Intergovernmental - Transit Utilities: $11,809,000 ($96.30)
Other: $2,365,000 ($19.29)
- Miscellaneous - General Revenue - Other: $4,562,000 ($37.20)
Interest Earnings: $1,555,000 ($12.68)
Rents: $1,235,000 ($10.07)
Fines and Forfeits: $785,000 ($6.40)
Special Assessments: $21,000 ($0.17)
Sale of Property: $17,000 ($0.14)
- Revenue - Transit Utilities: $3,269,000 ($26.66)
- State Intergovernmental - Transit Utilities: $4,130,000 ($33.68)
Highways: $2,541,000 ($20.72)
Other: $1,360,000 ($11.09)
General Local Government Support: $112,000 ($0.91)
- Tax - General Sales and Gross Receipts: $35,535,000 ($289.79)
Property: $33,504,000 ($273.22)
Other: $14,194,000 ($115.75)
Public Utilities Sales: $7,623,000 ($62.17)
Occupation and Business License - Other: $3,739,000 ($30.49)
Other Selective Sales: $2,917,000 ($23.79)
Other License: $2,202,000 ($17.96)
Documentary and Stock Transfer: $695,000 ($5.67)
Concord government finances - Debt in 2017 (per resident):
- Long Term Debt - Beginning Outstanding - Unspecified Public Purpose: $87,917,000 ($716.96)
Outstanding Unspecified Public Purpose: $76,171,000 ($621.17)
Retired Unspecified Public Purpose: $11,745,000 ($95.78)
Concord government finances - Cash and Securities in 2017 (per resident):
- Bond Funds - Cash and Securities: $28,147,000 ($229.54)
- Other Funds - Cash and Securities: $139,642,000 ($1138.77)
- Sinking Funds - Cash and Securities: $3,603,000 ($29.38)
6.37% of this county's 2021 resident taxpayers lived in other counties in 2020 ($134,084 average adjusted gross income)
| Here: | 6.37% |
| California average: | 5.19% |
0.01% of residents moved from foreign countries ($98 average AGI)
Contra Costa County: 0.01% California average: 0.03%
Top counties from which taxpayers relocated into this county between 2020 and 2021:
| from Alameda County, CA | |
| from San Francisco County, CA | |
| from Santa Clara County, CA |
7.09% of this county's 2020 resident taxpayers moved to other counties in 2021 ($123,334 average adjusted gross income)
| Here: | 7.09% |
| California average: | 6.14% |
0.01% of residents moved to foreign countries ($92 average AGI)
Contra Costa County: 0.01% California average: 0.02%
Top counties to which taxpayers relocated from this county between 2020 and 2021:
| to Alameda County, CA | |
| to Solano County, CA | |
| to San Francisco County, CA |
| Businesses in Concord, CA | ||||
| Name | Count | Name | Count | |
|---|---|---|---|---|
| 24 Hour Fitness | 1 | Honda | 1 | |
| 7-Eleven | 7 | Hot Topic | 1 | |
| 99 Cents Only Stores | 2 | IHOP | 1 | |
| ALDO | 1 | JCPenney | 1 | |
| AT&T | 4 | Jack In The Box | 2 | |
| Abercrombie & Fitch | 1 | Jamba Juice | 2 | |
| Ace Hardware | 2 | Johnny Rockets | 1 | |
| Aeropostale | 1 | Jones New York | 4 | |
| American Eagle Outfitters | 1 | Journeys | 1 | |
| Ashley Furniture | 1 | Justice | 1 | |
| Audi | 1 | KFC | 2 | |
| AutoZone | 1 | Kmart | 1 | |
| Avenue | 1 | Kroger | 1 | |
| BMW | 1 | Lane Bryant | 1 | |
| Baja Fresh Mexican Grill | 1 | Lane Furniture | 2 | |
| Bakers | 1 | LensCrafters | 1 | |
| Baskin-Robbins | 3 | Little Caesars Pizza | 2 | |
| Bath & Body Works | 1 | Lowe's | 1 | |
| Bebe | 1 | Macy's | 1 | |
| Best Western | 1 | MasterBrand Cabinets | 6 | |
| Big O Tires | 2 | Mazda | 1 | |
| Blockbuster | 1 | McDonald's | 4 | |
| Brookstone | 1 | Men's Wearhouse | 1 | |
| Burger King | 4 | Motel 6 | 1 | |
| Burlington Coat Factory | 1 | Motherhood Maternity | 1 | |
| CVS | 3 | New Balance | 4 | |
| Charlotte Russe | 1 | Nike | 19 | |
| Chevrolet | 1 | Nissan | 1 | |
| Chuck E. Cheese's | 1 | Old Navy | 1 | |
| Cinnabon | 1 | Pac Sun | 1 | |
| Circle K | 1 | Panera Bread | 1 | |
| Costco | 1 | Payless | 3 | |
| Curves | 2 | Penske | 1 | |
| DHL | 1 | PetSmart | 1 | |
| Dairy Queen | 2 | Pier 1 Imports | 1 | |
| Days Inn | 1 | Quiznos | 4 | |
| Decora Cabinetry | 4 | RadioShack | 2 | |
| Dennys | 1 | Red Robin | 1 | |
| Discount Tire | 1 | Rite Aid | 1 | |
| Domino's Pizza | 1 | SAS Shoes | 1 | |
| El Pollo Loco | 1 | Sam's Club | 1 | |
| Ethan Allen | 1 | Sears | 4 | |
| Express | 1 | Skechers USA | 1 | |
| FedEx | 15 | Spencer Gifts | 1 | |
| Finish Line | 1 | Sprint Nextel | 2 | |
| Firestone Complete Auto Care | 1 | Staples | 1 | |
| Foot Locker | 1 | Starbucks | 11 | |
| Ford | 1 | T-Mobile | 1 | |
| Forever 21 | 1 | T.J.Maxx | 1 | |
| Fredericks Of Hollywood | 1 | Taco Bell | 4 | |
| GNC | 1 | The Room Place | 1 | |
| GameStop | 2 | Torrid | 1 | |
| Gap | 1 | Toyota | 1 | |
| Gymboree | 1 | Trader Joe's | 2 | |
| H&M | 1 | U-Haul | 4 | |
| H&R Block | 2 | UPS | 19 | |
| Haagen-Dazs | 1 | Vans | 7 | |
| Hilton | 2 | Victoria's Secret | 1 | |
| Holiday Inn | 2 | Vons | 3 | |
| Hollister Co. | 1 | Walgreens | 1 | |
| Home Depot | 1 | Wendy's | 1 | |
| HomeTown Buffet | 1 | |||
Strongest AM radio stations in Concord:
- KABN (1480 AM; 5 kW; CONCORD, CA; Owner: CONCORD AREA BROADCASTING CORP.)
- KTRB (860 AM; 50 kW; MODESTO, CA; Owner: PAPPAS RADIO OF CALIFORNIA, A CALIFORNIA LIMITED PARTNERSHIP)
- KIQI (1010 AM; 35 kW; SAN FRANCISCO, CA; Owner: RADIO UNICA OF SAN FRANCISCO LICENSE CORP.)
- KTCT (1050 AM; 50 kW; SAN MATEO, CA; Owner: SUSQUEHANNA RADIO CORP.)
- KFAX (1100 AM; 50 kW; SAN FRANCISCO, CA; Owner: GOLDEN GATE BROADCASTING CO, INC.)
- KNBR (680 AM; 50 kW; SAN FRANCISCO, CA; Owner: KNBR LICO, INC.)
- KCBS (740 AM; 50 kW; SAN FRANCISCO, CA; Owner: INFINITY BROADCASTING OPERATIONS, INC.)
- KNEW (910 AM; 20 kW; OAKLAND, CA; Owner: AMFM RADIO LICENSES, L.L.C.)
- KATD (990 AM; 10 kW; PITTSBURG, CA; Owner: RADIO UNICA OF SACRAMENTO LICENSE CORP.)
- KGO (810 AM; 50 kW; SAN FRANCISCO, CA; Owner: KGO-AM RADIO, INC.)
- KDYA (1190 AM; 10 kW; VALLEJO, CA; Owner: BAYBRIDGE COMMUNICATIONS, L.L.C.)
- KYCY (1550 AM; 50 kW; SAN FRANCISCO, CA; Owner: INFINITY BROADCASTING OPERATIONS, INC.)
- KFRC (610 AM; 5 kW; SAN FRANCISCO, CA; Owner: INFINITY BROADCASTING CORPORATION OF LOS ANGELES)
Strongest FM radio stations in Concord:
- KKSF-FM1 (103.7 FM; PLEASANTON, ETC., CA; Owner: AMFM RADIO LICENSES, L.L.C.)
- KBLX-FM2 (102.9 FM; PLEASANTON, CA; Owner: ICBC BROADCAST HOLDINGS -CA, INC.)
- KSOL-FM3 (98.9 FM; PLEASANTON, CA; Owner: TMS LICENSE CALIFORNIA, INC)
- KFRC-FM3 (99.7 FM; WALNUT CREEK, CA; Owner: INFINITY KFRC-FM, INC.)
- KZBR-FM1 (95.7 FM; WALNUT CREEK, CA; Owner: BONNEVILLE HOLDING COMPANY)
- KISQ-FM3 (98.1 FM; CONCORD, CA; Owner: AMFM RADIO LICENSES, L.L.C.)
- KMEL-FM1 (106.1 FM; CONCORD, CA; Owner: AMFM RADIO LICENSES, L.L.C.)
- KFJO (92.1 FM; WALNUT CREEK, CA; Owner: CHASE RADIO PROPERTIES, L.L.C.)
- KDFC-FM1 (102.1 FM; LAFAYETTE, CA; Owner: BONNEVILLE HOLDING COMPANY)
- KOIT-FM2 (96.5 FM; MARTINEZ, ETC., CA; Owner: BONNEVILLE HOLDING CO. C/O KOIT(FM))
- KIOI-FM1 (101.3 FM; WALNUT CREEK, CA; Owner: AMFM RADIO LICENSES, L.L.C.)
- K209BZ (89.7 FM; CONCORD, CA; Owner: YOUR CHRISTIAN COMPANION NETWORK, INC.)
- KVHS (90.5 FM; CONCORD, CA; Owner: CLAYTON VALLEY HIGH SCHOOL)
- KFJO-FM1 (92.1 FM; WEST PITTSBURG, CA; Owner: CHASE RADIO PROPERTIES, L.L.C.)
- KLLC (97.3 FM; SAN FRANCISCO, CA; Owner: INFINITY BROADCASTING OPERATIONS, INC.)
- KSFB-FM (100.7 FM; SAN RAFAEL, CA; Owner: GOLDEN GATE BROADCASTING COMPANY, INC.)
- KALX (90.7 FM; BERKELEY, CA; Owner: UNIVERSITY OF CALIFORNIA)
- KZBR-FM2 (95.7 FM; LIVERMORE, ETC., CA; Owner: BONNEVILLE HOLDING COMPANY)
- KUIC (95.3 FM; VACAVILLE, CA; Owner: KUIC, INC.)
- KOIT-FM (96.5 FM; SAN FRANCISCO, CA; Owner: BONNEVILLE HOLDING COMPANY)
TV broadcast stations around Concord:
- KTNC-TV (Channel 42; CONCORD, CA; Owner: KTNC LICENSE, LLC)
- KQED (Channel 9; SAN FRANCISCO, CA; Owner: KQED, INC.)
- KOVR (Channel 13; STOCKTON, CA; Owner: SCI - SACRAMENTO LICENSEE, LLC)
- KXTV (Channel 10; SACRAMENTO, CA; Owner: KXTV, INC.)
- KSPX (Channel 29; SACRAMENTO, CA; Owner: PAXSON SACRAMENTO LICENSE, INC.)
- KCRA-TV (Channel 3; SACRAMENTO, CA; Owner: KCRA HEARST-ARGYLE TELEVISION, INC.)
- KTXL (Channel 40; SACRAMENTO, CA; Owner: CHANNEL 40, INC.)
- KUVS (Channel 19; MODESTO, CA; Owner: KUVS LICENSE PARTNERSHIP, G.P.)
- KQCA (Channel 58; STOCKTON, CA; Owner: KCRA HEARST-ARGYLE TELEVISION, INC.)
- KVIE (Channel 6; SACRAMENTO, CA; Owner: KVIE, INC.)
- KMAX-TV (Channel 31; SACRAMENTO, CA; Owner: UPN STATIONS GROUP INC.)
- KGO-TV (Channel 7; SAN FRANCISCO, CA; Owner: KGO TELEVISION, INC.)
- KPIX-TV (Channel 5; SAN FRANCISCO, CA; Owner: CBS BROADCASTING INC.)
- KTVU (Channel 2; OAKLAND, CA; Owner: KTVU PARTNERSHIP)
- KFTL (Channel 64; STOCKTON, CA; Owner: FAMILY STATIONS, INC.)
- KRON-TV (Channel 4; SAN FRANCISCO, CA; Owner: YOUNG BROADCASTING OF SAN FRANCISCO, INC.)
- KMTP-TV (Channel 32; SAN FRANCISCO, CA; Owner: MINORITY TELEVISION PROJECT)
- KBHK-TV (Channel 44; SAN FRANCISCO, CA; Owner: VIACOM TELEVISION STATIONS GROUP OF SAN FRANCISCO INC.)
- KBWB (Channel 20; SAN FRANCISCO, CA; Owner: KBWB LICENSE, INC.)
- KFSF (Channel 66; VALLEJO, CA; Owner: TELEFUTURA SAN FRANCISCO LLC)
- KCNS (Channel 38; SAN FRANCISCO, CA; Owner: WRAY, INC.)
- KCSM-TV (Channel 60; SAN MATEO, CA; Owner: SAN MATEO COUNTY COMMUNITY COLLEGE DISTRICT)
- KBIT-CA (Channel 28; SAN FRANCISCO, ETC., CA; Owner: POLAR BROADCASTING, INC.)
- National Bridge Inventory (NBI) Statistics
- 93Number of bridges
- 1,316ft / 401mTotal length
- $8,978,000Total costs
- 2,989,454Total average daily traffic
- 156,770Total average daily truck traffic
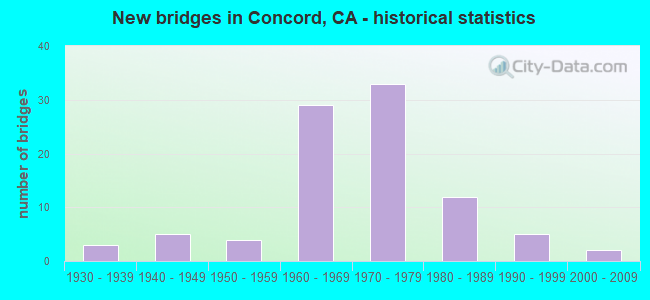
- New bridges - historical statistics
- 31930-1939
- 51940-1949
- 41950-1959
- 291960-1969
- 331970-1979
- 121980-1989
- 51990-1999
- 22000-2009
FCC Registered Antenna Towers: 380 (See the full list of FCC Registered Antenna Towers)
FCC Registered Commercial Land Mobile Towers: 4 (See the full list of FCC Registered Commercial Land Mobile Towers in Concord, CA)
FCC Registered Private Land Mobile Towers: 3 (See the full list of FCC Registered Private Land Mobile Towers)
FCC Registered Broadcast Land Mobile Towers: 60 (See the full list of FCC Registered Broadcast Land Mobile Towers)
FCC Registered Microwave Towers: 57 (See the full list of FCC Registered Microwave Towers in this town)
FCC Registered Paging Towers: 5 (See the full list of FCC Registered Paging Towers)
FCC Registered Maritime Coast & Aviation Ground Towers: 6 (See the full list of FCC Registered Maritime Coast & Aviation Ground Towers)
FCC Registered Amateur Radio Licenses: 828 (See the full list of FCC Registered Amateur Radio Licenses in Concord)
FAA Registered Aircraft Manufacturers and Dealers: 4 (See the full list of FAA Registered Manufacturers and Dealers in Concord)
FAA Registered Aircraft: 91 (See the full list of FAA Registered Aircraft)
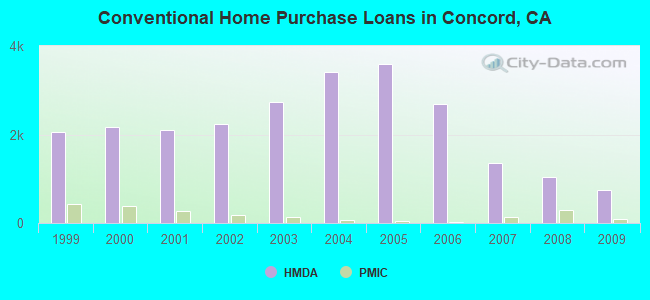
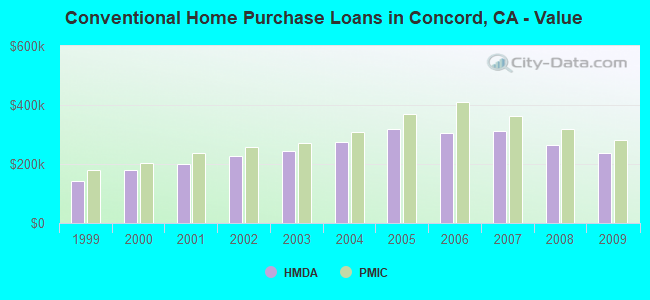
| Home Mortgage Disclosure Act Aggregated Statistics For Year 2009 (Based on 18 full and 6 partial tracts) | ||||||||||||||
| A) FHA, FSA/RHS & VA Home Purchase Loans | B) Conventional Home Purchase Loans | C) Refinancings | D) Home Improvement Loans | E) Loans on Dwellings For 5+ Families | F) Non-occupant Loans on < 5 Family Dwellings (A B C & D) | G) Loans On Manufactured Home Dwelling (A B C & D) | ||||||||
|---|---|---|---|---|---|---|---|---|---|---|---|---|---|---|
| Number | Average Value | Number | Average Value | Number | Average Value | Number | Average Value | Number | Average Value | Number | Average Value | Number | Average Value | |
| LOANS ORIGINATED | 580 | $301,534 | 737 | $238,089 | 2,251 | $274,919 | 98 | $160,976 | 3 | $3,526,667 | 276 | $188,359 | 6 | $83,507 |
| APPLICATIONS APPROVED, NOT ACCEPTED | 61 | $289,486 | 92 | $241,593 | 236 | $283,856 | 12 | $96,568 | 0 | $0 | 43 | $209,868 | 2 | $85,055 |
| APPLICATIONS DENIED | 103 | $299,708 | 183 | $220,010 | 773 | $316,619 | 37 | $137,443 | 2 | $1,465,000 | 123 | $193,455 | 18 | $56,397 |
| APPLICATIONS WITHDRAWN | 72 | $290,245 | 129 | $231,460 | 438 | $301,008 | 24 | $136,771 | 1 | $696,990 | 59 | $186,965 | 1 | $144,000 |
| FILES CLOSED FOR INCOMPLETENESS | 30 | $249,667 | 30 | $286,330 | 121 | $311,710 | 12 | $162,585 | 0 | $0 | 10 | $295,088 | 2 | $67,285 |
Detailed mortgage data for all 24 tracts in Concord, CA
| Private Mortgage Insurance Companies Aggregated Statistics For Year 2009 (Based on 16 full and 6 partial tracts) | ||||||
| A) Conventional Home Purchase Loans | B) Refinancings | C) Non-occupant Loans on < 5 Family Dwellings (A & B) | ||||
|---|---|---|---|---|---|---|
| Number | Average Value | Number | Average Value | Number | Average Value | |
| LOANS ORIGINATED | 94 | $282,359 | 29 | $345,247 | 0 | $0 |
| APPLICATIONS APPROVED, NOT ACCEPTED | 43 | $285,674 | 20 | $365,016 | 0 | $0 |
| APPLICATIONS DENIED | 22 | $268,698 | 14 | $344,057 | 0 | $0 |
| APPLICATIONS WITHDRAWN | 10 | $251,793 | 7 | $325,853 | 0 | $0 |
| FILES CLOSED FOR INCOMPLETENESS | 7 | $290,229 | 1 | $289,000 | 1 | $289,000 |
2005 - 2018 National Fire Incident Reporting System (NFIRS) incidents
- Fire incident types reported to NFIRS in Concord, CA
- 1,02839.6%Outside Fires
- 91635.2%Structure Fires
- 54120.8%Mobile Property/Vehicle Fires
- 1144.4%Other
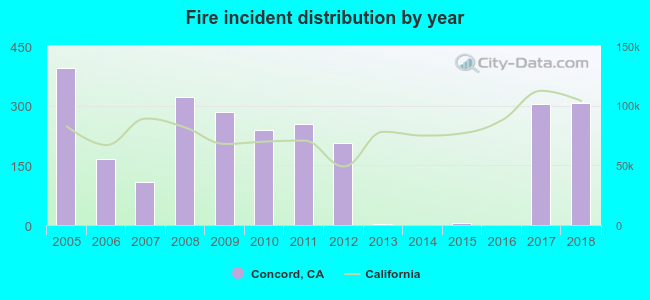 Based on the data from the years 2005 - 2018 the average number of fires per year is 185. The highest number of fires - 394 took place in 2005, and the least - 1 in 2014. The data has a declining trend.
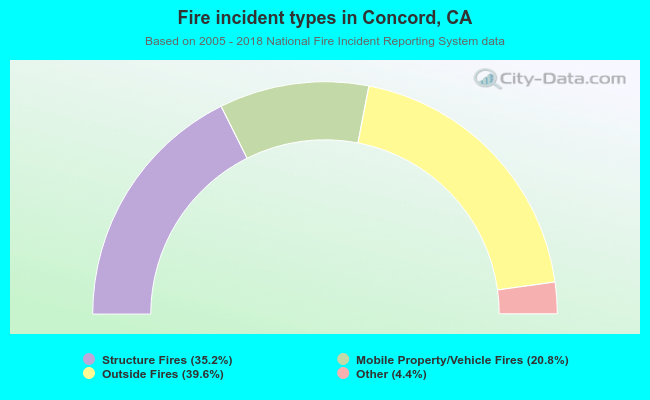 When looking into fire subcategories, the most reports belonged to: Outside Fires (39.6%), and Structure Fires (35.2%).
Fire-safe hotels and motels in Concord, California:
- Hilton Concord, 1970 Diamond Blvd, Concord, California 94520 , Phone: (925) 827-2000, Fax: (925) 827-2113
- Crowne Plaza Concord, 45 John Glenn Dr, Concord, California 94520 , Phone: (925) 825-7700, Fax: (925) 674-9567
- Best Western Heritage Inn, Concord, 4600 Clayton Rd, Concord, California 94521 , Phone: (925) 686-4466, Fax: (925) 825-0581
- Comfort Inn, 5370 Clayton Rd, Concord, California 94521 , Phone: (925) 674-9400, Fax: (925) 674-9595
- Americas Best Value Inn, 3555 Clayton, Concord, California 94519 , Phone: (925) 682-1601, Fax: (925) 827-4756
- Motel 6 Concord, 3606 Clayton Rd, Concord, California 94521 , Phone: (925) 682-7850, Fax: (925) 676-7547
| Most common first names in Concord, CA among deceased individuals | ||
| Name | Count | Lived (average) |
|---|---|---|
| John | 567 | 73.2 years |
| William | 483 | 73.5 years |
| Robert | 475 | 70.3 years |
| Mary | 417 | 79.6 years |
| James | 391 | 69.8 years |
| Charles | 291 | 74.2 years |
| George | 284 | 74.8 years |
| Margaret | 243 | 79.3 years |
| Helen | 225 | 80.3 years |
| Joseph | 216 | 76.1 years |
| Most common last names in Concord, CA among deceased individuals | ||
| Last name | Count | Lived (average) |
|---|---|---|
| Smith | 181 | 74.5 years |
| Johnson | 146 | 75.9 years |
| Williams | 105 | 74.8 years |
| Anderson | 104 | 78.4 years |
| Jones | 104 | 74.3 years |
| Brown | 97 | 74.8 years |
| Miller | 90 | 72.8 years |
| Davis | 88 | 73.3 years |
| Wilson | 63 | 72.2 years |
| Thompson | 58 | 76.5 years |
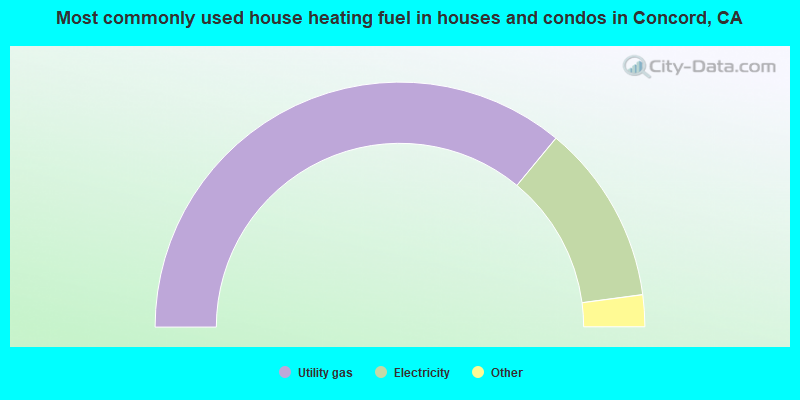
- 72.0%Utility gas
- 23.8%Electricity
- 1.8%Solar energy
- 1.2%Bottled, tank, or LP gas
- 0.6%No fuel used
- 0.5%Wood
- 0.1%Fuel oil, kerosene, etc.
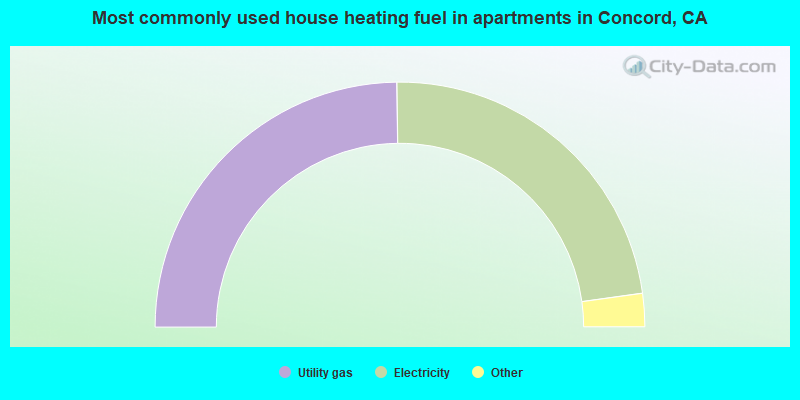
- 49.6%Utility gas
- 46.0%Electricity
- 2.3%Bottled, tank, or LP gas
- 1.7%No fuel used
- 0.2%Other fuel
- 0.2%Wood
Concord compared to California state average:
- Unemployed percentage significantly below state average.
- Black race population percentage below state average.
- Median age above state average.
- Percentage of population with a bachelor's degree or higher above state average.
Concord, CA compared to other similar cities:
Concord on our top lists:
- #17 on the list of "Top 101 cities with largest percentage of males in occupations: building and grounds cleaning and maintenance occupations (population 50,000+)"
- #25 on the list of "Top 101 cities with the smallest percentages of current college students (population 100,000+)"
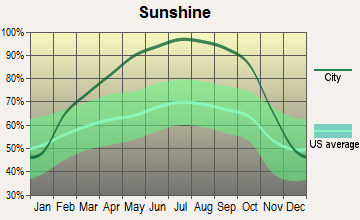
- #30 on the list of "Top 101 cities with the highest maximum monthly sunshine amount (population 50,000+)"
- #37 on the list of "Top 101 cities with fewest building permits per 10,000 residents (population 50,000+)"
- #44 on the list of "Top 101 cities with largest percentage of females in occupations: installation, maintenance, and repair occupations (population 50,000+)"
- #44 on the list of "Top 101 cities with the most residents born in Afghanistan (population 500+)"
- #45 on the list of "Top 101 cities with the largest sunshine amount differences during a year (population 50,000+)"
- #49 on the list of "Top 101 cities with the lowest number of murders per 100,000 residents (population 50,000+)"
- #49 on the list of "Top 101 cities with the largest differences between morning and afternoon humidity (population 50,000+)"
- #49 on the list of "Top 101 cities with the largest humidity differences during a year (population 50,000+)"
- #52 on the list of "Top 101 cities with the largest percentage of likely lesbian couples (counted as self-reported female-female unmarried-partner households) (population 50,000+)"
- #61 on the list of "Top 101 cities with largest percentage of males in industries: administrative and support and waste management services (population 50,000+)"
- #65 on the list of "Top 101 cities with the largest percentage of likely homosexual households (counted as self-reported same-sex unmarried-partner households) (population 50,000+)"
- #71 on the list of "Top 101 cities with largest percentage of females in industries: construction (population 50,000+)"
- #72 on the list of "Top 101 cities with largest percentage of females in occupations: transportation occupations (population 50,000+)"
- #77 on the list of "Top 101 cities with largest percentage of females in occupations: building and grounds cleaning and maintenance occupations (population 50,000+)"
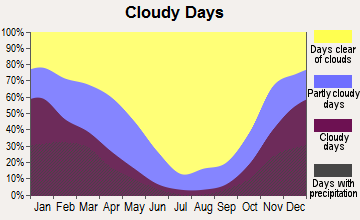
- #77 on the list of "Top 101 cities with the highest number of days clear of clouds (population 50,000+)"
- #77 on the list of "Top 101 cities with the lowest number of days clear of clouds (population 50,000+)"
- #79 on the list of "Top 101 cities with largest percentage of females in industries: management of companies and enterprises (population 50,000+)"
- #85 on the list of "Top 101 cities with the largest percentage of likely gay men couples (counted as self-reported male-male unmarried-partner households) (population 50,000+)"
- #10 on the list of "Top 101 counties with the largest increase in the number of infant deaths per 1000 residents 2000-2006 to 2007-2013 (pop. 50,000+)"
- #15 on the list of "Top 101 counties with the lowest Sulfur Oxides Annual air pollution readings in 2012 (µg/m3)"
- #17 on the list of "Top 101 counties with the highest Nitrogen Dioxide air pollution readings in 2012 (ppm)"
- #31 on the list of "Top 101 counties with the highest percentage of residents that drank alcohol in the past 30 days"
- #34 on the list of "Top 101 counties with the highest surface withdrawal of fresh water for public supply (pop. 50,000+)"

|
|
Total of 1003 patent applications in 2008-2024.