Estimated zip code population in 2022: 28,052 Zip code population in 2010: 26,778 Zip code population in 2000: 27,392
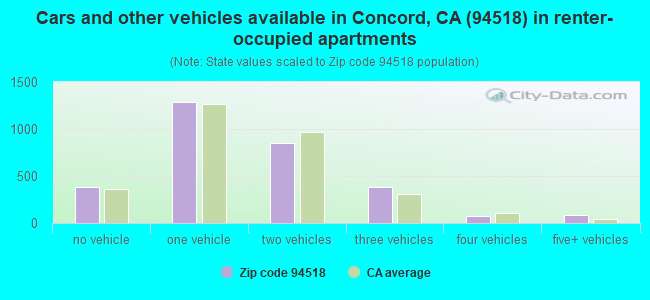
Houses and condos: 10,496 Renter-occupied apartments: 3,056
% of renters here:
29%
State:
44%
March 2022 cost of living index in zip code 94518: 118.4 (more than average, U.S. average is 100)
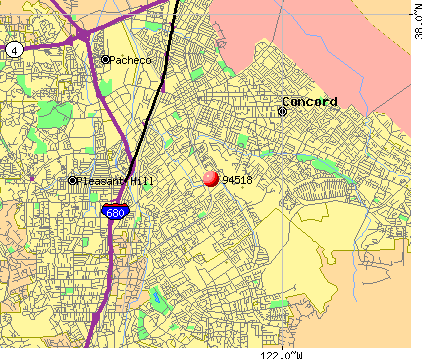
Land area: 5.4 sq. mi. Water area: 0.0 sq. mi.
Population density: 5,158 people per square mile
(average).
OSM Map
General Map
Google Map
MSN Map
OSM Map
General Map
Google Map
MSN Map
OSM Map
General Map
Google Map
MSN Map
OSM Map
General Map
Google Map
MSN Map
Please wait while loading the map...
Real estate property taxes paid for housing units in 2022:
This zip code:
0.6% ($5,484)
California:
0.7% ($4,831)
Median real estate property taxes paid for housing units with mortgages in 2022: $6,446 (0.7%) Median real estate property taxes paid for housing units with no mortgage in 2022: $3,309 (0.5%)
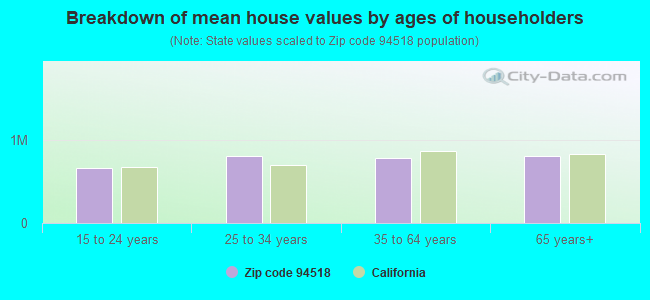
Estimated median house/condo value in 2022: $850,219
94518:
$850,219
California:
$715,900
According to our research of California and other state lists, there were 21 registered sex offenders living in 94518 zip code as of April 27, 2024. The ratio of all residents to sex offenders in zip code 94518 is 1,331 to 1. The ratio of registered sex offenders to all residents in this zip code is lower than the state average.
Median resident age:
This zip code:
40.8 years
California median age:
37.9 years
Average household size:
This zip code:
2.7 people
California:
2.8 people
Averages for the 2020 tax year for zip code 94518, filed in 2021:
Average Adjusted Gross Income (AGI) in 2020: $91,926 (Individual Income Tax Returns)
Here:
$91,926
State:
$95,910
Salary/wage: $86,347 (reported on 78.0% of returns)
Here:
$86,347
State:
$77,331
(% of AGI for various income ranges: 1179.0% for AGIs below $25k, 3941.0% for AGIs $25k-50k, 7221.8% for AGIs $50k-75k, 10144.4% for AGIs $75k-100k, 20169.5% for AGIs $100k-200k, 75077.3% for AGIs over 200k)
Taxable interest for individuals: $1,223 (reported on 43.2% of returns)
This zip code:
$1,223
California:
$2,294
(% of AGI for various income ranges: 28.3% for AGIs below $25k, 38.5% for AGIs $25k-50k, 53.2% for AGIs $50k-75k, 81.8% for AGIs $75k-100k, 135.4% for AGIs $100k-200k, 557.1% for AGIs over 200k)
Ordinary dividends: $4,963 (reported on 26.2% of returns)
Here:
$4,963
State:
$10,949
(% of AGI for various income ranges: 54.5% for AGIs below $25k, 62.9% for AGIs $25k-50k, 139.7% for AGIs $50k-75k, 209.6% for AGIs $75k-100k, 413.1% for AGIs $100k-200k, 1275.3% for AGIs over 200k)
Net capital gain/loss in AGI: +$15,151 (reported on 24.3% of returns)
Here:
+$15,151
State:
+$49,306
(% of AGI for various income ranges: 23.5% for AGIs below $25k, 48.1% for AGIs $25k-50k, 141.5% for AGIs $50k-75k, 264.3% for AGIs $75k-100k, 537.9% for AGIs $100k-200k, 7648.2% for AGIs over 200k)
Profit/loss from business: +$16,292 (reported on 18.6% of returns)
Here:
+$16,292
State:
+$15,671
(% of AGI for various income ranges: 240.1% for AGIs below $25k, 300.9% for AGIs $25k-50k, 359.2% for AGIs $50k-75k, 410.4% for AGIs $75k-100k, 633.9% for AGIs $100k-200k, 2988.8% for AGIs over 200k)
Taxable individual retirement arrangement distribution: $24,656 (reported on 10.1% of returns)
94518:
$24,656
California:
$23,505
(% of AGI for various income ranges: 64.0% for AGIs below $25k, 175.8% for AGIs $25k-50k, 264.5% for AGIs $50k-75k, 510.6% for AGIs $75k-100k, 922.6% for AGIs $100k-200k, 1820.4% for AGIs over 200k)
Self-employed (Keogh) retirement plans: $24,150 (reported on 0.9% of returns)
94518:
$24,150
California:
$30,163
(% of AGI for various income ranges: 26.6% for AGIs $50k-75k, 43.1% for AGIs $100k-200k, 398.8% for AGIs over 200k)
Total itemized deductions: $30,723 (reported on 20.6% of returns)
Here:
$30,723
State:
$39,517
(% of AGI for various income ranges: 162.2% for AGIs below $25k, 275.6% for AGIs $25k-50k, 616.8% for AGIs $50k-75k, 1061.5% for AGIs $75k-100k, 2312.8% for AGIs $100k-200k, 5968.8% for AGIs over 200k)
Charity contributions: $4,872 (reported on 16.4% of returns)
Here:
$4,872
State:
$12,598
(% of AGI for various income ranges: 5.9% for AGIs below $25k, 22.3% for AGIs $25k-50k, 60.2% for AGIs $50k-75k, 116.1% for AGIs $75k-100k, 281.3% for AGIs $100k-200k, 959.0% for AGIs over 200k)
Taxes paid: $8,972 (reported on 20.6% of returns)
94518:
$8,972
State:
$8,807
(% of AGI for various income ranges: 30.5% for AGIs below $25k, 65.4% for AGIs $25k-50k, 161.2% for AGIs $50k-75k, 344.9% for AGIs $75k-100k, 744.9% for AGIs $100k-200k, 1647.3% for AGIs over 200k)
Earned income credit: $1,789 (reported on 8.5% of returns)
Here:
$1,789
State:
$2,074
(% of AGI for various income ranges: 66.2% for AGIs below $25k, 44.0% for AGIs $25k-50k)
Percentage of individuals using paid preparers for their 2020 taxes: 91.2%
Here:
91%
State:
92%
(% for various income ranges: 88.0% for AGIs below $25k, 90.2% for AGIs $25k-50k, 92.1% for AGIs $50k-75k, 92.7% for AGIs $75k-100k, 93.2% for AGIs $100k-200k, 94.6% for AGIs over 200k)
Averages for the 2012 tax year for zip code 94518, filed in 2013:
Average Adjusted Gross Income (AGI) in 2012: $68,877 (Individual Income Tax Returns)
Here:
$68,877
State:
$72,726
Salary/wage: $62,594 (reported on 80.8% of returns)
Here:
$62,594
State:
$59,079
(% of AGI for various income ranges: 70.2% for AGIs below $25k, 76.3% for AGIs $25k-50k, 75.8% for AGIs $50k-75k, 70.9% for AGIs $75k-100k, 77.3% for AGIs $100k-200k, 66.6% for AGIs over 200k)
Taxable interest for individuals: $1,030 (reported on 43.2% of returns)
This zip code:
$1,030
California:
$2,146
(% of AGI for various income ranges: 1.4% for AGIs below $25k, 0.6% for AGIs $25k-50k, 0.6% for AGIs $50k-75k, 0.6% for AGIs $75k-100k, 0.5% for AGIs $100k-200k, 0.7% for AGIs over 200k)
Ordinary dividends: $4,177 (reported on 24.4% of returns)
Here:
$4,177
State:
$9,308
(% of AGI for various income ranges: 2.2% for AGIs below $25k, 1.2% for AGIs $25k-50k, 1.4% for AGIs $50k-75k, 1.6% for AGIs $75k-100k, 1.1% for AGIs $100k-200k, 2.0% for AGIs over 200k)
Net capital gain/loss in AGI: +$7,481 (reported on 20.4% of returns)
Here:
+$7,481
State:
+$30,460
(% of AGI for various income ranges: 0.2% for AGIs $25k-50k, 0.4% for AGIs $50k-75k, 0.7% for AGIs $75k-100k, 1.0% for AGIs $100k-200k, 7.9% for AGIs over 200k)
Profit/loss from business: +$16,595 (reported on 17.0% of returns)
Here:
+$16,595
State:
+$17,064
(% of AGI for various income ranges: 11.9% for AGIs below $25k, 5.9% for AGIs $25k-50k, 3.7% for AGIs $50k-75k, 3.8% for AGIs $75k-100k, 3.6% for AGIs $100k-200k, 2.4% for AGIs over 200k)
Taxable individual retirement arrangement distribution: $20,256 (reported on 12.3% of returns)
94518:
$20,256
California:
$19,557
(% of AGI for various income ranges: 3.6% for AGIs below $25k, 3.3% for AGIs $25k-50k, 2.9% for AGIs $50k-75k, 5.0% for AGIs $75k-100k, 3.3% for AGIs $100k-200k, 3.8% for AGIs over 200k)
Self-employment retirement plans: $15,921 (reported on 1.1% of returns)
94518:
$15,921
California:
$24,530
(% of AGI for various income ranges: 0.3% for AGIs $25k-50k, 0.1% for AGIs $75k-100k, 0.3% for AGIs $100k-200k, 0.5% for AGIs over 200k)
Total itemized deductions: $27,274 (24% of AGI, reported on 42.3% of returns)
Here:
$27,274
State:
$34,004
Here:
23.5% of AGI
State:
22.7% of AGI
(% of AGI for various income ranges: 14.5% for AGIs below $25k, 13.2% for AGIs $25k-50k, 14.6% for AGIs $50k-75k, 17.5% for AGIs $75k-100k, 18.5% for AGIs $100k-200k, 17.1% for AGIs over 200k)
Charity contributions: $2,975 (reported on 34.5% of returns)
Here:
$2,975
State:
$4,659
(% of AGI for various income ranges: 0.8% for AGIs below $25k, 1.0% for AGIs $25k-50k, 1.1% for AGIs $50k-75k, 1.7% for AGIs $75k-100k, 1.6% for AGIs $100k-200k, 1.8% for AGIs over 200k)
Taxes paid: $10,516 (reported on 42.1% of returns)
94518:
$10,516
State:
$14,448
(% of AGI for various income ranges: 2.6% for AGIs below $25k, 2.7% for AGIs $25k-50k, 4.1% for AGIs $50k-75k, 5.9% for AGIs $75k-100k, 7.6% for AGIs $100k-200k, 9.2% for AGIs over 200k)
Earned income credit: $1,811 (reported on 10.4% of returns)
Here:
$1,811
State:
$2,286
(% of AGI for various income ranges: 3.7% for AGIs below $25k, 0.6% for AGIs $25k-50k)
Percentage of individuals using paid preparers for their 2012 taxes: 52.1%
Here:
52%
State:
64%
(% for various income ranges: 50.0% for AGIs below $25k, 50.7% for AGIs $25k-50k, 52.7% for AGIs $50k-75k, 53.4% for AGIs $75k-100k, 55.4% for AGIs $100k-200k, 55.9% for AGIs over 200k)
Averages for the 2004 tax year for zip code 94518, filed in 2005:
Average Adjusted Gross Income (AGI) in 2004: $59,626 (Individual Income Tax Returns)
Here:
$59,626
State:
$58,600
Salary/wage: $54,431 (reported on 82.1% of returns)
Here:
$54,431
State:
$49,455
(% of AGI for various income ranges: 123.3% for AGIs below $10k, 69.4% for AGIs $10k-25k, 78.4% for AGIs $25k-50k, 77.3% for AGIs $50k-75k, 78.1% for AGIs $75k-100k, 71.8% for AGIs over 100k)
Taxable interest for individuals: $1,543 (reported on 55.0% of returns)
This zip code:
$1,543
California:
$2,365
(% of AGI for various income ranges: 6.4% for AGIs below $10k, 2.6% for AGIs $10k-25k, 1.6% for AGIs $25k-50k, 1.3% for AGIs $50k-75k, 1.2% for AGIs $75k-100k, 1.3% for AGIs over 100k)
Taxable dividends: $3,151 (reported on 31.3% of returns)
Here:
$3,151
State:
$4,746
(% of AGI for various income ranges: 9.2% for AGIs below $10k, 2.2% for AGIs $10k-25k, 1.3% for AGIs $25k-50k, 1.3% for AGIs $50k-75k, 1.2% for AGIs $75k-100k, 1.9% for AGIs over 100k)
Net capital gain/loss: +$7,482 (reported on 25.3% of returns)
Here:
+$7,482
State:
+$23,418
(% of AGI for various income ranges: -1.9% for AGIs below $10k, 0.5% for AGIs $10k-25k, 0.5% for AGIs $25k-50k, 0.5% for AGIs $50k-75k, 1.4% for AGIs $75k-100k, 5.9% for AGIs over 100k)
Profit/loss from business: +$17,321 (reported on 16.0% of returns)
Here:
+$17,321
State:
+$16,826
(% of AGI for various income ranges: 12.7% for AGIs below $10k, 9.6% for AGIs $10k-25k, 5.9% for AGIs $25k-50k, 4.8% for AGIs $50k-75k, 4.6% for AGIs $75k-100k, 3.5% for AGIs over 100k)
IRA payment deduction: $3,144 (reported on 3.7% of returns)
94518:
$3,144
California:
$3,192
(% of AGI for various income ranges: 0.6% for AGIs below $10k, 0.4% for AGIs $10k-25k, 0.3% for AGIs $25k-50k, 0.2% for AGIs $50k-75k, 0.2% for AGIs $75k-100k, 0.1% for AGIs over 100k)
Self-employed pension: $12,310 (reported on 1.7% of returns)
Here:
$12,310
California:
$17,688
(% of AGI for various income ranges: 0.2% for AGIs $10k-25k, 0.2% for AGIs $25k-50k, 0.3% for AGIs $50k-75k, 0.3% for AGIs $75k-100k, 0.4% for AGIs over 100k)
Total itemized deductions: $24,826 (26% of AGI, reported on 46.7% of returns)
Here:
$24,826
State:
$28,113
Here:
26.2% of AGI
State:
25.3% of AGI
(% of AGI for various income ranges: 32.6% for AGIs below $10k, 14.5% for AGIs $10k-25k, 16.6% for AGIs $25k-50k, 19.9% for AGIs $50k-75k, 22.2% for AGIs $75k-100k, 19.6% for AGIs over 100k)
Charity contributions deductions: $3,101 (3% of AGI, reported on 41.2% of returns)
Here:
$3,101
State:
$3,923
Here:
3.1% of AGI
State:
3.3% of AGI
(% of AGI for various income ranges: 1.2% for AGIs below $10k, 1.1% for AGIs $10k-25k, 1.4% for AGIs $25k-50k, 1.8% for AGIs $50k-75k, 2.1% for AGIs $75k-100k, 2.7% for AGIs over 100k)
Total tax: $9,095 (reported on 82.5% of returns)
94518:
$9,095
State:
$10,761
(% of AGI for various income ranges: 4.7% for AGIs below $10k, 5.0% for AGIs $10k-25k, 8.0% for AGIs $25k-50k, 9.8% for AGIs $50k-75k, 10.5% for AGIs $75k-100k, 16.7% for AGIs over 100k)
Earned income credit: $1,451 (reported on 7.9% of returns)
Here:
$1,451
State:
$1,763
Percentage of individuals using paid preparers for their 2004 taxes: 55.2%
Here:
55%
State:
66%
(% for various income ranges: 47.4% for AGIs below $10k, 56.8% for AGIs $10k-25k, 55.5% for AGIs $25k-50k, 56.5% for AGIs $50k-75k, 58.5% for AGIs $75k-100k, 57.0% for AGIs over 100k)
Likely homosexual households (counted as self-reported same-sex unmarried-partner households)
Lesbian couples: 0.0% of all households
Gay men: 0.1% of all households
Household received Food Stamps/SNAP in the past 12 months: 1,001 Household did not receive Food Stamps/SNAP in the past 12 months: 9,338
Women who had a birth in the past 12 months: 538 (326 now married, 213 unmarried) Women who did not have a birth in the past 12 months: 5,917 (2,264 now married, 3,656 unmarried)
Housing units in zip code 94518 with a mortgage: 4,930 (535 second mortgage, 24 home equity loan, 421 both second mortgage and home equity loan) Houses without a mortgage: 88
Median monthly owner costs for units with a mortgage: $3,152 Median monthly owner costs for units without a mortgage: $816
Residents with income below the poverty level in 2022:
This zip code:
9.9%
Whole state:
12.2%
Residents with income below 50% of the poverty level in 2022:
This zip code:
5.3%
Whole state:
6.2%
Median number of rooms in houses and condos:
Here:
6.2
State:
6.0
Median number of rooms in apartments:
Here:
4.1
State:
3.9
Notable locations in this zip code not listed on our city pages
Notable locations in zip code 94518: Concord Yard (A), Bay Medic Transportation (B), Contra Costa County Fire Protection District Station 10 (C). Display/hide their locations on the map
Parks in zip code 94518 include: Concord Community Park (1), Fairoaks Park (2), Ygnacio Valley Park (3), Lime Ridge Open Space (4). Display/hide their locations on the map
3,486 married couples with children.
1,375 single-parent households (365 men, 1,010 women).
63.4% of residents of 94518 zip code speak English at home.
20.5% of residents speak Spanish at home (53% very well, 23% well, 14% not well, 10% not at all).
8.3% of residents speak other Indo-European language at home (56% very well, 26% well, 14% not well, 5% not at all).
7.3% of residents speak Asian or Pacific Island language at home (54% very well, 28% well, 16% not well, 2% not at all).
1.0% of residents speak other language at home (64% very well, 36% well).
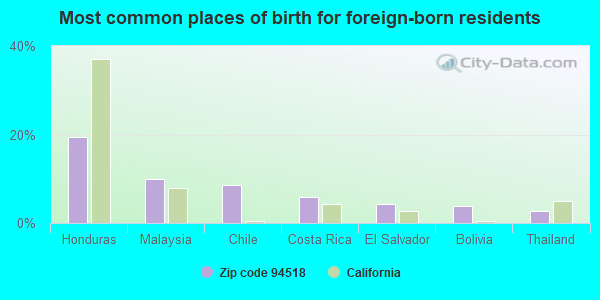
Foreign born population: 7,110 (25.3%) (55.5% of them are naturalized citizens)
Major facilities with environmental interests located in this zip code:
CERTIFIED COATINGS OF CALIF (1045 DETROIT AVE in CONCORD, CA)
STATE MASTER (California - Hazardous Waste Tracking) - HAZARDOU WASTE PROGRAM Small Quantity Generators, between 100 kg and 1000 kg of hazardous waste/month (Resource Conservation and Recovery Act (tracking hazardous waste)) - notification Organizations: VITO PAVIA (CONTACT/OWNER)
CHEVRON STATION NO 94306 (795 OAK GROVE RD in CONCORD, CA)
STATE MASTER (California - Hazardous Waste Tracking) - HAZARDOU WASTE PROGRAM Small Quantity Generators, between 100 kg and 1000 kg of hazardous waste/month (Resource Conservation and Recovery Act (tracking hazardous waste)) - notification Organizations: CHEVRON PRODUCTS CO (CONTACT/OWNER)
EL MONTE ELEMENTARY (1400 DINA DR. in CONCORD, CA)
(National Center for Education Statistics) - STATE ID-6004048 Organizations: MT. DIABLO UNIFIED (SCHOOL DISTRICT)
MARVAC SCIENTIFIC MFG COMPANY (3231 MONUMENT WAY in CONCORD, CA)
STATE MASTER (California - Hazardous Waste Tracking) - HAZARDOU WASTE PROGRAM CRITERIA AND HAZARDOUS AIR POLLUTANT INVENTORY (Inventory of air pollution sources) Business SIC classification: AIR AND GAS COMPRESSORS
MICROPUMP CORP (1035 SHARY CT in CONCORD, CA)
(Resource Conservation and Recovery Act (tracking hazardous waste)) Business NAICS classification: PUMP AND PUMPING EQUIPMENT MANUFACTURING.
MARVAC SCIENTIFIC MANUFACTURING COMPANY (2931 CLOVERDALE AVE in CONCORD, CA)
Small Quantity Generators, between 100 kg and 1000 kg of hazardous waste/month (Resource Conservation and Recovery Act (tracking hazardous waste)) - notification Business NAICS classification: LABORATORY APPARATUS AND FURNITURE MANUFACTURING. Organizations: MARVAC SCIENTIFIC MFG CO (CONTACT/OWNER)
CEILING SALVAGE (958 DUAR DR in CONCORD, CA)
Small Quantity Generators, between 100 kg and 1000 kg of hazardous waste/month (Resource Conservation and Recovery Act (tracking hazardous waste)) Organizations: PAT MIDDLETON (CONTACT/OWNER)
ALL PRO TRANSMISSION (1090 DETROIT AVE UNIT C in CONCORD, CA)
Small Quantity Generators, between 100 kg and 1000 kg of hazardous waste/month (Resource Conservation and Recovery Act (tracking hazardous waste)) - notification Organizations: LEONARD BROADWAY (CONTACT/OWNER)
GB RUBBER STAMP INC (1002 SHARY CT in CONCORD, CA)
Small Quantity Generators, between 100 kg and 1000 kg of hazardous waste/month (Resource Conservation and Recovery Act (tracking hazardous waste)) Business NAICS classification: PREPRESS SERVICES.
B P S CONCORD (1057 SHARY CIR in CONCORD, CA)
Small Quantity Generators, between 100 kg and 1000 kg of hazardous waste/month (Resource Conservation and Recovery Act (tracking hazardous waste)) - notification Organizations: BLUE PRINT SVC INC (CONTACT/OWNER)
MODERN TRANSPORTATION SUPPLY (930 PETNOIX AVE in CONCORD, CA)
Small Quantity Generators, between 100 kg and 1000 kg of hazardous waste/month (Resource Conservation and Recovery Act (tracking hazardous waste))
ACTION PRINTERS (1038 SHARY CIRCLE in CONCORD, CA)
CRITERIA AND HAZARDOUS AIR POLLUTANT INVENTORY (Inventory of air pollution sources) Business SIC classification: COMMERCIAL PRINTING, LITHOGRAPHIC
GB PRODUCTS INTERNATIONAL CORPORATION (1024 SHARY COURT in CONCORD, CA)
CRITERIA AND HAZARDOUS AIR POLLUTANT INVENTORY (Inventory of air pollution sources) Business SIC classification: PLATEMAKING AND RELATED SERVICES
Housing units lacking complete plumbing facilities: 1.1% Housing units lacking complete kitchen facilities: 1.7%
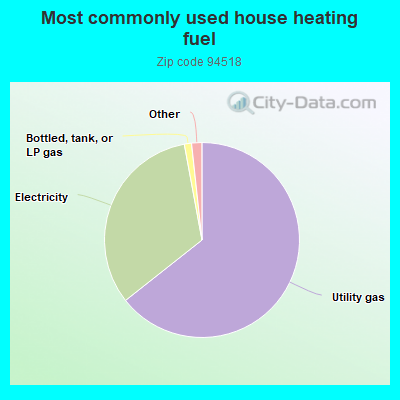
64.3%Utility gas
32.7%Electricity
1.2%Bottled, tank, or LP gas
0.7%Solar energy
0.6%No fuel used
Population in 1990: 25,516. Population change in the 1990s: +1,876 (+7.4%).
Place of birth for U.S.-born residents:
This state: 16,107
Northeast: 1,172
Midwest: 1,173
South: 1,186
West: 950
57% of the 94518 zip code residents lived in the same house 5 years ago. Out of people who lived in different houses, 66% lived in this county. Out of people who lived in different counties, 50% lived in California.
91% of the 94518 zip code residents lived in the same house 1 year ago. Out of people who lived in different houses, 57% moved from this county. Out of people who lived in different houses, 30% moved from different county within same state. Out of people who lived in different houses, 2% moved from different state. Out of people who lived in different houses, 12% moved from abroad.
Private vs. public school enrollment:
Students in private schools in grades 1 to 8 (elementary and middle school): 646
Here:
28.6%
California:
10.5%
Students in private schools in grades 9 to 12 (high school): 224
Here:
19.2%
California:
8.5%
Students in private undergraduate colleges: 340
Here:
25.5%
California:
15.9%
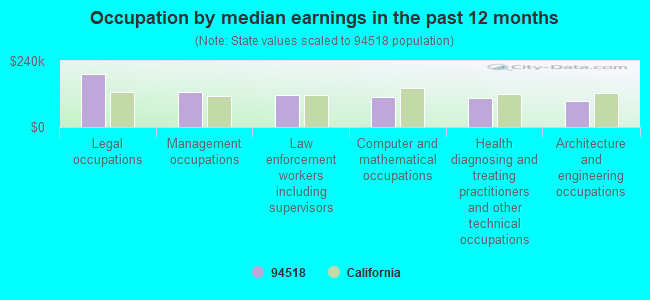
Occupation by median earnings in the past 12 months ($)
192,293Legal occupations
126,385Management occupations
116,636Law enforcement workers including supervisors
108,757Computer and mathematical occupations
105,760Health diagnosing and treating practitioners and other technical occupations
93,871Architecture and engineering occupations
Companies with federal contracts located in this zip code (CONCORD, CA):
BEI SYSTRON DONNER INERTIAL DI (2700 SYSTRON DRIVE) : $3,739,493 in 51 contractsfrom 2002 to 2006
Contracts for Automatic Pilot Mechanisms and Airborne Gyro Components, Defense Electronics and Communication Equipment -- Basic Research (R&D), Services -- Basic Research (R&D), Cable, Cord, and Wire Assemblies: Communications Equipment, and moreby Navy, Army, Defense Intelligence Agency, Office of Policy, Management and Budget/Chief Financial Officer, and others Signed by year:2000: $0; 2001: $0; 2002: $274,527; 2003: $1,497,508; 2004: $283,241; 2005: $861,250; 2006: $822,967.
Biggest contracts:
$1,355,610 with Navy for Automatic Pilot Mechanisms and Airborne Gyro Components. Signed on 2003-06-09. Completion date: 2004-08-31.
$499,580 with Army for Defense Electronics and Communication Equipment -- Basic Research (R&D). Signed on 2005-02-25. Completion date: 2005-01-30.
$499,302, same as above.Signed on 2006-02-24. Completion date: 2007-02-28.
$127,415 with Defense Intelligence Agency for Services -- Basic Research (R&D). Taking place in AL. Signed on 2006-03-03. Completion date: 2006-03-03.
BEI SENSORS & SYSTEMS COMPANY, (2700 SYSTRON DR; small business) : $2,691,617 in 26 contractsfrom 2000 to 2006
Contracts for Guided Missile Components, Navigational Instruments, Specialized Semiconductor, Microcircuit, and Printed Circuit Board Manufacturing Machinery, Electronic Modules, and moreby Navy, Minerals Management Service, Defense Logistics Agency, NASA, and others Signed by year:2000: $332,292; 2001: $352,731; 2002: $573,685; 2003: $321,943; 2004: $701,519; 2005: -$9,000; 2006: $418,447.
Biggest contracts:
$387,930 with Navy for Guided Missile Components. Signed on 2004-05-14. Completion date: 2006-07-10.
$368,480, same as above.Signed on 2006-01-12. Completion date: 2007-01-31.
$313,600 with Navy for Guided Missile Components. Taking place in AR. Signed on 2004-12-10. Completion date: 2005-11-09.
$312,450 with Navy for Guided Missile Components. Signed on 2002-06-26. Completion date: 2003-04-25.
CERTIFIED COATINGS OF CALIFORN (1045 DETROIT AVENUE; small business) 1000 employees, $0 revenue. : $158,125 in 2 contractsin 2003
$123,000 with Navy for Non-nuclear Ship Repair (West) Ship repair (including overhauls and conversions) performed on. non-nuclear propelled and nonpropelled ships west of the 108th meridian. Signed on 2003-08-19. Completion date: 2003-09-16.
$35,125, same as above.Signed on 2003-10-09. Completion date: 2003-12-15.
DINUCCI CORPORATION (1001 SHARY CIRCLE SUITE 9; small business) : $111,540 in 3 contractsfrom 2000 to 2001
$48,000 with Army for Maintenance, Repair and Rebuilding of Equipment -- Instruments and Laboratory Equipment. Signed on 2001-01-12. Completion date: 2001-12-01.
$32,340 with Defense Logistics Agency for Generators and Generators Sets, Electrical. Signed on 2000-06-23. Completion date: 2000-09-29.
$31,200 with Air Force for Aircraft Hydraulic, Vacuum, and De-icing System Components. Signed on 2001-07-31. Completion date: 2002-03-29.
AMERICAN STAGE TOURS, LLC (1488 SOCCER CT; small business) : $15,355 in 3 contractsin 2005
$6,480 with Air Force for Passenger Motor Charter Service. Signed on 2005-02-01. Completion date: 2005-02-17.
$5,635 with Air Force for Lease or Rental of Equipment -- Ground Effect Vehicles, Motor Vehicles, Trailers, and Cycles. Signed on 2005-10-18. Completion date: 2005-10-29.
$3,240, same as above.Signed on 2005-05-17. Completion date: 2005-05-20.
SOBOTKA, WILLIAM D (2355 WHITMAN RD; small business)
$14,375 with Army for Air Conditioning Equipment. Signed on 2002-08-02. Completion date: 2002-10-01.
CLOSET INNOVATION INC, THE (2956 TREAT BLVD STE D; small business)
$7,540 with Navy for Plywood and Veneer. Signed on 2006-03-14. Completion date: 2006-03-28.
NORCAL MOLECULAR LIMITED LIABILITY COMPANY (3241 MONUMENT WAY, UNIT G; small business) 32 employees, $600000 revenue: $4,881 in 4 contractsfrom 2002 to 2005
$1,629 with Federal Supply Service for Preservative and Sealing Compounds. Signed on 2002-12-15. Completion date: 2003-01-15.
$1,626, same as above.Signed on 2004-12-21. Completion date: 2004-12-29.
$1,084, same as above.Signed on 2004-09-07. Completion date: 2004-09-11.
$542, same as above.Signed on 2005-04-08. Completion date: 2005-04-13.
Top industries in this zip code by the number of employees in 2005:
Information: Cable and Other Program Distribution (500-999 employees: 2 establishments, 1-4 employees: 1 establishment)
Health Care and Social Assistance: Ambulance Services (250-499: 1)

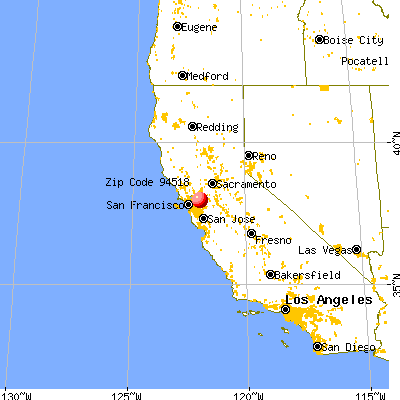


 Nearest zip codes: 94519, 94520, 94523, 94598, 94597, 94596.