Estimated zip code population in 2022: 34,673 Zip code population in 2010: 33,569 Zip code population in 2000: 32,671
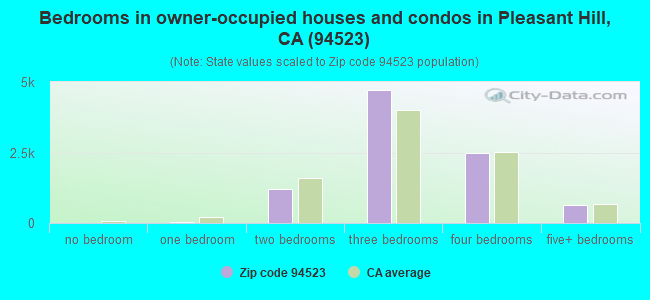
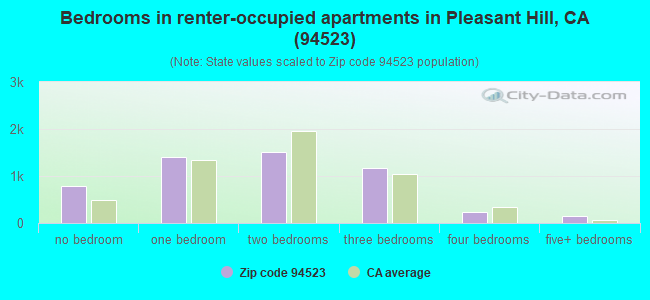
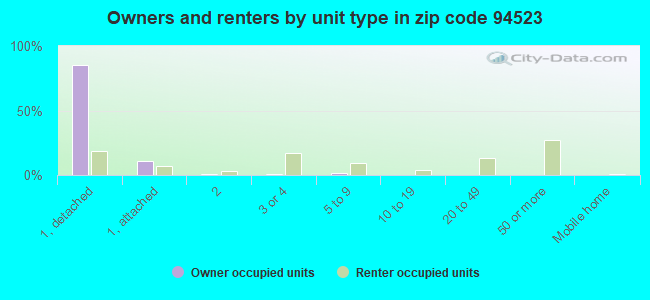
Houses and condos: 14,894 Renter-occupied apartments: 5,214
% of renters here:
36%
State:
44%
March 2022 cost of living index in zip code 94523: 118.7 (more than average, U.S. average is 100)
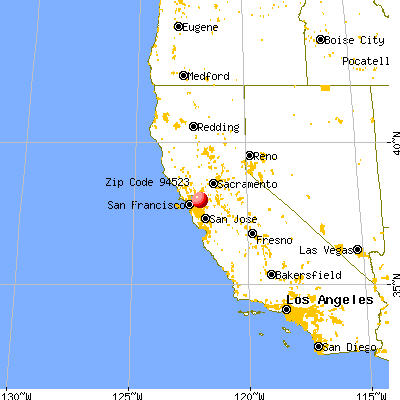
Land area: 7.2 sq. mi. Water area: 0.0 sq. mi.
Population density: 4,790 people per square mile
(average).
OSM Map
General Map
Google Map
MSN Map
OSM Map
General Map
Google Map
MSN Map
OSM Map
General Map
Google Map
MSN Map
OSM Map
General Map
Google Map
MSN Map
Please wait while loading the map...
Real estate property taxes paid for housing units in 2022:
This zip code:
0.7% ($7,231)
California:
0.7% ($4,831)
Median real estate property taxes paid for housing units with mortgages in 2022: $7,973 (0.8%) Median real estate property taxes paid for housing units with no mortgage in 2022: $5,096 (0.5%)
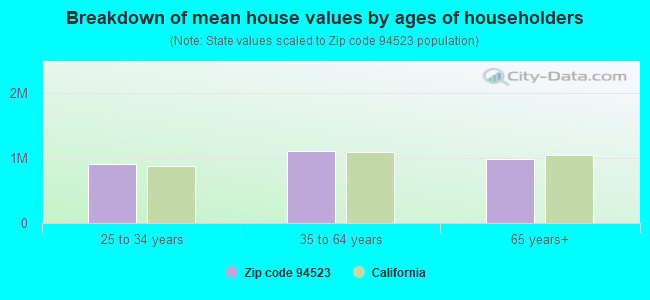
Estimated median house/condo value in 2022: $1,041,546
94523:
$1,041,546
California:
$715,900
According to our research of California and other state lists, there were 15 registered sex offenders living in 94523 zip code as of April 27, 2024. The ratio of all residents to sex offenders in zip code 94523 is 2,349 to 1. The ratio of registered sex offenders to all residents in this zip code is much lower than the state average.
Median resident age:
This zip code:
42.8 years
California median age:
37.9 years
Average household size:
This zip code:
2.4 people
California:
2.8 people
Averages for the 2020 tax year for zip code 94523, filed in 2021:
Average Adjusted Gross Income (AGI) in 2020: $119,065 (Individual Income Tax Returns)
Here:
$119,065
State:
$95,910
Salary/wage: $109,117 (reported on 77.2% of returns)
Here:
$109,117
State:
$77,331
(% of AGI for various income ranges: 1097.9% for AGIs below $25k, 3574.6% for AGIs $25k-50k, 7009.5% for AGIs $50k-75k, 10295.0% for AGIs $75k-100k, 20139.0% for AGIs $100k-200k, 80454.1% for AGIs over 200k)
Taxable interest for individuals: $1,414 (reported on 50.4% of returns)
This zip code:
$1,414
California:
$2,294
(% of AGI for various income ranges: 33.5% for AGIs below $25k, 49.4% for AGIs $25k-50k, 69.6% for AGIs $50k-75k, 134.1% for AGIs $75k-100k, 151.7% for AGIs $100k-200k, 567.7% for AGIs over 200k)
Ordinary dividends: $5,911 (reported on 35.3% of returns)
Here:
$5,911
State:
$10,949
(% of AGI for various income ranges: 72.1% for AGIs below $25k, 126.4% for AGIs $25k-50k, 204.4% for AGIs $50k-75k, 344.7% for AGIs $75k-100k, 484.8% for AGIs $100k-200k, 1716.4% for AGIs over 200k)
Net capital gain/loss in AGI: +$20,614 (reported on 33.1% of returns)
Here:
+$20,614
State:
+$49,306
(% of AGI for various income ranges: 37.9% for AGIs below $25k, 98.5% for AGIs $25k-50k, 161.4% for AGIs $50k-75k, 279.5% for AGIs $75k-100k, 719.6% for AGIs $100k-200k, 10195.7% for AGIs over 200k)
Profit/loss from business: +$22,793 (reported on 19.2% of returns)
Here:
+$22,793
State:
+$15,671
(% of AGI for various income ranges: 204.7% for AGIs below $25k, 395.5% for AGIs $25k-50k, 450.8% for AGIs $50k-75k, 662.7% for AGIs $75k-100k, 853.3% for AGIs $100k-200k, 3659.9% for AGIs over 200k)
Taxable individual retirement arrangement distribution: $28,346 (reported on 12.0% of returns)
94523:
$28,346
California:
$23,505
(% of AGI for various income ranges: 82.3% for AGIs below $25k, 228.3% for AGIs $25k-50k, 386.2% for AGIs $50k-75k, 538.9% for AGIs $75k-100k, 1080.2% for AGIs $100k-200k, 2110.5% for AGIs over 200k)
Self-employed (Keogh) retirement plans: $22,210 (reported on 1.7% of returns)
94523:
$22,210
California:
$30,163
(% of AGI for various income ranges: 33.8% for AGIs $50k-75k, 46.3% for AGIs $75k-100k, 70.5% for AGIs $100k-200k, 461.0% for AGIs over 200k)
Total itemized deductions: $33,929 (reported on 25.7% of returns)
Here:
$33,929
State:
$39,517
(% of AGI for various income ranges: 213.5% for AGIs below $25k, 370.6% for AGIs $25k-50k, 700.8% for AGIs $50k-75k, 1266.5% for AGIs $75k-100k, 2266.9% for AGIs $100k-200k, 7486.6% for AGIs over 200k)
Charity contributions: $6,626 (reported on 20.8% of returns)
Here:
$6,626
State:
$12,598
(% of AGI for various income ranges: 8.7% for AGIs below $25k, 24.3% for AGIs $25k-50k, 82.1% for AGIs $50k-75k, 138.5% for AGIs $75k-100k, 249.6% for AGIs $100k-200k, 1657.2% for AGIs over 200k)
Taxes paid: $9,093 (reported on 25.6% of returns)
94523:
$9,093
State:
$8,807
(% of AGI for various income ranges: 39.0% for AGIs below $25k, 88.0% for AGIs $25k-50k, 183.8% for AGIs $50k-75k, 374.6% for AGIs $75k-100k, 698.8% for AGIs $100k-200k, 1820.7% for AGIs over 200k)
Earned income credit: $1,490 (reported on 5.9% of returns)
Here:
$1,490
State:
$2,074
(% of AGI for various income ranges: 43.2% for AGIs below $25k, 36.1% for AGIs $25k-50k)
Percentage of individuals using paid preparers for their 2020 taxes: 92.3%
Here:
92%
State:
92%
(% for various income ranges: 89.5% for AGIs below $25k, 92.2% for AGIs $25k-50k, 92.0% for AGIs $50k-75k, 92.9% for AGIs $75k-100k, 92.9% for AGIs $100k-200k, 94.6% for AGIs over 200k)
Averages for the 2012 tax year for zip code 94523, filed in 2013:
Average Adjusted Gross Income (AGI) in 2012: $84,090 (Individual Income Tax Returns)
Here:
$84,090
State:
$72,726
Salary/wage: $77,469 (reported on 79.9% of returns)
Here:
$77,469
State:
$59,079
(% of AGI for various income ranges: 65.8% for AGIs below $25k, 70.5% for AGIs $25k-50k, 70.3% for AGIs $50k-75k, 74.1% for AGIs $75k-100k, 78.7% for AGIs $100k-200k, 69.8% for AGIs over 200k)
Taxable interest for individuals: $1,094 (reported on 50.3% of returns)
This zip code:
$1,094
California:
$2,146
(% of AGI for various income ranges: 1.8% for AGIs below $25k, 1.0% for AGIs $25k-50k, 0.8% for AGIs $50k-75k, 0.6% for AGIs $75k-100k, 0.4% for AGIs $100k-200k, 0.7% for AGIs over 200k)
Ordinary dividends: $4,933 (reported on 31.8% of returns)
Here:
$4,933
State:
$9,308
(% of AGI for various income ranges: 3.2% for AGIs below $25k, 2.2% for AGIs $25k-50k, 2.1% for AGIs $50k-75k, 1.7% for AGIs $75k-100k, 1.4% for AGIs $100k-200k, 2.2% for AGIs over 200k)
Net capital gain/loss in AGI: +$8,274 (reported on 27.1% of returns)
Here:
+$8,274
State:
+$30,460
(% of AGI for various income ranges: 0.4% for AGIs $25k-50k, 0.5% for AGIs $50k-75k, 0.7% for AGIs $75k-100k, 1.0% for AGIs $100k-200k, 7.6% for AGIs over 200k)
Profit/loss from business: +$22,480 (reported on 18.8% of returns)
Here:
+$22,480
State:
+$17,064
(% of AGI for various income ranges: 12.7% for AGIs below $25k, 8.4% for AGIs $25k-50k, 6.1% for AGIs $50k-75k, 4.8% for AGIs $75k-100k, 3.9% for AGIs $100k-200k, 4.2% for AGIs over 200k)
Taxable individual retirement arrangement distribution: $21,218 (reported on 12.3% of returns)
94523:
$21,218
California:
$19,557
(% of AGI for various income ranges: 4.7% for AGIs below $25k, 3.4% for AGIs $25k-50k, 3.4% for AGIs $50k-75k, 3.6% for AGIs $75k-100k, 2.8% for AGIs $100k-200k, 2.9% for AGIs over 200k)
Self-employment retirement plans: $15,848 (reported on 1.7% of returns)
94523:
$15,848
California:
$24,530
(% of AGI for various income ranges: 0.2% for AGIs $25k-50k, 0.2% for AGIs $50k-75k, 0.3% for AGIs $75k-100k, 0.3% for AGIs $100k-200k, 0.5% for AGIs over 200k)
Total itemized deductions: $29,422 (23% of AGI, reported on 49.8% of returns)
Here:
$29,422
State:
$34,004
Here:
22.6% of AGI
State:
22.7% of AGI
(% of AGI for various income ranges: 20.7% for AGIs below $25k, 14.9% for AGIs $25k-50k, 15.5% for AGIs $50k-75k, 18.0% for AGIs $75k-100k, 18.5% for AGIs $100k-200k, 16.7% for AGIs over 200k)
Charity contributions: $2,785 (reported on 41.3% of returns)
Here:
$2,785
State:
$4,659
(% of AGI for various income ranges: 0.7% for AGIs below $25k, 0.9% for AGIs $25k-50k, 1.3% for AGIs $50k-75k, 1.5% for AGIs $75k-100k, 1.4% for AGIs $100k-200k, 1.5% for AGIs over 200k)
Taxes paid: $11,931 (reported on 49.7% of returns)
94523:
$11,931
State:
$14,448
(% of AGI for various income ranges: 3.7% for AGIs below $25k, 3.3% for AGIs $25k-50k, 4.4% for AGIs $50k-75k, 6.3% for AGIs $75k-100k, 7.8% for AGIs $100k-200k, 8.8% for AGIs over 200k)
Earned income credit: $1,534 (reported on 7.1% of returns)
Here:
$1,534
State:
$2,286
(% of AGI for various income ranges: 2.6% for AGIs below $25k, 0.4% for AGIs $25k-50k)
Percentage of individuals using paid preparers for their 2012 taxes: 51.6%
Here:
52%
State:
64%
(% for various income ranges: 44.3% for AGIs below $25k, 49.0% for AGIs $25k-50k, 53.3% for AGIs $50k-75k, 55.0% for AGIs $75k-100k, 56.2% for AGIs $100k-200k, 61.3% for AGIs over 200k)
Averages for the 2004 tax year for zip code 94523, filed in 2005:
Average Adjusted Gross Income (AGI) in 2004: $66,542 (Individual Income Tax Returns)
Here:
$66,542
State:
$58,600
Salary/wage: $63,215 (reported on 81.1% of returns)
Here:
$63,215
State:
$49,455
(% of AGI for various income ranges: 167.9% for AGIs below $10k, 65.2% for AGIs $10k-25k, 74.7% for AGIs $25k-50k, 76.1% for AGIs $50k-75k, 79.3% for AGIs $75k-100k, 77.3% for AGIs over 100k)
Taxable interest for individuals: $1,435 (reported on 59.4% of returns)
This zip code:
$1,435
California:
$2,365
(% of AGI for various income ranges: 14.5% for AGIs below $10k, 3.4% for AGIs $10k-25k, 1.6% for AGIs $25k-50k, 1.5% for AGIs $50k-75k, 1.3% for AGIs $75k-100k, 0.9% for AGIs over 100k)
Taxable dividends: $2,464 (reported on 37.2% of returns)
Here:
$2,464
State:
$4,746
(% of AGI for various income ranges: 11.3% for AGIs below $10k, 3.1% for AGIs $10k-25k, 1.7% for AGIs $25k-50k, 1.7% for AGIs $50k-75k, 1.2% for AGIs $75k-100k, 1.1% for AGIs over 100k)
Net capital gain/loss: +$7,370 (reported on 30.2% of returns)
Here:
+$7,370
State:
+$23,418
(% of AGI for various income ranges: 13.1% for AGIs below $10k, -0.2% for AGIs $10k-25k, 0.4% for AGIs $25k-50k, 0.9% for AGIs $50k-75k, 0.9% for AGIs $75k-100k, 5.5% for AGIs over 100k)
Profit/loss from business: +$20,800 (reported on 18.3% of returns)
Here:
+$20,800
State:
+$16,826
(% of AGI for various income ranges: 12.6% for AGIs below $10k, 10.1% for AGIs $10k-25k, 7.0% for AGIs $25k-50k, 4.8% for AGIs $50k-75k, 5.5% for AGIs $75k-100k, 5.4% for AGIs over 100k)
IRA payment deduction: $3,145 (reported on 4.0% of returns)
94523:
$3,145
California:
$3,192
(% of AGI for various income ranges: 1.1% for AGIs below $10k, 0.4% for AGIs $10k-25k, 0.4% for AGIs $25k-50k, 0.2% for AGIs $50k-75k, 0.2% for AGIs $75k-100k, 0.1% for AGIs over 100k)
Self-employed pension: $13,616 (reported on 2.5% of returns)
Here:
$13,616
California:
$17,688
(% of AGI for various income ranges: 0.3% for AGIs $10k-25k, 0.3% for AGIs $25k-50k, 0.3% for AGIs $50k-75k, 0.4% for AGIs $75k-100k, 0.7% for AGIs over 100k)
Total itemized deductions: $25,383 (25% of AGI, reported on 51.1% of returns)
Here:
$25,383
State:
$28,113
Here:
24.8% of AGI
State:
25.3% of AGI
(% of AGI for various income ranges: 60.8% for AGIs below $10k, 18.9% for AGIs $10k-25k, 16.4% for AGIs $25k-50k, 20.1% for AGIs $50k-75k, 21.8% for AGIs $75k-100k, 19.0% for AGIs over 100k)
Charity contributions deductions: $2,370 (2% of AGI, reported on 45.5% of returns)
Here:
$2,370
State:
$3,923
Here:
2.2% of AGI
State:
3.3% of AGI
(% of AGI for various income ranges: 2.0% for AGIs below $10k, 1.2% for AGIs $10k-25k, 1.4% for AGIs $25k-50k, 1.6% for AGIs $50k-75k, 1.9% for AGIs $75k-100k, 1.6% for AGIs over 100k)
Total tax: $10,717 (reported on 85.0% of returns)
94523:
$10,717
State:
$10,761
(% of AGI for various income ranges: 8.7% for AGIs below $10k, 5.5% for AGIs $10k-25k, 8.7% for AGIs $25k-50k, 10.5% for AGIs $50k-75k, 11.1% for AGIs $75k-100k, 17.1% for AGIs over 100k)
Earned income credit: $1,273 (reported on 5.6% of returns)
Here:
$1,273
State:
$1,763
Percentage of individuals using paid preparers for their 2004 taxes: 53.9%
Here:
54%
State:
66%
(% for various income ranges: 43.3% for AGIs below $10k, 54.3% for AGIs $10k-25k, 52.4% for AGIs $25k-50k, 57.4% for AGIs $50k-75k, 56.3% for AGIs $75k-100k, 58.3% for AGIs over 100k)
Likely homosexual households (counted as self-reported same-sex unmarried-partner households)
Lesbian couples: 0.0% of all households
Gay men: 0.2% of all households
Household received Food Stamps/SNAP in the past 12 months: 457 Household did not receive Food Stamps/SNAP in the past 12 months: 13,555
Women who had a birth in the past 12 months: 367 (291 now married, 75 unmarried) Women who did not have a birth in the past 12 months: 7,741 (3,307 now married, 4,423 unmarried)
Housing units in zip code 94523 with a mortgage: 6,848 (996 second mortgage, 11 home equity loan, 922 both second mortgage and home equity loan) Houses without a mortgage: 151
Median monthly owner costs for units with a mortgage: $3,275 Median monthly owner costs for units without a mortgage: $898
Residents with income below the poverty level in 2022:
This zip code:
6.6%
Whole state:
12.2%
Residents with income below 50% of the poverty level in 2022:
This zip code:
1.9%
Whole state:
6.2%
Median number of rooms in houses and condos:
Here:
6.1
State:
6.0
Median number of rooms in apartments:
Here:
3.8
State:
3.9
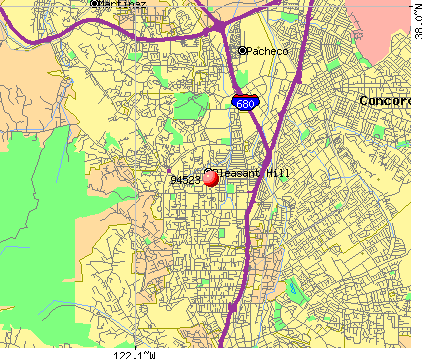
Notable locations in this zip code not listed on our city pages
Notable locations in zip code 94523: Contra Costa Golf Club (A), Meadowbrook Golf Club (B), Pleasant Hill City Hall (C), Central Branch Contra Costa County Library (D), Contra Costa County Fire Protection District Station 5 (E), Contra Costa County Fire Protection District Station 2 (F). Display/hide their locations on the map
Shopping Centers: Contra Costa Shopping Center (1), Pleasant Hill Plaza Shopping Center (2), Gregory Village Shopping Center (3), College Square Shopping Center (4). Display/hide their locations on the map
Churches in zip code 94523 include: Saint Marks Lutheran Church (A), Christ the King Roman Catholic Church (B), Saint Andrew's Presbyterian Church (C), Church of Jesus Christ of Latter Day Saints (D). Display/hide their locations on the map
Parks in zip code 94523 include: Memorial Monument (1), Viking Field (2), Chilpancingo Park (3), Dinosaur Hill Park (4), Las Juntas Park (5), Len Hester Park (6), Paso Nogal Park (7), Pinewood Park (8), Pleasant Hill Park (9). Display/hide their locations on the map
4,631 married couples with children.
1,373 single-parent households (328 men, 1,045 women).
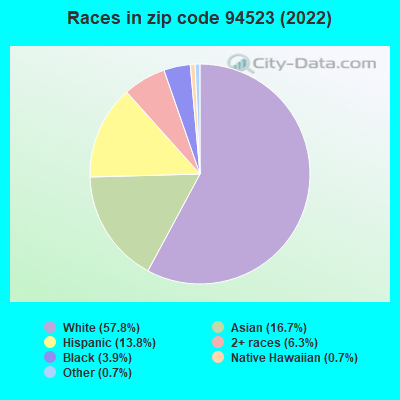
74.9% of residents of 94523 zip code speak English at home.
6.8% of residents speak Spanish at home (83% very well, 11% well, 5% not well, 1% not at all).
8.6% of residents speak other Indo-European language at home (78% very well, 15% well, 6% not well).
8.9% of residents speak Asian or Pacific Island language at home (50% very well, 33% well, 14% not well, 3% not at all).
0.8% of residents speak other language at home (79% very well, 14% well, 7% not well).
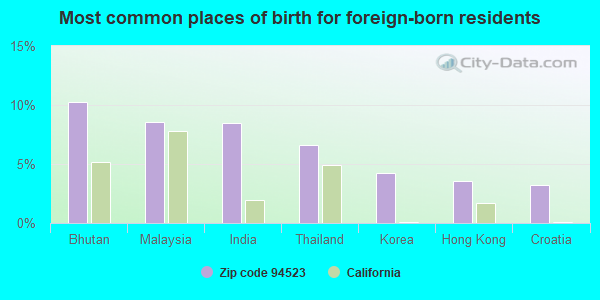
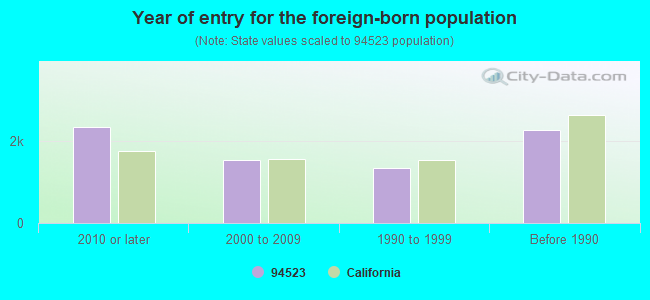
Foreign born population: 6,763 (19.5%) (65.9% of them are naturalized citizens)
Major facilities with environmental interests located in this zip code:
APPLIED OPTICS INC (3349 VINCENT RD in PLEASANT HILL, CA)
STATE MASTER (California - Hazardous Waste Tracking) - HAZARDOU WASTE PROGRAM Small Quantity Generators, between 100 kg and 1000 kg of hazardous waste/month (Resource Conservation and Recovery Act (tracking hazardous waste)) - notification Small Quantity Generators, between 100 kg and 1000 kg of hazardous waste/month (Resource Conservation and Recovery Act (tracking hazardous waste)) - notification Organizations: JOE LINKE (CONTACT/OWNER)
Alternative names: APPLIED VINCENT ROAD
GREAT INDOORS (2302 MONUMENT BLVD in PLEASANT HILL, CA)
STATE MASTER (California - Hazardous Waste Tracking) - HAZARDOU WASTE PROGRAM Large Quantity Generators, more that 1000 kg of hazardous waste/month (Resource Conservation and Recovery Act (tracking hazardous waste)) - notification Organizations: PH HOLDINGS, L.P. (CONTACT/OPERATOR)
EXXON SERVICE STATION NO 7-3606 (605 CONTRA COSTA BLVD/CONCORD in CONCORD, CA)
STATE MASTER (California - Hazardous Waste Tracking) - HAZARDOU WASTE PROGRAM Small Quantity Generators, between 100 kg and 1000 kg of hazardous waste/month (Resource Conservation and Recovery Act (tracking hazardous waste)) - notification Organizations: EXXON CO USA (CONTACT/OWNER)
Alternative names: EXXON MOBIL CORPORATION #736060
GRACE CLEANERS (690 GREGORY LANE in PLEASANT HILL, CA)
STATE MASTER (California - Hazardous Waste Tracking) - HAZARDOU WASTE PROGRAM CRITERIA AND HAZARDOUS AIR POLLUTANT INVENTORY (Inventory of air pollution sources) Small Quantity Generators, between 100 kg and 1000 kg of hazardous waste/month (Resource Conservation and Recovery Act (tracking hazardous waste)) Business SIC classification: DRYCLEANING PLANTS, EXCEPT RUG CLEANING
HIGH SIERRA GOLD & SILVER (315 GLADYS DR in PLEASANT HILL, CA)
STATE MASTER (California - Hazardous Waste Tracking) - HAZARDOU WASTE PROGRAM TRANSPORTER (Resource Conservation and Recovery Act (tracking hazardous waste)) Organizations: TOPEL IRVIN (CONTACT/OWNER)
EQUILON ENTERPRISES (2401 PLEASANT HILL RD/GRAYSON in PLEASANT HILL, CA) . Federal Facility
STATE MASTER (California - Hazardous Waste Tracking) - HAZARDOU WASTE PROGRAM Small Quantity Generators, between 100 kg and 1000 kg of hazardous waste/month (Resource Conservation and Recovery Act (tracking hazardous waste)) - notification Organizations: EQUILON ENTERPRISES, LLC (CONTACT/OWNER)
Alternative names: SHELL OIL CO
EQUILON ENTERPRISES (606 CONTRA COSTA/CHILPANCINGO in PLEASANT HILL, CA) . Federal Facility
STATE MASTER (California - Hazardous Waste Tracking) - HAZARDOU WASTE PROGRAM Small Quantity Generators, between 100 kg and 1000 kg of hazardous waste/month (Resource Conservation and Recovery Act (tracking hazardous waste)) - notification Organizations: EQUILON ENTERPRISES, LLC (CONTACT/OWNER)
Alternative names: SHELL OIL CO
FULLER OBRIEN PAINTS (1476 CONTRA COSTA BLVD in PLEASANT HILL, CA)
STATE MASTER (California - Hazardous Waste Tracking) - HAZARDOU WASTE PROGRAM Small Quantity Generators, between 100 kg and 1000 kg of hazardous waste/month (Resource Conservation and Recovery Act (tracking hazardous waste)) - notification Organizations: THE GLIDDEN COMPANY (CONTACT/OWNER)
Alternative names: THE GLIDDEN CO DBA ICI PAINTS
CHEVRON STATION NO 96817 (1705 CONTRA COSTA BLVD in PLEASANT HILL, CA)
STATE MASTER (California - Hazardous Waste Tracking) - HAZARDOU WASTE PROGRAM Small Quantity Generators, between 100 kg and 1000 kg of hazardous waste/month (Resource Conservation and Recovery Act (tracking hazardous waste)) - notification Organizations: CHEVRON PRODUCTS CO (CONTACT/OWNER)
FAIR OAKS ELEMENTARY SCHOOL (2400 LISA LANE in PLEASANT HILL, CA)
(National Center for Education Statistics) - STATE ID-6004055 Organizations: MT. DIABLO UNIFIED (SCHOOL DISTRICT)
GREGORY GARDENS ELEMENTARY (200 HARRIET DR. in PLEASANT HILL, CA)
(National Center for Education Statistics) - STATE ID-6112395 Organizations: MT. DIABLO UNIFIED (SCHOOL DISTRICT)
HOME AND HOSPITAL (3100 OAK PARK BOULEVARD in PLEASANT HILL, CA)
(National Center for Education Statistics) - STATE ID-6104350 Organizations: MT. DIABLO UNIFIED (SCHOOL DISTRICT)
HORIZONS ALTERNATIVE (3100 OAK PARK BLVD. in PLEASANT HILL, CA)
(National Center for Education Statistics) - STATE ID-0730317 Organizations: MT. DIABLO UNIFIED (SCHOOL DISTRICT)
Housing units lacking complete plumbing facilities: 0.1% Housing units lacking complete kitchen facilities: 3.1%
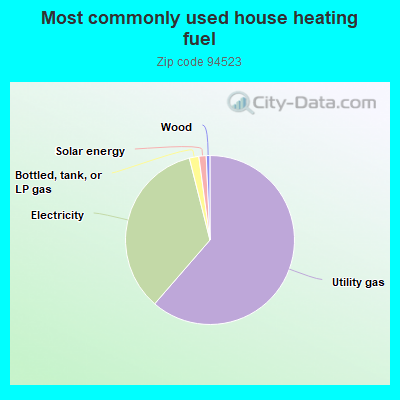
61.0%Utility gas
34.5%Electricity
1.8%Bottled, tank, or LP gas
1.4%Solar energy
0.7%Wood
Population in 1990: 31,046. Population change in the 1990s: +1,625 (+5.2%).
Place of birth for U.S.-born residents:
This state: 20,621
Northeast: 1,735
Midwest: 2,068
South: 1,466
West: 1,353
54% of the 94523 zip code residents lived in the same house 5 years ago. Out of people who lived in different houses, 57% lived in this county. Out of people who lived in different counties, 50% lived in California.
88% of the 94523 zip code residents lived in the same house 1 year ago. Out of people who lived in different houses, 43% moved from this county. Out of people who lived in different houses, 43% moved from different county within same state. Out of people who lived in different houses, 12% moved from different state. Out of people who lived in different houses, 2% moved from abroad.
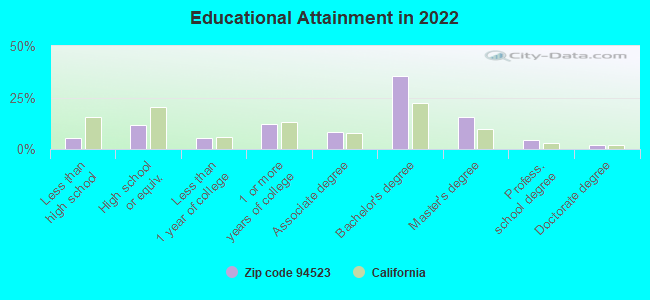
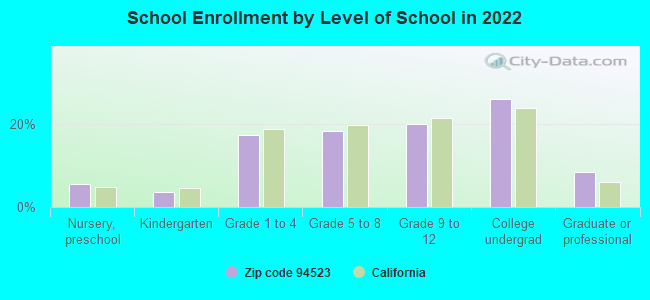
Private vs. public school enrollment:
Students in private schools in grades 1 to 8 (elementary and middle school): 356
Here:
12.1%
California:
10.5%
Students in private schools in grades 9 to 12 (high school): 277
Here:
16.7%
California:
8.5%
Students in private undergraduate colleges: 364
Here:
16.9%
California:
15.9%
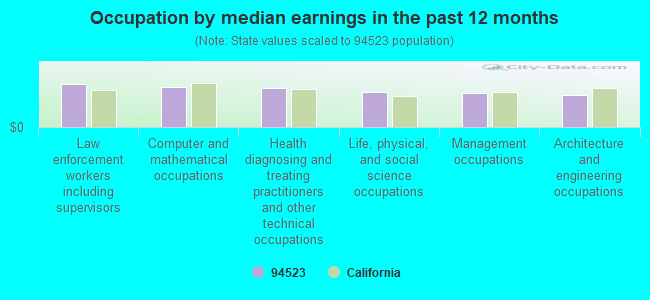
Occupation by median earnings in the past 12 months ($)
149,683Law enforcement workers including supervisors
138,983Computer and mathematical occupations
135,243Health diagnosing and treating practitioners and other technical occupations
119,821Life, physical, and social science occupations
117,920Management occupations
109,505Architecture and engineering occupations
Companies with federal contracts located in this zip code (PLEASANT HILL, CA):
THE SOURCE GROUP,INC (3451-C VINCENT DRIVE; small business) : $777,773 in 12 contractsfrom 2004 to 2005
Contracts for Operation of Government-Owned Facilities -- Fuel Storage Buildings by Defense Logistics Agency Signed by year:2000: $0; 2001: $0; 2002: $0; 2003: $0; 2004: $815,000; 2005: -$37,227; 2006: $0.
Biggest contracts:
$815,000 with Defense Logistics Agency for Operation of Government-Owned Facilities -- Fuel Storage Buildings. Signed on 2004-06-17. Completion date: 2004-06-30.
$387,000, same as above.Signed on 2005-06-30. Completion date: 2005-06-30.
$26,000, same as above.Signed on 2005-08-31. Completion date: 2006-06-30.
$3,000, same as above.Signed on 2005-04-28. Completion date: 2005-06-30.
PHASESPACE INC (1937A OAK PARK BLVD STE A; small business) : $685,659 in 10 contractsfrom 1999 to 2006
Contracts for Services -- Basic Research (R&D), Other Cryptologic Equipment and Components, Other Defense -- Basic Research (R&D), Other Defense -- Engineering Development (R&D), and moreby Navy, Air Force, NASA Signed by year:2000: $29,861; 2001: $0; 2002: $0; 2003: $149,978; 2004: $29,200; 2005: $306,900; 2006: $100,000.
Biggest contracts:
$149,978 with Navy for Services -- Basic Research (R&D). Signed on 2003-05-07. Completion date: 2004-02-27.
$130,000 with Navy for Other Cryptologic Equipment and Components. Signed on 2005-05-27. Completion date: 2005-09-30.
$100,000 with Air Force for Other Defense -- Basic Research (R&D). Signed on 2006-06-16. Completion date: 2007-03-30.
$99,900 with Navy for Other Defense -- Engineering Development (R&D). Signed on 2005-03-24. Completion date: 2005-05-25.
MARRIOTT INTERNATIONAL, INC (700 ELLINWOOD WAY; small business) : $38,154 in 3 contractsfrom 2003 to 2005
$30,820 with Army for Lodging - Hotel/Motel. Signed on 2003-08-12. Completion date: 2003-09-12.
$6,104, same as above.Signed on 2005-08-02. Completion date: 2005-08-21.
$1,230, same as above.Signed on 2005-09-21. Completion date: 2005-08-21.
ODUMAKINDE, OLUSOJI (343 FLAMING OAK DR; small business)
$20,948 with Army for ADP Components. Signed on 2005-09-26. Completion date: 2005-09-30.
BEAR BASIN OUTFITTERS (3339 VINCENT RD; small business) : $19,087 in 2 contractsfrom 2003 to 2005
$15,020 with Air Force for Miscellaneous Service and Trade Equipment. Signed on 2005-04-11. Completion date: 2005-05-31.
$4,067 with Army for Miscellaneous Weapons. Signed on 2003-09-25. Completion date: 2003-10-15.
COURTYARD BY MARRIOTT II L P (2250 CONTRA COSTA BLVD) : $12,960 in 2 contractsin 2004
$9,180 with Army for Lodging - Hotel/Motel. Signed on 2004-07-29. Completion date: 2004-08-29.
$3,780, same as above.Signed on 2004-08-25. Completion date: 2004-09-05.
LUTZ ENTERPRISES, INC (3345 VINCENT RD; small business)
$60 with Navy for Miscellaneous Fabricated Nonmetallic Materials. Signed on 2005-09-30. Completion date: 2005-10-12.
Top industries in this zip code by the number of employees in 2005:
Health Care and Social Assistance: General Medical and Surgical Hospitals (over 1000 employees: 1 establishment)
2004 - 2017 National Fire Incident Reporting System (NFIRS) incidents
Based on the data from the years 2004 - 2017 the average number of fire incidents per year is 10. The highest number of fire incidents - 86 took place in 2005, and the least - 0 in 2011. The data has a constant trend.
When looking into fire subcategories, the most reports belonged to: Structure Fires (43.1%), and Outside Fires (32.8%).
Fire incident types reported to NFIRS in Zip Code 94523


 Nearest zip codes: 94597, 94518, 94520, 94549, 94519, 94553.
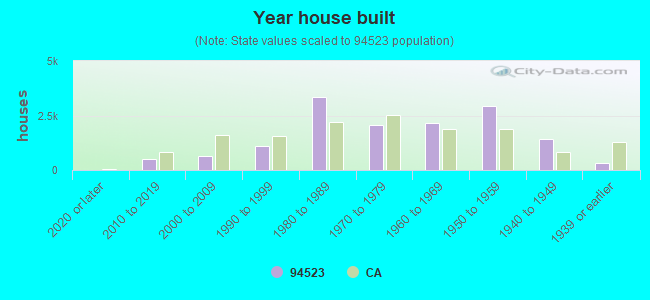


 Based on the data from the years 2004 - 2017 the average number of fire incidents per year is 10. The highest number of fire incidents - 86 took place in 2005, and the least - 0 in 2011. The data has a constant trend.
 When looking into fire subcategories, the most reports belonged to: Structure Fires (43.1%), and Outside Fires (32.8%).