Waldon, California
Submit your own pictures of this place and show them to the world
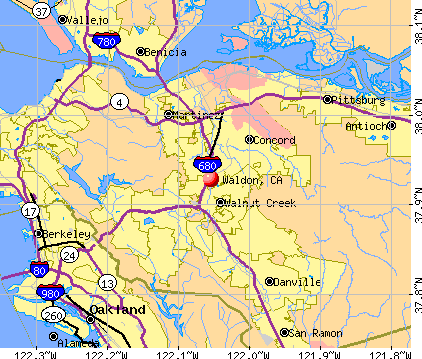
- OSM Map
- General Map
- Google Map
- MSN Map
Population change since 2000: +4.5%
| Males: 2,643 | |
| Females: 2,721 |
| Median resident age: | 33.3 years |
| California median age: | 32.1 years |
Zip codes: 94596.
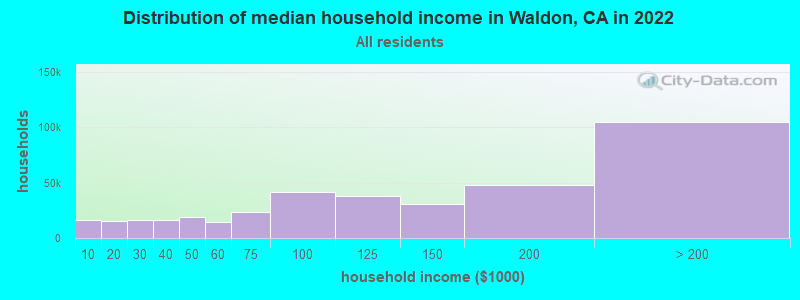
| Waldon: | $110,401 |
| CA: | $91,551 |
Estimated per capita income in 2022: $80,288 (it was $41,093 in 2000)
Waldon CDP income, earnings, and wages data
Estimated median house or condo value in 2022: $807,807 (it was $236,800 in 2000)
| Waldon: | $807,807 |
| CA: | $715,900 |
Mean prices in 2022: all housing units: over $1,000,000; detached houses: over $1,000,000; townhouses or other attached units: $865,348; in 2-unit structures: $602,949; in 3-to-4-unit structures: $772,223; in 5-or-more-unit structures: $695,046; mobile homes: $193,193; occupied boats, rvs, vans, etc.: $261,954
Detailed information about poverty and poor residents in Waldon, CA


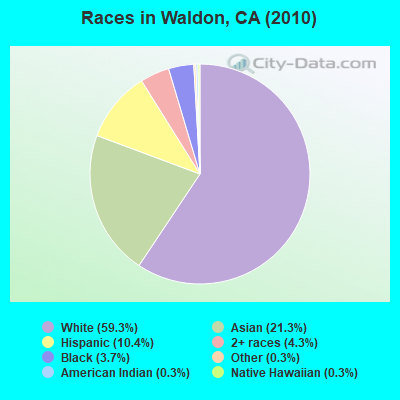
- 3,18259.3%White alone
- 1,14221.3%Asian alone
- 56010.4%Hispanic
- 2314.3%Two or more races
- 2013.7%Black alone
- 150.3%American Indian alone
- 150.3%Native Hawaiian and Other
Pacific Islander alone - 180.3%Other race alone
 Recent articles from our blog. Our writers, many of them Ph.D. graduates or candidates, create easy-to-read articles on a wide variety of topics.

Latest news from Waldon, CA collected exclusively by city-data.com from local newspapers, TV, and radio stations
Ancestries: German (16.2%), Irish (11.7%), English (8.7%), Italian (8.5%), Scottish (4.0%), French (3.6%).
Current Local Time: PST time zone
Elevation: 88 feet
Land area: 0.66 square miles.
Population density: 8,105 people per square mile (high).
1,145 residents are foreign born (11.7% Asia, 6.0% Europe, 2.7% Latin America).
| This place: | 22.3% |
| California: | 26.2% |
| Waldon CDP: | 0.9% ($2,173) |
| California: | 0.8% ($1,564) |
Nearest city with pop. 50,000+: Central Contra Costa, CA (0.8 miles  , pop. 459,252).
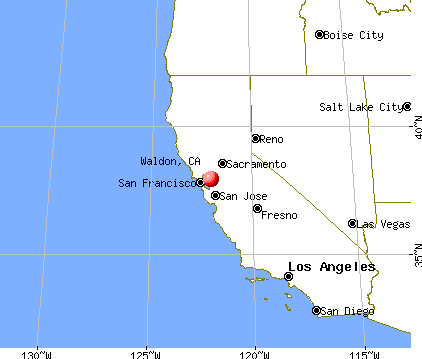
Nearest city with pop. 1,000,000+: Los Angeles, CA (336.1 miles , pop. 3,694,820).
Nearest cities:
), ), ), ), ), )Latitude: 37.93 N, Longitude: 122.05 W
Daytime population change due to commuting: +527 (+10.3%)
Workers who live and work in this place: 192 (5.7%)
Area code commonly used in this area: 925
| Here: | 4.5% |
| California: | 5.1% |
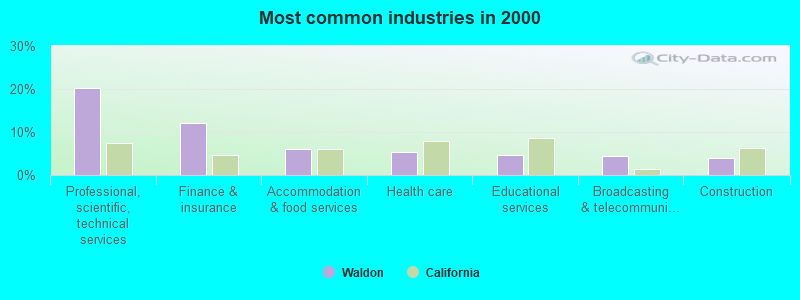
- Professional, scientific, technical services (20.2%)
- Finance & insurance (12.0%)
- Accommodation & food services (5.9%)
- Health care (5.3%)
- Educational services (4.8%)
- Broadcasting & telecommunications (4.5%)
- Construction (3.9%)
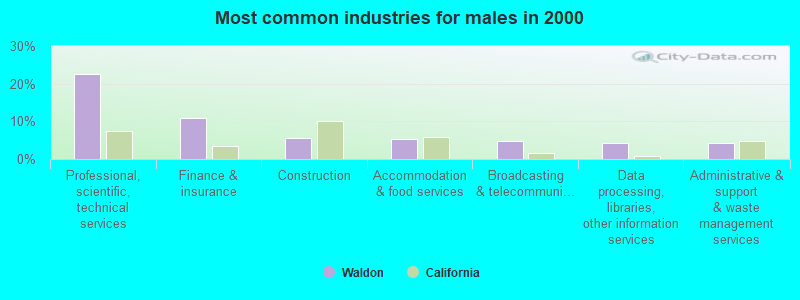
- Professional, scientific, technical services (22.7%)
- Finance & insurance (10.9%)
- Construction (5.5%)
- Accommodation & food services (5.3%)
- Broadcasting & telecommunications (4.8%)
- Data processing, libraries, other information services (4.3%)
- Administrative & support & waste management services (4.2%)
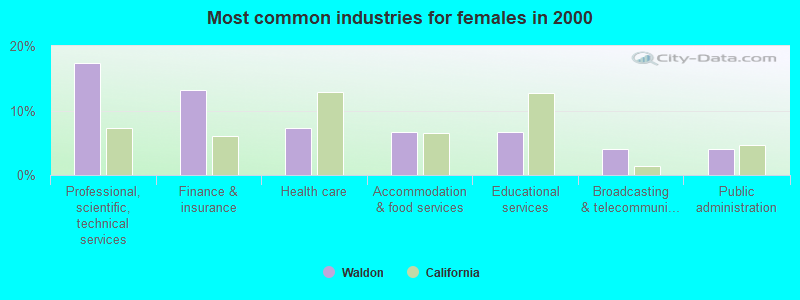
- Professional, scientific, technical services (17.4%)
- Finance & insurance (13.2%)
- Health care (7.2%)
- Accommodation & food services (6.7%)
- Educational services (6.6%)
- Broadcasting & telecommunications (4.1%)
- Public administration (4.1%)
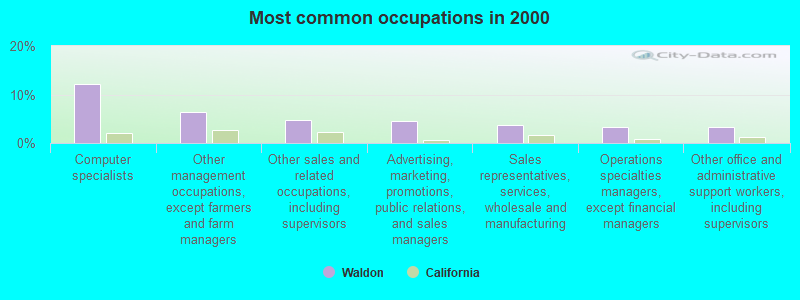
- Computer specialists (12.2%)
- Other management occupations, except farmers and farm managers (6.4%)
- Other sales and related occupations, including supervisors (4.7%)
- Advertising, marketing, promotions, public relations, and sales managers (4.5%)
- Sales representatives, services, wholesale and manufacturing (3.7%)
- Operations specialties managers, except financial managers (3.4%)
- Other office and administrative support workers, including supervisors (3.4%)
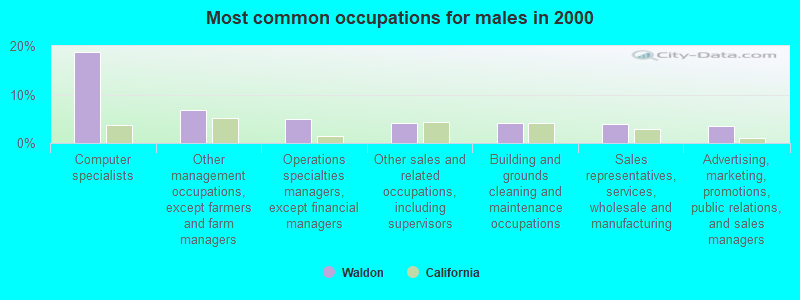
- Computer specialists (18.7%)
- Other management occupations, except farmers and farm managers (6.9%)
- Operations specialties managers, except financial managers (4.9%)
- Other sales and related occupations, including supervisors (4.2%)
- Building and grounds cleaning and maintenance occupations (4.2%)
- Sales representatives, services, wholesale and manufacturing (3.9%)
- Advertising, marketing, promotions, public relations, and sales managers (3.6%)
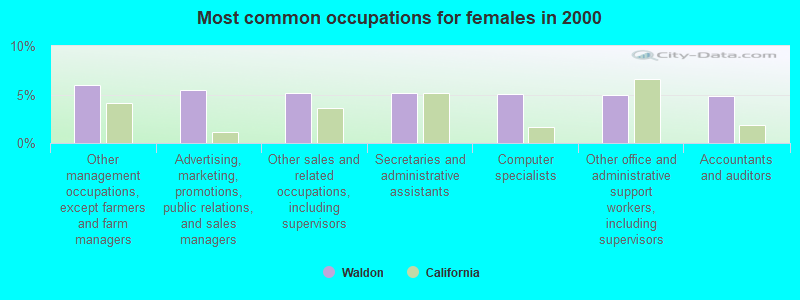
- Other management occupations, except farmers and farm managers (5.9%)
- Advertising, marketing, promotions, public relations, and sales managers (5.5%)
- Other sales and related occupations, including supervisors (5.2%)
- Secretaries and administrative assistants (5.2%)
- Computer specialists (5.1%)
- Other office and administrative support workers, including supervisors (5.0%)
- Accountants and auditors (4.9%)
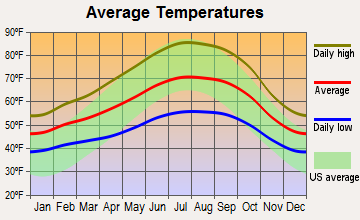
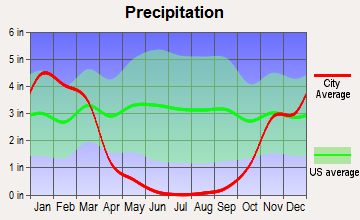
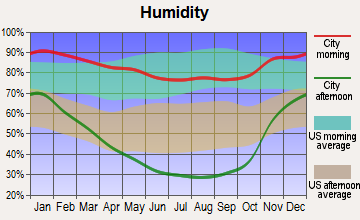
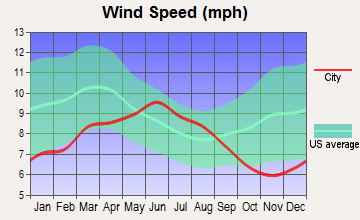
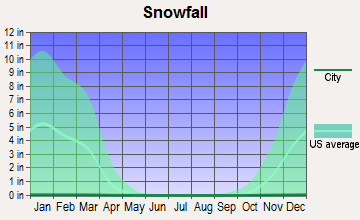
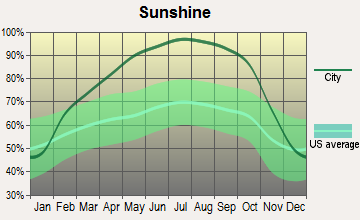
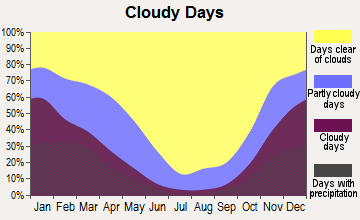
Average climate in Waldon, California
Based on data reported by over 4,000 weather stations
(lower is better)
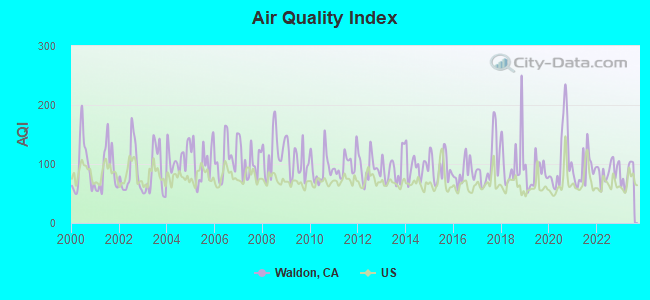
Air Quality Index (AQI) level in 2023 was 81.2. This is about average.
| City: | 81.2 |
| U.S.: | 72.6 |
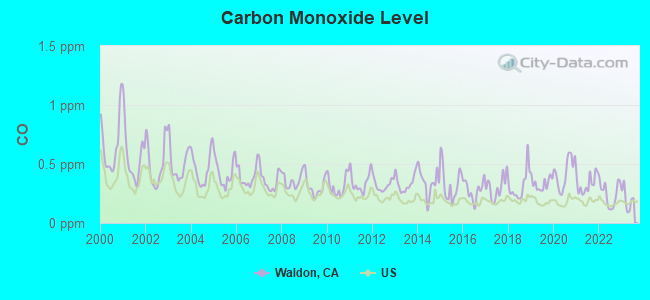
Carbon Monoxide (CO) [ppm] level in 2023 was 0.201. This is better than average. Closest monitor was 1.6 miles away from the city center.
| City: | 0.201 |
| U.S.: | 0.251 |
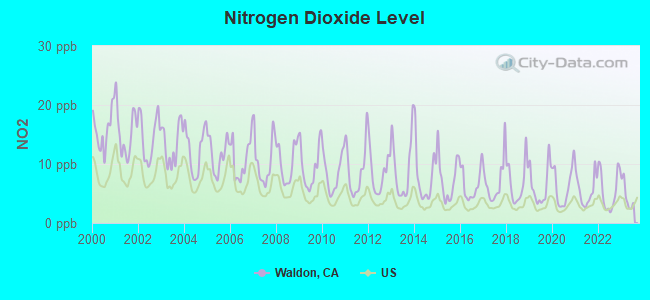
Nitrogen Dioxide (NO2) [ppb] level in 2023 was 4.60. This is about average. Closest monitor was 1.6 miles away from the city center.
| City: | 4.60 |
| U.S.: | 5.11 |
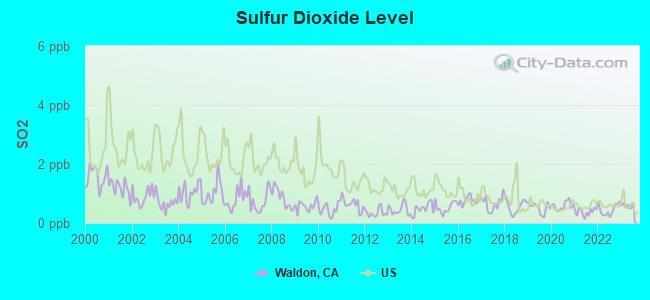
Sulfur Dioxide (SO2) [ppb] level in 2023 was 0.586. This is significantly better than average. Closest monitor was 1.6 miles away from the city center.
| City: | 0.586 |
| U.S.: | 1.515 |
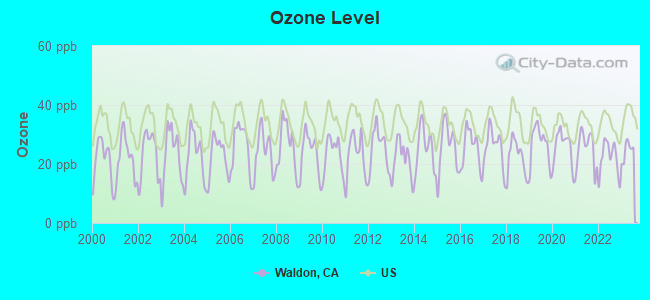
Ozone [ppb] level in 2023 was 24.5. This is better than average. Closest monitor was 1.3 miles away from the city center.
| City: | 24.5 |
| U.S.: | 33.3 |
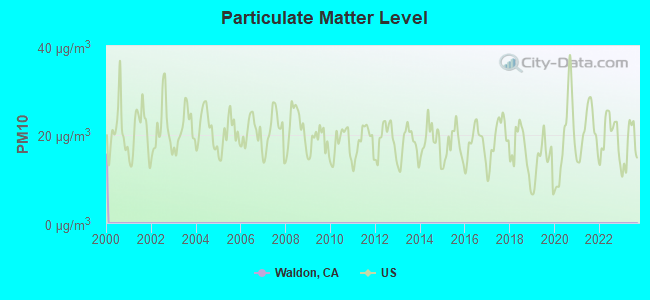
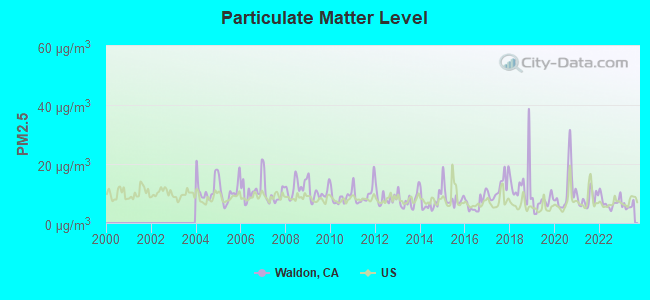
Particulate Matter (PM2.5) [µg/m3] level in 2023 was 5.80. This is better than average. Closest monitor was 1.6 miles away from the city center.
| City: | 5.80 |
| U.S.: | 8.11 |
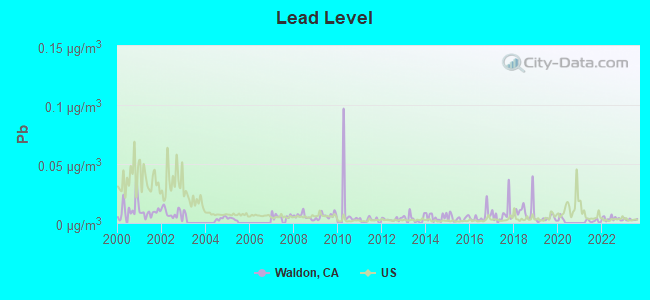
Lead (Pb) [µg/m3] level in 2023 was 0.00290. This is significantly better than average. Closest monitor was 1.6 miles away from the city center.
| City: | 0.00290 |
| U.S.: | 0.00931 |
Earthquake activity:
Waldon-area historical earthquake activity is significantly above California state average. It is 7683% greater than the overall U.S. average.On 4/18/1906 at 13:12:21, a magnitude 7.9 (7.9 UK, Class: Major, Intensity: VIII - XII) earthquake occurred 51.8 miles away from the city center, causing $524,000,000 total damage
On 10/18/1989 at 00:04:15, a magnitude 7.1 (6.5 MB, 7.1 MS, 6.9 MW, 7.0 ML) earthquake occurred 58.7 miles away from Waldon center, causing 62 deaths (62 shaking deaths) and 3757 injuries, causing $1,305,032,704 total damage
On 11/4/1927 at 13:51:53, a magnitude 7.5 (7.5 UK) earthquake occurred 216.1 miles away from Waldon center
On 7/21/1952 at 11:52:14, a magnitude 7.7 (7.7 UK) earthquake occurred 264.3 miles away from the city center, causing $50,000,000 total damage
On 1/31/1922 at 13:17:28, a magnitude 7.6 (7.6 UK) earthquake occurred 267.9 miles away from the city center
On 4/25/1992 at 18:06:04, a magnitude 7.2 (6.3 MB, 7.1 MS, 7.2 MW, 7.1 MW, Depth: 9.4 mi) earthquake occurred 199.3 miles away from Waldon center, causing $75,000,000 total damage
Magnitude types: body-wave magnitude (MB), local magnitude (ML), surface-wave magnitude (MS), moment magnitude (MW)
Natural disasters:
The number of natural disasters in Contra Costa County (18) is near the US average (15).Major Disasters (Presidential) Declared: 11
Emergencies Declared: 3
Causes of natural disasters: Floods: 13, Storms: 7, Winter Storms: 7, Mudslides: 5, Landslides: 4, Drought: 1, Earthquake: 1, Hurricane: 1, Tornado: 1, Wind: 1, Other: 1 (Note: some incidents may be assigned to more than one category).
Hospitals and medical centers near Waldon:
- OAK PARK CONVALESCENT HOSPITAL (Nursing Home, about 1 miles away; PLEASANT HILL, CA)
- HOSPICE OF THE EAST BAY (Hospital, about 1 miles away; PLEASANT HILL, CA)
- SUN VALLEY MANOR (Nursing Home, about 2 miles away; PLEASANT HILL, CA)
- WINDSOR ROSEWOOD CARE CENTER (Nursing Home, about 2 miles away; PLEASANT HILL, CA)
- JOHN MUIR MEDICAL CENTER - WALNUT CREEK CAMPUS Acute Care Hospitals (about 2 miles away; WALNUT CREEK, CA)
- KINDRED NURSING AND REHABILTATION - YGNACIO VALLEY (Nursing Home, about 2 miles away; WALNUT CREEK, CA)
- TAMPICO TERRACE CARE CENTER (Nursing Home, about 2 miles away; WALNUT CREEK, CA)
Amtrak stations near Waldon:
- 8 miles: MARTINEZ (401 FERRY ST.) . Services: ticket office, fully wheelchair accessible, enclosed waiting area, public restrooms, public payphones, full-service food facilities, free short-term parking, free long-term parking, call for taxi service, public transit connection.
- 15 miles: BERKELEY (3RD ST. & UNIVERSITY AVE.) . Services: partially wheelchair accessible, public payphones, free short-term parking, free long-term parking, call for taxi service, public transit connection.
- 15 miles: EMERYVILLE (5885 LANDREGAN ST.) . Services: ticket office, fully wheelchair accessible, enclosed waiting area, public restrooms, public payphones, snack bar, free short-term parking, free long-term parking, call for taxi service, public transit connection.
Colleges/universities with over 2000 students nearest to Waldon:
- Diablo Valley College (about 3 miles; Pleasant Hill, CA; Full-time enrollment: 13,015)
- Saint Mary's College of California (about 7 miles; Moraga, CA; FT enrollment: 4,200)
- Merritt College (about 12 miles; Oakland, CA; FT enrollment: 2,842)
- Los Medanos College (about 12 miles; Pittsburg, CA; FT enrollment: 5,289)
- University of California-Berkeley (about 12 miles; Berkeley, CA; FT enrollment: 37,127)
- Berkeley City College (about 13 miles; Berkeley, CA; FT enrollment: 3,146)
- Laney College (about 15 miles; Oakland, CA; FT enrollment: 5,668)
Points of interest:
Notable location: Pleasant Hill Station (A). Display/hide its location on the map
| This place: | 1.8 people |
| California: | 2.9 people |
| This place: | 39.1% |
| Whole state: | 68.7% |
| This place: | 8.5% |
| Whole state: | 7.2% |
Likely homosexual households (counted as self-reported same-sex unmarried-partner households)
- Lesbian couples: 0.3% of all households
- Gay men: 0.5% of all households
| This place: | 5.5% |
| Whole state: | 14.2% |
| This place: | 2.9% |
| Whole state: | 6.3% |
25 people in other noninstitutional group quarters in 2000
For population 15 years and over in Waldon:
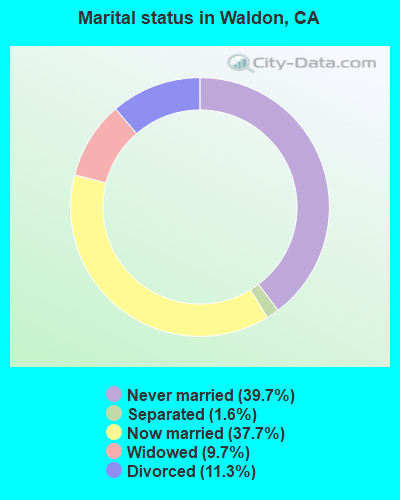
- Never married: 39.7%
- Now married: 37.7%
- Separated: 1.6%
- Widowed: 9.7%
- Divorced: 11.3%
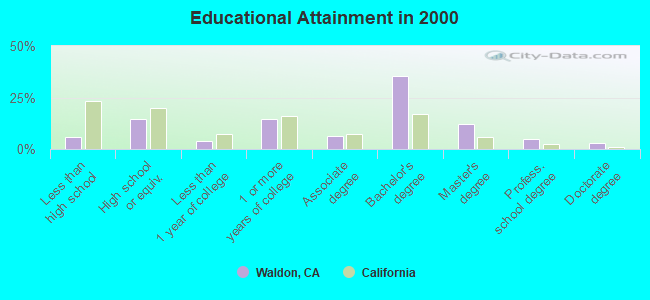
For population 25 years and over in Waldon:
- High school or higher: 94.1%
- Bachelor's degree or higher: 55.0%
- Graduate or professional degree: 19.8%
- Unemployed: 1.3%
- Mean travel time to work (commute): 37.3 minutes
| Here: | 9.9 |
| California average: | 16.1 |


Graphs represent county-level data. Detailed 2008 Election Results
Religion statistics for Waldon, CA (based on Contra Costa County data)


| Religion | Adherents | Congregations |
|---|---|---|
| Catholic | 228,400 | 34 |
| Evangelical Protestant | 81,120 | 352 |
| Other | 48,553 | 123 |
| Mainline Protestant | 32,693 | 101 |
| Black Protestant | 10,395 | 34 |
| Orthodox | 2,435 | 8 |
| None | 645,429 | - |
Food Environment Statistics:
| Here: | 1.78 / 10,000 pop. |
| California: | 2.14 / 10,000 pop. |
| Here: | 0.05 / 10,000 pop. |
| State: | 0.04 / 10,000 pop. |
| Contra Costa County: | 0.51 / 10,000 pop. |
| California: | 0.62 / 10,000 pop. |
| Here: | 1.75 / 10,000 pop. |
| California: | 1.49 / 10,000 pop. |
| Here: | 6.73 / 10,000 pop. |
| California: | 7.42 / 10,000 pop. |
| Here: | 7.1% |
| California: | 7.3% |
| Here: | 22.2% |
| California: | 21.3% |
| This county: | 16.8% |
| California: | 17.9% |
6.37% of this county's 2021 resident taxpayers lived in other counties in 2020 ($134,084 average adjusted gross income)
| Here: | 6.37% |
| California average: | 5.19% |
0.01% of residents moved from foreign countries ($98 average AGI)
Contra Costa County: 0.01% California average: 0.03%
Top counties from which taxpayers relocated into this county between 2020 and 2021:
| from Alameda County, CA | |
| from San Francisco County, CA | |
| from Santa Clara County, CA |
7.09% of this county's 2020 resident taxpayers moved to other counties in 2021 ($123,334 average adjusted gross income)
| Here: | 7.09% |
| California average: | 6.14% |
0.01% of residents moved to foreign countries ($92 average AGI)
Contra Costa County: 0.01% California average: 0.02%
Top counties to which taxpayers relocated from this county between 2020 and 2021:
| to Alameda County, CA | |
| to Solano County, CA | |
| to San Francisco County, CA |
Strongest AM radio stations in Waldon:
- KTRB (860 AM; 50 kW; MODESTO, CA; Owner: PAPPAS RADIO OF CALIFORNIA, A CALIFORNIA LIMITED PARTNERSHIP)
- KIQI (1010 AM; 35 kW; SAN FRANCISCO, CA; Owner: RADIO UNICA OF SAN FRANCISCO LICENSE CORP.)
- KTCT (1050 AM; 50 kW; SAN MATEO, CA; Owner: SUSQUEHANNA RADIO CORP.)
- KFAX (1100 AM; 50 kW; SAN FRANCISCO, CA; Owner: GOLDEN GATE BROADCASTING CO, INC.)
- KNEW (910 AM; 20 kW; OAKLAND, CA; Owner: AMFM RADIO LICENSES, L.L.C.)
- KNBR (680 AM; 50 kW; SAN FRANCISCO, CA; Owner: KNBR LICO, INC.)
- KABN (1480 AM; 5 kW; CONCORD, CA; Owner: CONCORD AREA BROADCASTING CORP.)
- KGO (810 AM; 50 kW; SAN FRANCISCO, CA; Owner: KGO-AM RADIO, INC.)
- KCBS (740 AM; 50 kW; SAN FRANCISCO, CA; Owner: INFINITY BROADCASTING OPERATIONS, INC.)
- KATD (990 AM; 10 kW; PITTSBURG, CA; Owner: RADIO UNICA OF SACRAMENTO LICENSE CORP.)
- KFRC (610 AM; 5 kW; SAN FRANCISCO, CA; Owner: INFINITY BROADCASTING CORPORATION OF LOS ANGELES)
- KYCY (1550 AM; 50 kW; SAN FRANCISCO, CA; Owner: INFINITY BROADCASTING OPERATIONS, INC.)
- KDYA (1190 AM; 10 kW; VALLEJO, CA; Owner: BAYBRIDGE COMMUNICATIONS, L.L.C.)
Strongest FM radio stations in Waldon:
- KFJO (92.1 FM; WALNUT CREEK, CA; Owner: CHASE RADIO PROPERTIES, L.L.C.)
- KKSF-FM1 (103.7 FM; PLEASANTON, ETC., CA; Owner: AMFM RADIO LICENSES, L.L.C.)
- KBLX-FM2 (102.9 FM; PLEASANTON, CA; Owner: ICBC BROADCAST HOLDINGS -CA, INC.)
- KSOL-FM3 (98.9 FM; PLEASANTON, CA; Owner: TMS LICENSE CALIFORNIA, INC)
- KFRC-FM3 (99.7 FM; WALNUT CREEK, CA; Owner: INFINITY KFRC-FM, INC.)
- KZBR-FM1 (95.7 FM; WALNUT CREEK, CA; Owner: BONNEVILLE HOLDING COMPANY)
- KISQ-FM3 (98.1 FM; CONCORD, CA; Owner: AMFM RADIO LICENSES, L.L.C.)
- KDFC-FM1 (102.1 FM; LAFAYETTE, CA; Owner: BONNEVILLE HOLDING COMPANY)
- KOIT-FM2 (96.5 FM; MARTINEZ, ETC., CA; Owner: BONNEVILLE HOLDING CO. C/O KOIT(FM))
- KIOI-FM1 (101.3 FM; WALNUT CREEK, CA; Owner: AMFM RADIO LICENSES, L.L.C.)
- KMEL-FM1 (106.1 FM; CONCORD, CA; Owner: AMFM RADIO LICENSES, L.L.C.)
- KLLC (97.3 FM; SAN FRANCISCO, CA; Owner: INFINITY BROADCASTING OPERATIONS, INC.)
- K209BZ (89.7 FM; CONCORD, CA; Owner: YOUR CHRISTIAN COMPANION NETWORK, INC.)
- KALX (90.7 FM; BERKELEY, CA; Owner: UNIVERSITY OF CALIFORNIA)
- KVHS (90.5 FM; CONCORD, CA; Owner: CLAYTON VALLEY HIGH SCHOOL)
- KSFB-FM (100.7 FM; SAN RAFAEL, CA; Owner: GOLDEN GATE BROADCASTING COMPANY, INC.)
- KZBR-FM2 (95.7 FM; LIVERMORE, ETC., CA; Owner: BONNEVILLE HOLDING COMPANY)
- KOIT-FM (96.5 FM; SAN FRANCISCO, CA; Owner: BONNEVILLE HOLDING COMPANY)
- KKSF (103.7 FM; SAN FRANCISCO, CA; Owner: AMFM RADIO LICENSES, L.L.C.)
- KFOG (104.5 FM; SAN FRANCISCO, CA; Owner: KFFG LICO, INC)
TV broadcast stations around Waldon:
- KTNC-TV (Channel 42; CONCORD, CA; Owner: KTNC LICENSE, LLC)
- KQED (Channel 9; SAN FRANCISCO, CA; Owner: KQED, INC.)
- KGO-TV (Channel 7; SAN FRANCISCO, CA; Owner: KGO TELEVISION, INC.)
- KPIX-TV (Channel 5; SAN FRANCISCO, CA; Owner: CBS BROADCASTING INC.)
- KOVR (Channel 13; STOCKTON, CA; Owner: SCI - SACRAMENTO LICENSEE, LLC)
- KXTV (Channel 10; SACRAMENTO, CA; Owner: KXTV, INC.)
- KSPX (Channel 29; SACRAMENTO, CA; Owner: PAXSON SACRAMENTO LICENSE, INC.)
- KCRA-TV (Channel 3; SACRAMENTO, CA; Owner: KCRA HEARST-ARGYLE TELEVISION, INC.)
- KTXL (Channel 40; SACRAMENTO, CA; Owner: CHANNEL 40, INC.)
- KTVU (Channel 2; OAKLAND, CA; Owner: KTVU PARTNERSHIP)
- KUVS (Channel 19; MODESTO, CA; Owner: KUVS LICENSE PARTNERSHIP, G.P.)
- KQCA (Channel 58; STOCKTON, CA; Owner: KCRA HEARST-ARGYLE TELEVISION, INC.)
- KVIE (Channel 6; SACRAMENTO, CA; Owner: KVIE, INC.)
- KMAX-TV (Channel 31; SACRAMENTO, CA; Owner: UPN STATIONS GROUP INC.)
- KRON-TV (Channel 4; SAN FRANCISCO, CA; Owner: YOUNG BROADCASTING OF SAN FRANCISCO, INC.)
- KFTL (Channel 64; STOCKTON, CA; Owner: FAMILY STATIONS, INC.)
- KMTP-TV (Channel 32; SAN FRANCISCO, CA; Owner: MINORITY TELEVISION PROJECT)
- KBHK-TV (Channel 44; SAN FRANCISCO, CA; Owner: VIACOM TELEVISION STATIONS GROUP OF SAN FRANCISCO INC.)
- KBWB (Channel 20; SAN FRANCISCO, CA; Owner: KBWB LICENSE, INC.)
- KFSF (Channel 66; VALLEJO, CA; Owner: TELEFUTURA SAN FRANCISCO LLC)
- KCNS (Channel 38; SAN FRANCISCO, CA; Owner: WRAY, INC.)
- KCSM-TV (Channel 60; SAN MATEO, CA; Owner: SAN MATEO COUNTY COMMUNITY COLLEGE DISTRICT)
- KBIT-CA (Channel 28; SAN FRANCISCO, ETC., CA; Owner: POLAR BROADCASTING, INC.)
- KICU-TV (Channel 36; SAN JOSE, CA; Owner: KTVU PARTNERSHIP)
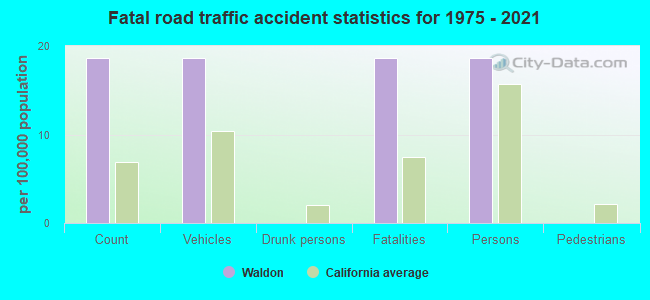
Waldon fatal accident list:
- National Bridge Inventory (NBI) Statistics
- 1Number of bridges
- 49,100Total average daily traffic
- 2,455Total average daily truck traffic
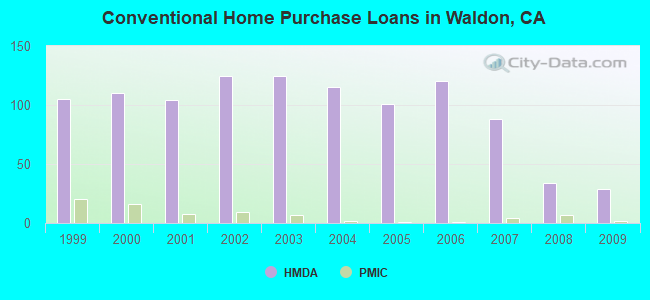
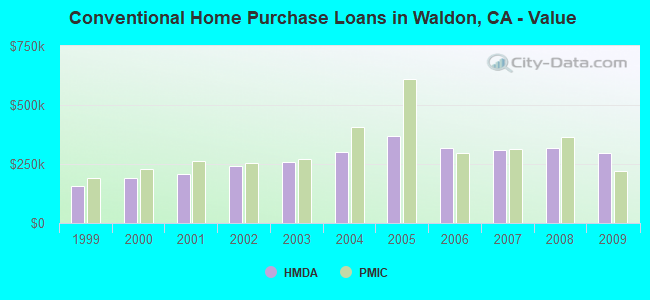
| Home Mortgage Disclosure Act Aggregated Statistics For Year 2009 (Based on 2 partial tracts) | ||||||||||
| A) FHA, FSA/RHS & VA Home Purchase Loans | B) Conventional Home Purchase Loans | C) Refinancings | D) Home Improvement Loans | F) Non-occupant Loans on < 5 Family Dwellings (A B C & D) | ||||||
|---|---|---|---|---|---|---|---|---|---|---|
| Number | Average Value | Number | Average Value | Number | Average Value | Number | Average Value | Number | Average Value | |
| LOANS ORIGINATED | 13 | $322,380 | 29 | $295,371 | 119 | $291,201 | 5 | $215,546 | 14 | $243,465 |
| APPLICATIONS APPROVED, NOT ACCEPTED | 1 | $457,790 | 4 | $290,342 | 15 | $335,454 | 1 | $118,780 | 2 | $213,585 |
| APPLICATIONS DENIED | 1 | $471,010 | 3 | $263,353 | 31 | $337,884 | 2 | $125,905 | 3 | $215,743 |
| APPLICATIONS WITHDRAWN | 1 | $260,220 | 6 | $283,978 | 19 | $310,132 | 1 | $134,390 | 4 | $232,952 |
| FILES CLOSED FOR INCOMPLETENESS | 0 | $0 | 1 | $276,760 | 7 | $285,114 | 1 | $60,700 | 2 | $215,740 |
Detailed HMDA statistics for the following Tracts: 3240.00 , 3382.02
| Private Mortgage Insurance Companies Aggregated Statistics For Year 2009 (Based on 2 partial tracts) | ||||
| A) Conventional Home Purchase Loans | B) Refinancings | |||
|---|---|---|---|---|
| Number | Average Value | Number | Average Value | |
| LOANS ORIGINATED | 2 | $219,770 | 0 | $0 |
| APPLICATIONS APPROVED, NOT ACCEPTED | 1 | $119,070 | 1 | $330,400 |
| APPLICATIONS DENIED | 1 | $262,090 | 1 | $496,660 |
| APPLICATIONS WITHDRAWN | 0 | $0 | 0 | $0 |
| FILES CLOSED FOR INCOMPLETENESS | 0 | $0 | 0 | $0 |
Detailed PMIC statistics for the following Tracts: 3240.00 , 3382.02
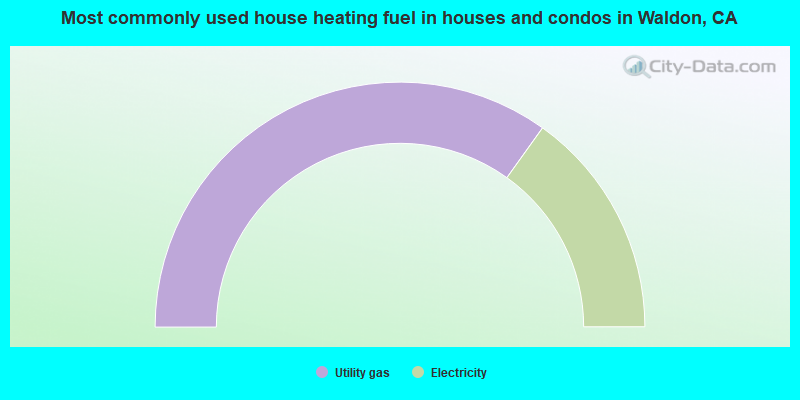
- 69.8%Utility gas
- 30.2%Electricity
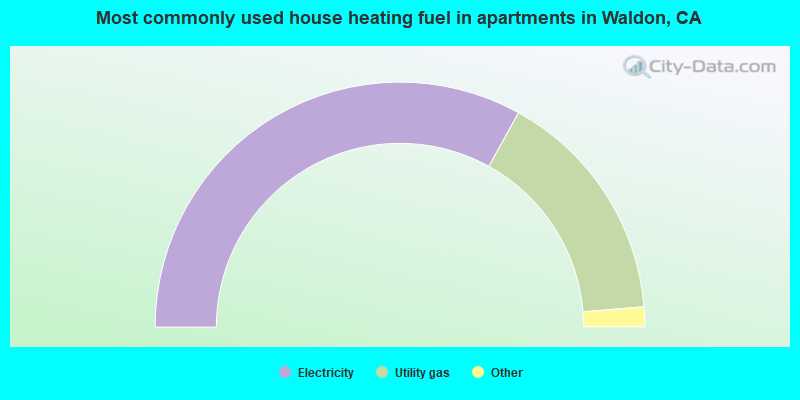
- 66.1%Electricity
- 31.3%Utility gas
- 1.3%No fuel used
- 0.4%Bottled, tank, or LP gas
- 0.4%Solar energy
- 0.4%Other fuel
Waldon compared to California state average:
- Unemployed percentage significantly below state average.
- Hispanic race population percentage significantly below state average.
- Renting percentage above state average.
- Length of stay since moving in significantly above state average.
- Number of rooms per house significantly below state average.
- House age significantly below state average.
- Percentage of population with a bachelor's degree or higher above state average.
Waldon on our top lists:
- #1 on the list of "Top 101 cities with largest percentage of females in occupations: advertising, marketing, promotions, public relations, and sales managers (population 5,000+)"
- #1 on the list of "Top 101 cities with largest percentage of males in occupations: computer specialists (population 5,000+)"
- #1 on the list of "Top 101 cities with largest percentage of females in occupations: legal support workers (population 5,000+)"
- #2 on the list of "Top 101 cities with largest percentage of males in occupations: mathematical science occupations (population 5,000+)"
- #2 on the list of "Top 101 cities with largest percentage of males in industries: data processing, libraries, and other information services (population 5,000+)"
- #2 on the list of "Top 101 cities with largest percentage of males in occupations: operations specialties managers except financial managers (population 5,000+)"
- #2 on the list of "Top 101 cities with largest percentage of males in occupations: legal support workers (population 5,000+)"
- #6 on the list of "Top 101 cities with the most people taking subway or elevated to work (population 5,000+)"
- #10 on the list of "Top 101 cities with largest percentage of males in industries: electronic shopping and mail-order houses (population 5,000+)"
- #13 on the list of "Top 101 cities with largest percentage of males in industries: drugs, sundries, and chemical and allied products merchant wholesalers (population 5,000+)"
- #15 on the list of "Top 101 cities with largest percentage of females in industries: data processing, libraries, and other information services (population 5,000+)"
- #16 on the list of "Top 101 cities with largest percentage of males in industries: broadcasting and telecommunications (population 5,000+)"
- #17 on the list of "Top 101 cities with largest percentage of females in industries: petroleum and coal products (population 5,000+)"
- #18 on the list of "Top 101 cities with largest percentage of females in industries: broadcasting and telecommunications (population 5,000+)"
- #26 on the list of "Top 101 cities with largest percentage of males in industries: water transportation (population 5,000+)"
- #29 on the list of "Top 101 cities with largest percentage of females in industries: beverage and tobacco products (population 5,000+)"
- #54 on the list of "Top 101 cities with largest percentage of females in industries: pharmacies and drug stores (population 5,000+)"
- #58 on the list of "Top 101 cities with the most residents born in Other Central America (population 500+)"
- #60 on the list of "Top 101 cities with largest percentage of females in industries: furniture and home furnishing merchant wholesalers (population 5,000+)"
- #70 on the list of "Top 100 cities with highest percentage of renters (pop. 5,000+)"
- #26 (94596) on the list of "Top 101 zip codes with the most finance and insurance companies in 2005"
- #42 (94596) on the list of "Top 101 zip codes with the largest charity contributions deductions as a percentage of AGI in 2012 (pop 5,000+)"
- #81 (94596) on the list of "Top 101 zip codes with the most offices of lawyers in 2005"
- #10 on the list of "Top 101 counties with the largest increase in the number of infant deaths per 1000 residents 2000-2006 to 2007-2013 (pop. 50,000+)"
- #15 on the list of "Top 101 counties with the lowest Sulfur Oxides Annual air pollution readings in 2012 (µg/m3)"
- #17 on the list of "Top 101 counties with the highest Nitrogen Dioxide air pollution readings in 2012 (ppm)"
- #31 on the list of "Top 101 counties with the highest percentage of residents that drank alcohol in the past 30 days"
- #34 on the list of "Top 101 counties with the highest surface withdrawal of fresh water for public supply (pop. 50,000+)"