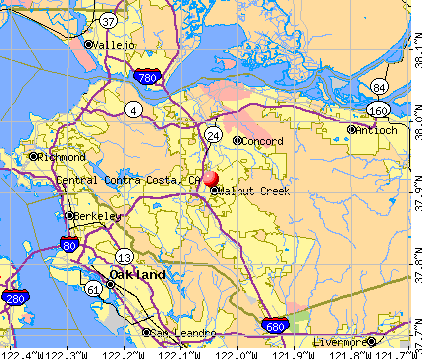
Central Contra Costa, California
Submit your own pictures of this place and show them to the world
- OSM Map
- General Map
- Google Map
- MSN Map
| Males: 236,820 | |
| Females: 250,063 |
| Median resident age: | 39.1 years |
| California median age: | 33.3 years |
Zip code: 94598
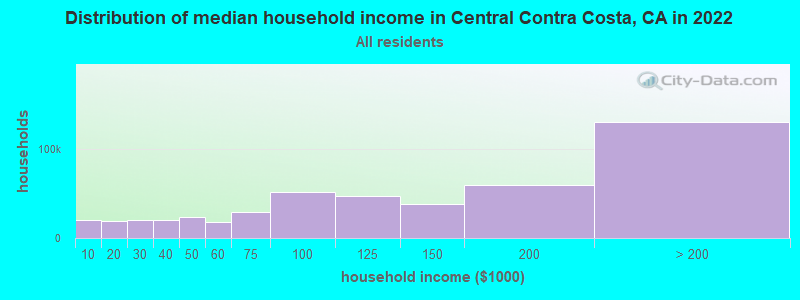
| Central Contra Costa: | $137,757 |
| CA: | $91,551 |
Estimated per capita income in 2022: $74,878 (it was $38,324 in 2000)
Central Contra Costa CCD income, earnings, and wages data
Estimated median house or condo value in 2022: over $1,000,000 (it was $344,300 in 2000)
| Central Contra Costa: | over $1,000,000 |
| CA: | $715,900 |
Mean prices in 2022: all housing units: over $1,000,000; detached houses: over $1,000,000; townhouses or other attached units: $865,348; in 2-unit structures: $602,949; in 3-to-4-unit structures: $772,223; in 5-or-more-unit structures: $695,046; mobile homes: $193,193; occupied boats, rvs, vans, etc.: $261,954
Central Contra Costa, CA residents, houses, and apartments details
Detailed information about poverty and poor residents in Central Contra Costa, CA
Compare current foreclosures near Central Contra Costa, CA:


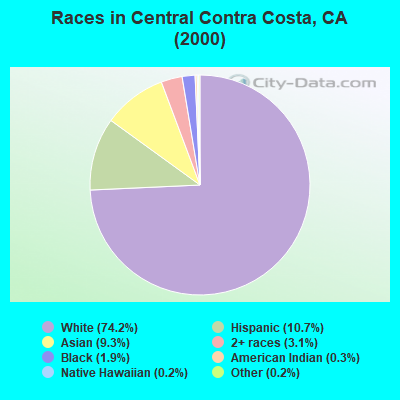
- 340,93274.2%White alone
- 49,08710.7%Hispanic
- 42,7649.3%Asian alone
- 14,3453.1%Two or more races
- 8,5051.9%Black alone
- 1,4690.3%American Indian alone
- 1,0790.2%Native Hawaiian and Other
Pacific Islander alone - 1,0710.2%Other race alone
 Recent articles from our blog. Our writers, many of them Ph.D. graduates or candidates, create easy-to-read articles on a wide variety of topics.
Current Local Time: PST time zone
Land area: 261.3 square miles.
Population density: 1,863 people per square mile (low).

| Central Contra Costa CCD: | 0.7% ($2,473) |
| California: | 0.8% ($1,564) |
Nearest city with pop. 1,000,000+: Los Angeles, CA  (335.3 miles , pop. 3,694,820).
Nearest cities:
), ), ), ), ), )Latitude: 37.92 N, Longitude: 122.05 W
Area code commonly used in this area: 925

| Here: | 4.5% |
| California: | 5.1% |
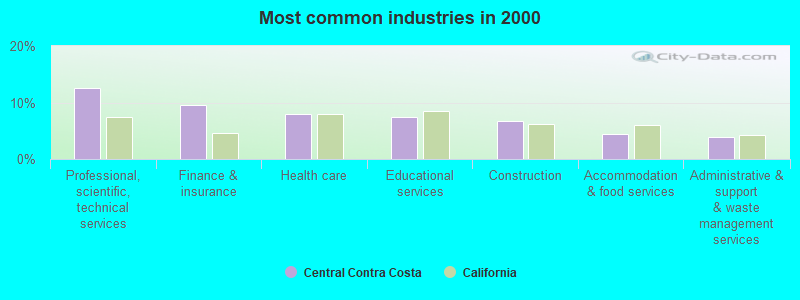
- Professional, scientific, technical services (12.6%)
- Finance & insurance (9.6%)
- Health care (8.0%)
- Educational services (7.5%)
- Construction (6.7%)
- Accommodation & food services (4.5%)
- Administrative & support & waste management services (3.8%)
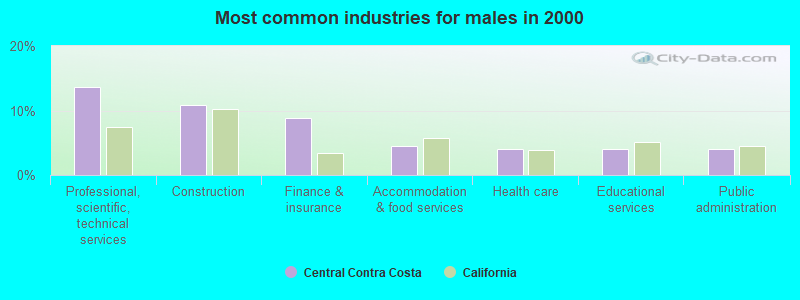
- Professional, scientific, technical services (13.6%)
- Construction (10.8%)
- Finance & insurance (8.8%)
- Accommodation & food services (4.4%)
- Health care (4.1%)
- Educational services (4.0%)
- Public administration (4.0%)
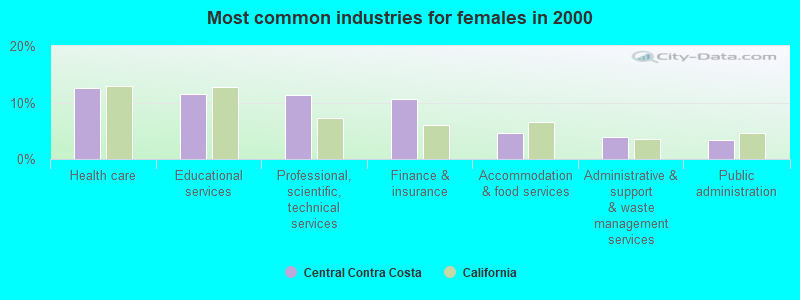
- Health care (12.6%)
- Educational services (11.5%)
- Professional, scientific, technical services (11.4%)
- Finance & insurance (10.5%)
- Accommodation & food services (4.5%)
- Administrative & support & waste management services (3.9%)
- Public administration (3.4%)
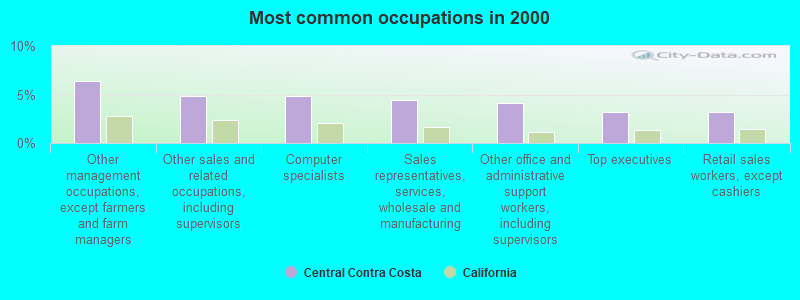
- Other management occupations, except farmers and farm managers (6.4%)
- Other sales and related occupations, including supervisors (4.9%)
- Computer specialists (4.8%)
- Sales representatives, services, wholesale and manufacturing (4.4%)
- Other office and administrative support workers, including supervisors (4.1%)
- Top executives (3.2%)
- Retail sales workers, except cashiers (3.2%)
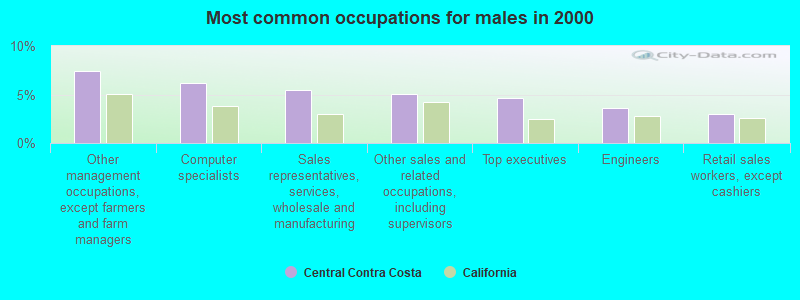
- Other management occupations, except farmers and farm managers (7.4%)
- Computer specialists (6.2%)
- Sales representatives, services, wholesale and manufacturing (5.4%)
- Other sales and related occupations, including supervisors (5.1%)
- Top executives (4.6%)
- Engineers (3.6%)
- Retail sales workers, except cashiers (3.0%)
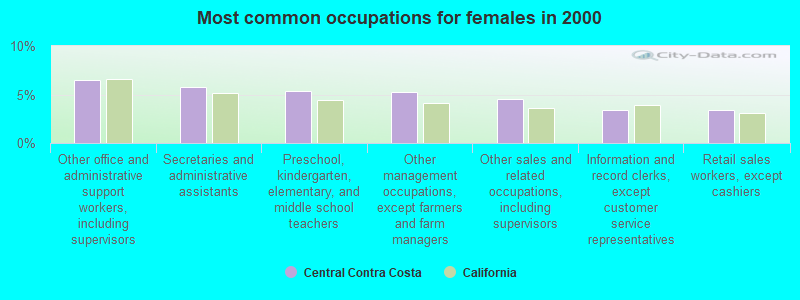
- Other office and administrative support workers, including supervisors (6.5%)
- Secretaries and administrative assistants (5.8%)
- Preschool, kindergarten, elementary, and middle school teachers (5.4%)
- Other management occupations, except farmers and farm managers (5.3%)
- Other sales and related occupations, including supervisors (4.6%)
- Information and record clerks, except customer service representatives (3.4%)
- Retail sales workers, except cashiers (3.4%)
Average climate in Central Contra Costa, California
Based on data reported by over 4,000 weather stations


(lower is better)
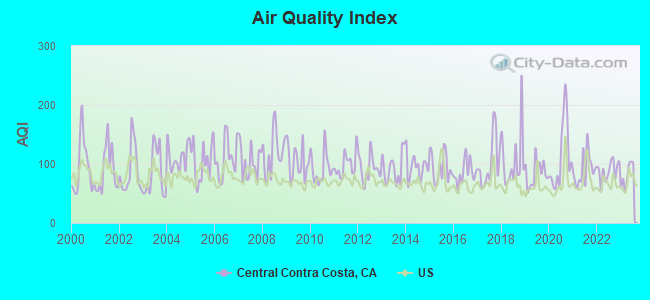
Air Quality Index (AQI) level in 2023 was 81.2. This is about average.
| City: | 81.2 |
| U.S.: | 72.6 |
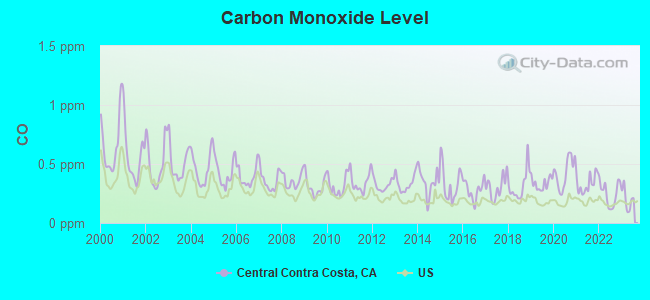
Carbon Monoxide (CO) [ppm] level in 2023 was 0.202. This is better than average. Closest monitor was 1.7 miles away from the city center.
| City: | 0.202 |
| U.S.: | 0.251 |
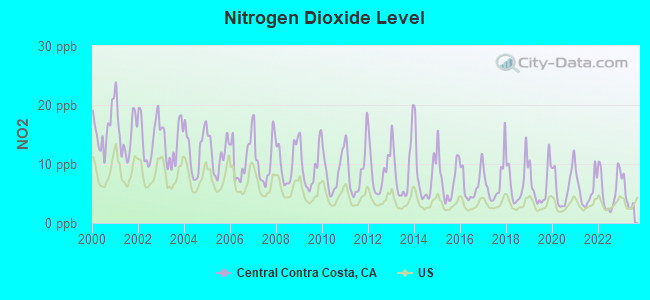
Nitrogen Dioxide (NO2) [ppb] level in 2023 was 4.61. This is about average. Closest monitor was 1.7 miles away from the city center.
| City: | 4.61 |
| U.S.: | 5.11 |
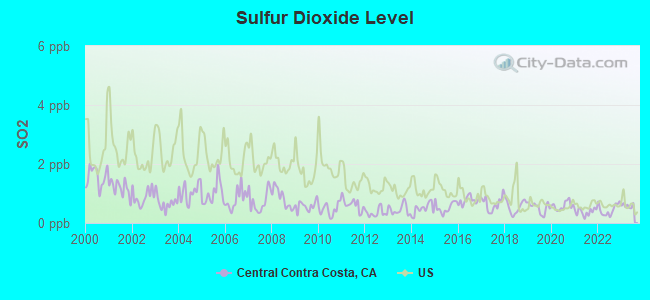
Sulfur Dioxide (SO2) [ppb] level in 2023 was 0.586. This is significantly better than average. Closest monitor was 1.7 miles away from the city center.
| City: | 0.586 |
| U.S.: | 1.515 |
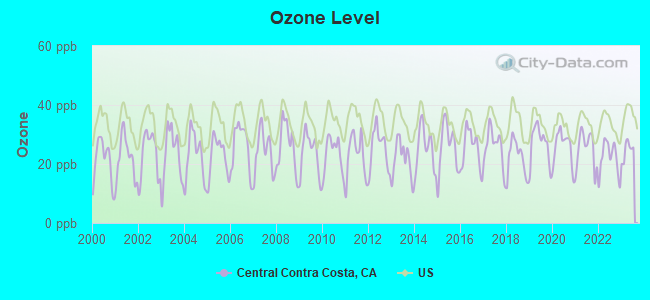
Ozone [ppb] level in 2023 was 24.6. This is better than average. Closest monitor was 1.7 miles away from the city center.
| City: | 24.6 |
| U.S.: | 33.3 |
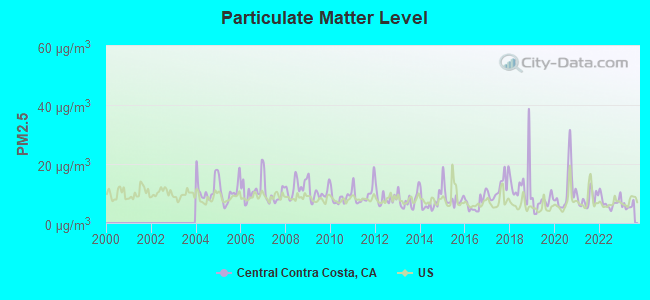
Particulate Matter (PM2.5) [µg/m3] level in 2023 was 5.80. This is better than average. Closest monitor was 1.7 miles away from the city center.
| City: | 5.80 |
| U.S.: | 8.11 |
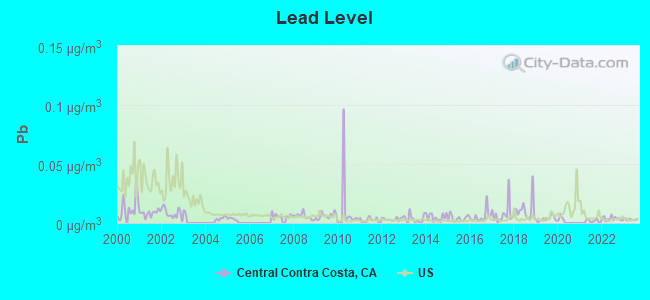
Lead (Pb) [µg/m3] level in 2023 was 0.00290. This is significantly better than average. Closest monitor was 1.7 miles away from the city center.
| City: | 0.00290 |
| U.S.: | 0.00931 |
Earthquake activity:
Central Contra Costa-area historical earthquake activity is significantly above California state average. It is 7686% greater than the overall U.S. average.On 4/18/1906 at 13:12:21, a magnitude 7.9 (7.9 UK, Class: Major, Intensity: VIII - XII) earthquake occurred 52.3 miles away from Central Contra Costa center, causing $524,000,000 total damage
On 10/18/1989 at 00:04:15, a magnitude 7.1 (6.5 MB, 7.1 MS, 6.9 MW, 7.0 ML) earthquake occurred 57.9 miles away from the city center, causing 62 deaths (62 shaking deaths) and 3757 injuries, causing $1,305,032,704 total damage
On 11/4/1927 at 13:51:53, a magnitude 7.5 (7.5 UK) earthquake occurred 215.3 miles away from the city center
On 7/21/1952 at 11:52:14, a magnitude 7.7 (7.7 UK) earthquake occurred 263.6 miles away from the city center, causing $50,000,000 total damage
On 1/31/1922 at 13:17:28, a magnitude 7.6 (7.6 UK) earthquake occurred 268.7 miles away from the city center
On 4/25/1992 at 18:06:04, a magnitude 7.2 (6.3 MB, 7.1 MS, 7.2 MW, 7.1 MW, Depth: 9.4 mi) earthquake occurred 200.1 miles away from the city center, causing $75,000,000 total damage
Magnitude types: body-wave magnitude (MB), local magnitude (ML), surface-wave magnitude (MS), moment magnitude (MW)
Natural disasters:
The number of natural disasters in Contra Costa County (18) is near the US average (15).Major Disasters (Presidential) Declared: 11
Emergencies Declared: 3
Causes of natural disasters: Floods: 13, Storms: 7, Winter Storms: 7, Mudslides: 5, Landslides: 4, Drought: 1, Earthquake: 1, Hurricane: 1, Tornado: 1, Wind: 1, Other: 1 (Note: some incidents may be assigned to more than one category).
Hospitals and medical centers near Central Contra Costa:
- JOHN MUIR MEDICAL CENTER - WALNUT CREEK CAMPUS Acute Care Hospitals (about 1 miles away; WALNUT CREEK, CA)
- KINDRED NURSING AND REHABILTATION - YGNACIO VALLEY (Nursing Home, about 1 miles away; WALNUT CREEK, CA)
- TAMPICO TERRACE CARE CENTER (Nursing Home, about 1 miles away; WALNUT CREEK, CA)
- SIERRA SURGI-CENTER (Hospital, about 1 miles away; WALNUT CREEK, CA)
- JOHN MUIR MEDICAL CENTER D/P SNF (Nursing Home, about 1 miles away; WALNUT CREEK, CA)
- FMC DIABLO WALNUT CREEK (Dialysis Facility, about 2 miles away; WALNUT CREEK, CA)
- VITAS HEALTHCARE CORPORATION OF CALIFORNIA (Hospital, about 2 miles away; WALNUT CREEK, CA)
Amtrak stations near Central Contra Costa:
- 9 miles: MARTINEZ (401 FERRY ST.) . Services: ticket office, fully wheelchair accessible, enclosed waiting area, public restrooms, public payphones, full-service food facilities, free short-term parking, free long-term parking, call for taxi service, public transit connection.
- 15 miles: BERKELEY (3RD ST. & UNIVERSITY AVE.) . Services: partially wheelchair accessible, public payphones, free short-term parking, free long-term parking, call for taxi service, public transit connection.
- 15 miles: EMERYVILLE (5885 LANDREGAN ST.) . Services: ticket office, fully wheelchair accessible, enclosed waiting area, public restrooms, public payphones, snack bar, free short-term parking, free long-term parking, call for taxi service, public transit connection.
Colleges/universities with over 2000 students nearest to Central Contra Costa:
- Diablo Valley College (about 4 miles; Pleasant Hill, CA; Full-time enrollment: 13,015)
- Saint Mary's College of California (about 7 miles; Moraga, CA; FT enrollment: 4,200)
- Merritt College (about 12 miles; Oakland, CA; FT enrollment: 2,842)
- Los Medanos College (about 12 miles; Pittsburg, CA; FT enrollment: 5,289)
- University of California-Berkeley (about 13 miles; Berkeley, CA; FT enrollment: 37,127)
- Berkeley City College (about 13 miles; Berkeley, CA; FT enrollment: 3,146)
- Laney College (about 15 miles; Oakland, CA; FT enrollment: 5,668)
Points of interest:
Notable locations in Central Contra Costa: Buckeye Camp (A), San Ramon Veteran Civilian Conservation Corps Camp (B), Concord Yard (C), Diablo Creek Golf Course (D), Contra Costa Golf Club (E), Toyon Camp (F), San Ramon Siding (G), San Damiano Retreat (H), Solano 2 Drive-In (I), Pioneer Camp (J), Muir Camp (K), Live Oak Camp (L), Laurel Dell Camp (M), Juniper Camp (N), Walnut Creek BART Station (O), Canyon Lakes Golf Course (P), Crow Canyon Country Club (Q), Diablo Country Club (R), San Ramon National Golf Club (S), Junction Camp (T). Display/hide their locations on the map
Shopping Centers: Green Valley Shopping Center (1), Alcosta Mall Shopping Center (2), Crow Canyon Commons Shopping Center (3), Danville Town and Country Shopping Center (4), Diablo Plaza Shopping Center (5), San Ramon Village Shopping Center (6), Sycamore Square Shopping Center (7), The Livery Shopping Center (8), The Marketplace Shopping Center (9). Display/hide their locations on the map
Churches in Central Contra Costa include: Saint Marks Lutheran Church (A), Christ the King Roman Catholic Church (B), Saint Catherine of Siena Roman Catholic Church (C), First Congregational Church (D), First Church of Christ Scientist (E), First Baptist Church (F), Church of Christ (G), Christ Lutheran Church (H), First Presbyterian Church of Concord (I). Display/hide their locations on the map
Cemeteries: Queen of Heaven Cemetery (1), Alhambra Cemetery (2), Oakmont Memorial Park (3), Live Oak Cemetery (4), Lafayette Cemetery (5), Memory Gardens Cemetery (6), Queen of Haven Cemetery (7). Display/hide their locations on the map
Lakes and reservoirs: Chase Pond (A), Hidden Pond (B), Frog Pond (C), Fay Hill Reservoir (D), Moraga Reservoir (E), Lafayette Reservoir (F), Leland Reservoir (G), Mallard Reservoir (H). Display/hide their locations on the map
Streams, rivers, and creeks: Coyote Creek (A), Deer Flat Creek (B), Donner Creek (C), Franklin Creek (D), Galindo Creek (E), Grayson Creek (F), Green Valley Creek (G), Grizzly Creek (H), Hastings Slough (I). Display/hide their locations on the map
Parks in Central Contra Costa include: Memorial Monument (1), Mitchell Creek Park (2), Mount Diablo State Park (3), Eugene O'Neil National Historic Site (4), Port Chicago Naval Magazine National Memorial (5), Viking Field (6), Chapel Green (7), Louis Guisto Baseball Field (8), Pat Vincent Memorial Field (9). Display/hide their locations on the map
| This place: | 2.5 people |
| California: | 2.9 people |
| This place: | 67.3% |
| Whole state: | 68.7% |
| This place: | 5.9% |
| Whole state: | 7.2% |
Likely homosexual households (counted as self-reported same-sex unmarried-partner households)
- Lesbian couples: 0.5% of all households
- Gay men: 0.4% of all households
| This place: | 4.5% |
| Whole state: | 14.2% |
| This place: | 2.3% |
| Whole state: | 6.3% |
People in group quarters in Central Contra Costa in 2010:
- 2,186 people in nursing facilities/skilled-nursing facilities
- 1,562 people in college/university student housing
- 589 people in local jails and other municipal confinement facilities
- 422 people in other noninstitutional facilities
- 306 people in workers' group living quarters and job corps centers
- 305 people in group homes intended for adults
- 214 people in residential treatment centers for adults
- 204 people in correctional facilities intended for juveniles
- 147 people in emergency and transitional shelters (with sleeping facilities) for people experiencing homelessness
- 84 people in group homes for juveniles (non-correctional)
- 31 people in in-patient hospice facilities
- 17 people in residential treatment centers for juveniles (non-correctional)
- 3 people in maritime/merchant vessels
People in group quarters in Central Contra Costa in 2000:
- 2,025 people in nursing homes
- 1,554 people in other noninstitutional group quarters
- 1,473 people in college dormitories (includes college quarters off campus)
- 714 people in local jails and other confinement facilities (including police lockups)
- 180 people in short-term care, detention or diagnostic centers for delinquent children
- 160 people in other group homes
- 132 people in homes for the mentally retarded
- 120 people in homes or halfway houses for drug/alcohol abuse
- 83 people in religious group quarters
- 72 people in hospitals/wards and hospices for chronically ill
- 72 people in other hospitals or wards for chronically ill
- 47 people in homes for the mentally ill
- 41 people in mental (psychiatric) hospitals or wards
- 28 people in homes for the physically handicapped
- 24 people in halfway houses
- 22 people in military barracks, etc.
- 20 people in other nonhousehold living situations
- 18 people in schools, hospitals, or wards for the intellectually disabled
- 17 people in residential treatment centers for emotionally disturbed children
- 16 people in unknown juvenile institutions
- 10 people in other workers' dormitories
For population 15 years and over in Central Contra Costa:
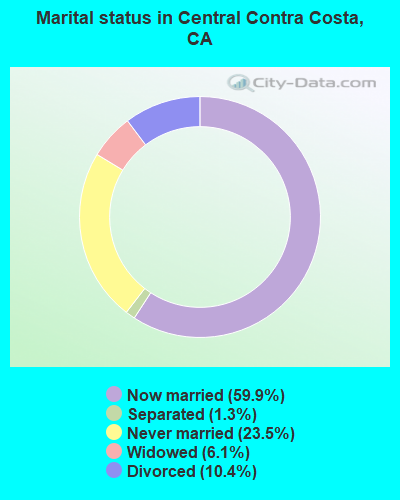
- Never married: 23.5%
- Now married: 59.9%
- Separated: 1.3%
- Widowed: 6.1%
- Divorced: 10.4%
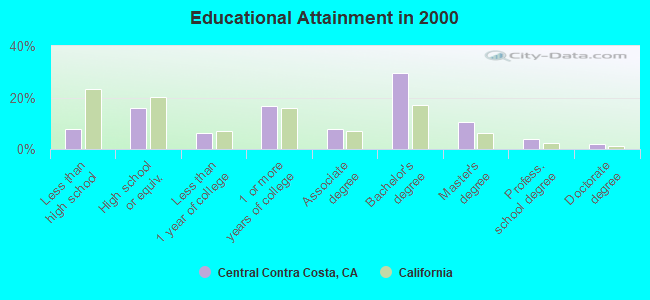
For population 25 years and over in Central Contra Costa:
- High school or higher: 92.4%
- Bachelor's degree or higher: 45.8%
- Graduate or professional degree: 16.3%
- Unemployed: 3.6%
- Mean travel time to work (commute): 29.8 minutes
| Here: | 10.6 |
| California average: | 16.1 |


Graphs represent county-level data. Detailed 2008 Election Results
Religion statistics for Central Contra Costa, CA (based on Contra Costa County data)


| Religion | Adherents | Congregations |
|---|---|---|
| Catholic | 228,400 | 34 |
| Evangelical Protestant | 81,120 | 352 |
| Other | 48,553 | 123 |
| Mainline Protestant | 32,693 | 101 |
| Black Protestant | 10,395 | 34 |
| Orthodox | 2,435 | 8 |
| None | 645,429 | - |
Food Environment Statistics:
| Here: | 1.78 / 10,000 pop. |
| California: | 2.14 / 10,000 pop. |
| Contra Costa County: | 0.05 / 10,000 pop. |
| California: | 0.04 / 10,000 pop. |
| Contra Costa County: | 0.51 / 10,000 pop. |
| California: | 0.62 / 10,000 pop. |
| Here: | 1.75 / 10,000 pop. |
| State: | 1.49 / 10,000 pop. |
| Here: | 6.73 / 10,000 pop. |
| California: | 7.42 / 10,000 pop. |
| Contra Costa County: | 7.1% |
| California: | 7.3% |
| Contra Costa County: | 22.2% |
| California: | 21.3% |
| Here: | 16.8% |
| State: | 17.9% |
6.37% of this county's 2021 resident taxpayers lived in other counties in 2020 ($134,084 average adjusted gross income)
| Here: | 6.37% |
| California average: | 5.19% |
0.01% of residents moved from foreign countries ($98 average AGI)
Contra Costa County: 0.01% California average: 0.03%
Top counties from which taxpayers relocated into this county between 2020 and 2021:
| from Alameda County, CA | |
| from San Francisco County, CA | |
| from Santa Clara County, CA |
7.09% of this county's 2020 resident taxpayers moved to other counties in 2021 ($123,334 average adjusted gross income)
| Here: | 7.09% |
| California average: | 6.14% |
0.01% of residents moved to foreign countries ($92 average AGI)
Contra Costa County: 0.01% California average: 0.02%
Top counties to which taxpayers relocated from this county between 2020 and 2021:
| to Alameda County, CA | |
| to Solano County, CA | |
| to San Francisco County, CA |
Strongest AM radio stations in Central Contra Costa:
- KTRB (860 AM; 50 kW; MODESTO, CA; Owner: PAPPAS RADIO OF CALIFORNIA, A CALIFORNIA LIMITED PARTNERSHIP)
- KIQI (1010 AM; 35 kW; SAN FRANCISCO, CA; Owner: RADIO UNICA OF SAN FRANCISCO LICENSE CORP.)
- KTCT (1050 AM; 50 kW; SAN MATEO, CA; Owner: SUSQUEHANNA RADIO CORP.)
- KFAX (1100 AM; 50 kW; SAN FRANCISCO, CA; Owner: GOLDEN GATE BROADCASTING CO, INC.)
- KNEW (910 AM; 20 kW; OAKLAND, CA; Owner: AMFM RADIO LICENSES, L.L.C.)
- KNBR (680 AM; 50 kW; SAN FRANCISCO, CA; Owner: KNBR LICO, INC.)
- KGO (810 AM; 50 kW; SAN FRANCISCO, CA; Owner: KGO-AM RADIO, INC.)
- KCBS (740 AM; 50 kW; SAN FRANCISCO, CA; Owner: INFINITY BROADCASTING OPERATIONS, INC.)
- KABN (1480 AM; 5 kW; CONCORD, CA; Owner: CONCORD AREA BROADCASTING CORP.)
- KATD (990 AM; 10 kW; PITTSBURG, CA; Owner: RADIO UNICA OF SACRAMENTO LICENSE CORP.)
- KYCY (1550 AM; 50 kW; SAN FRANCISCO, CA; Owner: INFINITY BROADCASTING OPERATIONS, INC.)
- KFRC (610 AM; 5 kW; SAN FRANCISCO, CA; Owner: INFINITY BROADCASTING CORPORATION OF LOS ANGELES)
- KDYA (1190 AM; 10 kW; VALLEJO, CA; Owner: BAYBRIDGE COMMUNICATIONS, L.L.C.)
Strongest FM radio stations in Central Contra Costa:
- KFJO (92.1 FM; WALNUT CREEK, CA; Owner: CHASE RADIO PROPERTIES, L.L.C.)
- KKSF-FM1 (103.7 FM; PLEASANTON, ETC., CA; Owner: AMFM RADIO LICENSES, L.L.C.)
- KBLX-FM2 (102.9 FM; PLEASANTON, CA; Owner: ICBC BROADCAST HOLDINGS -CA, INC.)
- KSOL-FM3 (98.9 FM; PLEASANTON, CA; Owner: TMS LICENSE CALIFORNIA, INC)
- KFRC-FM3 (99.7 FM; WALNUT CREEK, CA; Owner: INFINITY KFRC-FM, INC.)
- KZBR-FM1 (95.7 FM; WALNUT CREEK, CA; Owner: BONNEVILLE HOLDING COMPANY)
- KISQ-FM3 (98.1 FM; CONCORD, CA; Owner: AMFM RADIO LICENSES, L.L.C.)
- KMEL-FM1 (106.1 FM; CONCORD, CA; Owner: AMFM RADIO LICENSES, L.L.C.)
- KDFC-FM1 (102.1 FM; LAFAYETTE, CA; Owner: BONNEVILLE HOLDING COMPANY)
- KOIT-FM2 (96.5 FM; MARTINEZ, ETC., CA; Owner: BONNEVILLE HOLDING CO. C/O KOIT(FM))
- KIOI-FM1 (101.3 FM; WALNUT CREEK, CA; Owner: AMFM RADIO LICENSES, L.L.C.)
- KLLC (97.3 FM; SAN FRANCISCO, CA; Owner: INFINITY BROADCASTING OPERATIONS, INC.)
- K209BZ (89.7 FM; CONCORD, CA; Owner: YOUR CHRISTIAN COMPANION NETWORK, INC.)
- KALX (90.7 FM; BERKELEY, CA; Owner: UNIVERSITY OF CALIFORNIA)
- KVHS (90.5 FM; CONCORD, CA; Owner: CLAYTON VALLEY HIGH SCHOOL)
- KZBR-FM2 (95.7 FM; LIVERMORE, ETC., CA; Owner: BONNEVILLE HOLDING COMPANY)
- KSFB-FM (100.7 FM; SAN RAFAEL, CA; Owner: GOLDEN GATE BROADCASTING COMPANY, INC.)
- KOIT-FM (96.5 FM; SAN FRANCISCO, CA; Owner: BONNEVILLE HOLDING COMPANY)
- KKSF (103.7 FM; SAN FRANCISCO, CA; Owner: AMFM RADIO LICENSES, L.L.C.)
- KFOG (104.5 FM; SAN FRANCISCO, CA; Owner: KFFG LICO, INC)
TV broadcast stations around Central Contra Costa:
- KTNC-TV (Channel 42; CONCORD, CA; Owner: KTNC LICENSE, LLC)
- KQED (Channel 9; SAN FRANCISCO, CA; Owner: KQED, INC.)
- KGO-TV (Channel 7; SAN FRANCISCO, CA; Owner: KGO TELEVISION, INC.)
- KPIX-TV (Channel 5; SAN FRANCISCO, CA; Owner: CBS BROADCASTING INC.)
- KOVR (Channel 13; STOCKTON, CA; Owner: SCI - SACRAMENTO LICENSEE, LLC)
- KXTV (Channel 10; SACRAMENTO, CA; Owner: KXTV, INC.)
- KSPX (Channel 29; SACRAMENTO, CA; Owner: PAXSON SACRAMENTO LICENSE, INC.)
- KCRA-TV (Channel 3; SACRAMENTO, CA; Owner: KCRA HEARST-ARGYLE TELEVISION, INC.)
- KUVS (Channel 19; MODESTO, CA; Owner: KUVS LICENSE PARTNERSHIP, G.P.)
- KTXL (Channel 40; SACRAMENTO, CA; Owner: CHANNEL 40, INC.)
- KTVU (Channel 2; OAKLAND, CA; Owner: KTVU PARTNERSHIP)
- KQCA (Channel 58; STOCKTON, CA; Owner: KCRA HEARST-ARGYLE TELEVISION, INC.)
- KVIE (Channel 6; SACRAMENTO, CA; Owner: KVIE, INC.)
- KMAX-TV (Channel 31; SACRAMENTO, CA; Owner: UPN STATIONS GROUP INC.)
- KFTL (Channel 64; STOCKTON, CA; Owner: FAMILY STATIONS, INC.)
- KRON-TV (Channel 4; SAN FRANCISCO, CA; Owner: YOUNG BROADCASTING OF SAN FRANCISCO, INC.)
- KMTP-TV (Channel 32; SAN FRANCISCO, CA; Owner: MINORITY TELEVISION PROJECT)
- KBHK-TV (Channel 44; SAN FRANCISCO, CA; Owner: VIACOM TELEVISION STATIONS GROUP OF SAN FRANCISCO INC.)
- KBWB (Channel 20; SAN FRANCISCO, CA; Owner: KBWB LICENSE, INC.)
- KFSF (Channel 66; VALLEJO, CA; Owner: TELEFUTURA SAN FRANCISCO LLC)
- KCNS (Channel 38; SAN FRANCISCO, CA; Owner: WRAY, INC.)
- KCSM-TV (Channel 60; SAN MATEO, CA; Owner: SAN MATEO COUNTY COMMUNITY COLLEGE DISTRICT)
- KBIT-CA (Channel 28; SAN FRANCISCO, ETC., CA; Owner: POLAR BROADCASTING, INC.)
- KICU-TV (Channel 36; SAN JOSE, CA; Owner: KTVU PARTNERSHIP)
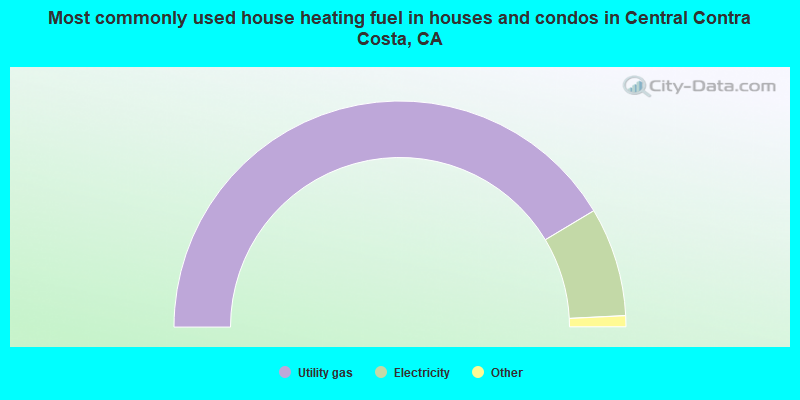
- 82.8%Utility gas
- 15.6%Electricity
- 0.8%Bottled, tank, or LP gas
- 0.6%Wood
- 0.1%Other fuel
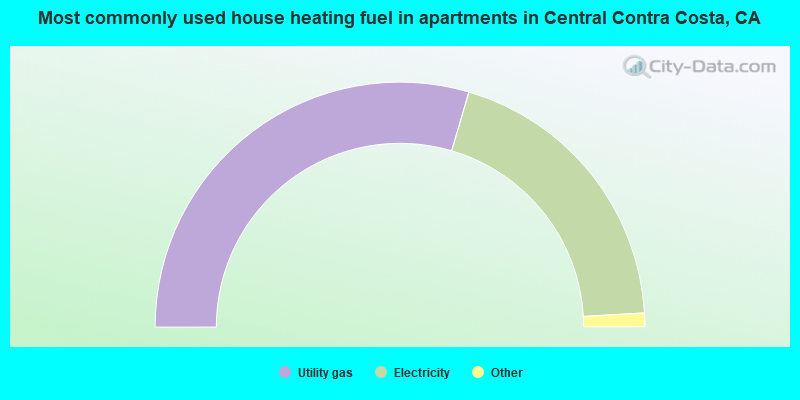
- 59.1%Utility gas
- 39.1%Electricity
- 0.8%Bottled, tank, or LP gas
- 0.5%No fuel used
- 0.3%Wood
- 0.1%Fuel oil, kerosene, etc.
Central Contra Costa compared to California state average:
- Median household income above state average.
- Unemployed percentage significantly below state average.
- Black race population percentage below state average.
- Hispanic race population percentage significantly below state average.
- Median age above state average.
- Foreign-born population percentage significantly below state average.
- Length of stay since moving in significantly above state average.
- Number of rooms per house significantly below state average.
- House age significantly below state average.
- Percentage of population with a bachelor's degree or higher above state average.
Central Contra Costa, CA compared to other similar cities:
Central Contra Costa on our top lists:
- #4 on the list of "Top 101 cities with largest percentage of males in industries: petroleum and coal products (population 50,000+)"
- #5 on the list of "Top 101 cities with largest percentage of females in industries: petroleum and coal products (population 50,000+)"
- #6 on the list of "Top 101 cities with largest percentage of males in occupations: financial managers (population 50,000+)"
- #7 on the list of "Top 101 cities with largest percentage of females in occupations: financial managers (population 50,000+)"
- #8 on the list of "Top 101 cities with largest percentage of females in occupations: computer specialists (population 50,000+)"
- #8 on the list of "Top 101 cities with largest percentage of males in industries: gasoline stations (population 50,000+)"
- #9 on the list of "Top 101 cities with largest percentage of females in industries: broadcasting and telecommunications (population 50,000+)"
- #10 on the list of "Top 101 cities with largest percentage of males in occupations: business operations specialists (population 50,000+)"
- #10 on the list of "Top 101 cities with largest percentage of males in occupations: computer specialists (population 50,000+)"
- #11 on the list of "Top 101 cities with largest percentage of males in occupations: life and physical scientists (population 50,000+)"
- #14 on the list of "Top 101 cities with largest percentage of males in industries: pharmacies and drug stores (population 50,000+)"
- #14 on the list of "Top 101 cities with largest percentage of males in industries: data processing, libraries, and other information services (population 50,000+)"
- #15 on the list of "Top 101 cities with largest percentage of males in industries: electronic shopping and mail-order houses (population 50,000+)"
- #15 on the list of "Top 101 cities with largest percentage of males in industries: radio, tv, and computer stores (population 50,000+)"
- #15 on the list of "Top 101 cities with largest percentage of males in industries: water transportation (population 50,000+)"
- #16 on the list of "Top 101 cities with largest percentage of females in industries: petroleum and petroleum products merchant wholesalers (population 50,000+)"
- #16 on the list of "Top 101 cities with largest percentage of males in industries: broadcasting and telecommunications (population 50,000+)"
- #17 on the list of "Top 101 cities with largest percentage of females in industries: pharmacies and drug stores (population 50,000+)"
- #17 on the list of "Top 101 cities with largest percentage of females in industries: fuel dealers (population 50,000+)"
- #18 on the list of "Top 101 cities with largest percentage of females in industries: music stores (population 50,000+)"
- #10 on the list of "Top 101 counties with the largest increase in the number of infant deaths per 1000 residents 2000-2006 to 2007-2013 (pop. 50,000+)"
- #15 on the list of "Top 101 counties with the lowest Sulfur Oxides Annual air pollution readings in 2012 (µg/m3)"
- #17 on the list of "Top 101 counties with the highest Nitrogen Dioxide air pollution readings in 2012 (ppm)"
- #31 on the list of "Top 101 counties with the highest percentage of residents that drank alcohol in the past 30 days"
- #34 on the list of "Top 101 counties with the highest surface withdrawal of fresh water for public supply (pop. 50,000+)"