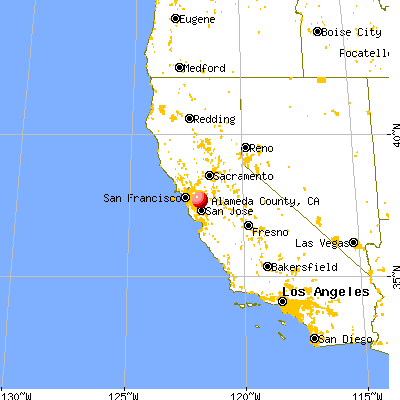
Alameda County, California (CA)
County owner-occupied free and clear houses and condos in 2010: 59,054
County owner-occupied houses and condos in 2000: 286,306
Renter-occupied apartments: 253,896 (it was 237,060 in 2000)
| % of renters here: | 45% |
| State: | 44% |
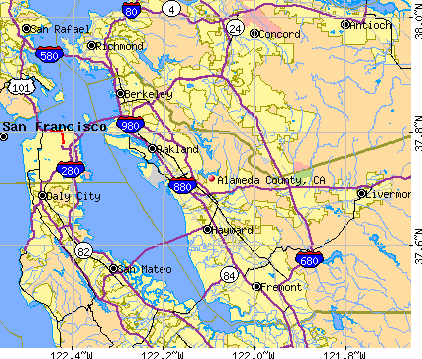
Land area: 738 sq. mi.
Water area: 83.6 sq. mi.
Population density: 2209 people per square mile (very high).
Industries providing employment: Educational, health and social services (21.5%), Professional, scientific, management, administrative, and waste management services (21.4%).
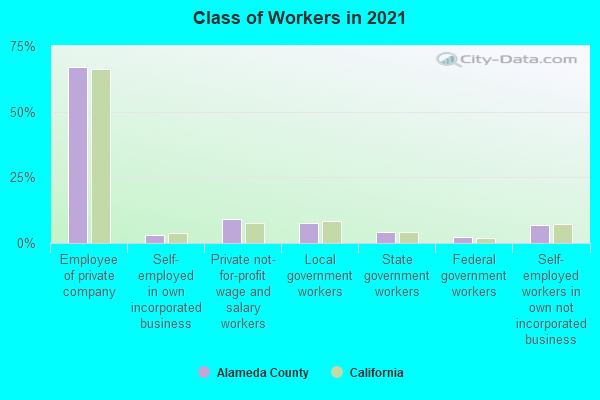
Type of workers:
- Private wage or salary: 81%
- Government: 13%
- Self-employed, not incorporated: 6%
- Unpaid family work: 0%
- OSM Map
- General Map
- Google Map
- MSN Map

- 540,27433.2%Asian alone
- 454,19527.9%White Non-Hispanic Alone
- 361,98822.2%Hispanic or Latino
- 155,6809.6%Black Non-Hispanic Alone
- 93,2205.7%Two or more races
- 10,8510.7%Some other race alone
- 10,1270.6%Native Hawaiian and Other
Pacific Islander alone - 2,6620.2%American Indian and Alaska Native alone

| Median resident age: | 39.4 years |
| California median age: | 37.9 years |
| Males: 810,070 | |
| Females: 818,927 |

 | SF/Bay Area Crime Thread (1410 replies) |
| Anyone moved to Texas and moved back to LA? (220 replies) |
| Coronavirus (12544 replies) |
| Census Update: Asian Population Surpasses Whites in 2nd California (189 replies) |
| Contra Costa County Shuts Down In'N'Out in Pleasant Hill For Repeatedly Defying Health Mandate (140 replies) |
| Growth of Afghan communities in California (81 replies) |
| Alameda County: | 2.0 people |
| California: | 3 people |
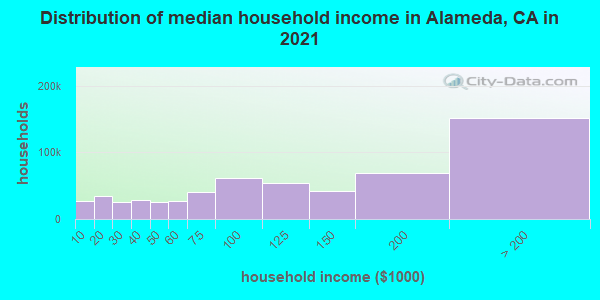
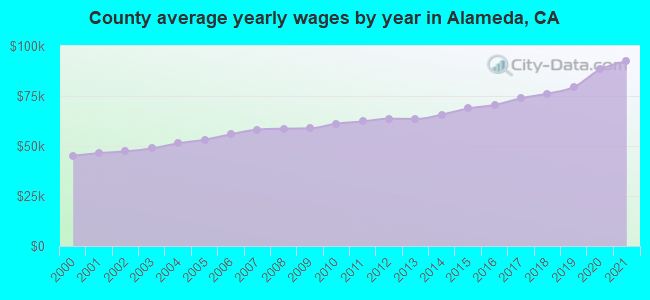
Estimated median household income in 2022: $122,159 ($55,946 in 1999)
| This county: | $122,159 |
| California: | $91,551 |
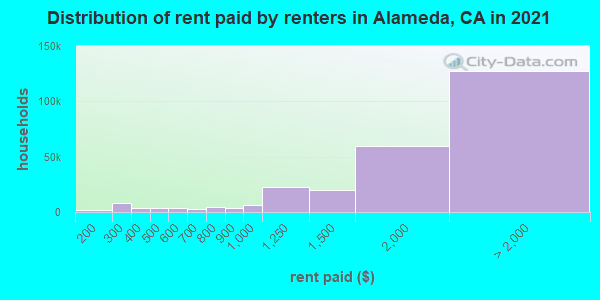
Median contract rent in 2022 for apartments: $2,046 (lower quartile is $1,438, upper quartile is $2,713)
| This county: | $2046 |
| State: | $1719 |
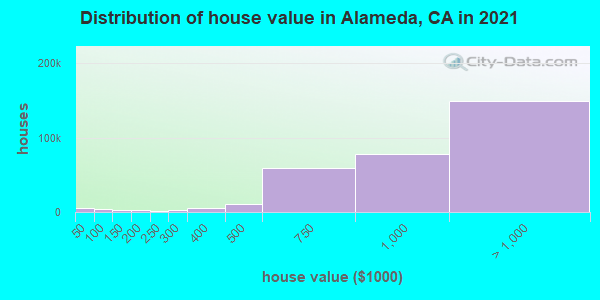
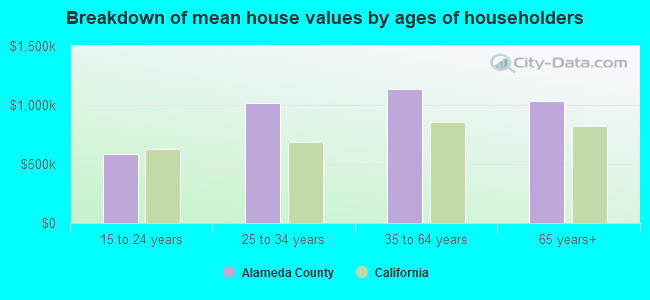
Estimated median house or condo value in 2022: $1,092,500 (it was $291,900 in 2000)
| Alameda: | $1,092,500 |
| California: | $715,900 |
Mean price in 2022:
Median monthly housing costs for homes and condos with a mortgage: $3,509Detached houses: $1,375,407
Here: $1,375,407 State: $988,808 Townhouses or other attached units: $950,531
Here: $950,531 State: $838,546 In 2-unit structures: $1,058,443
Here: $1,058,443 State: $1,138,100 In 3-to-4-unit structures: $849,164
Here: $849,164 State: $824,253 In 5-or-more-unit structures: $623,594
Here: $623,594 State: $730,996 Mobile homes: $218,878
Here: $218,878 State: $184,506 Occupied boats, RVs, vans, etc.: $538,754
Here: $538,754 State: $204,957
Median monthly housing costs for units without a mortgage: $910
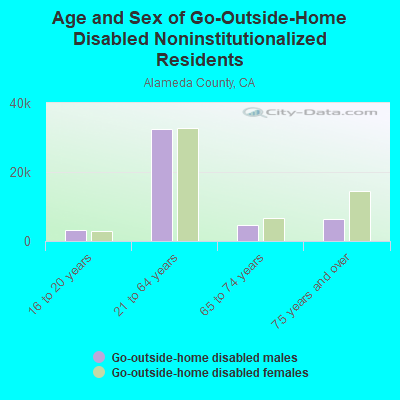
Institutionalized population: 12,910
Crime in 2020 (reported by the sheriff's office or county police, not the county total):
- Murders: 5
- Rapes: 27
- Robberies: 162
- Assaults: 506
- Burglaries: 369
- Thefts: 1165
- Auto thefts: 752
Crime in 2019 (reported by the sheriff's office or county police, not the county total):
- Murders: 5
- Rapes: 27
- Robberies: 210
- Assaults: 391
- Burglaries: 354
- Thefts: 1324
- Auto thefts: 491
Health of residents in Alameda County based on CDC Behavioral Risk Factor Surveillance System Survey Questionnaires from 2003 to 2012:
General health status score of residents in this county from 1 (poor) to 5 (excellent) is 3.7. This is better than average.82.4% of residents exercised in the past month. This is more than average.
39.2% of residents smoked 100+ cigarettes in their lives. This is less than average.
83.1% of adult residents drank alcohol in the past 30 days. This is more than average.
76.8% of residents visited a dentist within the past year. This is about average.
Average weight of males is 185 pounds. This is less than average.
Average weight of females is 154 pounds. This is less than average.
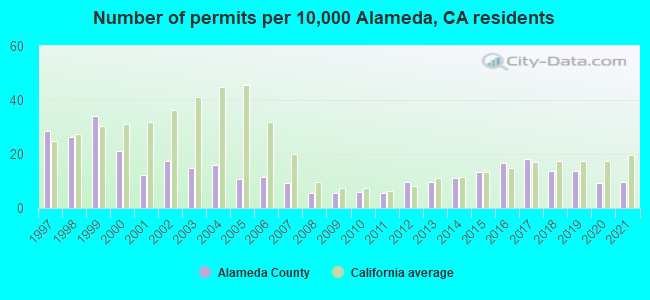
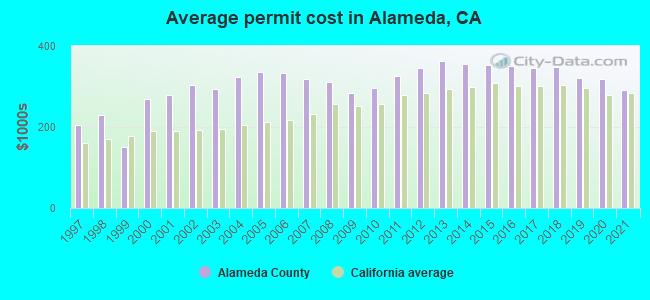
Single-family new house construction building permits:
- 2022: 1222 buildings, average cost: $280,800
- 2021: 1368 buildings, average cost: $291,500
- 2020: 1342 buildings, average cost: $318,600
- 2019: 1972 buildings, average cost: $322,200
- 2018: 1965 buildings, average cost: $347,200
- 2017: 2595 buildings, average cost: $345,600
- 2016: 2398 buildings, average cost: $349,800
- 2015: 1905 buildings, average cost: $353,500
- 2014: 1613 buildings, average cost: $356,300
- 2013: 1391 buildings, average cost: $362,400
- 2012: 1373 buildings, average cost: $346,000
- 2011: 820 buildings, average cost: $325,500
- 2010: 879 buildings, average cost: $297,200
- 2009: 811 buildings, average cost: $283,000
- 2008: 780 buildings, average cost: $311,200
- 2007: 1315 buildings, average cost: $318,800
- 2006: 1635 buildings, average cost: $332,900
- 2005: 1561 buildings, average cost: $336,200
- 2004: 2309 buildings, average cost: $324,200
- 2003: 2138 buildings, average cost: $293,300
- 2002: 2501 buildings, average cost: $302,600
- 2001: 1764 buildings, average cost: $277,800
- 2000: 3071 buildings, average cost: $269,300
- 1999: 4943 buildings, average cost: $150,300
- 1998: 3795 buildings, average cost: $228,800
- 1997: 4112 buildings, average cost: $205,500
Median real estate property taxes paid for housing units with mortgages in 2022: $9,051 (0.8%)
Median real estate property taxes paid for housing units with no mortgage in 2022: $5,544 (0.6%)
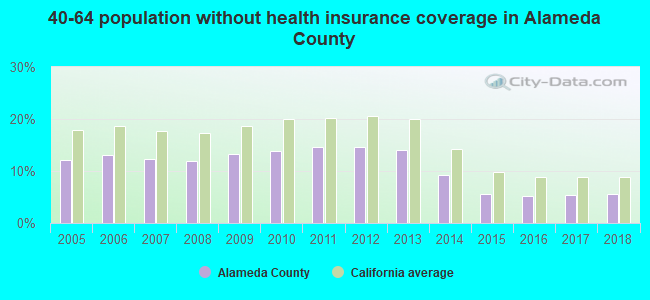
| Alameda County: | 10.1% |
| California: | 12.2% |
Median age of residents in 2022: 39.4 years old
(Males: 38.6 years old, Females: 40.3 years old)
(Median age for: White residents: 46.4 years old, Black residents: 42.0 years old, American Indian residents: 35.5 years old, Asian residents: 40.3 years old, Hispanic or Latino residents: 32.4 years old, Other race residents: 32.6 years old)
Area name: Oakland-Fremont, CA HUD Metro FMR Area
Fair market rent in 2006 for a 1-bedroom apartment in Alameda County is $1045 a month.
Fair market rent for a 2-bedroom apartment is $1238 a month.
Fair market rent for a 3-bedroom apartment is $1679 a month.
Cities in this county include: Oakland, Fremont, Hayward, Berkeley, San Leandro, Livermore, Alameda, Union City, Pleasanton, Castro Valley.
| Zip code | City | Number of tests | Number of tests >= 4 pCi/L |
|---|---|---|---|
| 94501 | Alameda | 35 | 2 |
| 94502 | Alameda | 14 | 0 |
| 94536 | Fremont | 48 | 3 |
| 94538 | Fremont | 50 | 1 |
| 94539 | Fremont | 29 | 0 |
| 94541 | Hayward | 15 | 0 |
| 94542 | Hayward | 3 | 0 |
| 94544 | Hayward | 23 | 1 |
| 94545 | Hayward | 427 | 12 |
| 94546 | Castro Valley | 28 | 1 |
| 94550 | Livermore | 36 | 3 |
| 94551 | Livermore | 5 | 0 |
| 94552 | Castro Valley | 13 | 1 |
| 94555 | Fremont | 17 | 0 |
| 94560 | Newark | 18 | 0 |
| 94566 | Pleasanton | 27 | 2 |
| 94568 | Dublin | 15 | 0 |
| 94577 | San Leandro | 17 | 1 |
| 94578 | San Leandro | 16 | 1 |
| 94579 | San Leandro | 7 | 0 |
| 94580 | San Lorenzo | 10 | 0 |
| 94582 | Pleasanton | 42 | 0 |
| 94586 | Sunol | 28 | 5 |
| 94587 | Union City | 17 | 0 |
| 94588 | Pleasanton | 23 | 0 |
| 94601 | Oakland | 32 | 0 |
| 94602 | Oakland | 23 | 0 |
| 94603 | Oakland | 19 | 0 |
| 94605 | Oakland | 29 | 0 |
| 94606 | Oakland | 13 | 0 |
| 94607 | Oakland | 3 | 0 |
| 94608 | Emeryville | 9 | 0 |
| 94609 | Oakland | 10 | 1 |
| 94610 | Oakland | 19 | 1 |
| 94611 | Oakland | 57 | 3 |
| 94612 | Oakland | 42 | 0 |
| 94618 | Oakland | 25 | 5 |
| 94619 | Oakland | 30 | 0 |
| 94621 | Oakland | 45 | 0 |
| 94650 | Oakland | 3 | 0 |
| 94702 | Berkeley | 18 | 0 |
| 94703 | Berkeley | 18 | 0 |
| 94704 | Berkeley | 34 | 0 |
| 94705 | Berkeley | 13 | 2 |
| 94706 | Albany | 19 | 1 |
| 94707 | Berkeley | 36 | 3 |
| 94708 | Berkeley | 30 | 1 |
| 94709 | Berkeley | 5 | 0 |
| 94710 | Berkeley | 6 | 0 |
2023 air pollution in Alameda County:
Carbon Monoxide: 0.322 ppm (standard limit: 9 ppm). Above U.S. average.
Nitrogen Dioxide: 0.01 ppm (standard limit: 0.053 ppm). Above U.S. average.
Ozone (1-hour): 0.027 ppm (standard limit: 0.12 ppm). Below U.S. average.
Particulate Matter (PM2.5) Annual: 5.9 µg/m3(standard limit: 15.0 µg/m3). Near U.S. average.
Sulfur Oxides Annual: 0.000 ppm (standard limit: 0.03 ppm). Near U.S. average.
Neighboring counties: Albemarle County, Virginia  , Campbell County, Virginia , Charles City County, Virginia , Cedar County, Missouri , Garrard County, Kentucky , St. Francois County, Missouri .
| Here: | 4.5% |
| California: | 5.1% |
Current college students: 126,921
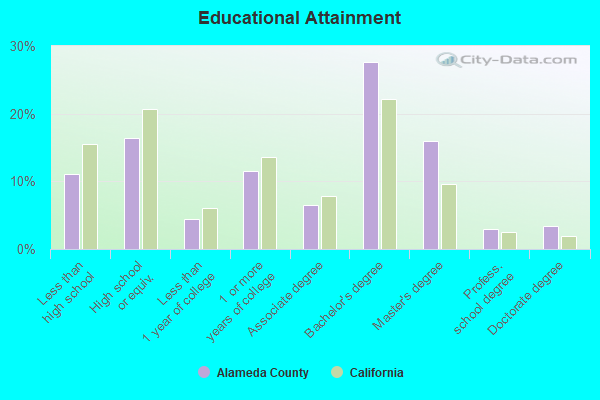
People 25 years of age or older with a high school degree or higher: 88.7%
People 25 years of age or older with a bachelor's degree or higher: 53.5%
Number of foreign born residents: 559,682 (55.5% naturalized citizens)
| Alameda County: | 34.4% |
| Whole state: | 26.7% |
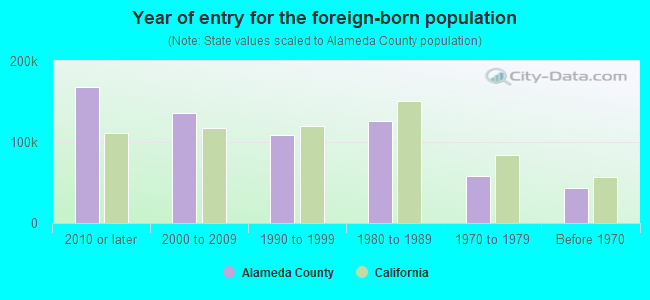
- Year of entry for the foreign-born population
- 173,3812010 or later
- 131,5012000 to 2009
- 113,6631990 to 1999
- 126,0121980 to 1989
- 57,5771970 to 1979
- 43,054Before 1970
Mean travel time to work (commute): minutes
Percentage of county residents living and working in this county: 99.8%
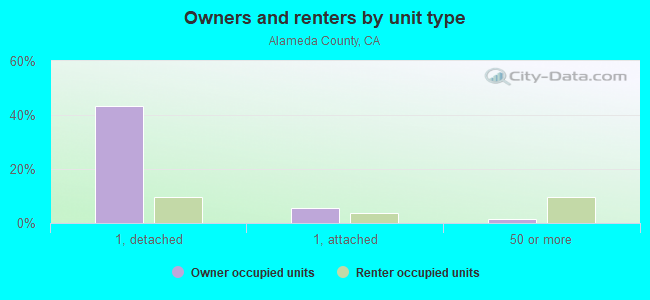
Housing units in structures:
- One, detached: 322,240
- One, attached: 56,222
- Two: 24,653
- 3 or 4: 38,996
- 5 to 9: 33,395
- 10 to 19: 29,927
- 20 to 49: 39,358
- 50 or more: 80,662
- Mobile homes: 7,539
- Boats, RVs, vans, etc.: 873
Housing units in Alameda County with a mortgage: 231,278 (26,820 second mortgage, 923 home equity loan, 21,838 both second mortgage and home equity loan)
Houses without a mortgage: 4,753
| Here: | 98.3% with mortgage |
| State: | 98.6% with mortgage |
Religion statistics for Alameda County
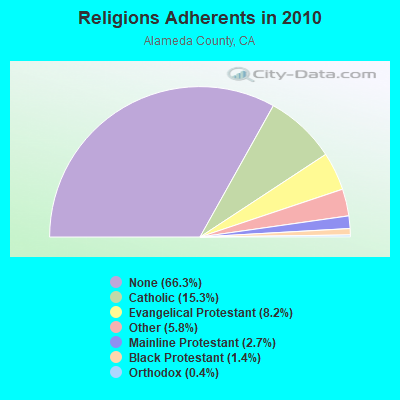
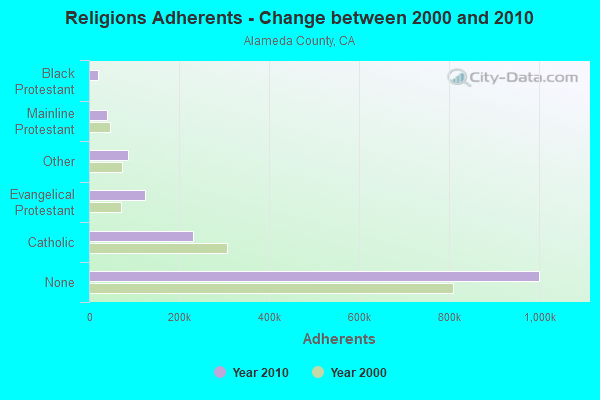
| Religion | Adherents | Congregations |
|---|---|---|
| Catholic | 231,500 | 53 |
| Evangelical Protestant | 123,422 | 538 |
| Other | 87,110 | 227 |
| Mainline Protestant | 40,185 | 181 |
| Black Protestant | 20,716 | 76 |
| Orthodox | 6,640 | 16 |
| None | 1,000,698 | - |
Source: Clifford Grammich, Kirk Hadaway, Richard Houseal, Dale E.Jones, Alexei Krindatch, Richie Stanley and Richard H.Taylor. 2012. 2010 U.S.Religion Census: Religious Congregations & Membership Study. Association of Statisticians of American Religious Bodies. Jones, Dale E., et al. 2002. Congregations and Membership in the United States 2000. Nashville, TN: Glenmary Research Center.
Food Environment Statistics:
| Alameda County: | 2.50 / 10,000 pop. |
| State: | 2.14 / 10,000 pop. |
| Here: | 0.03 / 10,000 pop. |
| California: | 0.04 / 10,000 pop. |
| This county: | 0.67 / 10,000 pop. |
| California: | 0.62 / 10,000 pop. |
| Alameda County: | 1.60 / 10,000 pop. |
| California: | 1.49 / 10,000 pop. |
| This county: | 8.94 / 10,000 pop. |
| State: | 7.42 / 10,000 pop. |
| Alameda County: | 6.9% |
| California: | 7.3% |
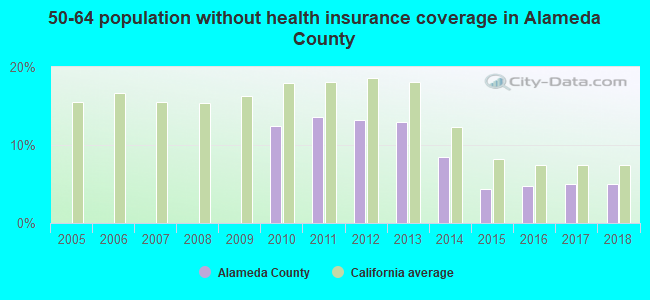
| Alameda County: | 19.3% |
| State: | 21.3% |
| Here: | 16.6% |
| State: | 17.9% |
Agriculture in Alameda County:
Average size of farms: 514 acresAverage value of agricultural products sold per farm: $101,962
Average value of crops sold per acre for harvested cropland: $4571.00
The value of nursery, greenhouse, floriculture, and sod as a percentage of the total market value of agricultural products sold: 62.43%
The value of livestock, poultry, and their products as a percentage of the total market value of agricultural products sold: 16.20%
Average total farm production expenses per farm: $112,629
Harvested cropland as a percentage of land in farms: 3.63%
Irrigated harvested cropland as a percentage of land in farms: 63.83%
Average market value of all machinery and equipment per farm: $41,975
The percentage of farms operated by a family or individual: 84.43%
Average age of principal farm operators: 58 years
Average number of cattle and calves per 100 acres of all land in farms: 9.08
Milk cows as a percentage of all cattle and calves: 0.03%
Land in orchards: 2,711 acres
Earthquake activity:
Alameda County-area historical earthquake activity is significantly above California state average. It is 7626% greater than the overall U.S. average.On 4/18/1906 at 13:12:21, a magnitude 7.9 (7.9 UK, Class: Major, Intensity: VIII - XII) earthquake occurred 53.1 miles away from Alameda County center, causing $524,000,000 total damage
On 10/18/1989 at 00:04:15, a magnitude 7.1 (6.5 MB, 7.1 MS, 6.9 MW, 7.0 ML) earthquake occurred 45.6 miles away from the county center, causing 62 deaths (62 shaking deaths) and 3757 injuries, causing $1,305,032,704 total damage
On 11/4/1927 at 13:51:53, a magnitude 7.5 (7.5 UK) earthquake occurred 202.7 miles away from the county center
On 7/21/1952 at 11:52:14, a magnitude 7.7 (7.7 UK) earthquake occurred 255.0 miles away from the county center, causing $50,000,000 total damage
On 1/31/1922 at 13:17:28, a magnitude 7.6 (7.6 UK) earthquake occurred 277.3 miles away from Alameda County center
On 4/25/1992 at 18:06:04, a magnitude 7.2 (6.3 MB, 7.1 MS, 7.2 MW, 7.1 MW, Depth: 9.4 mi) earthquake occurred 210.7 miles away from the county center, causing $75,000,000 total damage
Magnitude types: body-wave magnitude (MB), local magnitude (ML), surface-wave magnitude (MS), moment magnitude (MW)
Most recent natural disasters:
- California Covid-19 Pandemic, Incident Period: January 20, 2020, FEMA Id: 4482, Natural disaster type: Other
- California Severe Winter Storms, Flooding, Mudslides, Incident Period: February 1, 2017 - February 23, 2017, FEMA Id: 4308, Natural disaster type: Winter Storm, Mudslide, Flood
- California Severe Winter Storms, Flooding, And Mudslides, Incident Period: January 18, 2017 - January 23, 2017, FEMA Id: 4305, Natural disaster type: Winter Storm, Mudslide, Flood
- California Severe Winter Storms, Flooding, And Mudslides, Incident Period: January 3, 2017 - January 12, 2017, FEMA Id: 4301, Natural disaster type: Winter Storm, Mudslide, Flood
- California Severe Storms, Flooding, Landslides, and Mudslides, Incident Period: March 29, 2006 to April 16, 2006, Major Disaster (Presidential) Declared DR-1646: June 05, 2006, FEMA Id: 1646, Natural disaster type: Storm, Mudslide, Landslide, Flood
- California Severe Storms, Flooding, Mudslides, and Landslides, Incident Period: December 17, 2005 to January 03, 2006, Major Disaster (Presidential) Declared DR-1628: February 03, 2006, FEMA Id: 1628, Natural disaster type: Storm, Mudslide, Landslide, Flood
- California Hurricane Katrina Evacuation, Incident Period: August 29, 2005 to October 01, 2005, Emergency Declared EM-3248: September 13, 2005, FEMA Id: 3248, Natural disaster type: Hurricane
- California Severe Winter Storms and Flooding, Incident Period: February 02, 1998 to April 30, 1998, Major Disaster (Presidential) Declared DR-1203: February 09, 1998, FEMA Id: 1203, Natural disaster type: Winter Storm, Flood
- California Severe Storms/Flooding, Incident Period: December 28, 1996 to April 01, 1997, Major Disaster (Presidential) Declared DR-1155: January 04, 1997, FEMA Id: 1155, Natural disaster type: Storm, Flood
- California Severe Winter Storms, Flooding, Landslides, Mud Flows, Incident Period: February 13, 1995 to April 19, 1995, Major Disaster (Presidential) Declared DR-1046: March 12, 1995, FEMA Id: 1046, Natural disaster type: Winter Storm, Landslide, Flood
- 10 other natural disasters have been reported since 1953.
The number of natural disasters in Alameda County (20) is greater than the US average (15).
Major Disasters (Presidential) Declared: 14
Emergencies Declared: 2
Causes of natural disasters: Floods: 13, Storms: 7, Mudslides: 6, Winter Storms: 6, Landslides: 4, Fires: 2, Drought: 1, Earthquake: 1, Freeze: 1, Hurricane: 1, Tornado: 1, Other: 1 (Note: some incidents may be assigned to more than one category).
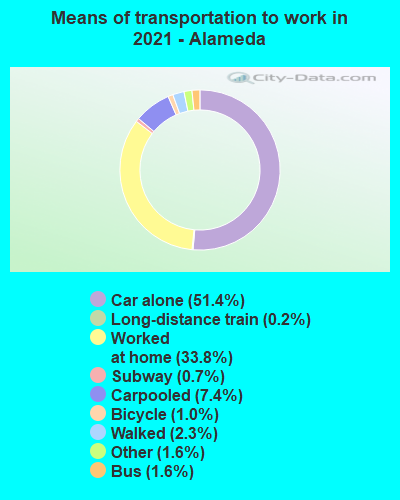
Means of transportation to work:
- Drove a car alone: 461,217 (54.4%)
- Carpooled: 71,254 (8.4%)
- Bus: 15,267 (1.8%)
- Subway or elevated rail: 14,336 (1.7%)
- Long-distance train or commuter rail: 3,361 (0.4%)
- Light rail, streetcar or trolley: 546 (0.1%)
- Ferryboat: 499 (0.1%)
- Taxicab, motorcycle, or other means: 14,019 (1.7%)
- Bicycle: 11,492 (1.4%)
- Walked: 21,414 (2.5%)
- Worked at home: 234,028 (27.6%)
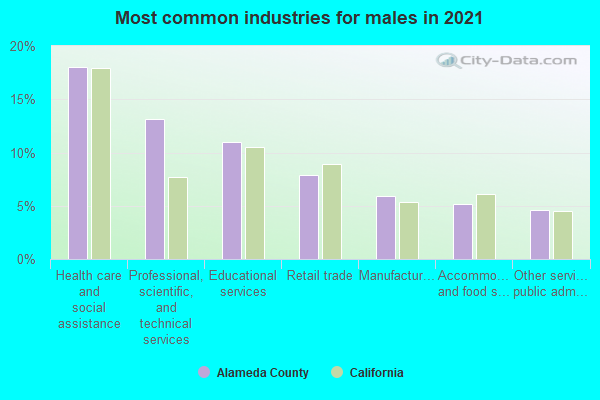
- Health care and social assistance (17%)
- Professional, scientific, and technical services (13%)
- Educational services (10%)
- Retail trade (8%)
- Manufacturing (7%)
- Other services, except public administration (5%)
- Accommodation and food services (5%)
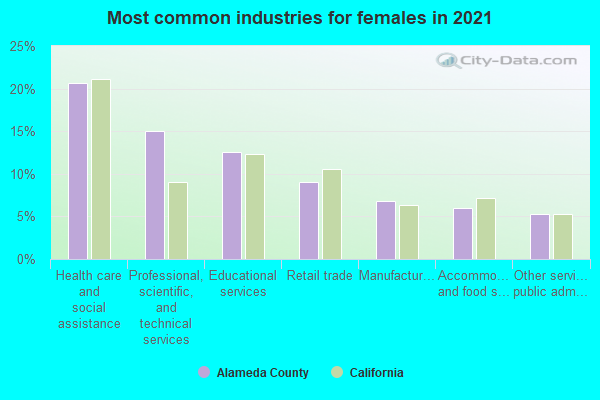
- Health care and social assistance (20%)
- Professional, scientific, and technical services (15%)
- Educational services (12%)
- Retail trade (9%)
- Manufacturing (8%)
- Other services, except public administration (6%)
- Accommodation and food services (6%)
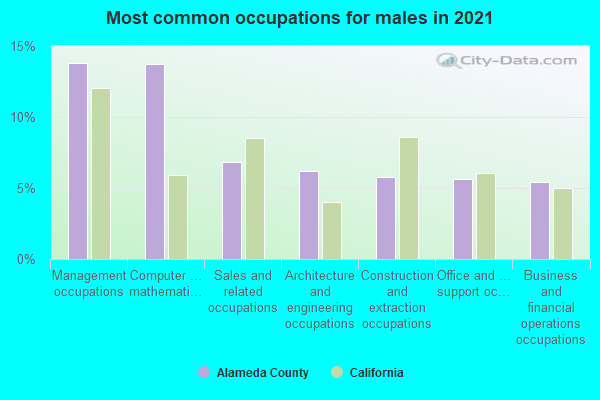
- Management occupations (15%)
- Computer and mathematical occupations (12%)
- Sales and related occupations (8%)
- Architecture and engineering occupations (7%)
- Construction and extraction occupations (7%)
- Business and financial operations occupations (6%)
- Office and administrative support occupations (6%)
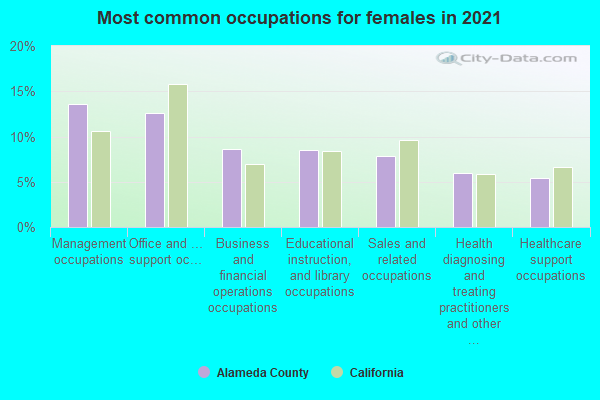
- Management occupations (15%)
- Office and administrative support occupations (12%)
- Business and financial operations occupations (9%)
- Educational instruction, and library occupations (9%)
- Sales and related occupations (7%)
- Computer and mathematical occupations (6%)
- Health diagnosing and treating practitioners and other technical occupations (6%)
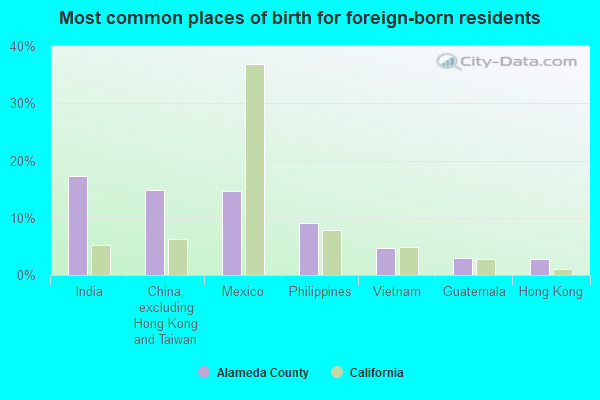
- India (19%)
- Mexico (15%)
- China, excluding Hong Kong and Taiwan (15%)
- Philippines (10%)
- Vietnam (4%)
- Guatemala (3%)
- Hong Kong (3%)
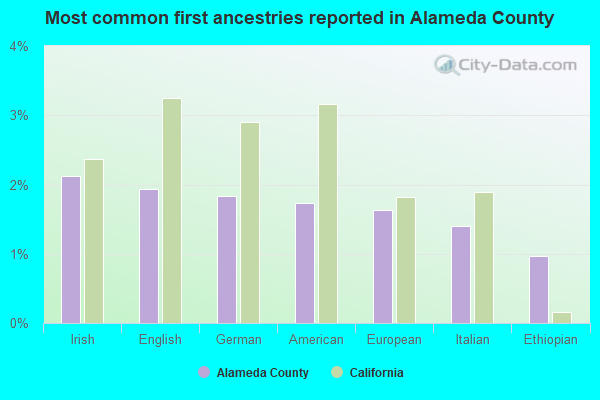
- English (2%)
- Irish (2%)
- German (2%)
- European (2%)
- American (2%)
- Italian (1%)
- Afghan (1%)
People in group quarters in Alameda County, California in 2010:
- 13,003 people in college/university student housing
- 5,329 people in nursing facilities/skilled-nursing facilities
- 5,140 people in local jails and other municipal confinement facilities
- 5,037 people in other noninstitutional facilities
- 2,205 people in group homes intended for adults
- 1,345 people in federal prisons
- 1,334 people in emergency and transitional shelters (with sleeping facilities) for people experiencing homelessness
- 1,157 people in workers' group living quarters and job corps centers
- 1,069 people in residential treatment centers for adults
- 585 people in military ships
- 343 people in correctional facilities intended for juveniles
- 178 people in mental (psychiatric) hospitals and psychiatric units in other hospitals
- 133 people in group homes for juveniles (non-correctional)
- 122 people in correctional residential facilities
- 106 people in state prisons
- 99 people in residential treatment centers for juveniles (non-correctional)
- 76 people in military barracks and dormitories (nondisciplinary)
- 69 people in hospitals with patients who have no usual home elsewhere
- 66 people in maritime/merchant vessels
- 46 people in in-patient hospice facilities
People in group quarters in Alameda County, California in 2000:
- 5,752 people in college dormitories (includes college quarters off campus)
- 5,311 people in other noninstitutional group quarters
- 5,211 people in nursing homes
- 4,517 people in local jails and other confinement facilities (including police lockups)
- 1,613 people in federal prisons and detention centers
- 779 people in homes or halfway houses for drug/alcohol abuse
- 727 people in other group homes
- 551 people in homes for the mentally retarded
- 551 people in religious group quarters
- 538 people in mental (psychiatric) hospitals or wards
- 296 people in homes for the mentally ill
- 270 people in short-term care, detention or diagnostic centers for delinquent children
- 220 people in hospitals/wards and hospices for chronically ill
- 211 people in other nonhousehold living situations
- 198 people in military ships
- 187 people in wards in general hospitals for patients who have no usual home elsewhere
- 170 people in other hospitals or wards for chronically ill
- 148 people in halfway houses
- 118 people in training schools for juvenile delinquents
- 96 people in institutions for the blind
- 85 people in orthopedic wards and institutions for the physically handicapped
- 71 people in homes for abused, dependent, and neglected children
- 69 people in residential treatment centers for emotionally disturbed children
- 50 people in hospices or homes for chronically ill
- 50 people in crews of maritime vessels
- 45 people in unknown juvenile institutions
- 38 people in military barracks, etc.
- 36 people in homes for the physically handicapped
- 26 people in hospitals or wards for drug/alcohol abuse
- 10 people in job corps and vocational training facilities
- 8 people in other workers' dormitories
- 3 people in military transient quarters for temporary residents
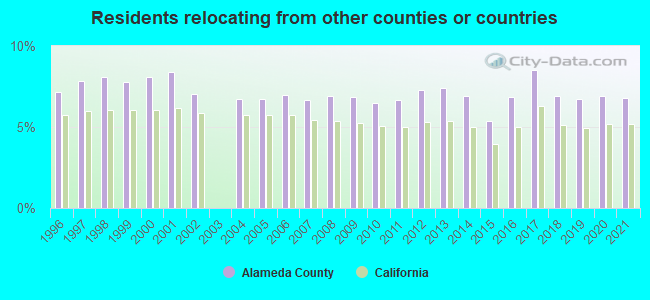
6.77% of this county's 2021 resident taxpayers lived in other counties in 2020 ($121,106 average adjusted gross income)
| Here: | 6.77% |
| California average: | 5.19% |
0.01% of residents moved from foreign countries ($76 average AGI)
Alameda County: 0.01% California average: 0.03%
5.09% relocated from other counties in California ($98,341 average AGI)
1.67% relocated from other states ($22,689 average AGI)
Alameda County: 1.67% California average: 1.56%
Top counties from which taxpayers relocated into this county between 2020 and 2021:
| from Santa Clara County, CA | |
| from San Francisco County, CA | |
| from Contra Costa County, CA | |
| from San Mateo County, CA | |
| from Los Angeles County, CA | |
| from San Joaquin County, CA | |
| from Sacramento County, CA |
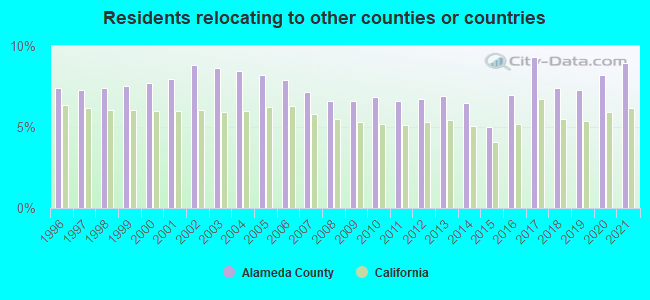
8.96% of this county's 2020 resident taxpayers moved to other counties in 2021 ($131,786 average adjusted gross income)
| Here: | 8.96% |
| California average: | 6.14% |
0.01% of residents moved to foreign countries ($103 average AGI)
Alameda County: 0.01% California average: 0.02%
6.18% relocated to other counties in California ($83,418 average AGI)
2.78% relocated to other states ($48,265 average AGI)
Alameda County: 2.78% California average: 2.55%
Top counties to which taxpayers relocated from this county between 2020 and 2021:
| to Contra Costa County, CA | |
| to Santa Clara County, CA | |
| to San Francisco County, CA | |
| to San Joaquin County, CA | |
| to Los Angeles County, CA | |
| to San Mateo County, CA | |
| to Sacramento County, CA |
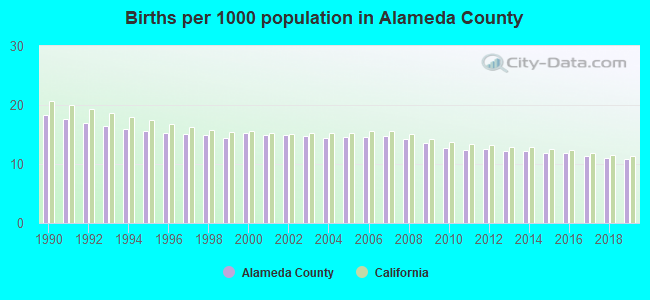
Births per 1000 population from 1990 to 1999: 16.1
Births per 1000 population from 2000 to 2009: 14.6
Births per 1000 population from 2010 to 2022: 10.0
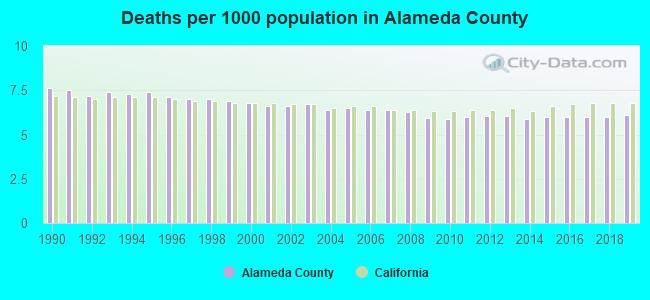
Deaths per 1000 population from 1990 to 1999: 7.2
Deaths per 1000 population from 2000 to 2009: 6.5
Deaths per 1000 population from 2010 to 2020: 6.1
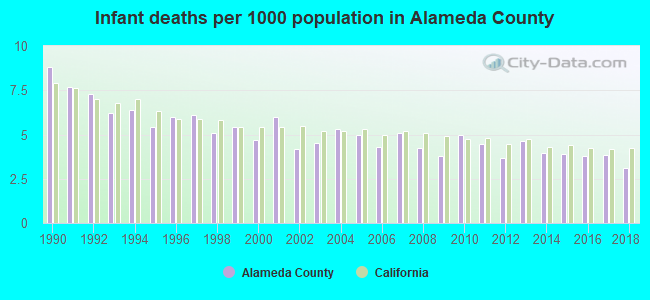
Infant deaths per 1000 live births from 1990 to 1999: 6.4
Infant deaths per 1000 live births from 2000 to 2009: 4.7
Infant deaths per 1000 live births from 2010 to 2021: 3.9
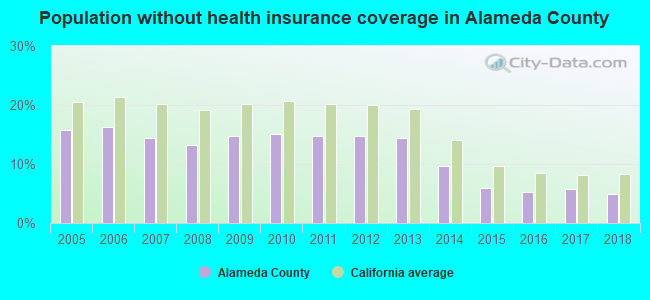
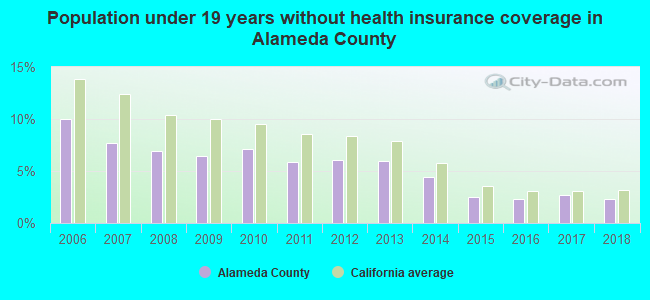
Persons under 19 years old without health insurance coverage in 2018: 2.3%
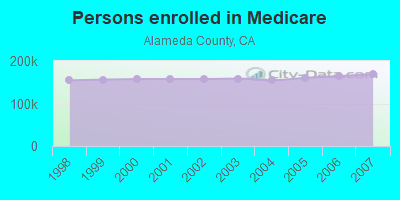
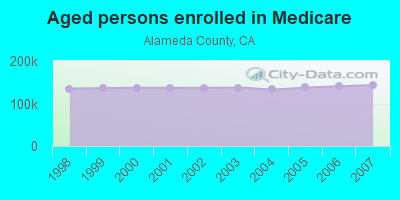
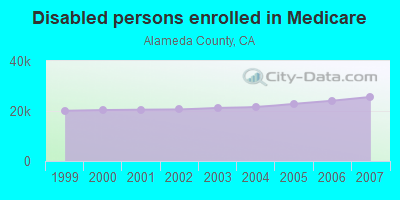
Persons enrolled in hospital insurance and/or supplemental medical insurance (Medicare) in July 1, 2007: 168,986 (143,355 aged, 25,631 disabled)
Children under 18 without health insurance coverage in 2007: 25,980 (7%)
Most common underlying causes of death in Alameda County, California in 1999 - 2019:
- Atherosclerotic heart disease (15,892)
- Bronchus or lung, unspecified - Malignant neoplasms (10,690)
- Acute myocardial infarction, unspecified (9,943)
- Alzheimer disease, unspecified (7,679)
- Chronic obstructive pulmonary disease, unspecified (6,205)
- Stroke, not specified as haemorrhage or infarction (6,025)
- Unspecified dementia (4,984)
- Pneumonia, unspecified (3,922)
- Breast, unspecified - Malignant neoplasms (3,773)
- Colon, unspecified - Malignant neoplasms (3,283)
Population without health insurance coverage in 2000: 14%
Children under 18 without health insurance coverage in 2000: 10%
Homicides per 1,000,000 population from 2000 to 2006: 91.0. This is less than state average.
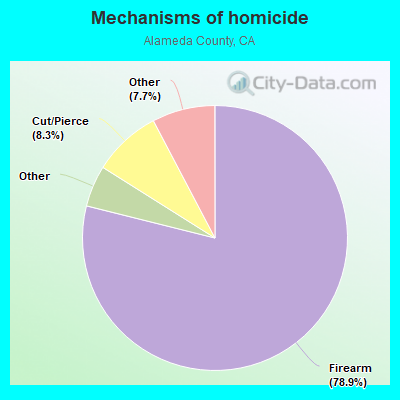
- Firearm - 71.8
- Cut/Pierce - 7.6
- Struck by/against - 2.4
- Suffocation - 2.3
- Other - 7.0
Suicides per 1,000,000 population from 2000 to 2006: 75.3. This is less than state average.
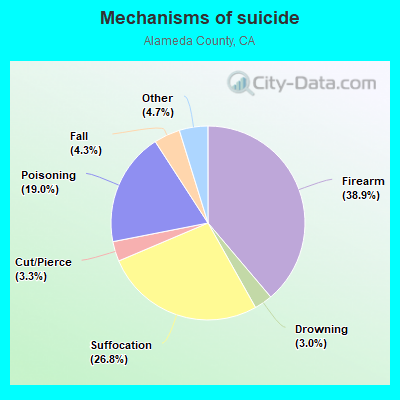
- Firearm - 29.3
- Suffocation - 20.2
- Poisoning - 14.3
- Fall - 3.3
- Cut/Pierce - 2.5
- Drowning - 2.3
- Other - 3.6
Household type by relationship:
Households: 1,628,997- Male householders: 311,404 (66,512 living alone), Female householders: 285,210 (84,306 living alone)
292,253 spouses (287,005 opposite-sex spouses), 44,493 unmarried partners, (40,988 opposite-sex unmarried partners), 426,469 children (414,226 natural, 4,564 adopted, 7,679 stepchildren), 24,015 grandchildren, 26,851 brothers or sisters, 53,360 parents, 147 foster children, 42,958 other relatives, 84,584 non-relatives
- In group quarters: 37,253
Size of family households: 144,966 2-persons, 99,485 3-persons, 85,574 4-persons, 34,007 5-persons, 13,759 6-persons, 8,014 7-or-more-persons.
Size of nonfamily households: 150,818 1-person, 47,097 2-persons, 7,208 3-persons, 3,349 4-persons, 1,773 5-persons, 292 6-persons, 272 7-or-more-persons.
224,248 married couples with children.
58,235 single-parent households (14,688 men, 43,547 women).
54.2% of residents of Alameda speak English at home.
15.8% of residents speak Spanish at home (58% speak English very well, 21% speak English well, 14% speak English not well, 7% don't speak English at all).
8.9% of residents speak other Indo-European language at home (79% speak English very well, 15% speak English well, 5% speak English not well, 1% don't speak English at all).
19.8% of residents speak Asian or Pacific Island language at home (57% speak English very well, 24% speak English well, 14% speak English not well, 6% don't speak English at all).
1.4% of residents speak other language at home (67% speak English very well, 17% speak English well, 13% speak English not well, 3% don't speak English at all).
In fiscal year 2004:
Federal Government expenditure: $10,765,668,000 ($7,398 per capita)
Department of Defense expenditure: $487,548,000
Federal direct payments to individuals for retirement and disability: $2,510,221,000
Federal other direct payments to individuals: $1,660,338,000
Federal direct payments not to individuals: $31,706,000
Federal grants: $2,809,764,000
Federal procurement contracts: $2,862,128,000 ($267,837,000 Department of Defense)
Federal salaries and wages: $891,511,000 ($77,154,000 Department of Defense)
Federal Government direct loans: $96,897,000
Federal guaranteed/insured loans: $175,339,000
Federal Government insurance: $628,887,000
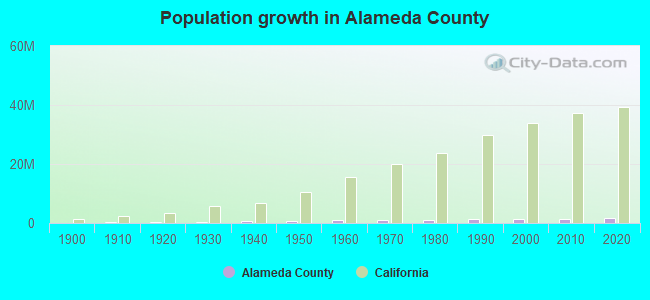
Population change from April 1, 2000 to July 1, 2005:
Births: 112,808| Here: | 78 per 1000 residents |
| State: | 77 per 1000 residents |
Deaths: 50,706
| Here: | 35 per 1000 residents |
| State: | 34 per 1000 residents |
Net international migration: +77,807
| Here: | +54 per 1000 residents |
| State: | +39 per 1000 residents |
Net internal migration: -132,607
| Here: | |
| State: |
Total withdrawal of fresh water for public supply: 220.40 millions of gallons per day (12% from ground, 88% from surface)
| Here: | 6.0 |
| State: | 6.0 |
| Here: | 3.7 |
| State: | 3.9 |
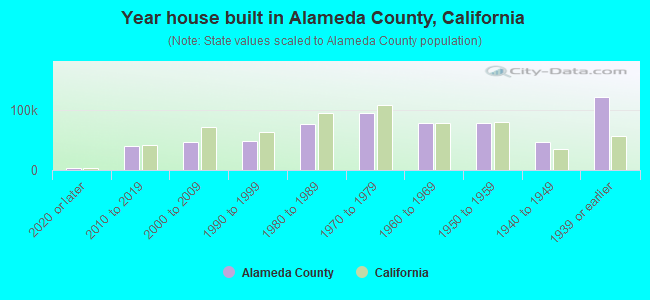
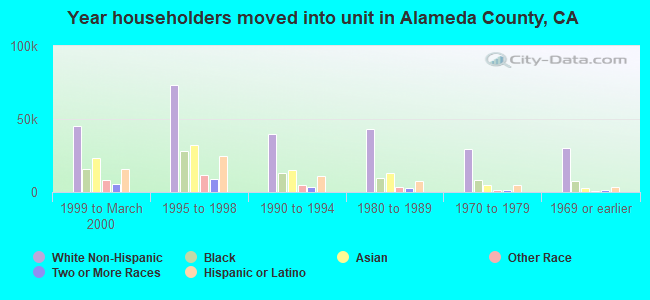
- Year house built in Alameda County, California
- 9,8572020 or later
- 46,8772010 to 2019
- 46,9132000 to 2009
- 48,8051990 to 1999
- 68,5911980 to 1989
- 85,3121970 to 1979
- 82,6811960 to 1969
- 78,6821950 to 1959
- 43,8471940 to 1949
- 122,3001939 or earlier
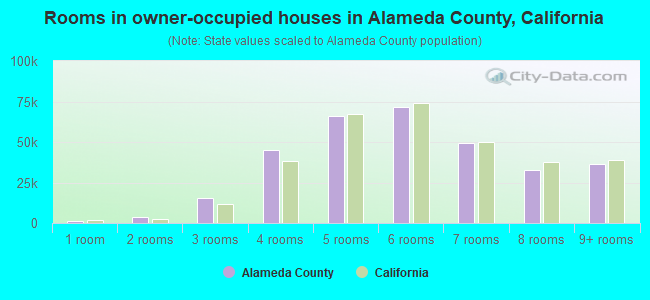
- Rooms in owner-occupied houses in Alameda County, California
- 2,0611 room
- 3,3732 rooms
- 17,3913 rooms
- 44,7314 rooms
- 64,9655 rooms
- 66,8626 rooms
- 48,3667 rooms
- 39,3258 rooms
- 41,1989+ rooms
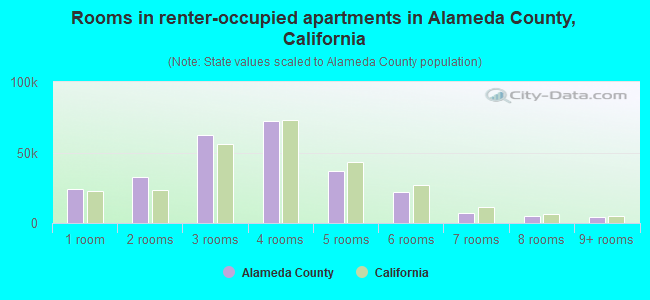
- Rooms in renter-occupied apartments in Alameda County, California
- 25,7001 room
- 32,0602 rooms
- 63,1113 rooms
- 70,2784 rooms
- 36,9585 rooms
- 20,2956 rooms
- 9,6417 rooms
- 4,5898 rooms
- 5,7109+ rooms
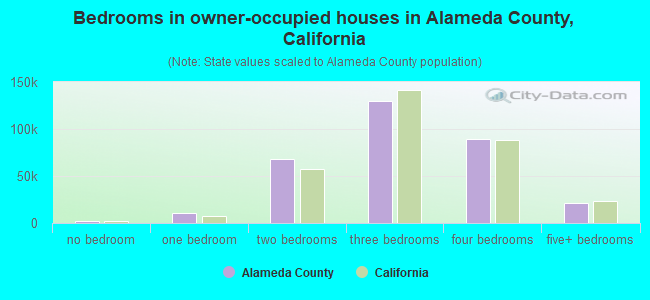
- Bedrooms in owner-occupied houses in Alameda County, California
- 2,500no bedroom
- 10,8061 bedroom
- 66,5092 bedrooms
- 133,9413 bedrooms
- 88,4284 bedrooms
- 26,0885+ bedrooms
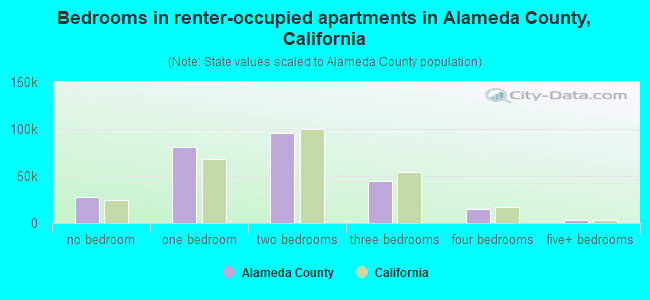
- Bedrooms in renter-occupied apartments in Alameda County, California
- 29,337no bedroom
- 80,3401 bedroom
- 98,9122 bedrooms
- 43,1713 bedrooms
- 13,0024 bedrooms
- 3,5805+ bedrooms
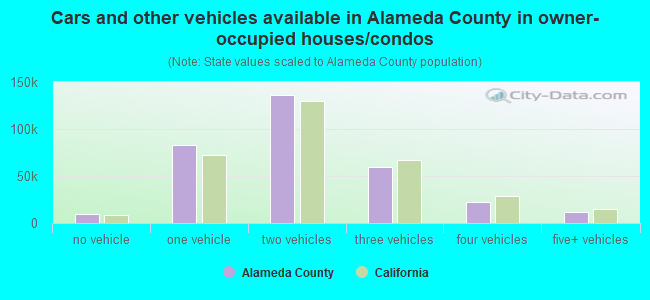
- Cars and other vehicles available in Alameda County in owner-occupied houses/condos
- 11,680no vehicle
- 86,1021 vehicle
- 138,2192 vehicles
- 61,3843 vehicles
- 22,3144 vehicles
- 8,5735+ vehicles
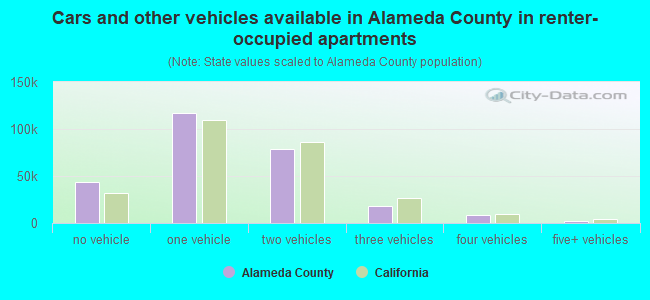
- Cars and other vehicles available in Alameda County in renter-occupied apartments
- 48,411no vehicle
- 117,1511 vehicle
- 73,1682 vehicles
- 20,7893 vehicles
- 5,7774 vehicles
- 3,0465+ vehicles
87.3% of Alameda County residents lived in the same house 1 years ago.
Out of people who lived in different houses, 36% lived in this county.
Out of people who lived in different counties, 73% lived in California.
| Alameda County: | 87.3% |
| State average: | 88.9% |
Place of birth for U.S.-born residents:
- This state: 777,342
- Other state: 263,727
- Northeast: 73,482
- Midwest: 68,120
- South: 72,464
- West: 49,661
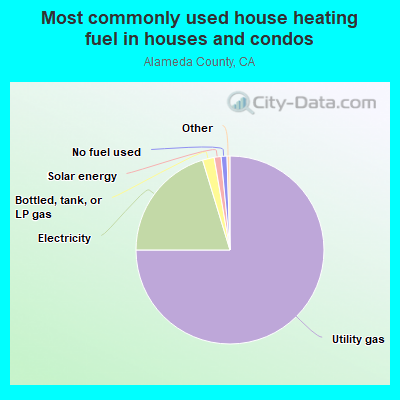
- 74.8%Utility gas
- 19.9%Electricity
- 2.0%Bottled, tank, or LP gas
- 1.7%Solar energy
- 1.3%No fuel used
- 0.2%Fuel oil, kerosene, etc.
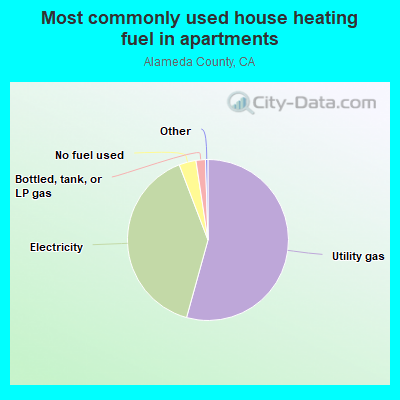
- 50.6%Utility gas
- 42.6%Electricity
- 4.1%No fuel used
- 1.6%Bottled, tank, or LP gas
- 0.5%Solar energy
- 0.4%Other fuel
- 0.3%Fuel oil, kerosene, etc.
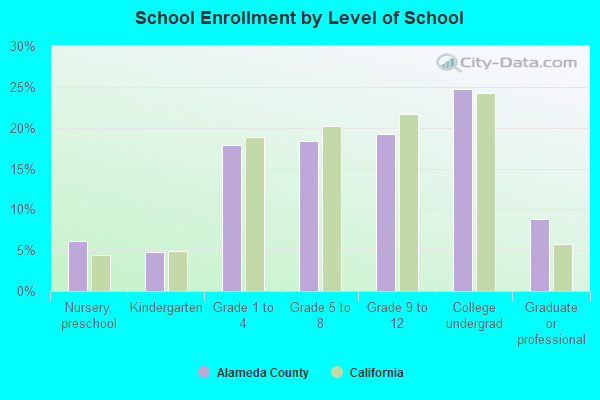
Private vs. public school enrollment:
| Here: | 12.3% |
| California: | 10.5% |
| Here: | 9.9% |
| California: | 8.5% |
| Here: | 9.7% |
| California: | 15.9% |

Alameda County government finances - Expenditure in 2020:
- Assistance and Subsidies - Public Welfare, Cash Assistance Programs - Other: $306,798,000
Public Welfare, Cash Assistance Programs - Other: $288,503,000
- Bond Funds - Cash and Securities: $923,150,000
Cash and Securities: $57,029,000
- Charges - Hospital Public: $902,913,000
Hospital Public: $861,985,000
Other: $681,137,000
Other: $484,037,000
Natural Resources - Other: $3,708,000
Natural Resources - Other: $3,515,000
Regular Highways: $1,715,000
Elementary and Secondary Education - Other: $1,398,000
Elementary and Secondary Education - Other: $1,106,000
Regular Highways: $235,000
- Construction - Regular Highways: $40,641,000
General - Other: $1,888,000
Natural Resources - Other: $1,014,000
Local Fire Protection: $823,000
Natural Resources - Other: $642,000
Elementary and Secondary Education: $145,000
Elementary and Secondary Education: $100,000
- Current Operations - Hospitals: $1,017,265,000
Hospitals: $1,011,927,000
Health - Other: $920,758,000
Health - Other: $770,068,000
Public Welfare - Other: $464,158,000
Public Welfare - Other: $387,031,000
Correctional Institutions: $198,568,000
Correctional Institutions: $193,797,000
Judicial and Legal Services: $179,931,000
General - Other: $145,997,000
Judicial and Legal Services: $141,152,000
Police Protection: $131,475,000
Local Fire Protection: $126,327,000
Local Fire Protection: $123,442,000
Corrections - Other: $108,307,000
Police Protection: $107,419,000
General - Other: $96,749,000
Corrections - Other: $93,205,000
Financial Administration: $74,514,000
Central Staff Services: $63,841,000
Financial Administration: $62,164,000
Regular Highways: $61,610,000
Central Staff Services: $54,364,000
Regular Highways: $46,204,000
Natural Resources - Other: $43,113,000
Elementary and Secondary Education: $41,660,000
Elementary and Secondary Education: $41,126,000
Natural Resources - Other: $40,872,000
Libraries: $31,433,000
Libraries: $27,530,000
General Public Buildings: $8,247,000
Parking Facilities: $3,877,000
Protective Inspection and Regulation - Other: $3,674,000
Protective Inspection and Regulation - Other: $3,358,000
Parking Facilities: $2,695,000
Parks and Recreation: $770,000
Parks and Recreation: $714,000
Public Welfare, Vendor Payments for Other Purposes: $72,000
Public Welfare, Vendor Payments for Other Purposes: $51,000
- Federal Intergovernmental - Other: $79,327,000
Other: $40,613,000
Health and Hospitals: $15,857,000
Housing and Community Development: $3,137,000
Housing and Community Development: $2,614,000
Highways: $1,879,000
Highways: $675,000
Education: $175,000
Education: $101,000
Natural Resources: $11,000
Natural Resources: $5,000
- General - Interest on Debt: $66,045,000
Interest on Debt: $58,526,000
- Intergovernmental to Local - Other - General - Other: $12,226,000
Other - General - Other: $1,323,000
Other - Elementary and Secondary Education: $921,000
Other - Elementary and Secondary Education: $17,000
- Intergovernmental to State - Judicial and Legal Services: $30,145,000
Judicial and Legal Services: $30,040,000
- Local Intergovernmental - Other: $97,121,000
Other: $42,793,000
Education: $7,909,000
Education: $6,386,000
Housing and Community Development: $24,000
- Long Term Debt - Outstanding Unspecified Public Purpose: $3,392,558,000
Beginning Outstanding - Unspecified Public Purpose: $2,906,794,000
Beginning Outstanding - Unspecified Public Purpose: $2,393,186,000
Outstanding Unspecified Public Purpose: $2,255,107,000
Issue, Unspecified Public Purpose: $701,715,000
Retired Unspecified Public Purpose: $229,218,000
Retired Unspecified Public Purpose: $144,280,000
Beginning Outstanding - Public Debt for Private Purpose: $122,700,000
Outstanding Nonguaranteed - Industrial Revenue: $91,400,000
Retired Nonguaranteed - Public Debt for Private Purpose: $31,300,000
Issue, Unspecified Public Purpose: $6,392,000
- Miscellaneous - Interest Earnings: $122,224,000
General Revenue - Other: $115,574,000
Special Assessments: $72,489,000
General Revenue - Other: $71,838,000
Interest Earnings: $43,544,000
Special Assessments: $37,199,000
Fines and Forfeits: $23,969,000
Fines and Forfeits: $16,851,000
Rents: $6,549,000
Rents: $6,087,000
Sale of Property: $747,000
Sale of Property: $79,000
- Other Capital Outlay - General - Other: $181,026,000
Judicial and Legal Services: $62,179,000
Health - Other: $11,936,000
Public Welfare - Other: $6,619,000
Police Protection: $4,723,000
Central Staff Services: $3,404,000
Correctional Institutions: $3,376,000
Police Protection: $3,068,000
Regular Highways: $785,000
Elementary and Secondary Education: $475,000
Elementary and Secondary Education: $464,000
Libraries: $443,000
Regular Highways: $298,000
Public Welfare - Other: $112,000
Protective Inspection and Regulation - Other: $19,000
Health - Other: $14,000
- Other Funds - Cash and Securities: $3,898,934,000
Cash and Securities: $2,472,139,000
- Sinking Funds - Cash and Securities: $231,543,000
Cash and Securities: $180,017,000
- State Intergovernmental - Public Welfare: $762,246,000
Public Welfare: $728,424,000
Health and Hospitals: $533,654,000
Health and Hospitals: $380,253,000
Other: $288,142,000
Other: $245,729,000
Highways: $52,336,000
Highways: $35,047,000
Education: $22,188,000
Education: $19,829,000
General Local Government Support: $4,257,000
General Local Government Support: $3,466,000
- Tax - Property: $1,146,505,000
Property: $993,307,000
Other: $42,492,000
Other: $42,145,000
General Sales and Gross Receipts: $24,523,000
General Sales and Gross Receipts: $24,310,000
Documentary and Stock Transfer: $21,343,000
Documentary and Stock Transfer: $18,840,000
Public Utilities Sales: $15,740,000
Public Utilities Sales: $13,203,000
Other License: $5,834,000
Other License: $5,803,000
Occupation and Business License - Other: $3,384,000
Occupation and Business License - Other: $3,341,000
Other Selective Sales: $1,069,000
Other Selective Sales: $850,000
- Total Salaries and Wages: $23,013,000
: $21,779,000
Alameda County government finances - Revenue in 2020:
- Assistance and Subsidies - Public Welfare, Cash Assistance Programs - Other: $306,798,000
Public Welfare, Cash Assistance Programs - Other: $288,503,000
- Bond Funds - Cash and Securities: $923,150,000
Cash and Securities: $57,029,000
- Charges - Hospital Public: $902,913,000
Hospital Public: $861,985,000
Other: $681,137,000
Other: $484,037,000
Natural Resources - Other: $3,708,000
Natural Resources - Other: $3,515,000
Regular Highways: $1,715,000
Elementary and Secondary Education - Other: $1,398,000
Elementary and Secondary Education - Other: $1,106,000
Regular Highways: $235,000
- Construction - Regular Highways: $40,641,000
General - Other: $1,888,000
Natural Resources - Other: $1,014,000
Local Fire Protection: $823,000
Natural Resources - Other: $642,000
Elementary and Secondary Education: $145,000
Elementary and Secondary Education: $100,000
- Current Operations - Hospitals: $1,017,265,000
Hospitals: $1,011,927,000
Health - Other: $920,758,000
Health - Other: $770,068,000
Public Welfare - Other: $464,158,000
Public Welfare - Other: $387,031,000
Correctional Institutions: $198,568,000
Correctional Institutions: $193,797,000
Judicial and Legal Services: $179,931,000
General - Other: $145,997,000
Judicial and Legal Services: $141,152,000
Police Protection: $131,475,000
Local Fire Protection: $126,327,000
Local Fire Protection: $123,442,000
Corrections - Other: $108,307,000
Police Protection: $107,419,000
General - Other: $96,749,000
Corrections - Other: $93,205,000
Financial Administration: $74,514,000
Central Staff Services: $63,841,000
Financial Administration: $62,164,000
Regular Highways: $61,610,000
Central Staff Services: $54,364,000
Regular Highways: $46,204,000
Natural Resources - Other: $43,113,000
Elementary and Secondary Education: $41,660,000
Elementary and Secondary Education: $41,126,000
Natural Resources - Other: $40,872,000
Libraries: $31,433,000
Libraries: $27,530,000
General Public Buildings: $8,247,000
Parking Facilities: $3,877,000
Protective Inspection and Regulation - Other: $3,674,000
Protective Inspection and Regulation - Other: $3,358,000
Parking Facilities: $2,695,000
Parks and Recreation: $770,000
Parks and Recreation: $714,000
Public Welfare, Vendor Payments for Other Purposes: $72,000
Public Welfare, Vendor Payments for Other Purposes: $51,000
- Federal Intergovernmental - Other: $79,327,000
Other: $40,613,000
Health and Hospitals: $15,857,000
Housing and Community Development: $3,137,000
Housing and Community Development: $2,614,000
Highways: $1,879,000
Highways: $675,000
Education: $175,000
Education: $101,000
Natural Resources: $11,000
Natural Resources: $5,000
- General - Interest on Debt: $66,045,000
Interest on Debt: $58,526,000
- Intergovernmental to Local - Other - General - Other: $12,226,000
Other - General - Other: $1,323,000
Other - Elementary and Secondary Education: $921,000
Other - Elementary and Secondary Education: $17,000
- Intergovernmental to State - Judicial and Legal Services: $30,145,000
Judicial and Legal Services: $30,040,000
- Local Intergovernmental - Other: $97,121,000
Other: $42,793,000
Education: $7,909,000
Education: $6,386,000
Housing and Community Development: $24,000
- Long Term Debt - Outstanding Unspecified Public Purpose: $3,392,558,000
Beginning Outstanding - Unspecified Public Purpose: $2,906,794,000
Beginning Outstanding - Unspecified Public Purpose: $2,393,186,000
Outstanding Unspecified Public Purpose: $2,255,107,000
Issue, Unspecified Public Purpose: $701,715,000
Retired Unspecified Public Purpose: $229,218,000
Retired Unspecified Public Purpose: $144,280,000
Beginning Outstanding - Public Debt for Private Purpose: $122,700,000
Outstanding Nonguaranteed - Industrial Revenue: $91,400,000
Retired Nonguaranteed - Public Debt for Private Purpose: $31,300,000
Issue, Unspecified Public Purpose: $6,392,000
- Miscellaneous - Interest Earnings: $122,224,000
General Revenue - Other: $115,574,000
Special Assessments: $72,489,000
General Revenue - Other: $71,838,000
Interest Earnings: $43,544,000
Special Assessments: $37,199,000
Fines and Forfeits: $23,969,000
Fines and Forfeits: $16,851,000
Rents: $6,549,000
Rents: $6,087,000
Sale of Property: $747,000
Sale of Property: $79,000
- Other Capital Outlay - General - Other: $181,026,000
Judicial and Legal Services: $62,179,000
Health - Other: $11,936,000
Public Welfare - Other: $6,619,000
Police Protection: $4,723,000
Central Staff Services: $3,404,000
Correctional Institutions: $3,376,000
Police Protection: $3,068,000
Regular Highways: $785,000
Elementary and Secondary Education: $475,000
Elementary and Secondary Education: $464,000
Libraries: $443,000
Regular Highways: $298,000
Public Welfare - Other: $112,000
Protective Inspection and Regulation - Other: $19,000
Health - Other: $14,000
- Other Funds - Cash and Securities: $3,898,934,000
Cash and Securities: $2,472,139,000
- Sinking Funds - Cash and Securities: $231,543,000
Cash and Securities: $180,017,000
- State Intergovernmental - Public Welfare: $762,246,000
Public Welfare: $728,424,000
Health and Hospitals: $533,654,000
Health and Hospitals: $380,253,000
Other: $288,142,000
Other: $245,729,000
Highways: $52,336,000
Highways: $35,047,000
Education: $22,188,000
Education: $19,829,000
General Local Government Support: $4,257,000
General Local Government Support: $3,466,000
- Tax - Property: $1,146,505,000
Property: $993,307,000
Other: $42,492,000
Other: $42,145,000
General Sales and Gross Receipts: $24,523,000
General Sales and Gross Receipts: $24,310,000
Documentary and Stock Transfer: $21,343,000
Documentary and Stock Transfer: $18,840,000
Public Utilities Sales: $15,740,000
Public Utilities Sales: $13,203,000
Other License: $5,834,000
Other License: $5,803,000
Occupation and Business License - Other: $3,384,000
Occupation and Business License - Other: $3,341,000
Other Selective Sales: $1,069,000
Other Selective Sales: $850,000
- Total Salaries and Wages: $23,013,000
: $21,779,000
Alameda County government finances - Debt in 2020:
- Assistance and Subsidies - Public Welfare, Cash Assistance Programs - Other: $306,798,000
Public Welfare, Cash Assistance Programs - Other: $288,503,000
- Bond Funds - Cash and Securities: $923,150,000
Cash and Securities: $57,029,000
- Charges - Hospital Public: $902,913,000
Hospital Public: $861,985,000
Other: $681,137,000
Other: $484,037,000
Natural Resources - Other: $3,708,000
Natural Resources - Other: $3,515,000
Regular Highways: $1,715,000
Elementary and Secondary Education - Other: $1,398,000
Elementary and Secondary Education - Other: $1,106,000
Regular Highways: $235,000
- Construction - Regular Highways: $40,641,000
General - Other: $1,888,000
Natural Resources - Other: $1,014,000
Local Fire Protection: $823,000
Natural Resources - Other: $642,000
Elementary and Secondary Education: $145,000
Elementary and Secondary Education: $100,000
- Current Operations - Hospitals: $1,017,265,000
Hospitals: $1,011,927,000
Health - Other: $920,758,000
Health - Other: $770,068,000
Public Welfare - Other: $464,158,000
Public Welfare - Other: $387,031,000
Correctional Institutions: $198,568,000
Correctional Institutions: $193,797,000
Judicial and Legal Services: $179,931,000
General - Other: $145,997,000
Judicial and Legal Services: $141,152,000
Police Protection: $131,475,000
Local Fire Protection: $126,327,000
Local Fire Protection: $123,442,000
Corrections - Other: $108,307,000
Police Protection: $107,419,000
General - Other: $96,749,000
Corrections - Other: $93,205,000
Financial Administration: $74,514,000
Central Staff Services: $63,841,000
Financial Administration: $62,164,000
Regular Highways: $61,610,000
Central Staff Services: $54,364,000
Regular Highways: $46,204,000
Natural Resources - Other: $43,113,000
Elementary and Secondary Education: $41,660,000
Elementary and Secondary Education: $41,126,000
Natural Resources - Other: $40,872,000
Libraries: $31,433,000
Libraries: $27,530,000
General Public Buildings: $8,247,000
Parking Facilities: $3,877,000
Protective Inspection and Regulation - Other: $3,674,000
Protective Inspection and Regulation - Other: $3,358,000
Parking Facilities: $2,695,000
Parks and Recreation: $770,000
Parks and Recreation: $714,000
Public Welfare, Vendor Payments for Other Purposes: $72,000
Public Welfare, Vendor Payments for Other Purposes: $51,000
- Federal Intergovernmental - Other: $79,327,000
Other: $40,613,000
Health and Hospitals: $15,857,000
Housing and Community Development: $3,137,000
Housing and Community Development: $2,614,000
Highways: $1,879,000
Highways: $675,000
Education: $175,000
Education: $101,000
Natural Resources: $11,000
Natural Resources: $5,000
- General - Interest on Debt: $66,045,000
Interest on Debt: $58,526,000
- Intergovernmental to Local - Other - General - Other: $12,226,000
Other - General - Other: $1,323,000
Other - Elementary and Secondary Education: $921,000
Other - Elementary and Secondary Education: $17,000
- Intergovernmental to State - Judicial and Legal Services: $30,145,000
Judicial and Legal Services: $30,040,000
- Local Intergovernmental - Other: $97,121,000
Other: $42,793,000
Education: $7,909,000
Education: $6,386,000
Housing and Community Development: $24,000
- Long Term Debt - Outstanding Unspecified Public Purpose: $3,392,558,000
Beginning Outstanding - Unspecified Public Purpose: $2,906,794,000
Beginning Outstanding - Unspecified Public Purpose: $2,393,186,000
Outstanding Unspecified Public Purpose: $2,255,107,000
Issue, Unspecified Public Purpose: $701,715,000
Retired Unspecified Public Purpose: $229,218,000
Retired Unspecified Public Purpose: $144,280,000
Beginning Outstanding - Public Debt for Private Purpose: $122,700,000
Outstanding Nonguaranteed - Industrial Revenue: $91,400,000
Retired Nonguaranteed - Public Debt for Private Purpose: $31,300,000
Issue, Unspecified Public Purpose: $6,392,000
- Miscellaneous - Interest Earnings: $122,224,000
General Revenue - Other: $115,574,000
Special Assessments: $72,489,000
General Revenue - Other: $71,838,000
Interest Earnings: $43,544,000
Special Assessments: $37,199,000
Fines and Forfeits: $23,969,000
Fines and Forfeits: $16,851,000
Rents: $6,549,000
Rents: $6,087,000
Sale of Property: $747,000
Sale of Property: $79,000
- Other Capital Outlay - General - Other: $181,026,000
Judicial and Legal Services: $62,179,000
Health - Other: $11,936,000
Public Welfare - Other: $6,619,000
Police Protection: $4,723,000
Central Staff Services: $3,404,000
Correctional Institutions: $3,376,000
Police Protection: $3,068,000
Regular Highways: $785,000
Elementary and Secondary Education: $475,000
Elementary and Secondary Education: $464,000
Libraries: $443,000
Regular Highways: $298,000
Public Welfare - Other: $112,000
Protective Inspection and Regulation - Other: $19,000
Health - Other: $14,000
- Other Funds - Cash and Securities: $3,898,934,000
Cash and Securities: $2,472,139,000
- Sinking Funds - Cash and Securities: $231,543,000
Cash and Securities: $180,017,000
- State Intergovernmental - Public Welfare: $762,246,000
Public Welfare: $728,424,000
Health and Hospitals: $533,654,000
Health and Hospitals: $380,253,000
Other: $288,142,000
Other: $245,729,000
Highways: $52,336,000
Highways: $35,047,000
Education: $22,188,000
Education: $19,829,000
General Local Government Support: $4,257,000
General Local Government Support: $3,466,000
- Tax - Property: $1,146,505,000
Property: $993,307,000
Other: $42,492,000
Other: $42,145,000
General Sales and Gross Receipts: $24,523,000
General Sales and Gross Receipts: $24,310,000
Documentary and Stock Transfer: $21,343,000
Documentary and Stock Transfer: $18,840,000
Public Utilities Sales: $15,740,000
Public Utilities Sales: $13,203,000
Other License: $5,834,000
Other License: $5,803,000
Occupation and Business License - Other: $3,384,000
Occupation and Business License - Other: $3,341,000
Other Selective Sales: $1,069,000
Other Selective Sales: $850,000
- Total Salaries and Wages: $23,013,000
: $21,779,000
Alameda County government finances - Cash and Securities in 2020:
- Assistance and Subsidies - Public Welfare, Cash Assistance Programs - Other: $306,798,000
Public Welfare, Cash Assistance Programs - Other: $288,503,000
- Bond Funds - Cash and Securities: $923,150,000
Cash and Securities: $57,029,000
- Charges - Hospital Public: $902,913,000
Hospital Public: $861,985,000
Other: $681,137,000
Other: $484,037,000
Natural Resources - Other: $3,708,000
Natural Resources - Other: $3,515,000
Regular Highways: $1,715,000
Elementary and Secondary Education - Other: $1,398,000
Elementary and Secondary Education - Other: $1,106,000
Regular Highways: $235,000
- Construction - Regular Highways: $40,641,000
General - Other: $1,888,000
Natural Resources - Other: $1,014,000
Local Fire Protection: $823,000
Natural Resources - Other: $642,000
Elementary and Secondary Education: $145,000
Elementary and Secondary Education: $100,000
- Current Operations - Hospitals: $1,017,265,000
Hospitals: $1,011,927,000
Health - Other: $920,758,000
Health - Other: $770,068,000
Public Welfare - Other: $464,158,000
Public Welfare - Other: $387,031,000
Correctional Institutions: $198,568,000
Correctional Institutions: $193,797,000
Judicial and Legal Services: $179,931,000
General - Other: $145,997,000
Judicial and Legal Services: $141,152,000
Police Protection: $131,475,000
Local Fire Protection: $126,327,000
Local Fire Protection: $123,442,000
Corrections - Other: $108,307,000
Police Protection: $107,419,000
General - Other: $96,749,000
Corrections - Other: $93,205,000
Financial Administration: $74,514,000
Central Staff Services: $63,841,000
Financial Administration: $62,164,000
Regular Highways: $61,610,000
Central Staff Services: $54,364,000
Regular Highways: $46,204,000
Natural Resources - Other: $43,113,000
Elementary and Secondary Education: $41,660,000
Elementary and Secondary Education: $41,126,000
Natural Resources - Other: $40,872,000
Libraries: $31,433,000
Libraries: $27,530,000
General Public Buildings: $8,247,000
Parking Facilities: $3,877,000
Protective Inspection and Regulation - Other: $3,674,000
Protective Inspection and Regulation - Other: $3,358,000
Parking Facilities: $2,695,000
Parks and Recreation: $770,000
Parks and Recreation: $714,000
Public Welfare, Vendor Payments for Other Purposes: $72,000
Public Welfare, Vendor Payments for Other Purposes: $51,000
- Federal Intergovernmental - Other: $79,327,000
Other: $40,613,000
Health and Hospitals: $15,857,000
Housing and Community Development: $3,137,000
Housing and Community Development: $2,614,000
Highways: $1,879,000
Highways: $675,000
Education: $175,000
Education: $101,000
Natural Resources: $11,000
Natural Resources: $5,000
- General - Interest on Debt: $66,045,000
Interest on Debt: $58,526,000
- Intergovernmental to Local - Other - General - Other: $12,226,000
Other - General - Other: $1,323,000
Other - Elementary and Secondary Education: $921,000
Other - Elementary and Secondary Education: $17,000
- Intergovernmental to State - Judicial and Legal Services: $30,145,000
Judicial and Legal Services: $30,040,000
- Local Intergovernmental - Other: $97,121,000
Other: $42,793,000
Education: $7,909,000
Education: $6,386,000
Housing and Community Development: $24,000
- Long Term Debt - Outstanding Unspecified Public Purpose: $3,392,558,000
Beginning Outstanding - Unspecified Public Purpose: $2,906,794,000
Beginning Outstanding - Unspecified Public Purpose: $2,393,186,000
Outstanding Unspecified Public Purpose: $2,255,107,000
Issue, Unspecified Public Purpose: $701,715,000
Retired Unspecified Public Purpose: $229,218,000
Retired Unspecified Public Purpose: $144,280,000
Beginning Outstanding - Public Debt for Private Purpose: $122,700,000
Outstanding Nonguaranteed - Industrial Revenue: $91,400,000
Retired Nonguaranteed - Public Debt for Private Purpose: $31,300,000
Issue, Unspecified Public Purpose: $6,392,000
- Miscellaneous - Interest Earnings: $122,224,000
General Revenue - Other: $115,574,000
Special Assessments: $72,489,000
General Revenue - Other: $71,838,000
Interest Earnings: $43,544,000
Special Assessments: $37,199,000
Fines and Forfeits: $23,969,000
Fines and Forfeits: $16,851,000
Rents: $6,549,000
Rents: $6,087,000
Sale of Property: $747,000
Sale of Property: $79,000
- Other Capital Outlay - General - Other: $181,026,000
Judicial and Legal Services: $62,179,000
Health - Other: $11,936,000
Public Welfare - Other: $6,619,000
Police Protection: $4,723,000
Central Staff Services: $3,404,000
Correctional Institutions: $3,376,000
Police Protection: $3,068,000
Regular Highways: $785,000
Elementary and Secondary Education: $475,000
Elementary and Secondary Education: $464,000
Libraries: $443,000
Regular Highways: $298,000
Public Welfare - Other: $112,000
Protective Inspection and Regulation - Other: $19,000
Health - Other: $14,000
- Other Funds - Cash and Securities: $3,898,934,000
Cash and Securities: $2,472,139,000
- Sinking Funds - Cash and Securities: $231,543,000
Cash and Securities: $180,017,000
- State Intergovernmental - Public Welfare: $762,246,000
Public Welfare: $728,424,000
Health and Hospitals: $533,654,000
Health and Hospitals: $380,253,000
Other: $288,142,000
Other: $245,729,000
Highways: $52,336,000
Highways: $35,047,000
Education: $22,188,000
Education: $19,829,000
General Local Government Support: $4,257,000
General Local Government Support: $3,466,000
- Tax - Property: $1,146,505,000
Property: $993,307,000
Other: $42,492,000
Other: $42,145,000
General Sales and Gross Receipts: $24,523,000
General Sales and Gross Receipts: $24,310,000
Documentary and Stock Transfer: $21,343,000
Documentary and Stock Transfer: $18,840,000
Public Utilities Sales: $15,740,000
Public Utilities Sales: $13,203,000
Other License: $5,834,000
Other License: $5,803,000
Occupation and Business License - Other: $3,384,000
Occupation and Business License - Other: $3,341,000
Other Selective Sales: $1,069,000
Other Selective Sales: $850,000
- Total Salaries and Wages: $23,013,000
: $21,779,000
Supplemental Security Income (SSI) in 2006:
- Total number of recipients: 51,258
- Number of aged recipients: 15,779
- Number of blind and disabled recipients: 35,479
- Number of recipients under 18: 3,594
- Number of recipients between 18 and 64: 25,515
- Number of recipients older than 64: 22,149
- Number of recipients also receiving OASDI: 16,910
- Amount of payments (thousands of dollars): 32,530
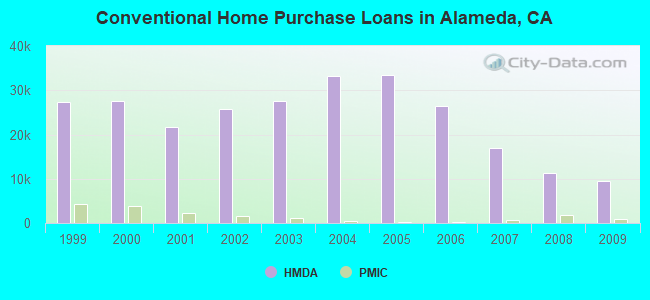
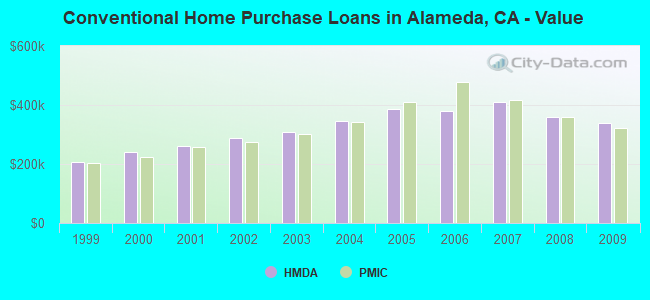
| Home Mortgage Disclosure Act Aggregated Statistics For Year 2009 (Based on 321 full tracts) | ||||||||||||||
| A) FHA, FSA/RHS & VA Home Purchase Loans | B) Conventional Home Purchase Loans | C) Refinancings | D) Home Improvement Loans | E) Loans on Dwellings For 5+ Families | F) Non-occupant Loans on < 5 Family Dwellings (A B C & D) | G) Loans On Manufactured Home Dwelling (A B C & D) | ||||||||
|---|---|---|---|---|---|---|---|---|---|---|---|---|---|---|
| Number | Average Value | Number | Average Value | Number | Average Value | Number | Average Value | Number | Average Value | Number | Average Value | Number | Average Value | |
| LOANS ORIGINATED | 3,525 | $337,412 | 9,503 | $337,611 | 40,208 | $340,736 | 1,429 | $248,541 | 139 | $3,639,403 | 2,644 | $248,315 | 43 | $98,419 |
| APPLICATIONS APPROVED, NOT ACCEPTED | 387 | $326,641 | 1,423 | $334,100 | 5,000 | $375,577 | 159 | $199,440 | 9 | $3,189,333 | 419 | $246,854 | 30 | $76,600 |
| APPLICATIONS DENIED | 798 | $305,465 | 2,295 | $298,760 | 11,203 | $379,090 | 603 | $166,327 | 58 | $966,897 | 1,312 | $247,957 | 107 | $86,963 |
| APPLICATIONS WITHDRAWN | 622 | $314,963 | 1,550 | $323,860 | 6,371 | $362,573 | 326 | $195,120 | 21 | $2,541,762 | 619 | $249,796 | 13 | $204,462 |
| FILES CLOSED FOR INCOMPLETENESS | 164 | $296,713 | 368 | $306,592 | 2,299 | $367,236 | 131 | $171,863 | 3 | $1,341,667 | 182 | $239,170 | 6 | $127,833 |
| Private Mortgage Insurance Companies Aggregated Statistics For Year 2009 (Based on 277 full tracts) | ||||||
| A) Conventional Home Purchase Loans | B) Refinancings | C) Non-occupant Loans on < 5 Family Dwellings (A & B) | ||||
|---|---|---|---|---|---|---|
| Number | Average Value | Number | Average Value | Number | Average Value | |
| LOANS ORIGINATED | 868 | $322,848 | 188 | $391,830 | 1 | $370,000 |
| APPLICATIONS APPROVED, NOT ACCEPTED | 370 | $334,538 | 142 | $400,331 | 0 | $0 |
| APPLICATIONS DENIED | 177 | $318,175 | 104 | $397,827 | 1 | $68,000 |
| APPLICATIONS WITHDRAWN | 69 | $329,333 | 30 | $401,800 | 0 | $0 |
| FILES CLOSED FOR INCOMPLETENESS | 38 | $390,474 | 6 | $496,833 | 0 | $0 |
| Most common first names in Alameda County, CA among deceased individuals | ||
| Name | Count | Lived (average) |
|---|---|---|
| John | 7,230 | 74.4 years |
| Mary | 6,503 | 80.2 years |
| William | 5,517 | 74.5 years |
| Robert | 4,557 | 70.4 years |
| James | 4,511 | 71.3 years |
| George | 3,782 | 75.4 years |
| Joseph | 3,327 | 75.4 years |
| Charles | 3,286 | 73.7 years |
| Frank | 3,036 | 76.5 years |
| Helen | 2,890 | 79.7 years |
| Most common last names in Alameda County, CA among deceased individuals | ||
| Last name | Count | Lived (average) |
|---|---|---|
| Smith | 2,697 | 75.0 years |
| Johnson | 2,521 | 74.4 years |
| Williams | 2,176 | 74.1 years |
| Brown | 1,664 | 74.5 years |
| Jones | 1,541 | 73.5 years |
| Davis | 1,273 | 73.0 years |
| Anderson | 1,142 | 76.2 years |
| Miller | 1,125 | 76.3 years |
| Lee | 1,068 | 75.8 years |
| Jackson | 1,067 | 72.4 years |
| Businesses in Alameda County, CA | ||||
| Name | Count | Name | Count | |
|---|---|---|---|---|
| 24 Hour Fitness | 14 | J.Crew | 2 | |
| 7-Eleven | 56 | JCPenney | 5 | |
| 99 Cents Only Stores | 5 | Jack In The Box | 27 | |
| ALDO | 2 | Jamba Juice | 19 | |
| AMF Bowling | 1 | Jones New York | 19 | |
| AT&T | 17 | Journeys | 2 | |
| Abercrombie & Fitch | 2 | Justice | 2 | |
| Abercrombie Kids | 1 | KFC | 25 | |
| Ace Hardware | 11 | Kmart | 2 | |
| Aeropostale | 2 | Kohl's | 6 | |
| Aerosoles | 1 | Kroger | 16 | |
| American Eagle Outfitters | 2 | La Quinta | 6 | |
| Ann Taylor | 3 | La-Z-Boy | 3 | |
| Apple Store | 2 | Lane Bryant | 4 | |
| Applebee's | 6 | Lane Furniture | 10 | |
| Arby's | 3 | LensCrafters | 5 | |
| Ashley Furniture | 1 | Little Caesars Pizza | 17 | |
| Audi | 2 | Lowe's | 4 | |
| AutoZone | 9 | Macy's | 6 | |
| Avenue | 3 | MainStay | 1 | |
| BMW | 3 | Marriott | 14 | |
| Baja Fresh Mexican Grill | 3 | Marshalls | 4 | |
| Bakers | 3 | MasterBrand Cabinets | 46 | |
| Bally Total Fitness | 3 | Mazda | 3 | |
| Banana Republic | 3 | McDonald's | 48 | |
| Barnes & Noble | 2 | Men's Wearhouse | 7 | |
| Baskin-Robbins | 15 | Motel 6 | 8 | |
| Bath & Body Works | 5 | Motherhood Maternity | 10 | |
| Bebe | 2 | New Balance | 26 | |
| Bed Bath & Beyond | 5 | New York & Co | 3 | |
| Ben & Jerry's | 3 | Nike | 82 | |
| Best Western | 5 | Nissan | 5 | |
| Big O Tires | 14 | Nordstrom | 2 | |
| Blockbuster | 15 | Office Depot | 6 | |
| Brookstone | 1 | OfficeMax | 6 | |
| Budget Car Rental | 6 | Old Navy | 5 | |
| Buffalo Wild Wings | 1 | Olive Garden | 2 | |
| Burger King | 32 | On The Border | 1 | |
| CVS | 30 | Outback | 2 | |
| Cache | 1 | Outback Steakhouse | 2 | |
| Carl\s Jr. | 13 | Pac Sun | 3 | |
| Casual Male XL | 4 | Panda Express | 17 | |
| Catherines | 2 | Panera Bread | 5 | |
| Charlotte Russe | 1 | Papa John's Pizza | 6 | |
| Chevrolet | 4 | Payless | 22 | |
| Chico's | 2 | Penske | 7 | |
| Chipotle | 8 | PetSmart | 4 | |
| Chuck E. Cheese's | 3 | Pier 1 Imports | 4 | |
| Church's Chicken | 6 | Pizza Hut | 9 | |
| Cinnabon | 3 | Plato's Closet | 1 | |
| Circle K | 1 | Popeyes | 11 | |
| Cold Stone Creamery | 9 | Pottery Barn | 2 | |
| Coldwater Creek | 1 | Pottery Barn Kids | 1 | |
| Comfort Inn | 4 | Quality | 2 | |
| Comfort Suites | 1 | Quiznos | 22 | |
| Costco | 5 | RadioShack | 24 | |
| Crate & Barrel | 1 | Red Lobster | 1 | |
| Curves | 13 | Red Robin | 2 | |
| DHL | 19 | Rite Aid | 12 | |
| Dairy Queen | 3 | Rodeway Inn | 1 | |
| Days Hotel | 1 | Ryder Rental & Truck Leasing | 1 | |
| Days Inn | 3 | SAS Shoes | 11 | |
| Decora Cabinetry | 6 | SONIC Drive-In | 1 | |
| Dennys | 9 | Safeway | 26 | |
| Discount Tire | 4 | Sears | 12 | |
| Domino's Pizza | 19 | Sephora | 3 | |
| DressBarn | 3 | Sheraton | 1 | |
| Dressbarn | 2 | Soma Intimates | 1 | |
| Econo Lodge | 2 | Spencer Gifts | 1 | |
| Eddie Bauer | 1 | Sprint Nextel | 13 | |
| El Pollo Loco | 2 | Staples | 3 | |
| Ethan Allen | 1 | Starbucks | 95 | |
| Express | 5 | Subaru | 3 | |
| Extended Stay America | 7 | Subway | 83 | |
| Extended Stay Deluxe | 3 | Super 8 | 2 | |
| Famous Footwear | 1 | T-Mobile | 41 | |
| FedEx | 182 | T.G.I. Driday's | 2 | |
| Finish Line | 2 | T.J.Maxx | 3 | |
| Firestone Complete Auto Care | 7 | Taco Bell | 31 | |
| Foot Locker | 6 | Talbots | 2 | |
| Ford | 5 | Target | 8 | |
| Forever 21 | 3 | The Cheesecake Factory | 1 | |
| Fredericks Of Hollywood | 1 | The Limited | 1 | |
| GNC | 21 | The Room Place | 6 | |
| GameStop | 21 | Torrid | 1 | |
| Gap | 5 | Toyota | 7 | |
| Goodwill | 7 | Toys"R"Us | 8 | |
| Gymboree | 4 | Trader Joe's | 9 | |
| H&M | 2 | True Value | 9 | |
| H&R Block | 30 | U-Haul | 43 | |
| Haagen-Dazs | 1 | UPS | 190 | |
| Haworth | 1 | Urban Outfitters | 1 | |
| Hawthorn | 2 | Vans | 20 | |
| Hilton | 12 | Verizon Wireless | 15 | |
| Holiday Inn | 8 | Victoria's Secret | 4 | |
| Hollister Co. | 2 | Volkswagen | 4 | |
| Home Depot | 9 | Vons | 30 | |
| HomeTown Buffet | 4 | Walgreens | 28 | |
| Homestead Studio Suites | 1 | Walmart | 8 | |
| Honda | 6 | Wendy's | 12 | |
| Hot Topic | 3 | Wet Seal | 3 | |
| Hyatt | 4 | Whole Foods Market | 2 | |
| IHOP | 6 | YMCA | 13 | |
| IKEA | 1 | Z Gallerie | 1 | |
| J. Jill | 1 | |||
Alameda County on our top lists:
- #11 on the list of "Top 101 counties with the lowest Ozone (1-hour) air pollution readings in 2012 (ppm)"
- #17 on the list of "Top 101 counties with highest percentage of residents voting for Obama (Democrat) in the 2012 Presidential Election (pop. 50,000+)"
- #18 on the list of "Top 101 counties with the most Other congregations (pop. 50,000+)"
- #18 on the list of "Top 101 counties with the most Other congregations"
- #21 on the list of "Top 101 counties with the highest surface withdrawal of fresh water for public supply (pop. 50,000+)"
- #22 on the list of "Top 101 counties with the highest percentage of residents that exercised in the past month"
- #22 on the list of "Top 101 counties with the highest surface withdrawal of fresh water for public supply"
- #22 on the list of "Top 101 counties with the most Other adherents"
- #22 on the list of "Top 101 counties with the most Other adherents (pop. 50,000+)"
- #23 on the list of "Top 101 counties with the most Evangelical Protestant congregations (pop. 50,000+)"
- #23 on the list of "Top 101 counties with the most Evangelical Protestant congregations"
- #23 on the list of "Top 101 counties with the most Orthodox congregations (pop. 50,000+)"
- #24 on the list of "Top 101 counties with the most Orthodox congregations"
- #28 on the list of "Top 101 counties with the highest total withdrawal of fresh water for public supply (pop. 50,000+)"
- #29 on the list of "Top 101 counties with the highest total withdrawal of fresh water for public supply"
- #29 on the list of "Top 101 counties with the most Black Protestant congregations (pop. 50,000+)"
- #29 on the list of "Top 101 counties with the most Black Protestant congregations"
- #30 on the list of "Top 101 counties with the highest percentage of residents that drank alcohol in the past 30 days"
- #32 on the list of "Top 101 counties with the most Mainline Protestant congregations (pop. 50,000+)"
- #32 on the list of "Top 101 counties with the most Mainline Protestant congregations"