Fremont, California
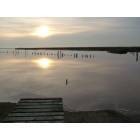
Fremont: Don Edward Park, Fremont
Fremont: Niles District ,Fremont
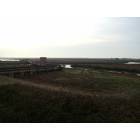
Fremont: Don Edward Park, Fremont
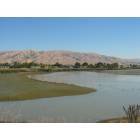
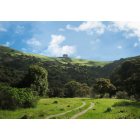
Fremont: Mission Peak from nearby wildlife refuge
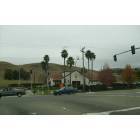
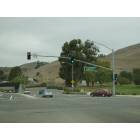
Fremont: Mission Blvd.,Fremont
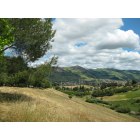
Fremont: West side of Paseo Padre Parkway, looking toward the Mission area hills
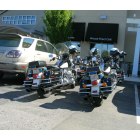
Fremont: Fremont PD on a break
Fremont: Niles Canyon Road in Fremont, California
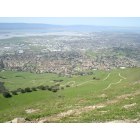
Fremont: This is a panoramic view of Fremont taken from the summit of Mission Peak
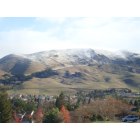
Fremont: This is a view of Mission Peak with snow from Mission San Jose district in Fremont
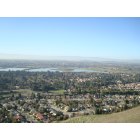
Fremont: View of the Quarry Lakes from the Niles hills in Fremont
- see
27
more - add
your
Submit your own pictures of this city and show them to the world
- OSM Map
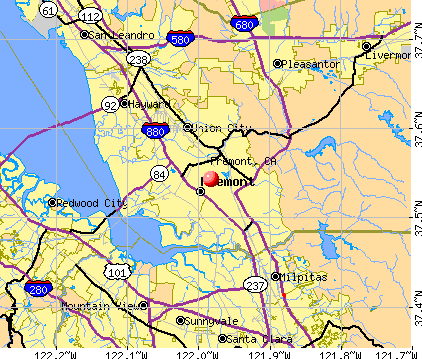
- General Map
- Google Map
- MSN Map
Population change since 2000: +10.1%
 |
| Males: 111,099 | |
| Females: 112,772 |
| Median resident age: | 39.3 years |
| California median age: | 37.9 years |
Zip codes: 94536, 94538, 94539, 94555.
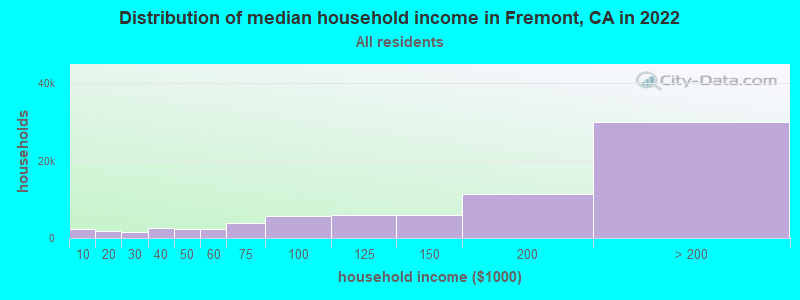
Fremont Zip Code Map| Fremont: | $162,336 |
| CA: | $91,551 |
Estimated per capita income in 2022: $72,487 (it was $31,411 in 2000)
Fremont city income, earnings, and wages data
Estimated median house or condo value in 2022: over $1,000,000 (it was $354,300 in 2000)
| Fremont: | over $1,000,000 |
| CA: | $715,900 |
Mean prices in 2022: all housing units: over $1,000,000; detached houses: over $1,000,000; townhouses or other attached units: over $1,000,000; in 2-unit structures: $871,684; in 3-to-4-unit structures: $882,000; in 5-or-more-unit structures: $724,990; mobile homes: $226,331
Median gross rent in 2022: $2,745.
(6.3% for White Non-Hispanic residents, 15.0% for Black residents, 16.5% for Hispanic or Latino residents, 14.5% for American Indian residents, 6.2% for Native Hawaiian and other Pacific Islander residents, 11.0% for other race residents, 5.4% for two or more races residents)
Detailed information about poverty and poor residents in Fremont, CA


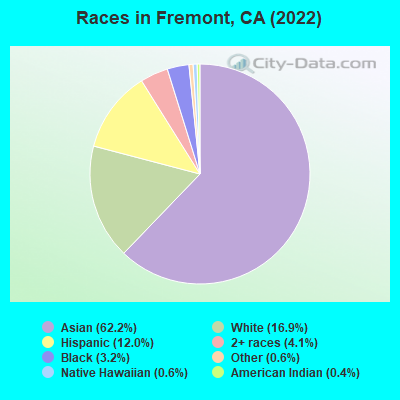
- 139,15662.2%Asian alone
- 37,92916.9%White alone
- 26,97112.0%Hispanic
- 9,2084.1%Two or more races
- 7,0913.2%Black alone
- 1,2410.6%Native Hawaiian and Other
Pacific Islander alone - 1,3890.6%Other race alone
- 8740.4%American Indian alone
According to our research of California and other state lists, there were 106 registered sex offenders living in Fremont, California as of April 27, 2024.
The ratio of all residents to sex offenders in Fremont is 2,199 to 1.
The ratio of registered sex offenders to all residents in this city is much lower than the state average.
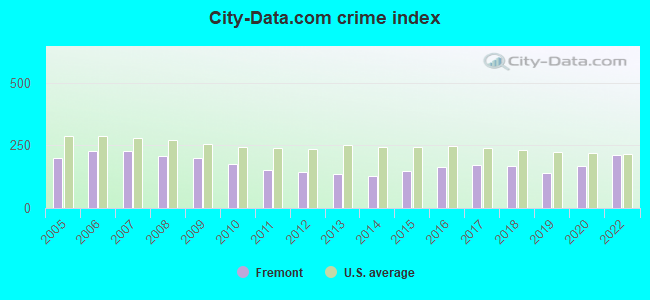
The City-Data.com crime index weighs serious crimes and violent crimes more heavily. Higher means more crime, U.S. average is 246.1. It adjusts for the number of visitors and daily workers commuting into cities.
- means the value is smaller than the state average.- means the value is about the same as the state average.
- means the value is bigger than the state average.
- means the value is much bigger than the state average.
Crime rate in Fremont detailed stats: murders, rapes, robberies, assaults, burglaries, thefts, arson
Full-time law enforcement employees in 2021, including police officers: 289 (189 officers - 169 male; 20 female).
| Officers per 1,000 residents here: | 0.80 |
| California average: | 2.30 |
 Recent articles from our blog. Our writers, many of them Ph.D. graduates or candidates, create easy-to-read articles on a wide variety of topics.


Latest news from Fremont, CA collected exclusively by city-data.com from local newspapers, TV, and radio stations
Ancestries: Afghan (1.5%), Irish (1.3%), American (1.2%), German (1.0%).
Current Local Time: PST time zone
Land area: 76.7 square miles.
Population density: 2,919 people per square mile (average).
112,920 residents are foreign born (42.4% Asia).
| This city: | 50.4% |
| California: | 26.5% |
Median real estate property taxes paid for housing units with mortgages in 2022: $9,928 (0.7%)
Median real estate property taxes paid for housing units with no mortgage in 2022: $5,785 (0.4%)
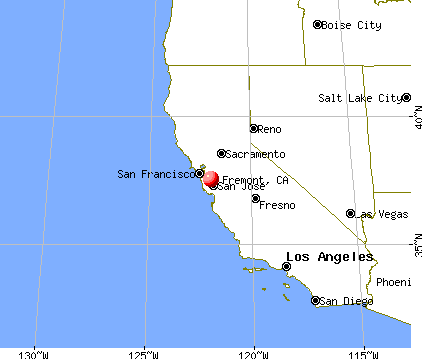
Nearest city with pop. 1,000,000+: Los Angeles, CA  (313.1 miles , pop. 3,694,820).
Nearest cities:
), Latitude: 37.54 N, Longitude: 121.98 W
Daytime population change due to commuting: +25,951 (+11.6%)
Workers who live and work in this city: 63,627 (56.9%)
Area code commonly used in this area: 925

Fremont tourist attractions:
Fremont, California accommodation & food services, waste management - Economy and Business Data
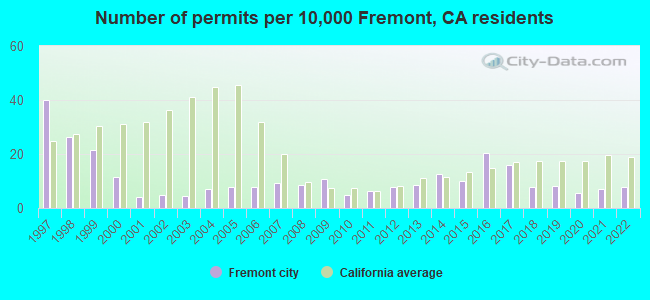
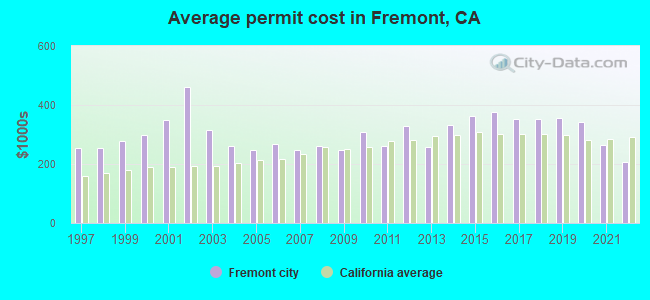
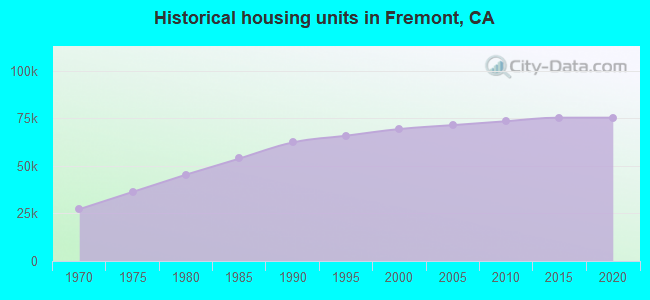
Single-family new house construction building permits:
- 2022: 159 buildings, average cost: $207,200
- 2021: 141 buildings, average cost: $262,500
- 2020: 112 buildings, average cost: $341,600
- 2019: 169 buildings, average cost: $357,200
- 2018: 159 buildings, average cost: $353,100
- 2017: 326 buildings, average cost: $353,200
- 2016: 414 buildings, average cost: $375,700
- 2015: 206 buildings, average cost: $363,900
- 2014: 258 buildings, average cost: $331,600
- 2013: 176 buildings, average cost: $258,900
- 2012: 161 buildings, average cost: $329,900
- 2011: 127 buildings, average cost: $260,400
- 2010: 100 buildings, average cost: $307,300
- 2009: 221 buildings, average cost: $248,200
- 2008: 170 buildings, average cost: $261,300
- 2007: 192 buildings, average cost: $246,700
- 2006: 155 buildings, average cost: $267,500
- 2005: 157 buildings, average cost: $248,600
- 2004: 142 buildings, average cost: $260,100
- 2003: 87 buildings, average cost: $313,800
- 2002: 99 buildings, average cost: $459,600
- 2001: 85 buildings, average cost: $349,900
- 2000: 236 buildings, average cost: $297,100
- 1999: 435 buildings, average cost: $277,300
- 1998: 538 buildings, average cost: $255,400
- 1997: 813 buildings, average cost: $252,900
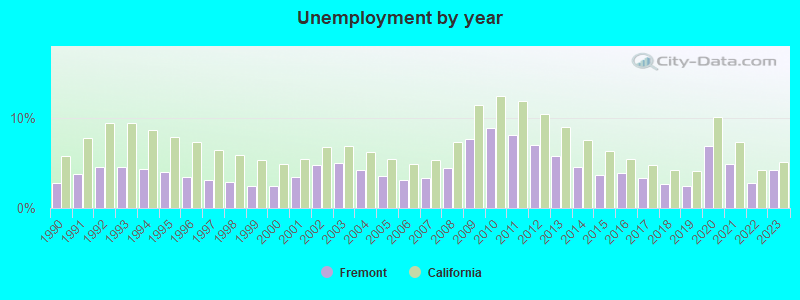
| Here: | 4.2% |
| California: | 5.1% |

Population change in the 1990s: +29,508 (+17.0%).

- Professional, scientific, technical services (17.2%)
- Computer & electronic products (11.3%)
- Health care (9.1%)
- Educational services (6.3%)
- Accommodation & food services (5.2%)
- Finance & insurance (4.8%)
- Construction (3.7%)
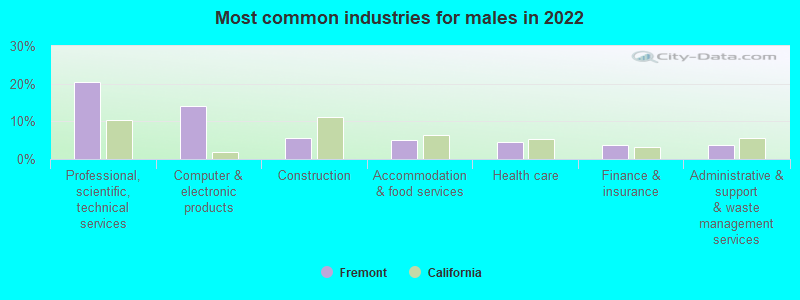
- Professional, scientific, technical services (20.4%)
- Computer & electronic products (14.2%)
- Construction (5.7%)
- Accommodation & food services (5.0%)
- Health care (4.5%)
- Finance & insurance (3.8%)
- Administrative & support & waste management services (3.7%)
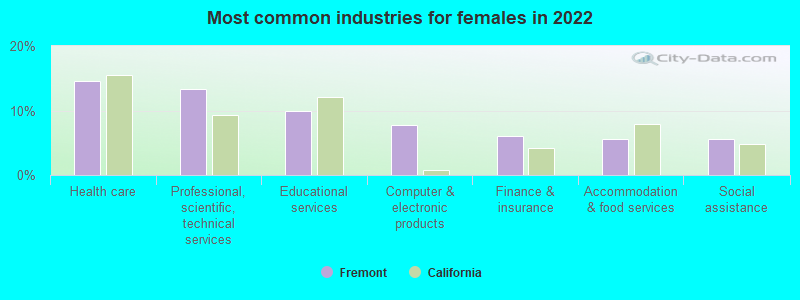
- Health care (14.6%)
- Professional, scientific, technical services (13.3%)
- Educational services (9.9%)
- Computer & electronic products (7.8%)
- Finance & insurance (6.1%)
- Accommodation & food services (5.6%)
- Social assistance (5.5%)
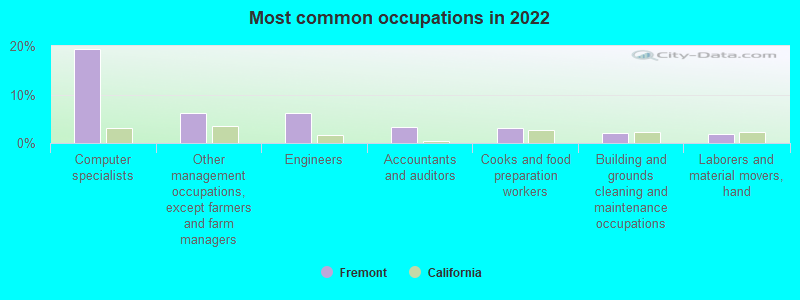
- Computer specialists (19.5%)
- Other management occupations, except farmers and farm managers (6.3%)
- Engineers (6.1%)
- Accountants and auditors (3.3%)
- Cooks and food preparation workers (3.1%)
- Building and grounds cleaning and maintenance occupations (2.1%)
- Laborers and material movers, hand (1.9%)
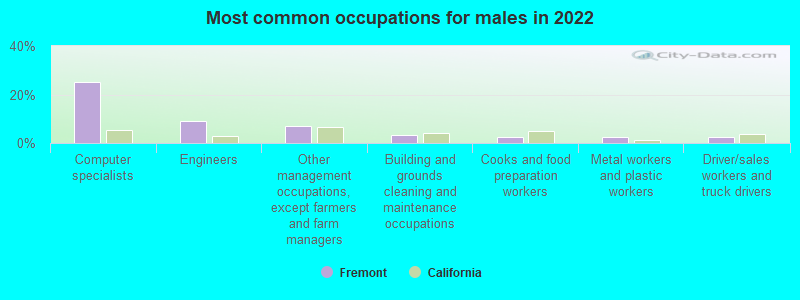
- Computer specialists (25.3%)
- Engineers (8.9%)
- Other management occupations, except farmers and farm managers (7.2%)
- Building and grounds cleaning and maintenance occupations (3.2%)
- Cooks and food preparation workers (2.7%)
- Metal workers and plastic workers (2.6%)
- Driver/sales workers and truck drivers (2.5%)
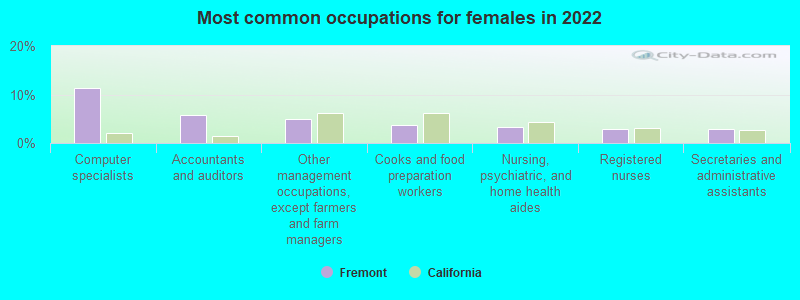
- Computer specialists (11.4%)
- Accountants and auditors (5.9%)
- Other management occupations, except farmers and farm managers (5.0%)
- Cooks and food preparation workers (3.7%)
- Nursing, psychiatric, and home health aides (3.2%)
- Registered nurses (3.0%)
- Secretaries and administrative assistants (2.8%)
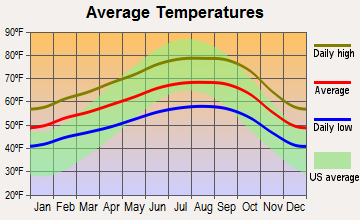
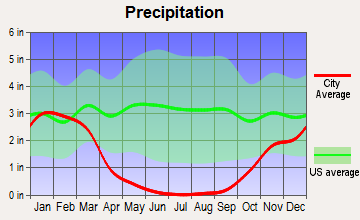
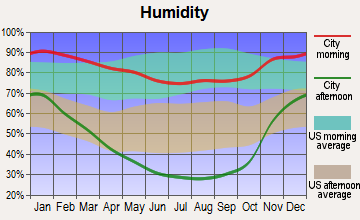
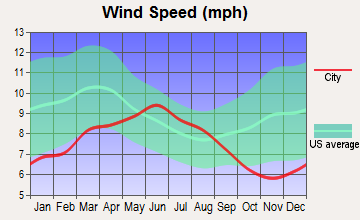
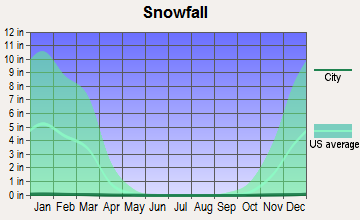
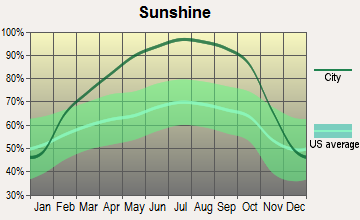
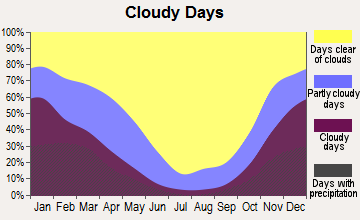
Average climate in Fremont, California
Based on data reported by over 4,000 weather stations
|
|

(lower is better)
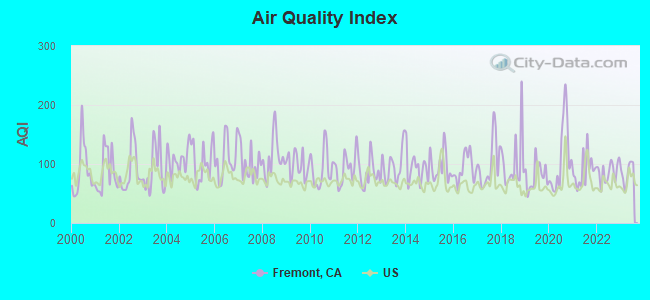
Air Quality Index (AQI) level in 2023 was 85.6. This is about average.
| City: | 85.6 |
| U.S.: | 72.6 |
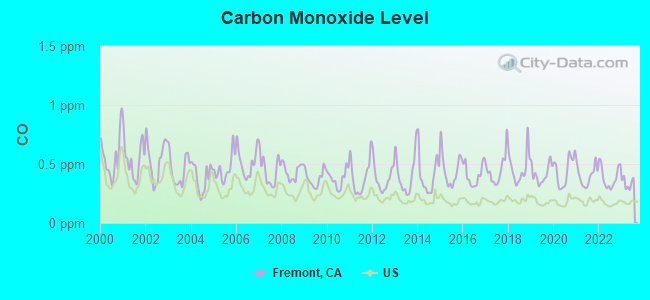
Carbon Monoxide (CO) [ppm] level in 2023 was 0.338. This is worse than average. Closest monitor was 1.3 miles away from the city center.
| City: | 0.338 |
| U.S.: | 0.251 |
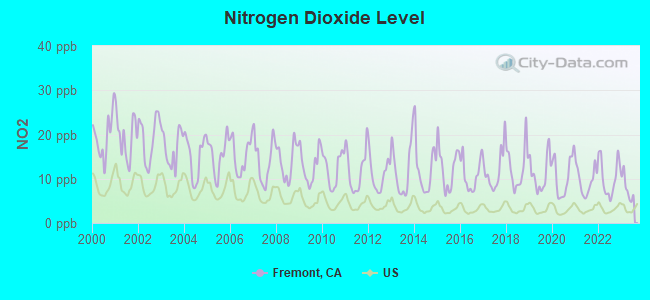
Nitrogen Dioxide (NO2) [ppb] level in 2023 was 7.87. This is significantly worse than average. Closest monitor was 1.3 miles away from the city center.
| City: | 7.87 |
| U.S.: | 5.11 |
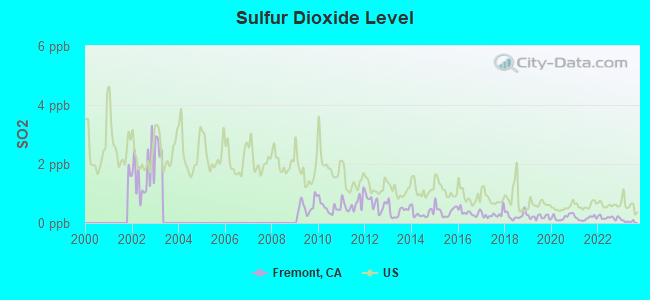
Sulfur Dioxide (SO2) [ppb] level in 2023 was 0.0611. This is significantly better than average. Closest monitor was 14.3 miles away from the city center.
| City: | 0.0611 |
| U.S.: | 1.5147 |
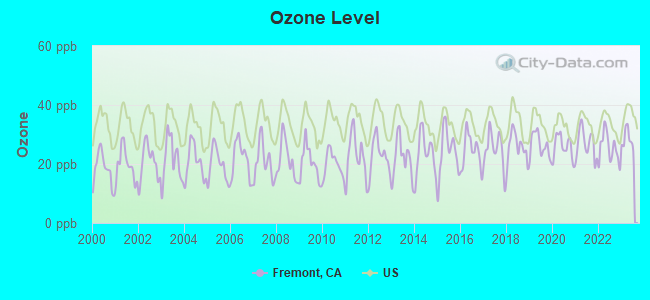
Ozone [ppb] level in 2023 was 28.4. This is about average. Closest monitor was 1.3 miles away from the city center.
| City: | 28.4 |
| U.S.: | 33.3 |
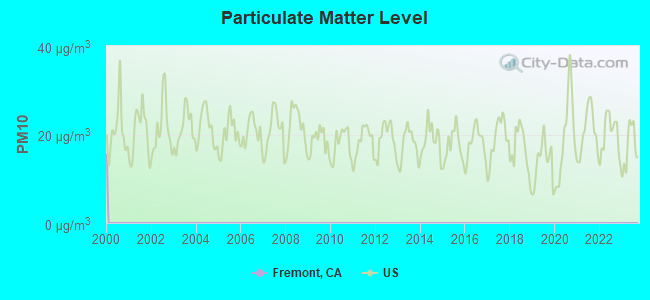
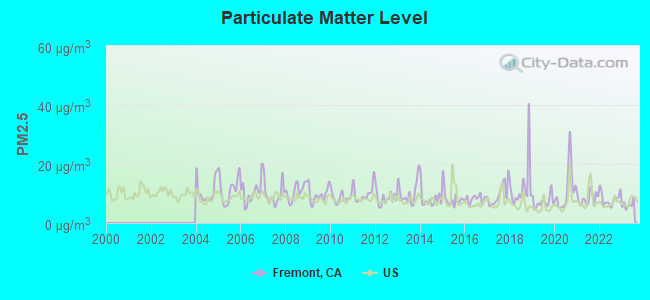
Particulate Matter (PM2.5) [µg/m3] level in 2023 was 6.14. This is better than average. Closest monitor was 1.3 miles away from the city center.
| City: | 6.14 |
| U.S.: | 8.11 |
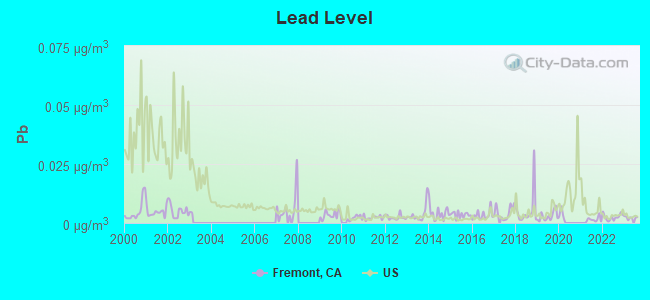
Lead (Pb) [µg/m3] level in 2023 was 0.00228. This is significantly better than average. Closest monitor was 1.3 miles away from the city center.
| City: | 0.00228 |
| U.S.: | 0.00931 |
Earthquake activity:
Fremont-area historical earthquake activity is significantly above California state average. It is 7667% greater than the overall U.S. average.On 4/18/1906 at 13:12:21, a magnitude 7.9 (7.9 UK, Class: Major, Intensity: VIII - XII) earthquake occurred 64.0 miles away from the city center, causing $524,000,000 total damage
On 10/18/1989 at 00:04:15, a magnitude 7.1 (6.5 MB, 7.1 MS, 6.9 MW, 7.0 ML) earthquake occurred 32.2 miles away from Fremont center, causing 62 deaths (62 shaking deaths) and 3757 injuries, causing $1,305,032,704 total damage
On 11/4/1927 at 13:51:53, a magnitude 7.5 (7.5 UK) earthquake occurred 189.4 miles away from the city center
On 7/21/1952 at 11:52:14, a magnitude 7.7 (7.7 UK) earthquake occurred 242.1 miles away from the city center, causing $50,000,000 total damage
On 1/31/1922 at 13:17:28, a magnitude 7.6 (7.6 UK) earthquake occurred 290.4 miles away from Fremont center
On 12/21/1932 at 06:10:09, a magnitude 7.2 (7.2 UK) earthquake occurred 222.7 miles away from the city center
Magnitude types: body-wave magnitude (MB), local magnitude (ML), surface-wave magnitude (MS), moment magnitude (MW)
Natural disasters:
The number of natural disasters in Alameda County (20) is greater than the US average (15).Major Disasters (Presidential) Declared: 14
Emergencies Declared: 2
Causes of natural disasters: Floods: 13, Storms: 7, Mudslides: 6, Winter Storms: 6, Landslides: 4, Fires: 2, Drought: 1, Earthquake: 1, Freeze: 1, Hurricane: 1, Tornado: 1, Other: 1 (Note: some incidents may be assigned to more than one category).
Main business address for: VA SOFTWARE CORP (SERVICES-PREPACKAGED SOFTWARE), ASYST TECHNOLOGIES INC /CA/ (SPECIAL INDUSTRY MACHINERY, NEC), VIRAGE LOGIC CORP (SEMICONDUCTORS & RELATED DEVICES), CREDENCE SYSTEMS CORP (INSTRUMENTS FOR MEAS & TESTING OF ELECTRICITY & ELEC SIGNALS), ACTIVCARD CORP (SERVICES-PREPACKAGED SOFTWARE), SOYO GROUP INC (ELECTRONIC COMPUTERS), ABGENIX INC (BIOLOGICAL PRODUCTS (NO DIAGNOSTIC SUBSTANCES)), CHIPPAC INC (SEMICONDUCTORS & RELATED DEVICES) and 27 other public companies.
Hospitals in Fremont:
- FREMONT HOSPITAL (39001 SUNDALE DRIVE)
- LITTLEFOOT HOUSE (180 LITTLEFOOT DRIVE)
- OMNI SURGI CENTER, LP (1860 MOWRY AVENUE, SUITE 402)
- SERRA CENTER SAN JUAN HOME (4253 SAN JUAN AVENUE)
- SERRA RESIDENTIAL CENTER, INC - BECERRA HOUSE (4235 BECERRA STREET)
- STANLEY HOUSE (4342 STANLEY AVENUE)
- WASHINGTON HOSPITAL (Government - Hospital District or Authority, 2000 MOWRY AVE)
Nursing Homes in Fremont:
- CRESTWOOD MANOR - FREMONT (4303 STEVENSON BLVD)
- CRESTWOOD TREATMENT CENTER (2171 MOWRY AVENUE)
- FREMONT HEALTHCARE CENTER (39022 PRESIDIO WAY)
- HILLSIDE SENIOR CARE (38650 MISSION BLVD)
- PARK CENTRAL CARE AND REHABILITATION CENTER (2100 PARKSIDE DRIVE)
- WESTWOOD (4303 STEVENSON BLVD)
- WINDSOR COUNTRY DRIVE CARE CENTER (2500 COUNTRY DRIVE)
- WINDSOR PARK CARE CENTER OF FREMONT (2400 PARKSIDE DRIVE)
Dialysis Facilities in Fremont:
- DAVITA FREMONT DIALYSIS (2599 STEVENSON BLVD)
- DAVITA FREMONT HOME TRAINING (39355 CALIFORNIA AVENUE)
- FMC FREMONT (39505 PASEO PADRE PARKWAY)
Home Health Centers in Fremont:
- AMERICAN HOME HEALTH CARE, LLC (39350 CIVIC CENTER DRIVE, SUITE 350)
- MANAGED CARE AT HOME (4510 PERALTA BOULEVARD, SUITE 21)
- NURSING RESOURCES (39111 PASEO PADRE PARKWAY, SUITE 319)
- PROFESSIONAL HOME CARE ASSOCIATES (2296 COUNTRY DRIVE)
- ST VINCENT'S HOME HEALTHCARE SERVICES (39245 LIBERTY ST, D8)
- WARM SPRINGS HOME HEALTH, INC (54 WHITNEY PLACE)
- WEST COAST HEALTHCARE SERVICE OF CA (1660 MOWRY AVE SUITE 302)
Heliports located in Fremont:
See details about Heliports located in Fremont, CAColleges/Universities in Fremont:
- Ohlone College (Full-time enrollment: 6,153; Location: 43600 Mission Blvd; Public; Website: www.ohlone.edu)
- Wyotech-Fremont (Full-time enrollment: 2,383; Location: 200 Whitney Place; Private, for-profit; Website: www.wyotech.edu/campus/fremont)
- Unitek College (Full-time enrollment: 1,119; Location: 4670 Auto Mall Pkwy; Private, for-profit; Website: unitekcollege.edu/)
- Northwestern Polytechnic University (Full-time enrollment: 685; Location: 47671 Westinghouse Drive; Private, not-for-profit; Website: www.npu.edu; Offers Doctor's degree)
Other colleges/universities with over 2000 students near Fremont:
- California State University-East Bay (about 9 miles; Hayward, CA; Full-time enrollment: 12,956)
- Chabot College (about 10 miles; Hayward, CA; FT enrollment: 7,610)
- Mission College (about 11 miles; Santa Clara, CA; FT enrollment: 5,625)
- Stanford University (about 14 miles; Stanford, CA; FT enrollment: 14,410)
- Santa Clara University (about 14 miles; Santa Clara, CA; FT enrollment: 7,640)
- Foothill College (about 15 miles; Los Altos Hills, CA; FT enrollment: 9,635)
- Las Positas College (about 16 miles; Livermore, CA; FT enrollment: 5,112)
Biggest public high schools in Fremont:
- MISSION SAN JOSE HIGH (Students: 1,576, Location: 41717 PALM AVE., Grades: 9-12)
- IRVINGTON HIGH (Students: 1,490, Location: 41800 BLACOW RD., Grades: 9-12)
- AMERICAN HIGH (Students: 1,447, Location: 36300 FREMONT BLVD., Grades: 9-12)
- WASHINGTON HIGH (Students: 1,412, Location: 38442 FREMONT BLVD., Grades: 9-12)
- JOHN F. KENNEDY HIGH (Students: 963, Location: 39999 BLACOW RD., Grades: 9-12)
- CALIFORNIA SCHOOL FOR THE DEAF-FREMONT (Students: 293, Location: 39350 GALLAUDET DR., Grades: KG-12)
- CIRCLE OF INDEPENDENT LEARNING (Students: 175, Location: 4700 CALAVERAS AVE., Grades: KG-12, Charter school)
- ROBERTSON HIGH (CONTINUATION) (Students: 94, Location: 4455 SENECA PARK AVE., Grades: 9-12)
- VISTA ALTERNATIVE (Students: 27, Location: 4455 SENECA PARK AVE., Grades: 7-12)
- CALIFORNIA SCHOOL FOR THE BLIND (Students: 25, Location: 500 WALNUT AVE., Grades: 1-12)
Private high schools in Fremont:
Biggest public elementary/middle schools in Fremont:
- WILLIAM HOPKINS JUNIOR HIGH (Students: 1,101, Location: 600 DRISCOLL RD., Grades: 7-8)
- THORNTON JUNIOR HIGH (Students: 974, Location: 4357 THORNTON AVE., Grades: 7-8)
- CENTERVILLE JUNIOR HIGH (Students: 917, Location: 37720 FREMONT BLVD., Grades: 7-8)
- JOHN M. HORNER JUNIOR HIGH (Students: 880, Location: 41365 CHAPEL WAY, Grades: 7-8)
- WARM SPRINGS ELEMENTARY (Students: 753, Location: 47370 WARM SPRINGS BLVD., Grades: 3-6)
- G. M. WALTERS JUNIOR HIGH (Students: 667, Location: 39600 LOGAN DR., Grades: 7-8)
- JOHN GOMES ELEMENTARY (Students: 639, Location: 555 LEMOS LN., Grades: KG-6)
- FOREST PARK ELEMENTARY (Students: 611, Location: 34400 MAYBIRD CIR., Grades: KG-6)
- PARKMONT ELEMENTARY (Students: 572, Location: 2601 PARKSIDE DR., Grades: KG-6)
- JOSHUA CHADBOURNE ELEMENTARY (Students: 563, Location: 801 PLYMOUTH AVE., Grades: KG-6)
Biggest private elementary/middle schools in Fremont:
- PRINCE OF PEACE LUTHERAN SCHOOL (Students: 376, Location: 38451 FREMONT BLVD, Grades: PK-8)
- KIMBER HILLS ACADEMY (Students: 350, Location: 39700 MISSION BLVD, Grades: PK-8)
- HOLY SPIRIT SCHOOL (Students: 306, Location: 3930 PARISH AVE, Grades: PK-8)
- MONTESSORI SCHOOL OF FREMONT (Students: 295, Location: 155 WASHINGTON BLVD, Grades: PK-6)
- ST JOSEPH SCHOOL (Students: 266, Location: 43222 MISSION BLVD, Grades: 1-8)
- NEW HORIZONS SCHOOL (Students: 223, Location: 2550 PERALTA BLVD, Grades: PK-8)
- OUR LADY OF GUADALUPE SCHOOL (Students: 223, Location: 40374 FREMONT BLVD, Grades: KG-8)
- PEACE TERRACE ACADEMY (Students: 103, Location: 33330 PEACE TER, Grades: PK-8)
- SCRIBBLES MONTESSORI SCHOOL (Students: 66, Location: 38660 LEXINGTON ST, Grades: PK-3)
- BETHEL CHRISTIAN ACADEMY (Students: 48, Location: 36060 FREMONT BLVD, Grades: KG-8)
Library in Fremont:
User-submitted facts and corrections:
- Anthony Oliver doesn't play from the Denver college anymore. He's now enrolled in a community college in Utah.
- Churches: Tri City Church of Religious Science Stevenson Blvd at Blacow Road...Fremont.
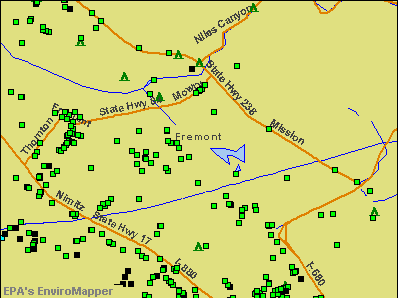
Points of interest:
Notable locations in Fremont: Weibel Vineyards (A), Federal Aviation Administration Communication Center (B), Vallejo Mill Ruins (C), Patterson Ranch (D), Landmark Letters (E), Irvington Pumping Station (F), Newark Substation (G), Curfew Hunting Lodge (H), South Alameda County Hall of Justice (I), Niles Community Center (J), Niles Branch Alameda County Library (K), Newark Branch Alameda County Library (L), Irvington Branch Alameda County Library (M), Hyde Community Center (N), Fremont Main Library (O), Fremont Community Center (P), Centerville Branch Alameda County Library (Q), Don Edwards San Francisco Bay National Wildlife Refuge Visitor Center (R), Fremont Fire Department Station 10 (S), Fremont Fire Department Station 4 (T). Display/hide their locations on the map
Shopping Centers: Warm Springs Plaza Shopping Center (1), Town Fair Shopping Center (2), The Crossroads Shopping Center (3), Oldtown Shopping Center (4), Newark Square Shopping Center (5), Newark Marketplace Shopping Center (6), New Park Plaza Shopping Center (7), New Park Mall Shopping Center (8), Mowry East Shopping Center (9). Display/hide their locations on the map
Main business address in Fremont include: VA SOFTWARE CORP (A), ASYST TECHNOLOGIES INC /CA/ (B), VIRAGE LOGIC CORP (C), CREDENCE SYSTEMS CORP (D), ACTIVCARD CORP (E), SOYO GROUP INC (F), ABGENIX INC (G), CHIPPAC INC (H). Display/hide their locations on the map
Churches in Fremont include: First Baptist Church (A), Emmanuel Mission Church (B), Church of Christ (C), Vedic Dharma Samaj Temple (D), Saint James Episcopal Church (E), Revival Tabernacle (F), Prince of Peace Lutheran Church (G), Our Lady of Guadalupe Church (H), Niles Congregational Church (I). Display/hide their locations on the map
Cemeteries: Saint Josephs Cemetery (1), Holy Ghost Cemetery (2), Cedar Lawn Memorial Cemetery (3), Presbyterian Cemetery (4), Mission San Jose Cemetery (5), Fremont Memorial Park (6), Ohlones Cemetery (7). Display/hide their locations on the map
Lakes and reservoirs: Lake Elizabeth (A), Tule Pond (B), Salt Pond A21 (C), Salt Pond A20 (D), Salt Pond A19 (E), Coyote Lagoon (F), Middlefield Reservoir (G), Mission Reservoir (H). Display/hide their locations on the map
Streams, rivers, and creeks: Cañada Del Aliso (A), Crandall Creek (B), Mission Creek (C), Toroges Creek (D), Leal Creek (E), Scott Creek (F), Plummer Creek (G), Agua Caliente Creek (H), Agua Fria Creek (I). Display/hide their locations on the map
Parks in Fremont include: Mission View Park (1), Eucalyptus Grove Park (2), George M Sullivan Recreation Complex (3), Don Edwards San Francisco Bay National Wildlife Refuge (4), Coyote Hills Regional Park (5), Alameda Creek Quarries Regional Park (6), Ardenwood Regional Preserve (7), Arroyo Agua Caliente Park (8), Ash Street Park (9). Display/hide their locations on the map
Tourist attractions: Alameda County Offices - Libraries- Fremont Libraries- Centerville Lib (Cultural Attractions- Events- & Facilities; 3801 Nicolet Avenue) (1), Alameda County Offices - Libraries- Fremont Libraries- Business Lib (Cultural Attractions- Events- & Facilities; 2450 Stevenson Boulevard) (2), Carts N' Golf (34805 Ardenwood Boulevard) (3), Avenir- Creative Business Marketing (4689 Frontenac Park Court) (4). Display/hide their approximate locations on the map
Hotels: Amerisuites Silicon Valley (3101 West Warren Avenue) (1), Bali-I Eco Resorts (952 Driscoll Road) (2), Best Western Garden Court Inn (5400 Mowry Avenue) (3), Belvoir Springs (36990 Mission Boulevard) (4). Display/hide their approximate locations on the map
Courts: Alameda County Offices - Court Appointed Special Advocates- Fremont Hall Of Jus (39439 Paseo Padre Parkway) (1), Alameda County Offices - Superior Court Of California County Of Alameda- Fremont Hall Of Jus (39439 Paseo Padre Parkway) (2). Display/hide their approximate locations on the map
Birthplace of: Don Hertzfeldt - Animator, Pat Tillman - Football player and soldier, Chris Carter (left-handed hitter) - Baseball player, Chris Rodd - Soccer player, Justin Medlock - College football player, Kevin Sakuda - Soccer player, Kevin Tan - Gymnast, Len Wiseman - Film director, Mary Biddinger - Poet, Meagan Tandy - Actor.
Drinking water stations with addresses in Fremont and their reported violations in the past:
AIR SAILING INC GLIDERPORT (Serves NV, Population served: 25, Groundwater):Past health violations:Past monitoring violations:
- MCL, Monthly (TCR) - In AUG-2010, Contaminant: Coliform. Follow-up actions: St Compliance achieved (OCT-14-2010)
- MCL, Monthly (TCR) - Between JUL-2010 and SEP-2010, Contaminant: Coliform. Follow-up actions: St Compliance achieved (OCT-14-2010)
- MCL, Monthly (TCR) - Between APR-2006 and JUN-2006, Contaminant: Coliform. Follow-up actions: St Compliance achieved (JUL-19-2006), St Public Notif received (JUL-19-2006), St Public Notif requested (JUL-20-2006), St Violation/Reminder Notice (JUL-20-2006), St Boil Water Order (JUL-20-2006)
- 2 routine major monitoring violations
Drinking water stations with addresses in Fremont that have no violations reported:
- ALAMEDA COUNTY WATER DISTRICT (Population served: 328,325, Primary Water Source Type: Surface water)
- LAKEVIEW TERRACE RESORT (Population served: 100, Primary Water Source Type: Groundwater)
- PONDEROSA PINES BAR & GRILL (Population served: 35, Primary Water Source Type: Groundwater)
| This city: | 3.0 people |
| California: | 2.9 people |
| This city: | 78.3% |
| Whole state: | 68.7% |
| This city: | 4.5% |
| Whole state: | 7.2% |
Likely homosexual households (counted as self-reported same-sex unmarried-partner households)
- Lesbian couples: 0.4% of all households
- Gay men: 0.3% of all households
People in group quarters in Fremont in 2010:
- 662 people in nursing facilities/skilled-nursing facilities
- 508 people in other noninstitutional facilities
- 264 people in group homes intended for adults
- 81 people in workers' group living quarters and job corps centers
- 74 people in residential treatment centers for adults
- 42 people in emergency and transitional shelters (with sleeping facilities) for people experiencing homelessness
- 11 people in group homes for juveniles (non-correctional)
- 6 people in correctional facilities intended for juveniles
- 3 people in in-patient hospice facilities
People in group quarters in Fremont in 2000:
- 489 people in other noninstitutional group quarters
- 484 people in nursing homes
- 213 people in homes for the mentally retarded
- 181 people in religious group quarters
- 116 people in mental (psychiatric) hospitals or wards
- 103 people in homes or halfway houses for drug/alcohol abuse
- 81 people in institutions for the blind
- 38 people in hospitals/wards and hospices for chronically ill
- 38 people in hospices or homes for chronically ill
- 30 people in halfway houses
- 18 people in homes for the mentally ill
- 6 people in local jails and other confinement facilities (including police lockups)
Banks with most branches in Fremont (2011 data):
- U.S. Bank National Association: 7 branches. Info updated 2012/01/30: Bank assets: $330,470.8 mil, Deposits: $236,091.5 mil, headquarters in Cincinnati, OH, positive income, 3121 total offices, Holding Company: U.S. Bancorp
- JPMorgan Chase Bank, National Association: Paseo Padre & Mowry Raleys Banking C, Mowry Avenue & Farwell Lucky Banking, Fremont - Pacific Commons Branch, 39395 Paseo Padre Parkway Branch, Fremont Branch, Fremont Irvington Branch. Info updated 2011/11/10: Bank assets: $1,811,678.0 mil, Deposits: $1,190,738.0 mil, headquarters in Columbus, OH, positive income, International Specialization, 5577 total offices, Holding Company: Jpmorgan Chase & Co.
- Bank of America, National Association: Fremont-Beacon Branch, Irvington Branch, Warm Springs Branch, Mission San Jose Branch. Info updated 2009/11/18: Bank assets: $1,451,969.3 mil, Deposits: $1,077,176.8 mil, headquarters in Charlotte, NC, positive income, 5782 total offices, Holding Company: Bank Of America Corporation
- Fremont Bank: Brookvale Branch, Mission Valley Branch, Warm Springs Branch, at 39150 Fremont Boulevard. Info updated 2006/11/03: Bank assets: $2,367.9 mil, Deposits: $1,975.1 mil, local headquarters, positive income, Commercial Lending Specialization, 19 total offices, Holding Company: Fremont Bancorporation
- Wells Fargo Bank, National Association: Freemont/Irvington Branch, Paseo Padre Branch, Warm Springs Branch, Mowry Landing. Info updated 2011/04/05: Bank assets: $1,161,490.0 mil, Deposits: $905,653.0 mil, headquarters in Sioux Falls, SD, positive income, 6395 total offices, Holding Company: Wells Fargo & Company
- East West Bank: Fremont Branch, Fremont Mission Blvd. Branch, Fremont Branch. Info updated 2010/06/14: Bank assets: $21,962.4 mil, Deposits: $17,501.8 mil, headquarters in Pasadena, CA, positive income, Commercial Lending Specialization, 131 total offices, Holding Company: East West Bancorp, Inc.
- HSBC Bank USA, National Association: Warm Springs Branch at 46750 Mission Boulevard, branch established on 2006/11/09; Fremont Boulevard Branch at 39410 Fremont Boulevard, branch established on 2006/10/23. Info updated 2010/11/30: Bank assets: $206,009.7 mil, Deposits: $149,026.8 mil, headquarters in Mc Lean, VA, positive income, 474 total offices, Holding Company: Hsbc Holdings Plc
- Citibank, National Association: Fremont Auto-Mall Branch at 43804 Christy Street, branch established on 2006/08/28; 39138 Fremont Blvd Branch at 39138 Fremont Blvd, branch established on 1935/08/01. Info updated 2012/01/10: Bank assets: $1,288,658.0 mil, Deposits: $882,541.0 mil, headquarters in Sioux Falls, SD, positive income, International Specialization, 1048 total offices, Holding Company: Citigroup Inc.
- Bank of the West: Paseo Padre Branch at 39533 Paseo Padre Parkway, branch established on 1961/02/27; Fremont Branch at 5120 Mowry Avenue, branch established on 1981/05/05. Info updated 2009/11/16: Bank assets: $62,408.3 mil, Deposits: $43,995.2 mil, headquarters in San Francisco, CA, positive income, 647 total offices, Holding Company: Bnp Paribas
- 11 other banks with 11 local branches
For population 15 years and over in Fremont:
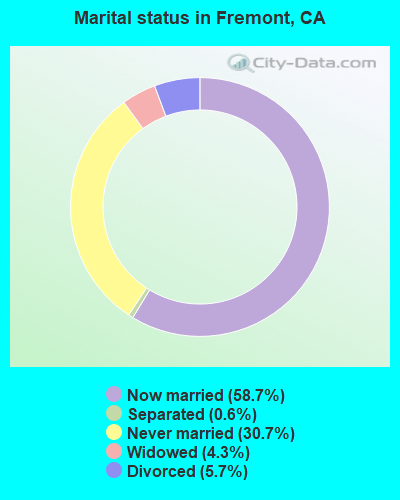
- Never married: 30.7%
- Now married: 58.7%
- Separated: 0.6%
- Widowed: 4.3%
- Divorced: 5.7%
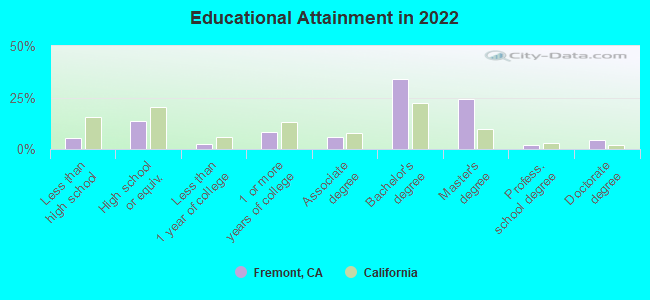
For population 25 years and over in Fremont:
- High school or higher: 94.6%
- Bachelor's degree or higher: 64.3%
- Graduate or professional degree: 30.4%
- Unemployed: 3.9%
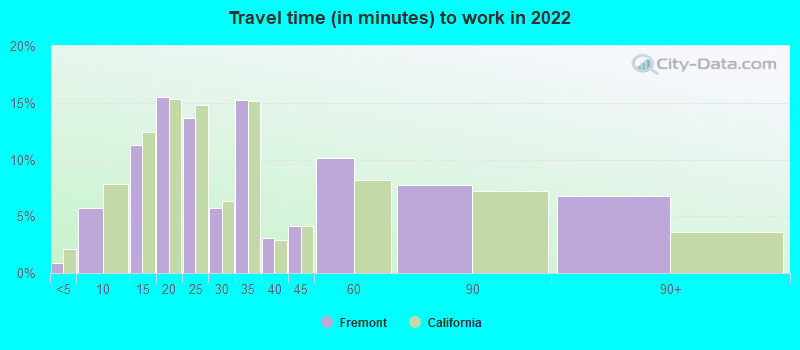
- Mean travel time to work (commute): 17.6 minutes
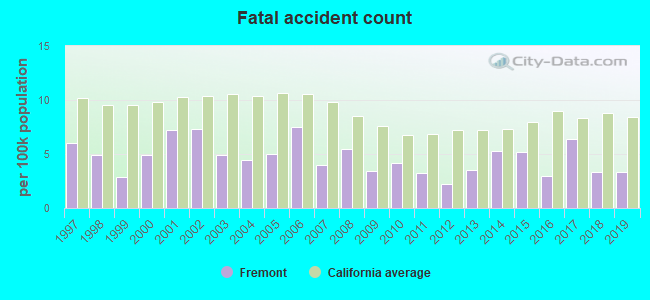
| Here: | 11.2 |
| California average: | 15.5 |
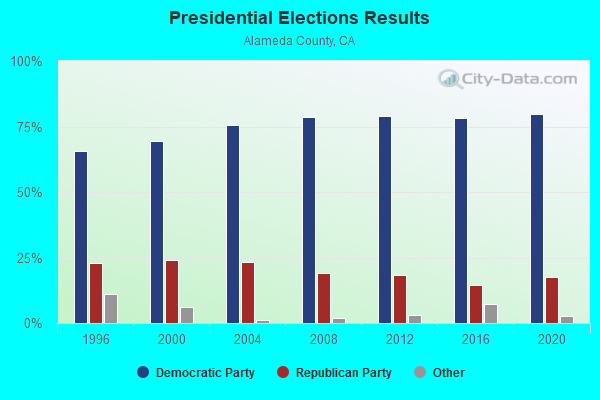
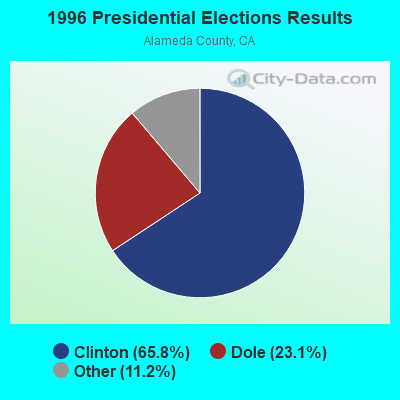
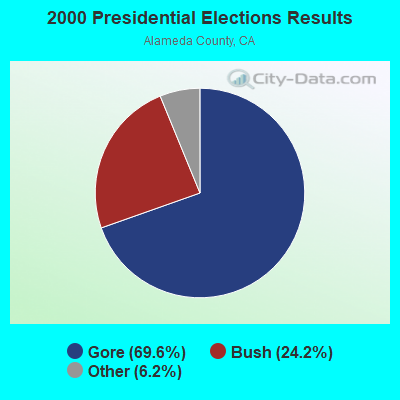
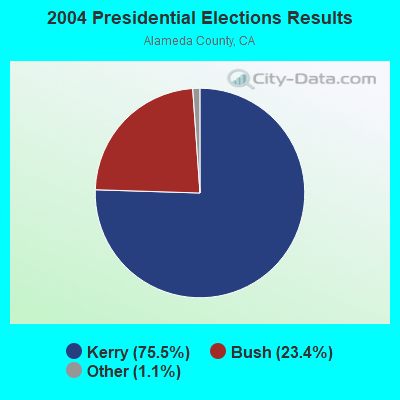
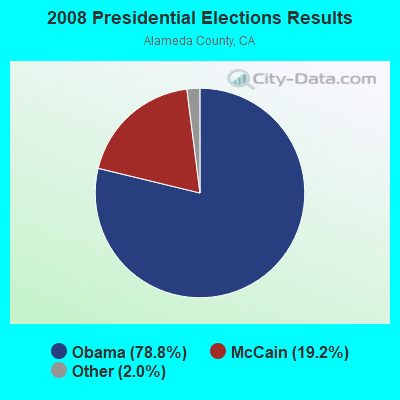

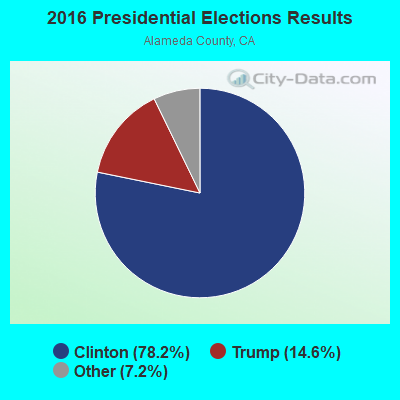
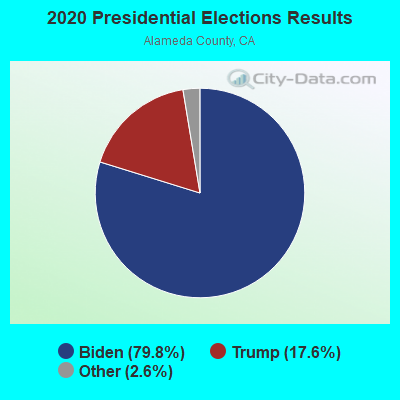
Graphs represent county-level data. Detailed 2008 Election Results
Neighborhoods in Fremont:
(Fremont, California Neighborhood Map)Religion statistics for Fremont, CA (based on Alameda County data)
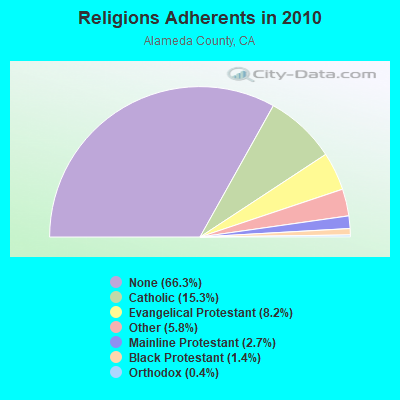
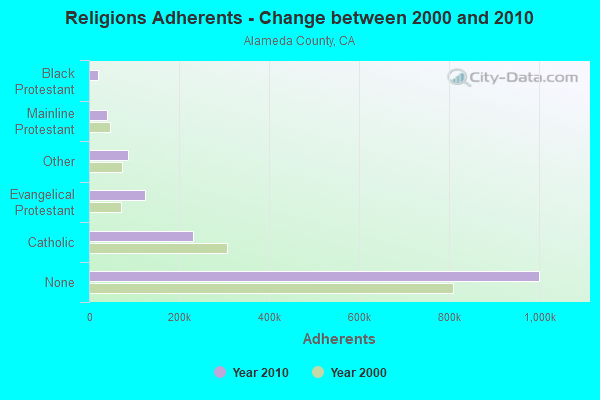
| Religion | Adherents | Congregations |
|---|---|---|
| Catholic | 231,500 | 53 |
| Evangelical Protestant | 123,422 | 538 |
| Other | 87,110 | 227 |
| Mainline Protestant | 40,185 | 181 |
| Black Protestant | 20,716 | 76 |
| Orthodox | 6,640 | 16 |
| None | 1,000,698 | - |
Food Environment Statistics:
| Here: | 2.50 / 10,000 pop. |
| California: | 2.14 / 10,000 pop. |
| This county: | 0.03 / 10,000 pop. |
| California: | 0.04 / 10,000 pop. |
| This county: | 0.67 / 10,000 pop. |
| State: | 0.62 / 10,000 pop. |
| Here: | 1.60 / 10,000 pop. |
| California: | 1.49 / 10,000 pop. |
| Alameda County: | 8.94 / 10,000 pop. |
| California: | 7.42 / 10,000 pop. |
| Alameda County: | 6.9% |
| California: | 7.3% |
| Alameda County: | 19.3% |
| California: | 21.3% |
| This county: | 16.6% |
| California: | 17.9% |
Health and Nutrition:
| This city: | 54.3% |
| California: | 49.4% |
| Fremont: | 51.5% |
| California: | 48.0% |
| Here: | 27.0 |
| California: | 28.1 |
| This city: | 17.1% |
| State: | 20.2% |
| Fremont: | 15.3% |
| State: | 11.2% |
| Fremont: | 6.8 |
| California: | 6.8 |
| Here: | 27.6% |
| State: | 31.5% |
| Fremont: | 59.5% |
| California: | 56.4% |
| Fremont: | 82.7% |
| California: | 80.9% |
More about Health and Nutrition of Fremont, CA Residents
| Local government employment and payroll (March 2022) | |||||
| Function | Full-time employees | Monthly full-time payroll | Average yearly full-time wage | Part-time employees | Monthly part-time payroll |
|---|---|---|---|---|---|
| Police Protection - Officers | 190 | $2,936,719 | $185,477 | 0 | $0 |
| Firefighters | 119 | $2,158,329 | $217,647 | 0 | $0 |
| Streets and Highways | 85 | $966,970 | $136,513 | 6 | $18,846 |
| Other Government Administration | 74 | $785,436 | $127,368 | 2 | $4,739 |
| Police - Other | 70 | $810,480 | $138,939 | 19 | $31,808 |
| Financial Administration | 65 | $727,039 | $134,223 | 2 | $8,959 |
| Parks and Recreation | 64 | $529,418 | $99,266 | 90 | $106,915 |
| Other and Unallocable | 48 | $465,009 | $116,252 | 0 | $0 |
| Welfare | 44 | $384,086 | $104,751 | 24 | $85,719 |
| Fire - Other | 35 | $522,428 | $179,118 | 0 | $0 |
| Health | 29 | $235,695 | $97,529 | 15 | $32,448 |
| Solid Waste Management | 18 | $148,829 | $99,219 | 0 | $0 |
| Housing and Community Development (Local) | 11 | $134,119 | $146,312 | 0 | $0 |
| Judicial and Legal | 10 | $146,871 | $176,245 | 0 | $0 |
| Natural Resources | 6 | $55,105 | $110,210 | 0 | $0 |
| Totals for Government | 868 | $11,006,530 | $152,164 | 158 | $289,434 |
Fremont government finances - Expenditure in 2021 (per resident):
- Construction - General - Other: $15,329,000 ($68.47)
Housing and Community Development: $11,464,000 ($51.21)
Regular Highways: $3,259,000 ($14.56)
Health - Other: $1,686,000 ($7.53)
Public Welfare - Other: $1,538,000 ($6.87)
Police Protection: $952,000 ($4.25)
- Current Operations - Police Protection: $92,091,000 ($411.36)
Regular Highways: $82,374,000 ($367.95)
Local Fire Protection: $55,165,000 ($246.41)
Central Staff Services: $20,224,000 ($90.34)
Health - Other: $18,788,000 ($83.92)
Protective Inspection and Regulation - Other: $15,979,000 ($71.38)
Solid Waste Management: $11,265,000 ($50.32)
Housing and Community Development: $8,527,000 ($38.09)
Parks and Recreation: $6,748,000 ($30.14)
Financial Administration: $5,143,000 ($22.97)
Judicial and Legal Services: $2,783,000 ($12.43)
Public Welfare - Other: $464,000 ($2.07)
Transit Utilities: $155,000 ($0.69)
- General - Interest on Debt: $14,780,000 ($66.02)
- Other Capital Outlay - Police Protection: $908,000 ($4.06)
General - Other: $806,000 ($3.60)
Public Welfare - Other: $148,000 ($0.66)
Judicial and Legal Services: $52,000 ($0.23)
Local Fire Protection: $44,000 ($0.20)
Fremont government finances - Revenue in 2021 (per resident):
- Charges - Other: $20,090,000 ($89.74)
Solid Waste Management: $11,481,000 ($51.28)
Housing and Community Development: $2,271,000 ($10.14)
Parks and Recreation: $1,850,000 ($8.26)
Regular Highways: $783,000 ($3.50)
- Federal Intergovernmental - Other: $31,848,000 ($142.26)
Housing and Community Development: $3,476,000 ($15.53)
- Local Intergovernmental - Other: $625,000 ($2.79)
Public Welfare: $5,000 ($0.02)
- Miscellaneous - General Revenue - Other: $30,017,000 ($134.08)
Donations From Private Sources: $2,273,000 ($10.15)
Rents: $1,784,000 ($7.97)
Fines and Forfeits: $1,056,000 ($4.72)
Interest Earnings: $1,020,000 ($4.56)
Sale of Property: $143,000 ($0.64)
- Revenue - Transit Utilities: $223,000 ($1.00)
- State Intergovernmental - Other: $22,380,000 ($99.97)
Highways: $9,403,000 ($42.00)
General Local Government Support: $451,000 ($2.01)
- Tax - Property: $115,355,000 ($515.27)
General Sales and Gross Receipts: $66,125,000 ($295.37)
Other License: $55,004,000 ($245.70)
Public Utilities Sales: $11,058,000 ($49.39)
Occupation and Business License - Other: $9,774,000 ($43.66)
Other: $4,164,000 ($18.60)
Other Selective Sales: $2,848,000 ($12.72)
Documentary and Stock Transfer: $2,282,000 ($10.19)
Fremont government finances - Debt in 2021 (per resident):
- Long Term Debt - Beginning Outstanding - Unspecified Public Purpose: $360,892,000 ($1612.05)
Outstanding Unspecified Public Purpose: $334,751,000 ($1495.29)
Beginning Outstanding - Public Debt for Private Purpose: $28,247,000 ($126.18)
Retired Unspecified Public Purpose: $26,140,000 ($116.76)
Outstanding Nonguaranteed - Industrial Revenue: $25,247,000 ($112.77)
Retired Nonguaranteed - Public Debt for Private Purpose: $3,000,000 ($13.40)
Fremont government finances - Cash and Securities in 2021 (per resident):
- Bond Funds - Cash and Securities: $222,994,000 ($996.08)
- Other Funds - Cash and Securities: $232,629,000 ($1039.12)
- Sinking Funds - Cash and Securities: $27,910,000 ($124.67)
6.77% of this county's 2021 resident taxpayers lived in other counties in 2020 ($121,106 average adjusted gross income)
| Here: | 6.77% |
| California average: | 5.19% |
0.01% of residents moved from foreign countries ($76 average AGI)
Alameda County: 0.01% California average: 0.03%
Top counties from which taxpayers relocated into this county between 2020 and 2021:
| from Santa Clara County, CA | |
| from San Francisco County, CA | |
| from Contra Costa County, CA |
8.96% of this county's 2020 resident taxpayers moved to other counties in 2021 ($131,786 average adjusted gross income)
| Here: | 8.96% |
| California average: | 6.14% |
0.01% of residents moved to foreign countries ($103 average AGI)
Alameda County: 0.01% California average: 0.02%
Top counties to which taxpayers relocated from this county between 2020 and 2021:
| to Contra Costa County, CA | |
| to Santa Clara County, CA | |
| to San Francisco County, CA |
| Businesses in Fremont, CA | ||||
| Name | Count | Name | Count | |
|---|---|---|---|---|
| 24 Hour Fitness | 2 | Kroger | 3 | |
| 7-Eleven | 10 | La Quinta | 1 | |
| 99 Cents Only Stores | 1 | Lane Bryant | 1 | |
| AT&T | 2 | Lane Furniture | 1 | |
| Ace Hardware | 2 | Little Caesars Pizza | 2 | |
| Applebee's | 2 | Lowe's | 1 | |
| Ashley Furniture | 1 | Marriott | 2 | |
| AutoZone | 1 | Marshalls | 1 | |
| Avenue | 1 | MasterBrand Cabinets | 1 | |
| BMW | 1 | McDonald's | 7 | |
| Bally Total Fitness | 1 | Motel 6 | 2 | |
| Baskin-Robbins | 3 | New Balance | 2 | |
| Bed Bath & Beyond | 1 | Nike | 3 | |
| Best Western | 1 | Nissan | 1 | |
| Big O Tires | 2 | OfficeMax | 1 | |
| Blockbuster | 2 | Old Navy | 1 | |
| Budget Car Rental | 1 | Olive Garden | 1 | |
| Burger King | 4 | Outback | 1 | |
| CVS | 4 | Outback Steakhouse | 1 | |
| Carl\s Jr. | 2 | Panda Express | 2 | |
| Casual Male XL | 1 | Panera Bread | 2 | |
| Chevrolet | 1 | Papa John's Pizza | 1 | |
| Chipotle | 2 | Payless | 1 | |
| Circle K | 1 | PetSmart | 1 | |
| Cold Stone Creamery | 2 | Pier 1 Imports | 1 | |
| Comfort Inn | 1 | Pizza Hut | 2 | |
| Costco | 1 | Quiznos | 3 | |
| Curves | 2 | RadioShack | 2 | |
| DHL | 5 | Red Lobster | 1 | |
| Days Inn | 1 | Rite Aid | 1 | |
| Dennys | 2 | SAS Shoes | 1 | |
| Discount Tire | 1 | Safeway | 3 | |
| Domino's Pizza | 2 | Sears | 1 | |
| Extended Stay America | 2 | Sprint Nextel | 2 | |
| Extended Stay Deluxe | 1 | Staples | 1 | |
| FedEx | 17 | Starbucks | 13 | |
| Firestone Complete Auto Care | 1 | Subway | 12 | |
| GNC | 1 | T-Mobile | 2 | |
| GameStop | 2 | Taco Bell | 4 | |
| H&R Block | 3 | Target | 1 | |
| Hilton | 1 | The Room Place | 1 | |
| Holiday Inn | 1 | Toyota | 1 | |
| Home Depot | 1 | Trader Joe's | 1 | |
| Homestead Studio Suites | 1 | U-Haul | 6 | |
| Honda | 1 | UPS | 17 | |
| Hyatt | 1 | Verizon Wireless | 3 | |
| Jack In The Box | 7 | Vons | 3 | |
| Jamba Juice | 3 | Walgreens | 4 | |
| Jones New York | 1 | Walmart | 2 | |
| KFC | 3 | Wendy's | 2 | |
| Kohl's | 1 | YMCA | 1 | |
Strongest AM radio stations in Fremont:
- KGO (810 AM; 50 kW; SAN FRANCISCO, CA; Owner: KGO-AM RADIO, INC.)
- KNBR (680 AM; 50 kW; SAN FRANCISCO, CA; Owner: KNBR LICO, INC.)
- KFAX (1100 AM; 50 kW; SAN FRANCISCO, CA; Owner: GOLDEN GATE BROADCASTING CO, INC.)
- KTCT (1050 AM; 50 kW; SAN MATEO, CA; Owner: SUSQUEHANNA RADIO CORP.)
- KYCY (1550 AM; 50 kW; SAN FRANCISCO, CA; Owner: INFINITY BROADCASTING OPERATIONS, INC.)
- KLOK (1170 AM; 50 kW; SAN JOSE, CA; Owner: ENTRAVISION HOLDINGS, LLC)
- KTRB (860 AM; 50 kW; MODESTO, CA; Owner: PAPPAS RADIO OF CALIFORNIA, A CALIFORNIA LIMITED PARTNERSHIP)
- KIQI (1010 AM; 35 kW; SAN FRANCISCO, CA; Owner: RADIO UNICA OF SAN FRANCISCO LICENSE CORP.)
- KSFB (1220 AM; 5 kW; PALO ALTO, CA; Owner: SCA-PALO ALTO, LLC)
- KSJX (1500 AM; 10 kW; SAN JOSE, CA; Owner: MULTICULTURAL RADIO BROADCASTING INC)
- KCBS (740 AM; 50 kW; SAN FRANCISCO, CA; Owner: INFINITY BROADCASTING OPERATIONS, INC.)
- KNEW (910 AM; 20 kW; OAKLAND, CA; Owner: AMFM RADIO LICENSES, L.L.C.)
- KZSF (1370 AM; 5 kW; SAN JOSE, CA; Owner: CARLOS A. DUHARTE)
Strongest FM radio stations in Fremont:
- KZBR-FM2 (95.7 FM; LIVERMORE, ETC., CA; Owner: BONNEVILLE HOLDING COMPANY)
- KOHL (89.3 FM; FREMONT, CA; Owner: FREMONT-NEWARK COMMUNITY COLL. DIST.)
- KKSF-FM1 (103.7 FM; PLEASANTON, ETC., CA; Owner: AMFM RADIO LICENSES, L.L.C.)
- KFRC-FM3 (99.7 FM; WALNUT CREEK, CA; Owner: INFINITY KFRC-FM, INC.)
- KZBR-FM1 (95.7 FM; WALNUT CREEK, CA; Owner: BONNEVILLE HOLDING COMPANY)
- KBLX-FM2 (102.9 FM; PLEASANTON, CA; Owner: ICBC BROADCAST HOLDINGS -CA, INC.)
- KSOL-FM3 (98.9 FM; PLEASANTON, CA; Owner: TMS LICENSE CALIFORNIA, INC)
- KISQ-FM3 (98.1 FM; CONCORD, CA; Owner: AMFM RADIO LICENSES, L.L.C.)
- KFJC (89.7 FM; LOS ALTOS, CA; Owner: FOOTHILL-DE ANZA COMM. COLLEGE DIST.)
- KMEL-FM1 (106.1 FM; CONCORD, CA; Owner: AMFM RADIO LICENSES, L.L.C.)
- KBAA (94.5 FM; GILROY, CA; Owner: INFINITY RADIO OPERATIONS INC.)
- KSQL (99.1 FM; SANTA CRUZ, CA; Owner: TMS LICENSE CALIFORNIA, INC)
- KKUP (91.5 FM; CUPERTINO, CA; Owner: ASSURANCE SCIENCES FOUNDATION)
- KBRG (100.3 FM; SAN JOSE, CA; Owner: ENTRAVISION HOLDINGS, LLC)
- K238AC (95.5 FM; SALIDA, CA; Owner: FAMILY STATIONS, INC.)
- KOIT-FM (96.5 FM; SAN FRANCISCO, CA; Owner: BONNEVILLE HOLDING COMPANY)
- KKSF (103.7 FM; SAN FRANCISCO, CA; Owner: AMFM RADIO LICENSES, L.L.C.)
- KFOG (104.5 FM; SAN FRANCISCO, CA; Owner: KFFG LICO, INC)
- KUOP (91.3 FM; STOCKTON, CA; Owner: UNIVERSITY OF THE PACIFIC)
- KYLD (94.9 FM; SAN FRANCISCO, CA; Owner: AMFM RADIO LICENSES, L.L.C.)
TV broadcast stations around Fremont:
- KBIT-CA (Channel 28; SAN FRANCISCO, ETC., CA; Owner: POLAR BROADCASTING, INC.)
- KICU-TV (Channel 36; SAN JOSE, CA; Owner: KTVU PARTNERSHIP)
- KDTV (Channel 14; SAN FRANCISCO, CA; Owner: KDTV LICENSE PARTNERSHIP, G.P.)
- KSTS (Channel 48; SAN JOSE, CA; Owner: TELEMUNDO OF NORTHERN CALIFORNIA LICENSE CORP.)
- KTEH (Channel 54; SAN JOSE, CA; Owner: KTEH FOUNDATION)
- KQED (Channel 9; SAN FRANCISCO, CA; Owner: KQED, INC.)
- KGO-TV (Channel 7; SAN FRANCISCO, CA; Owner: KGO TELEVISION, INC.)
- KPIX-TV (Channel 5; SAN FRANCISCO, CA; Owner: CBS BROADCASTING INC.)
- KTVU (Channel 2; OAKLAND, CA; Owner: KTVU PARTNERSHIP)
- KRON-TV (Channel 4; SAN FRANCISCO, CA; Owner: YOUNG BROADCASTING OF SAN FRANCISCO, INC.)
- KMTP-TV (Channel 32; SAN FRANCISCO, CA; Owner: MINORITY TELEVISION PROJECT)
- KOVR (Channel 13; STOCKTON, CA; Owner: SCI - SACRAMENTO LICENSEE, LLC)
- KXTV (Channel 10; SACRAMENTO, CA; Owner: KXTV, INC.)
- KBHK-TV (Channel 44; SAN FRANCISCO, CA; Owner: VIACOM TELEVISION STATIONS GROUP OF SAN FRANCISCO INC.)
- KSPX (Channel 29; SACRAMENTO, CA; Owner: PAXSON SACRAMENTO LICENSE, INC.)
- KUVS (Channel 19; MODESTO, CA; Owner: KUVS LICENSE PARTNERSHIP, G.P.)
- KTXL (Channel 40; SACRAMENTO, CA; Owner: CHANNEL 40, INC.)
- KBWB (Channel 20; SAN FRANCISCO, CA; Owner: KBWB LICENSE, INC.)
- KQCA (Channel 58; STOCKTON, CA; Owner: KCRA HEARST-ARGYLE TELEVISION, INC.)
- KFSF (Channel 66; VALLEJO, CA; Owner: TELEFUTURA SAN FRANCISCO LLC)
- KVIE (Channel 6; SACRAMENTO, CA; Owner: KVIE, INC.)
- KCSM-TV (Channel 60; SAN MATEO, CA; Owner: SAN MATEO COUNTY COMMUNITY COLLEGE DISTRICT)
- KMAX-TV (Channel 31; SACRAMENTO, CA; Owner: UPN STATIONS GROUP INC.)
- KCNS (Channel 38; SAN FRANCISCO, CA; Owner: WRAY, INC.)
- National Bridge Inventory (NBI) Statistics
- 138Number of bridges
- 2,103ft / 641mTotal length
- $17,179,000Total costs
- 8,418,736Total average daily traffic
- 644,736Total average daily truck traffic
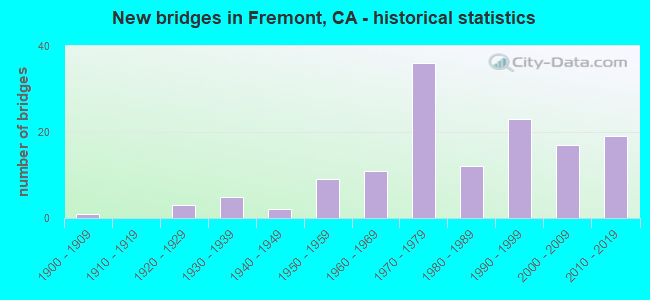
- New bridges - historical statistics
- 11900-1909
- 31920-1929
- 51930-1939
- 21940-1949
- 91950-1959
- 111960-1969
- 361970-1979
- 121980-1989
- 231990-1999
- 172000-2009
- 192010-2019
FCC Registered Antenna Towers: 135 (See the full list of FCC Registered Antenna Towers)
FCC Registered Commercial Land Mobile Towers: 1 (See the full list of FCC Registered Commercial Land Mobile Towers in Fremont, CA)
FCC Registered Private Land Mobile Towers: 15 (See the full list of FCC Registered Private Land Mobile Towers)
FCC Registered Broadcast Land Mobile Towers: 127 (See the full list of FCC Registered Broadcast Land Mobile Towers)
FCC Registered Microwave Towers: 266 (See the full list of FCC Registered Microwave Towers in this town)
FCC Registered Paging Towers: 7 (See the full list of FCC Registered Paging Towers)
FCC Registered Amateur Radio Licenses: 1,457 (See the full list of FCC Registered Amateur Radio Licenses in Fremont)
FAA Registered Aircraft Manufacturers and Dealers: 2 (See the full list of FAA Registered Manufacturers and Dealers in Fremont)
FAA Registered Aircraft: 54 (See the full list of FAA Registered Aircraft)
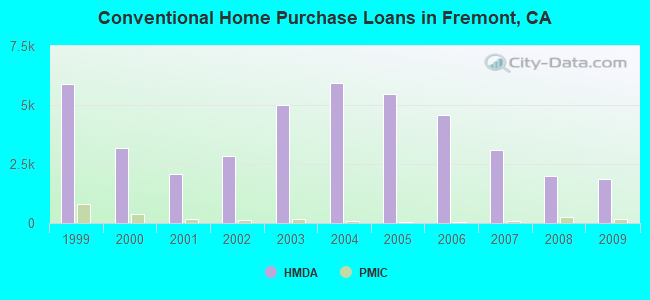
| Home Mortgage Disclosure Act Aggregated Statistics For Year 2009 (Based on 41 full tracts) | ||||||||||||||
| A) FHA, FSA/RHS & VA Home Purchase Loans | B) Conventional Home Purchase Loans | C) Refinancings | D) Home Improvement Loans | E) Loans on Dwellings For 5+ Families | F) Non-occupant Loans on < 5 Family Dwellings (A B C & D) | G) Loans On Manufactured Home Dwelling (A B C & D) | ||||||||
|---|---|---|---|---|---|---|---|---|---|---|---|---|---|---|
| Number | Average Value | Number | Average Value | Number | Average Value | Number | Average Value | Number | Average Value | Number | Average Value | Number | Average Value | |
| LOANS ORIGINATED | 425 | $385,016 | 1,861 | $378,134 | 10,793 | $345,354 | 331 | $269,738 | 11 | $9,048,818 | 474 | $268,344 | 2 | $66,500 |
| APPLICATIONS APPROVED, NOT ACCEPTED | 36 | $408,998 | 306 | $372,392 | 1,580 | $384,273 | 39 | $235,076 | 0 | $0 | 83 | $245,551 | 6 | $58,333 |
| APPLICATIONS DENIED | 88 | $395,521 | 363 | $372,446 | 2,338 | $401,873 | 99 | $147,242 | 2 | $637,500 | 169 | $282,525 | 17 | $108,353 |
| APPLICATIONS WITHDRAWN | 89 | $398,997 | 347 | $356,522 | 1,517 | $376,156 | 64 | $203,155 | 1 | $1,437,000 | 108 | $254,962 | 3 | $75,333 |
| FILES CLOSED FOR INCOMPLETENESS | 14 | $340,000 | 58 | $412,342 | 554 | $387,251 | 20 | $124,000 | 1 | $625,000 | 25 | $209,600 | 1 | $250,000 |
Detailed mortgage data for all 41 tracts in Fremont, CA
| Private Mortgage Insurance Companies Aggregated Statistics For Year 2009 (Based on 38 full tracts) | ||||
| A) Conventional Home Purchase Loans | B) Refinancings | |||
|---|---|---|---|---|
| Number | Average Value | Number | Average Value | |
| LOANS ORIGINATED | 149 | $374,964 | 41 | $414,364 |
| APPLICATIONS APPROVED, NOT ACCEPTED | 49 | $406,956 | 36 | $411,082 |
| APPLICATIONS DENIED | 38 | $372,415 | 22 | $463,318 |
| APPLICATIONS WITHDRAWN | 13 | $434,923 | 9 | $497,994 |
| FILES CLOSED FOR INCOMPLETENESS | 4 | $396,750 | 1 | $281,000 |

2005 - 2018 National Fire Incident Reporting System (NFIRS) incidents
- Fire incident types reported to NFIRS in Fremont, CA
- 1,69541.1%Outside Fires
- 1,63139.6%Structure Fires
- 79019.2%Mobile Property/Vehicle Fires
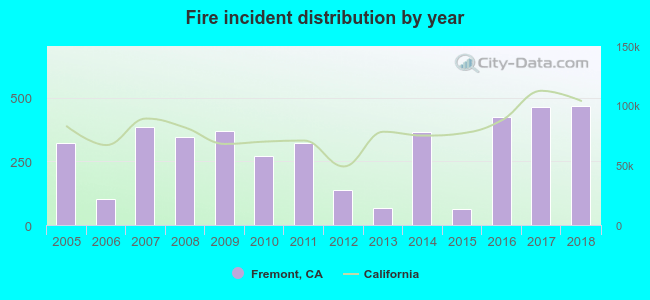 According to the data from the years 2005 - 2018 the average number of fire incidents per year is 294. The highest number of reported fires - 469 took place in 2018, and the least - 64 in 2015. The data has a rising trend.
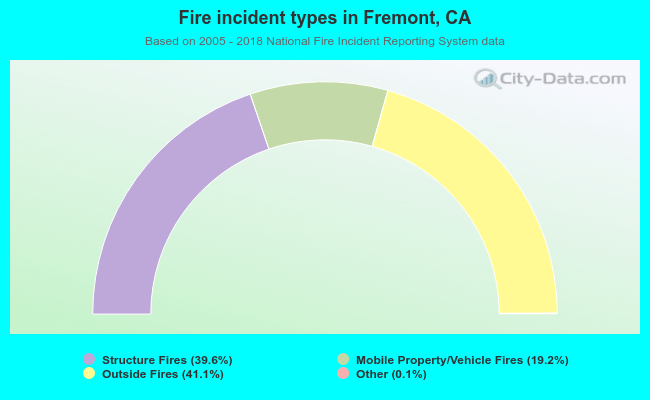 When looking into fire subcategories, the most reports belonged to: Outside Fires (41.1%), and Structure Fires (39.6%).
Fire-safe hotels and motels in Fremont, California:
- Best Western Garden Court Inn, 5400 Mowry Ave, Fremont, California 94538 , Phone: (510) 792-4300, Fax: (510) 792-2643
- Residence Inn By Marriott- Fremont, 5400 Farwell Pl, Fremont, California 94536 , Phone: (510) 794-5900, Fax: (510) 793-6587
- Comfort Inn, 47031 Kato Rd, Fremont, California 94538 , Phone: (510) 490-2900, Fax: (510) 659-8353
- Motel 6, 46101 Research Ave, Fremont, California 94539 , Phone: (510) 490-4528, Fax: (510) 490-5937
- Good Nite Inn, 4135 Cushing Pkwy, Fremont, California 94538 , Phone: (510) 226-6483, Fax: (510) 656-9131
- Days Inn Fremont, 46101 Warm Springs Blvd, Fremont, California 94539 , Phone: (510) 656-2800, Fax: (510) 659-0352
- Extended Stay America - Fremont - Newark, 5375 Farwell Pl, Fremont, California 94536 , Phone: (510) 794-9693, Fax: (510) 794-9697
- Extended Stay America - Fremont - Fremont Blvd South, 46080 Fremont Blvd, Fremont, California 94538 , Phone: (510) 353-1664, Fax: (510) 353-9144
- 4 other hotels and motels
| Most common first names in Fremont, CA among deceased individuals | ||
| Name | Count | Lived (average) |
|---|---|---|
| Mary | 526 | 79.1 years |
| John | 513 | 72.1 years |
| William | 389 | 72.6 years |
| Robert | 380 | 68.2 years |
| James | 331 | 68.8 years |
| George | 280 | 75.0 years |
| Joseph | 278 | 75.2 years |
| Charles | 230 | 71.8 years |
| Frank | 220 | 76.3 years |
| Helen | 216 | 77.5 years |
| Most common last names in Fremont, CA among deceased individuals | ||
| Last name | Count | Lived (average) |
|---|---|---|
| Smith | 161 | 73.8 years |
| Johnson | 116 | 73.6 years |
| Miller | 105 | 74.2 years |
| Silva | 105 | 77.3 years |
| Brown | 102 | 75.2 years |
| Martin | 88 | 74.7 years |
| Rose | 73 | 79.5 years |
| Davis | 72 | 71.9 years |
| Lee | 69 | 75.0 years |
| Jones | 68 | 69.8 years |
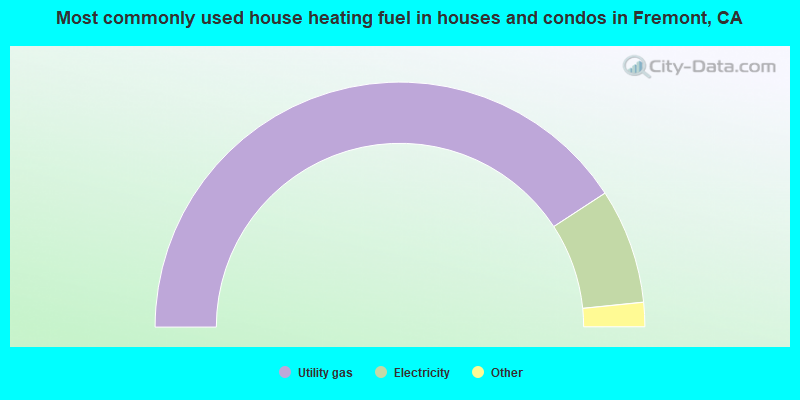
- 81.6%Utility gas
- 15.2%Electricity
- 1.7%Bottled, tank, or LP gas
- 0.7%Solar energy
- 0.4%No fuel used
- 0.2%Wood
- 0.1%Fuel oil, kerosene, etc.

- 62.4%Utility gas
- 33.8%Electricity
- 2.0%No fuel used
- 1.4%Bottled, tank, or LP gas
- 0.2%Fuel oil, kerosene, etc.
- 0.1%Solar energy
Fremont compared to California state average:
- Median household income above state average.
- Median house value above state average.
- Unemployed percentage significantly below state average.
- Hispanic race population percentage significantly below state average.
- Median age above state average.
- Foreign-born population percentage above state average.
- Percentage of population with a bachelor's degree or higher significantly above state average.
Fremont, CA compared to other similar cities:
Fremont on our top lists:
- #6 on the list of "Top 101 cities with largest percentage of females in occupations: computer and mathematical occupations (population 50,000+)"
- #8 on the list of "Top 101 cities with largest percentage of males in occupations: computer and mathematical occupations (population 50,000+)"
- #10 on the list of "Top 101 cities with the lowest number of police officers per 1000 residents (population 50,000+)"
- #10 on the list of "Top 101 cities with largest percentage of males in occupations: architecture and engineering occupations (population 50,000+)"
- #15 on the list of "Top 101 cities with largest percentage of females in occupations: architecture and engineering occupations (population 50,000+)"
- #16 on the list of "Top 101 cities with largest percentage of males in industries: professional, scientific, and technical services (population 50,000+)"
- #19 on the list of "Top 101 cities with the largest humidity differences during a year (population 50,000+)"
- #19 on the list of "Top 101 cities with the largest differences between morning and afternoon humidity (population 50,000+)"
- #20 on the list of "Top 101 cities with the most residents born in India (population 500+)"
- #22 on the list of "Top 101 cities with the largest racial income disparity between any two races with at least 2,000 householders"
- #23 on the list of "Top 101 cities with the largest percentage of people in institutions for the blind (population 1,000+)"
- #24 on the list of "Top 100 cities with highest median household income (pop. 50,000+)"
- #26 on the list of "Top 101 cities with the most residents born in Taiwan (population 500+)"
- #29 on the list of "Top 100 cities with highest percentage of foreign-born residents (pop. 50,000+)"
- #29 on the list of "Top 101 cities with the most residents born in South Central Asia (population 500+)"
- #30 on the list of "Top 101 cities with largest percentage of females in industries: professional, scientific, and technical services (population 50,000+)"
- #31 on the list of "Top 101 cities with the lowest percentage of single-parent households, population 50,000+"
- #33 on the list of "Top 101 cities with the most residents born in Asia (population 500+)"
- #34 on the list of "Top 101 cities with the most residents born in China (population 500+)"
- #35 on the list of "Top 101 cities with the most residents born in Other South Eastern Asia (population 500+)"
- #53 (94538) on the list of "Top 101 zip codes with the most Internet business establishments in 2005"
- #11 on the list of "Top 101 counties with the lowest Ozone (1-hour) air pollution readings in 2012 (ppm)"
- #17 on the list of "Top 101 counties with highest percentage of residents voting for Obama (Democrat) in the 2012 Presidential Election (pop. 50,000+)"
- #18 on the list of "Top 101 counties with the most Other congregations"
- #21 on the list of "Top 101 counties with the highest surface withdrawal of fresh water for public supply (pop. 50,000+)"
- #22 on the list of "Top 101 counties with the highest percentage of residents that exercised in the past month"

|
|
Total of 25009 patent applications in 2008-2024.