Estimated zip code population in 2022: 53,020 Zip code population in 2010: 50,031 Zip code population in 2000: 46,910
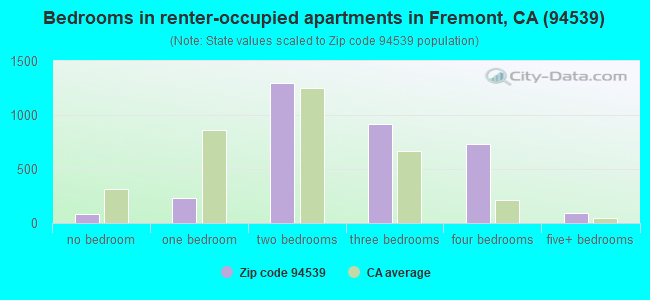
Houses and condos: 17,572 Renter-occupied apartments: 3,352
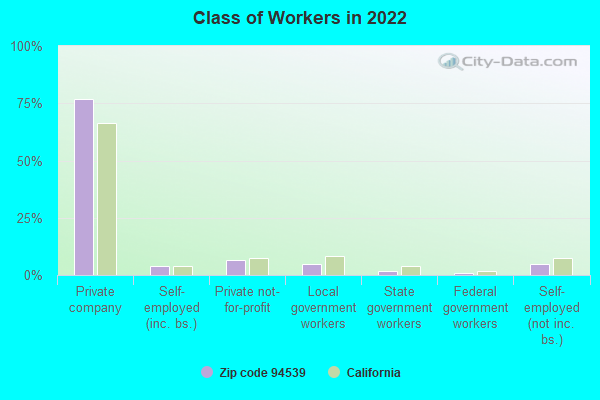
% of renters here:
20%
State:
44%
March 2022 cost of living index in zip code 94539: 121.7 (high, U.S. average is 100)
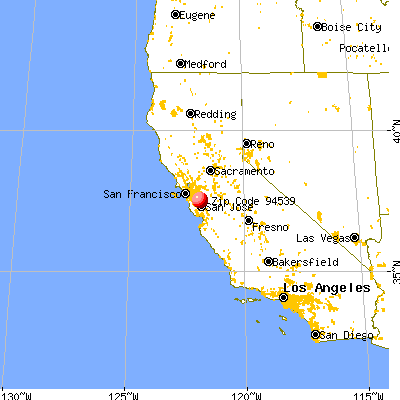
Land area: 25.4 sq. mi. Water area: 0.0 sq. mi.
Population density: 2,086 people per square mile
(low).
OSM Map
General Map
Google Map
MSN Map
OSM Map
General Map
Google Map
MSN Map
OSM Map
General Map
Google Map
MSN Map
OSM Map
General Map
Google Map
MSN Map
Please wait while loading the map...
Real estate property taxes paid for housing units in 2022:
This zip code:
0.5% ($10,292)
California:
0.7% ($4,831)
Median real estate property taxes paid for housing units with mortgages in 2022: $10,330 (0.5%) Median real estate property taxes paid for housing units with no mortgage in 2022: $9,216 (0.5%)
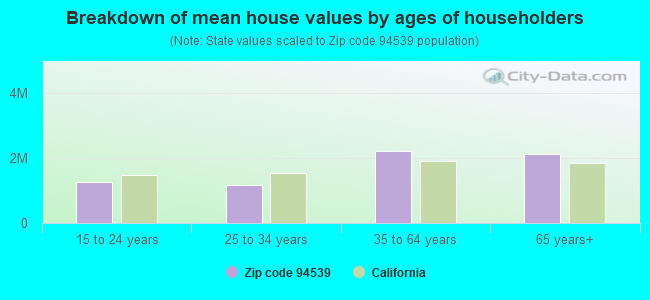
Estimated median house/condo value in 2022: $1,884,165
94539:
$1,884,165
California:
$715,900
According to our research of California and other state lists, there were 16 registered sex offenders living in 94539 zip code as of April 27, 2024. The ratio of all residents to sex offenders in zip code 94539 is 3,306 to 1. The ratio of registered sex offenders to all residents in this zip code is much lower than the state average.
Median resident age:
This zip code:
42.8 years
California median age:
37.9 years
Average household size:
This zip code:
3.2 people
California:
2.8 people
Averages for the 2020 tax year for zip code 94539, filed in 2021:
Average Adjusted Gross Income (AGI) in 2020: $265,775 (Individual Income Tax Returns)
Here:
$265,775
State:
$95,910
Salary/wage: $231,008 (reported on 83.0% of returns)
Here:
$231,008
State:
$77,331
(% of AGI for various income ranges: 1183.9% for AGIs below $25k, 3729.4% for AGIs $25k-50k, 6966.0% for AGIs $50k-75k, 10537.2% for AGIs $75k-100k, 21479.5% for AGIs $100k-200k, 173493.7% for AGIs over 200k)
Taxable interest for individuals: $3,236 (reported on 63.9% of returns)
This zip code:
$3,236
California:
$2,294
(% of AGI for various income ranges: 62.8% for AGIs below $25k, 129.0% for AGIs $25k-50k, 139.6% for AGIs $50k-75k, 204.1% for AGIs $75k-100k, 323.1% for AGIs $100k-200k, 1577.5% for AGIs over 200k)
Ordinary dividends: $12,996 (reported on 58.3% of returns)
Here:
$12,996
State:
$10,949
(% of AGI for various income ranges: 89.8% for AGIs below $25k, 157.7% for AGIs $25k-50k, 272.2% for AGIs $50k-75k, 417.7% for AGIs $75k-100k, 820.0% for AGIs $100k-200k, 6826.8% for AGIs over 200k)
Net capital gain/loss in AGI: +$58,557 (reported on 58.3% of returns)
Here:
+$58,557
State:
+$49,306
(% of AGI for various income ranges: 69.0% for AGIs below $25k, 215.3% for AGIs $25k-50k, 382.8% for AGIs $50k-75k, 714.0% for AGIs $75k-100k, 1201.0% for AGIs $100k-200k, 35048.9% for AGIs over 200k)
Profit/loss from business: +$24,110 (reported on 16.2% of returns)
Here:
+$24,110
State:
+$15,671
(% of AGI for various income ranges: 119.7% for AGIs below $25k, 302.7% for AGIs $25k-50k, 364.6% for AGIs $50k-75k, 316.3% for AGIs $75k-100k, 628.3% for AGIs $100k-200k, 2889.6% for AGIs over 200k)
Taxable individual retirement arrangement distribution: $33,134 (reported on 8.6% of returns)
94539:
$33,134
California:
$23,505
(% of AGI for various income ranges: 66.7% for AGIs below $25k, 192.6% for AGIs $25k-50k, 278.8% for AGIs $50k-75k, 482.1% for AGIs $75k-100k, 961.6% for AGIs $100k-200k, 1524.3% for AGIs over 200k)
Self-employed (Keogh) retirement plans: $31,442 (reported on 1.9% of returns)
94539:
$31,442
California:
$30,163
(% of AGI for various income ranges: 8.2% for AGIs below $25k, 50.5% for AGIs $50k-75k, 105.8% for AGIs $100k-200k, 518.6% for AGIs over 200k)
Total itemized deductions: $42,881 (reported on 27.8% of returns)
Here:
$42,881
State:
$39,517
(% of AGI for various income ranges: 129.1% for AGIs below $25k, 334.8% for AGIs $25k-50k, 535.9% for AGIs $50k-75k, 838.6% for AGIs $75k-100k, 1803.0% for AGIs $100k-200k, 10031.8% for AGIs over 200k)
Charity contributions: $12,263 (reported on 23.0% of returns)
Here:
$12,263
State:
$12,598
(% of AGI for various income ranges: 6.5% for AGIs below $25k, 27.6% for AGIs $25k-50k, 56.7% for AGIs $50k-75k, 116.6% for AGIs $75k-100k, 282.0% for AGIs $100k-200k, 2669.4% for AGIs over 200k)
Taxes paid: $9,811 (reported on 27.7% of returns)
94539:
$9,811
State:
$8,807
(% of AGI for various income ranges: 35.1% for AGIs below $25k, 84.4% for AGIs $25k-50k, 139.1% for AGIs $50k-75k, 234.8% for AGIs $75k-100k, 533.4% for AGIs $100k-200k, 2127.0% for AGIs over 200k)
Earned income credit: $1,484 (reported on 3.7% of returns)
Here:
$1,484
State:
$2,074
(% of AGI for various income ranges: 32.4% for AGIs below $25k, 29.2% for AGIs $25k-50k)
Percentage of individuals using paid preparers for their 2020 taxes: 90.8%
Here:
91%
State:
92%
(% for various income ranges: 88.7% for AGIs below $25k, 90.6% for AGIs $25k-50k, 90.0% for AGIs $50k-75k, 89.7% for AGIs $75k-100k, 90.7% for AGIs $100k-200k, 92.2% for AGIs over 200k)
Averages for the 2012 tax year for zip code 94539, filed in 2013:
Average Adjusted Gross Income (AGI) in 2012: $158,706 (Individual Income Tax Returns)
Here:
$158,706
State:
$72,726
Salary/wage: $140,549 (reported on 85.0% of returns)
Here:
$140,549
State:
$59,079
(% of AGI for various income ranges: 79.9% for AGIs below $25k, 77.4% for AGIs $25k-50k, 75.5% for AGIs $50k-75k, 73.6% for AGIs $75k-100k, 82.9% for AGIs $100k-200k, 72.4% for AGIs over 200k)
Taxable interest for individuals: $2,331 (reported on 65.9% of returns)
This zip code:
$2,331
California:
$2,146
(% of AGI for various income ranges: 3.2% for AGIs below $25k, 1.6% for AGIs $25k-50k, 1.4% for AGIs $50k-75k, 1.1% for AGIs $75k-100k, 0.8% for AGIs $100k-200k, 0.9% for AGIs over 200k)
Ordinary dividends: $8,270 (reported on 51.3% of returns)
Here:
$8,270
State:
$9,308
(% of AGI for various income ranges: 4.9% for AGIs below $25k, 2.5% for AGIs $25k-50k, 2.5% for AGIs $50k-75k, 2.7% for AGIs $75k-100k, 1.9% for AGIs $100k-200k, 2.9% for AGIs over 200k)
Net capital gain/loss in AGI: +$18,171 (reported on 51.0% of returns)
Here:
+$18,171
State:
+$30,460
(% of AGI for various income ranges: 0.6% for AGIs $25k-50k, 1.1% for AGIs $50k-75k, 1.6% for AGIs $75k-100k, 1.2% for AGIs $100k-200k, 8.4% for AGIs over 200k)
Profit/loss from business: +$29,773 (reported on 18.0% of returns)
Here:
+$29,773
State:
+$17,064
(% of AGI for various income ranges: 11.5% for AGIs below $25k, 7.6% for AGIs $25k-50k, 4.9% for AGIs $50k-75k, 4.9% for AGIs $75k-100k, 3.6% for AGIs $100k-200k, 2.8% for AGIs over 200k)
Taxable individual retirement arrangement distribution: $24,138 (reported on 8.7% of returns)
94539:
$24,138
California:
$19,557
(% of AGI for various income ranges: 3.4% for AGIs below $25k, 3.5% for AGIs $25k-50k, 3.8% for AGIs $50k-75k, 3.1% for AGIs $75k-100k, 1.9% for AGIs $100k-200k, 0.7% for AGIs over 200k)
Self-employment retirement plans: $29,128 (reported on 2.7% of returns)
94539:
$29,128
California:
$24,530
(% of AGI for various income ranges: 1.0% for AGIs below $25k, 0.4% for AGIs $50k-75k, 0.4% for AGIs $75k-100k, 0.4% for AGIs $100k-200k, 0.5% for AGIs over 200k)
Total itemized deductions: $44,546 (19% of AGI, reported on 60.3% of returns)
Here:
$44,546
State:
$34,004
Here:
18.8% of AGI
State:
22.7% of AGI
(% of AGI for various income ranges: 18.0% for AGIs below $25k, 16.7% for AGIs $25k-50k, 17.9% for AGIs $50k-75k, 18.6% for AGIs $75k-100k, 19.1% for AGIs $100k-200k, 16.0% for AGIs over 200k)
Charity contributions: $3,957 (reported on 51.6% of returns)
Here:
$3,957
State:
$4,659
(% of AGI for various income ranges: 0.9% for AGIs below $25k, 1.2% for AGIs $25k-50k, 1.5% for AGIs $50k-75k, 1.7% for AGIs $75k-100k, 1.6% for AGIs $100k-200k, 1.2% for AGIs over 200k)
Taxes paid: $25,802 (reported on 60.1% of returns)
94539:
$25,802
State:
$14,448
(% of AGI for various income ranges: 5.8% for AGIs below $25k, 5.5% for AGIs $25k-50k, 6.1% for AGIs $50k-75k, 7.5% for AGIs $75k-100k, 9.3% for AGIs $100k-200k, 10.6% for AGIs over 200k)
Earned income credit: $1,622 (reported on 4.9% of returns)
Here:
$1,622
State:
$2,286
(% of AGI for various income ranges: 2.6% for AGIs below $25k, 0.5% for AGIs $25k-50k)
Percentage of individuals using paid preparers for their 2012 taxes: 47.3%
Here:
47%
State:
64%
(% for various income ranges: 42.1% for AGIs below $25k, 48.2% for AGIs $25k-50k, 49.7% for AGIs $50k-75k, 52.0% for AGIs $75k-100k, 46.6% for AGIs $100k-200k, 49.7% for AGIs over 200k)
Averages for the 2004 tax year for zip code 94539, filed in 2005:
Average Adjusted Gross Income (AGI) in 2004: $111,619 (Individual Income Tax Returns)
Here:
$111,619
State:
$58,600
Salary/wage: $102,329 (reported on 83.8% of returns)
Here:
$102,329
State:
$49,455
(% of AGI for various income ranges: 72.3% for AGIs $10k-25k, 77.1% for AGIs $25k-50k, 80.9% for AGIs $50k-75k, 82.5% for AGIs $75k-100k, 74.9% for AGIs over 100k)
Taxable interest for individuals: $2,611 (reported on 71.3% of returns)
This zip code:
$2,611
California:
$2,365
(% of AGI for various income ranges: 3.9% for AGIs $10k-25k, 2.6% for AGIs $25k-50k, 1.8% for AGIs $50k-75k, 1.5% for AGIs $75k-100k, 1.5% for AGIs over 100k)
Taxable dividends: $3,954 (reported on 49.8% of returns)
Here:
$3,954
State:
$4,746
(% of AGI for various income ranges: 3.1% for AGIs $10k-25k, 2.4% for AGIs $25k-50k, 1.5% for AGIs $50k-75k, 1.5% for AGIs $75k-100k, 1.7% for AGIs over 100k)
Net capital gain/loss: +$15,363 (reported on 50.7% of returns)
Here:
+$15,363
State:
+$23,418
(% of AGI for various income ranges: 1.5% for AGIs $10k-25k, 0.7% for AGIs $25k-50k, 0.7% for AGIs $50k-75k, 1.1% for AGIs $75k-100k, 8.5% for AGIs over 100k)
Profit/loss from business: +$27,529 (reported on 18.8% of returns)
Here:
+$27,529
State:
+$16,826
(% of AGI for various income ranges: 9.3% for AGIs $10k-25k, 6.9% for AGIs $25k-50k, 4.3% for AGIs $50k-75k, 4.4% for AGIs $75k-100k, 4.5% for AGIs over 100k)
IRA payment deduction: $3,557 (reported on 5.8% of returns)
94539:
$3,557
California:
$3,192
(% of AGI for various income ranges: 0.5% for AGIs $10k-25k, 0.5% for AGIs $25k-50k, 0.4% for AGIs $50k-75k, 0.4% for AGIs $75k-100k, 0.1% for AGIs over 100k)
Self-employed pension: $19,871 (reported on 3.1% of returns)
Here:
$19,871
California:
$17,688
(% of AGI for various income ranges: 0.1% for AGIs $10k-25k, 0.2% for AGIs $25k-50k, 0.2% for AGIs $50k-75k, 0.4% for AGIs $75k-100k, 0.6% for AGIs over 100k)
Total itemized deductions: $36,658 (21% of AGI, reported on 58.3% of returns)
Here:
$36,658
State:
$28,113
Here:
21.3% of AGI
State:
25.3% of AGI
(% of AGI for various income ranges: 21.4% for AGIs $10k-25k, 20.4% for AGIs $25k-50k, 22.5% for AGIs $50k-75k, 23.8% for AGIs $75k-100k, 18.0% for AGIs over 100k)
Charity contributions deductions: $3,643 (2% of AGI, reported on 52.3% of returns)
Here:
$3,643
State:
$3,923
Here:
2.0% of AGI
State:
3.3% of AGI
(% of AGI for various income ranges: 1.2% for AGIs $10k-25k, 1.7% for AGIs $25k-50k, 2.0% for AGIs $50k-75k, 2.1% for AGIs $75k-100k, 1.6% for AGIs over 100k)
Total tax: $23,091 (reported on 83.2% of returns)
94539:
$23,091
State:
$10,761
(% of AGI for various income ranges: 5.1% for AGIs $10k-25k, 7.7% for AGIs $25k-50k, 9.3% for AGIs $50k-75k, 9.7% for AGIs $75k-100k, 19.3% for AGIs over 100k)
Earned income credit: $1,323 (reported on 4.5% of returns)
Here:
$1,323
State:
$1,763
Percentage of individuals using paid preparers for their 2004 taxes: 48.6%
Here:
49%
State:
66%
(% for various income ranges: 42.0% for AGIs below $10k, 49.8% for AGIs $10k-25k, 52.6% for AGIs $25k-50k, 53.0% for AGIs $50k-75k, 49.6% for AGIs $75k-100k, 48.2% for AGIs over 100k)
Household received Food Stamps/SNAP in the past 12 months: 276 Household did not receive Food Stamps/SNAP in the past 12 months: 16,029
Women who had a birth in the past 12 months: 442 (406 now married, 34 unmarried) Women who did not have a birth in the past 12 months: 12,125 (6,750 now married, 5,294 unmarried)
Housing units in zip code 94539 with a mortgage: 9,426 (1,283 second mortgage, 39 home equity loan, 1,140 both second mortgage and home equity loan) Houses without a mortgage: 137
Median monthly owner costs for units with a mortgage: $3,876 Median monthly owner costs for units without a mortgage: $1,164
Residents with income below the poverty level in 2022:
This zip code:
3.7%
Whole state:
12.2%
Residents with income below 50% of the poverty level in 2022:
This zip code:
1.7%
Whole state:
6.2%
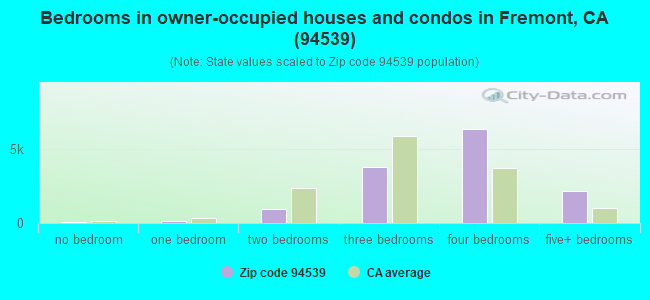
Median number of rooms in houses and condos:
Here:
6.5
State:
6.0
Median number of rooms in apartments:
Here:
4.4
State:
3.9
Notable locations in this zip code not listed on our city pages
Notable locations in zip code 94539: Weibel Vineyards (A), Irvington Pumping Station (B), Hyde Community Center (C), Fremont Fire Department Station 4 (D), Fremont Fire Department Station 9 (E), Fremont Fire Department Station 5 (F). Display/hide their locations on the map
Shopping Centers: Warm Springs Plaza Shopping Center (1), Mission Valley Shopping Center (2), Mission Shopping Center (3). Display/hide their locations on the map
Churches in zip code 94539 include: First United Methodist Church (A), Saint Josephs Church (B), Mission San Jose de Guadalupe (C), Sisters of Saint Dominic Convent (D). Display/hide their locations on the map
Cemeteries: Saint Josephs Cemetery (1), Cedar Lawn Memorial Cemetery (2), Mission San Jose Cemetery (3), Ohlones Cemetery (4). Display/hide their locations on the map
Parks in zip code 94539 include: Mission Peak Regional Preserve (1), Arroyo Agua Caliente Park (2), Booster Park (3), Buena Vista Park (4), Gomes Park (5), Higuera Adobe Park (6), Lone Tree Creek Park (7), Mission San Jose Community Park (8), Mission San Jose Park (9). Display/hide their locations on the map
10,427 married couples with children.
906 single-parent households (138 men, 768 women).
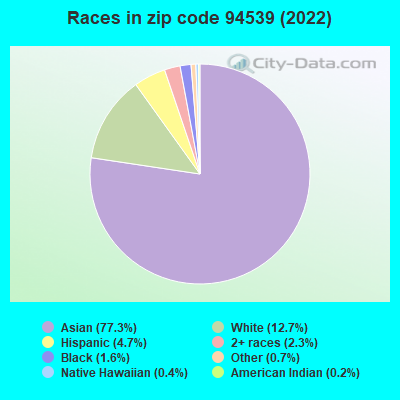
31.9% of residents of 94539 zip code speak English at home.
2.5% of residents speak Spanish at home (63% very well, 18% well, 19% not well).
22.3% of residents speak other Indo-European language at home (86% very well, 7% well, 6% not well, 1% not at all).
43.7% of residents speak Asian or Pacific Island language at home (65% very well, 26% well, 7% not well, 2% not at all).
0.7% of residents speak other language at home (77% very well, 18% well, 5% not well).
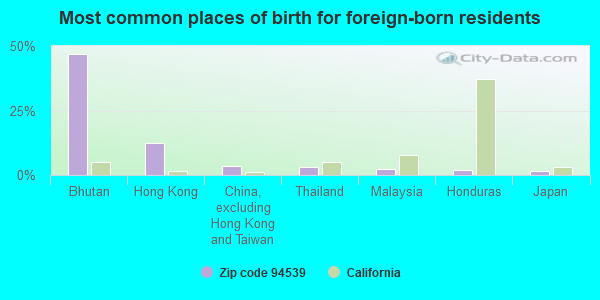
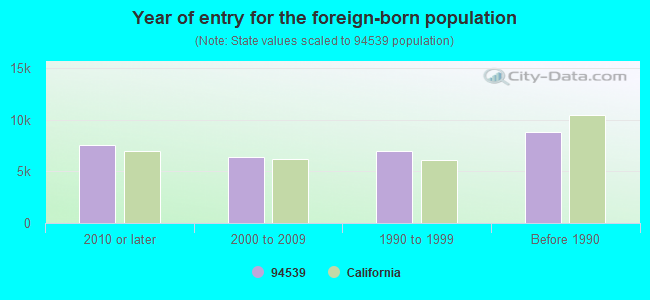
Foreign born population: 29,253 (55.2%) (67.8% of them are naturalized citizens)
Major facilities with environmental interests located in this zip code:
FREMONT USD MISSION SAN JOSE HIGH (41717 PALM AVE in FREMONT, CA)
STATE MASTER (California - Hazardous Waste Tracking) - HAZARDOU WASTE PROGRAM (National Center for Education Statistics) - STATE ID-0135244 Small Quantity Generators, between 100 kg and 1000 kg of hazardous waste/month (Resource Conservation and Recovery Act (tracking hazardous waste)) Organizations: FREMONT UNIFIED (SCHOOL DISTRICT)
Alternative names: FUSD - MISSION SAN JOSE HIGH SCHOOL
ISOLA USA (401 WHITNEY PLACE in FREMONT, CA)
AIR MAJOR (AIRS/AFS) STATE MASTER (California - Hazardous Waste Tracking) - HAZARDOU WASTE PROGRAM CRITERIA AND HAZARDOUS AIR POLLUTANT INVENTORY (Inventory of air pollution sources) HAZARDOUS WASTE BIENNIAL REPORTER (Resource Conservation and Recovery Act (tracking hazardous waste)) Large Quantity Generators, more that 1000 kg of hazardous waste/month (Resource Conservation and Recovery Act (tracking hazardous waste)) TRI REPORTER (Tracking of toxic chemicals releasing facilities) Business SIC classification: PLASTICS MATERIALS, SYNTHETIC RESINS, AND NONVULCANIZABLE ELASTOMERS; SEMICONDUCTORS AND RELATED DEVICES; ELECTRONIC COMPONENTS Business NAICS classification: PLASTICS MATERIAL AND RESIN MANUFACTURING. Organizations: ISOLA LAMINATES SYSTEM (CONTACT/OPERATOR)
, ISOLA LAMINATE SYSTEMS (CONTACT/OWNER)
Alternative names: ISOLA LAMINATE SYS. CORP., ISOLA LAMINATE SYS. CORP.
NITINOL DEVICES AND COMPONENTS (47533 WESTINGHOUSE DR in FREMONT, CA)
STATE MASTER (California - Hazardous Waste Tracking) - HAZARDOU WASTE PROGRAM CRITERIA AND HAZARDOUS AIR POLLUTANT INVENTORY (Inventory of air pollution sources) PERFORMANCE TRACK (National Environmental Performance Track) Large Quantity Generators, more that 1000 kg of hazardous waste/month (Resource Conservation and Recovery Act (tracking hazardous waste)) - notification TRI REPORTER (Tracking of toxic chemicals releasing facilities) Business SIC classification: SURGICAL AND MEDICAL INSTRUMENTS AND APPARATUS; ELECTROMEDICAL AND ELECTROTHERAPEUTIC APPARATUS Organizations: BEDFORD PROPERTY INVESTMENT, INC. (CONTACT/OWNER)
Alternative names: NDC, NITINOL DEVICES COMPONENTS
KAO INFOSYSTEMS COMPANY (800 CORPORATE WAY in FREMONT, CA)
STATE MASTER (California - Hazardous Waste Tracking) - HAZARDOU WASTE PROGRAM CRITERIA AND HAZARDOUS AIR POLLUTANT INVENTORY (Inventory of air pollution sources) HAZARDOUS WASTE BIENNIAL REPORTER (Resource Conservation and Recovery Act (tracking hazardous waste)) Large Quantity Generators, more that 1000 kg of hazardous waste/month (Resource Conservation and Recovery Act (tracking hazardous waste)) Business SIC classification: MAGNETIC AND OPTICAL RECORDING MEDIA; BUSINESS SERVICES Business NAICS classification: MAGNETIC AND OPTICAL RECORDING MEDIA MANUFACTURING.; AIRCRAFT MANUFACTURING. Organizations: ZOMAX INC (CONTACT/OPERATOR)
, SOBRATO DEVELOP CO (CONTACT/OWNER)
Alternative names: ZOMAX INC
FINE PITCH (401 KATO TERRACE in FREMONT, CA)
STATE MASTER (California - Hazardous Waste Tracking) - HAZARDOU WASTE PROGRAM CRITERIA AND HAZARDOUS AIR POLLUTANT INVENTORY (Inventory of air pollution sources) Large Quantity Generators, more that 1000 kg of hazardous waste/month (Resource Conservation and Recovery Act (tracking hazardous waste)) - notification TRI REPORTER (Tracking of toxic chemicals releasing facilities) Business SIC classification: PRINTED CIRCUIT BOARDS Organizations: FINE PITCH SOLECTRON SUB (CONTACT/OWNER)
Alternative names: A PLUS MANUFACTURING, FINE PITCH SOLECTRON SUBSIDIARY
MALLAR FINISHING (2878 PRUNE AVE, SUITE G in FREMONT, CA)
STATE MASTER (California - Hazardous Waste Tracking) - HAZARDOU WASTE PROGRAM CRITERIA AND HAZARDOUS AIR POLLUTANT INVENTORY (Inventory of air pollution sources) Small Quantity Generators, between 100 kg and 1000 kg of hazardous waste/month (Resource Conservation and Recovery Act (tracking hazardous waste)) - notification Business SIC classification: COATING, ENGRAVING, AND ALLIED SERVICES Organizations: MALCOLM ROSS (CONTACT/OWNER)
NITINOL DEVICES COMPONENTS (47600 WESTINGHOUSE DR in FREMONT, CA)
STATE MASTER (California - Hazardous Waste Tracking) - HAZARDOU WASTE PROGRAM Large Quantity Generators, more that 1000 kg of hazardous waste/month (Resource Conservation and Recovery Act (tracking hazardous waste)) - notification Organizations: JOHNSON & JOHNSON (CONTACT/OWNER)
CALOGIC CORP (237 WHITNEY PLACE in FREMONT, CA)
STATE MASTER (California - Hazardous Waste Tracking) - HAZARDOU WASTE PROGRAM CRITERIA AND HAZARDOUS AIR POLLUTANT INVENTORY (Inventory of air pollution sources) Small Quantity Generators, between 100 kg and 1000 kg of hazardous waste/month (Resource Conservation and Recovery Act (tracking hazardous waste)) Business SIC classification: SEMICONDUCTORS AND RELATED DEVICES Business NAICS classification: ALL OTHER INDUSTRIAL MACHINERY MANUFACTURING. Alternative names: CALOGIC LLC
HAYWARD QUARTZ MACH INC (1700 CORPORATE WAY in FREMONT, CA)
STATE MASTER (California - Hazardous Waste Tracking) - HAZARDOU WASTE PROGRAM Small Quantity Generators, between 100 kg and 1000 kg of hazardous waste/month (Resource Conservation and Recovery Act (tracking hazardous waste)) - notification Organizations: HA LY (CONTACT/OWNER)
Alternative names: HAYWARD QUARTZ TECHNOLOGY INC
L M C MITEK (3050 OSGOOD CT in FREMONT, CA)
STATE MASTER (California - Hazardous Waste Tracking) - HAZARDOU WASTE PROGRAM Small Quantity Generators, between 100 kg and 1000 kg of hazardous waste/month (Resource Conservation and Recovery Act (tracking hazardous waste)) - notification Organizations: AUTOTECH TECHNOLOGIES L P (CONTACT/OWNER)
FREMONT FIRE STATION NO 5 (55 HACKAMORE RD in FREMONT, CA)
STATE MASTER (California - Hazardous Waste Tracking) - HAZARDOU WASTE PROGRAM Small Quantity Generators, between 100 kg and 1000 kg of hazardous waste/month (Resource Conservation and Recovery Act (tracking hazardous waste)) - notification Organizations: CITY OF FREMONT (CONTACT/OWNER)
Alternative names: CITY OF FREMONT FIRE STATION #5
EQUILON ENTERPRISES (42816 MISSION/MISSION PASS in FREMONT, CA) . Federal Facility
STATE MASTER (California - Hazardous Waste Tracking) - HAZARDOU WASTE PROGRAM Small Quantity Generators, between 100 kg and 1000 kg of hazardous waste/month (Resource Conservation and Recovery Act (tracking hazardous waste)) - notification Organizations: EQUILON ENTERPRISES, LLC (CONTACT/OWNER)
Alternative names: SHELL OIL CO
HERTZ EQUIPMENT RENTAL CORP (48887 KATO DR in FREMONT, CA)
STATE MASTER (California - Hazardous Waste Tracking) - HAZARDOU WASTE PROGRAM Small Quantity Generators, between 100 kg and 1000 kg of hazardous waste/month (Resource Conservation and Recovery Act (tracking hazardous waste))
Housing units lacking complete plumbing facilities: 0.4% Housing units lacking complete kitchen facilities: 0.9%
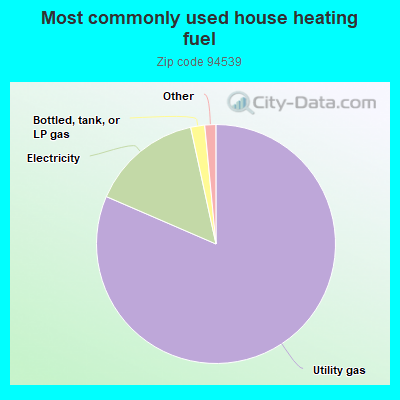
81.5%Utility gas
15.1%Electricity
1.9%Bottled, tank, or LP gas
0.7%Solar energy
0.6%No fuel used
Population in 1990: 39,927. Population change in the 1990s: +6,983 (+17.5%).
Place of birth for U.S.-born residents:
This state: 19,252
Northeast: 1,079
Midwest: 1,242
South: 852
West: 1,243
60% of the 94539 zip code residents lived in the same house 5 years ago. Out of people who lived in different houses, 51% lived in this county. Out of people who lived in different counties, 50% lived in California.
92% of the 94539 zip code residents lived in the same house 1 year ago. Out of people who lived in different houses, 37% moved from this county. Out of people who lived in different houses, 31% moved from different county within same state. Out of people who lived in different houses, 12% moved from different state. Out of people who lived in different houses, 27% moved from abroad.
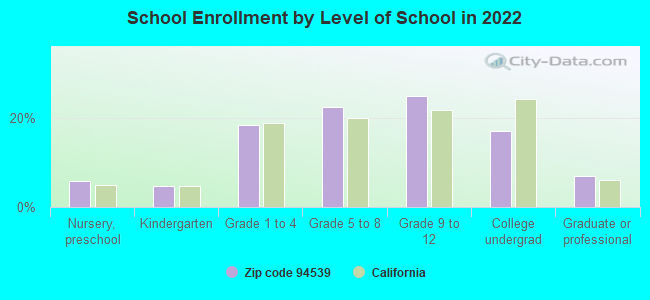
Private vs. public school enrollment:
Students in private schools in grades 1 to 8 (elementary and middle school): 919
Here:
16.0%
California:
10.5%
Students in private schools in grades 9 to 12 (high school): 329
Here:
9.4%
California:
8.5%
Students in private undergraduate colleges: 381
Here:
15.9%
California:
15.9%
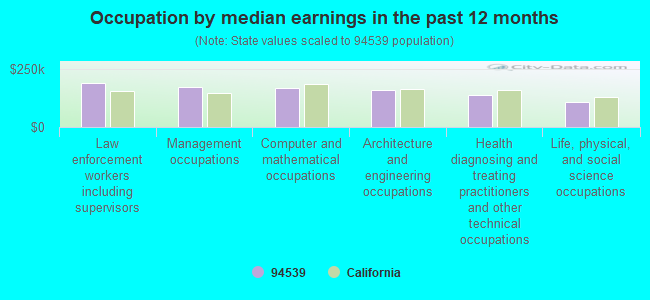
Occupation by median earnings in the past 12 months ($)
190,301Law enforcement workers including supervisors
174,809Management occupations
169,403Computer and mathematical occupations
159,820Architecture and engineering occupations
136,880Health diagnosing and treating practitioners and other technical occupations
106,419Life, physical, and social science occupations
Companies with biggest federal contracts located in this zip code (FREMONT, CA):
CRYSTAL RESEARCH INC (48501 WARM SPRINGS BLVD ST; small business) : $2,795,547 in 15 contractsfrom 2002 to 2006
Contracts for Defense Missile and Space Systems -- Operational Systems Development (R&D), Defense Aircraft -- Management and Support (R&D), Defense Aircraft -- Basic Research (R&D), Defense Missile and Space Systems -- Advanced Development (R&D), and moreby Air Force, Army, NASA Signed by year:2000: $0; 2001: $0; 2002: $305,707; 2003: $819,869; 2004: $450,000; 2005: $399,985; 2006: $819,986.
Biggest contracts:
$450,000 with Air Force for Defense Missile and Space Systems -- Operational Systems Development (R&D). Signed on 2006-04-28. Completion date: 2008-08-07.
$450,000 with Air Force for Defense Aircraft -- Management and Support (R&D). Signed on 2004-07-19. Completion date: 2005-07-15.
$375,000 with Air Force for Defense Aircraft -- Basic Research (R&D). Signed on 2003-02-05. Completion date: 2005-05-13.
$374,880, same as above.Signed on 2003-10-29. Completion date: 2005-02-21.
SSE TELECOM, INC (47823 WESTINGHOUSE DRIVE; small business) : $1,846,229 in 14 contractsfrom 2000 to 2001
Contracts for Miscellaneous Electrical and Electronic Components, Telephone and Telegraph Equipment, Radio and Television Communication Equipment, Except Airborne, Communications Security Equipment and Components, and moreby Navy, Air Force Signed by year:2000: $2,408,696; 2001: -$562,467; 2002: $0; 2003: $0; 2004: $0; 2005: $0; 2006: $0.
Biggest contracts:
$712,796 with Navy for Miscellaneous Electrical and Electronic Components. Taking place in MD. Signed on 2000-06-08. Completion date: 2000-10-07.
$656,212 with Air Force for Telephone and Telegraph Equipment. Signed on 2000-06-28. Completion date: 2000-09-27.
$356,398 with Navy for Miscellaneous Electrical and Electronic Components. Taking place in MD. Signed on 2000-04-28. Completion date: 2000-08-27.
$137,813 with Navy for Radio and Television Communication Equipment, Except Airborne. Signed on 2000-08-24. Completion date: 2000-10-10.
SENSTAR STELLAR INC (43184 OSGOOD RD) : $1,706,179 in 21 contractsfrom 1999 to 2005
Contracts for Miscellaneous Alarm, Signal and Security Detection Systems, Miscellaneous Electrical and Electronic Components, Radar Equipment, Except Airborne, Miscellaneous Communication Equipment, and moreby U.S. Secret Service (disused code: now 7009), U.S. Secret Service, Air Force, Army, and others Signed by year:2000: $99,500; 2001: $201,280; 2002: $595,100; 2003: $360,279; 2004: $200,093; 2005: $163,916; 2006: $0.
Biggest contracts:
$504,000 with U.S. Secret Service (disused code: now 7009) for Miscellaneous Alarm, Signal and Security Detection Systems. Taking place in NY. Signed on 2002-08-15. Completion date: 2002-08-15.
$190,514 with U.S. Secret Service for Miscellaneous Electrical and Electronic Components. Taking place in DC. Signed on 2003-03-15. Completion date: 2003-05-15.
$136,710 with U.S. Secret Service for Miscellaneous Electrical and Electronic Components. Signed on 2004-09-23. Completion date: 2004-12-22.
$132,424 with U.S. Secret Service for Miscellaneous Alarm, Signal and Security Detection Systems. Signed on 2005-06-24. Completion date: 2005-09-30.
C A E SOLUTIONS CORP (40935 CAMERO PL; small business) : $1,702,334 in 13 contractsfrom 2001 to 2006
Contracts for Other Defense -- Basic Research (R&D), Miscellaneous Weapons by Army Signed by year:2000: $0; 2001: $435,200; 2002: $320,000; 2003: $200,000; 2004: $400,000; 2005: $248,793; 2006: $98,341.
Biggest contracts:
$320,000 with Army for Other Defense -- Basic Research (R&D). Signed on 2002-08-06. Completion date: 2002-11-27.
$320,000, same as above.Signed on 2001-11-27. Completion date: 2002-11-27.
$250,000 with Army for Miscellaneous Weapons. Signed on 2004-07-13. Completion date: 2004-09-30.
$200,000, same as above.Signed on 2003-10-21. Completion date: 2003-11-30.
APPLIED AERO LLC (48365 AVALON HEIGHTS TERRA; small business) : $729,788 in 2 contractsfrom 1999 to 2000
$364,894 with Army for Other Research and Development -- Basic Research (R&D). Signed on 2000-10-19. Completion date: 2002-01-15.
$364,894, same as above.Signed on 1999-11-18. Completion date: 2002-01-15.
SEVEN-UP BOTTLING COMPANY OF S (2875 PRUNE AVE) : $597,839 in 5 contractsfrom 2004 to 2005
Contracts for Food Items For Resale, Non-Food Items For Resale by Defense Commissary Agency Signed by year:2000: $0; 2001: $0; 2002: $0; 2003: $0; 2004: $152,364; 2005: $445,475; 2006: $0.
Biggest contracts:
$189,085 with Defense Commissary Agency for Food Items For Resale. Signed on 2005-04-01. Completion date: 2005-08-31.
$152,364, same as above.Signed on 2004-10-01. Completion date: 2005-02-28.
$118,350 with Defense Commissary Agency for Non-Food Items For Resale. Signed on 2005-10-01. Completion date: 2005-12-31.
$77,380 with Defense Commissary Agency for Food Items For Resale. Signed on 2005-01-01. Completion date: 2005-03-31.
WESTERN TRACTION II INC (43801 OSGOOD RD; small business) 50 employees, $0 revenue. : $490,000 in 3 contractsin 2005
$242,500 with U.S. Army Corps of Engineers - civil program financing only for Miscellaneous Maintenance and Repair Shop Specialized Equipment. Signed on 2005-08-01. Completion date: 2005-09-26.
$242,500 with Army for Miscellaneous Maintenance and Repair Shop Specialized Equipment. Signed on 2005-08-01. Completion date: 2005-09-26.
$5,000 with Army for Non-nuclear Ship Repair (West) Ship repair (including overhauls and conversions) performed on. non-nuclear propelled and nonpropelled ships west of the 108th meridian. Signed on 2005-11-18. Completion date: 2005-12-12.
TYZX, INC (241 SCOTIA COURT; small business) : $197,483 in 2 contractsin 2002
$98,993 with Army for Other Defense -- Applied Research and Exploratory Development (R&D). Signed on 2002-10-25. Completion date: 2003-07-01.
$98,490, same as above.Signed on 2002-10-25. Completion date: 2003-07-01.
LEO A MAGAZU JR (48924 CROWN RIDGE COMMON; small business) : $157,444 in 6 contractsfrom 2001 to 2006
Contracts for Construction of Structures and Facilities -- Office Buildings, Maintenance, Repair and Rebuilding of Equipment -- Materials Handling Equipment, Miscellaneous Electric Power and Distribution Equipment by NASA, Army Signed by year:2000: $0; 2001: $62,000; 2002: $65,000; 2003: $0; 2004: $0; 2005: $24,999; 2006: $5,445.
Biggest contracts:
$62,000 with NASA for Construction of Structures and Facilities -- Office Buildings. Signed on 2001-12-15. Completion date: 2002-02-15.
$45,000, same as above.Signed on 2002-09-15. Completion date: 2002-10-15.
$23,940 with Army for Maintenance, Repair and Rebuilding of Equipment -- Materials Handling Equipment. Signed on 2005-02-11. Completion date: 2005-03-15.
$20,000 with NASA for Construction of Structures and Facilities -- Office Buildings. Signed on 2002-05-15. Completion date: 2002-06-15.
SOFFRONT SOFTWARE INC (45437 WARM SPRINGS BLVD; small business) : $146,006 in 9 contractsfrom 2002 to 2005
Contracts for ADP Software, Programming Services by Army, Navy Signed by year:2000: $0; 2001: $0; 2002: $24,900; 2003: $64,275; 2004: $41,190; 2005: $15,641; 2006: $0.
Biggest contracts:
$43,402 with Army for ADP Software. Taking place in VA. Signed on 2003-06-10. Completion date: 2003-06-30.
$24,900 with Army for ADP Software. Signed on 2002-09-27. Completion date: 2002-10-29.
$18,533, same as above.Signed on 2004-03-11. Completion date: 2005-03-10.
$15,903, same as above.Signed on 2003-09-22. Completion date: 2003-10-03.
Top industries in this zip code by the number of employees in 2005:
2005 - 2018 National Fire Incident Reporting System (NFIRS) incidents
According to the data from the years 2005 - 2018 the average number of fire incidents per year is 42. The highest number of reported fires - 83 took place in 2018, and the least - 6 in 2013. The data has a rising trend.
When looking into fire subcategories, the most reports belonged to: Outside Fires (40.0%), and Structure Fires (33.0%).
Fire incident types reported to NFIRS in Zip Code 94539


 Nearest zip codes: 94538, 94586, 95035, 94536, 95134, 94560.


 According to the data from the years 2005 - 2018 the average number of fire incidents per year is 42. The highest number of reported fires - 83 took place in 2018, and the least - 6 in 2013. The data has a rising trend.
 When looking into fire subcategories, the most reports belonged to: Outside Fires (40.0%), and Structure Fires (33.0%).