Estimated zip code population in 2022: 65,665 Zip code population in 2010: 61,148 Zip code population in 2000: 56,111
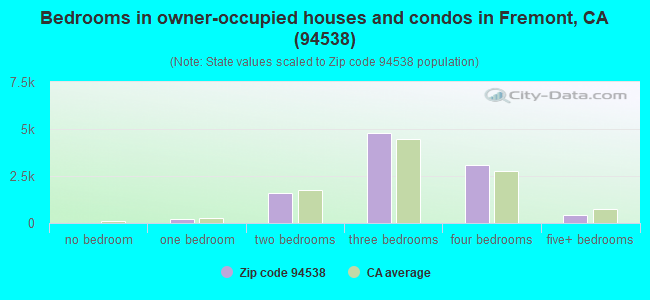
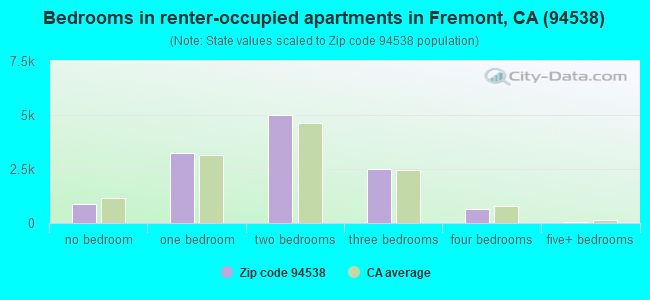
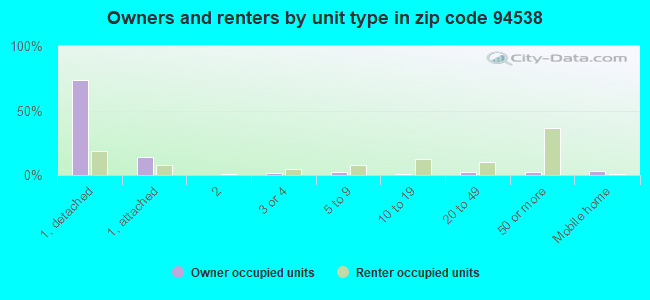
Houses and condos: 23,678 Renter-occupied apartments: 12,365
% of renters here:
55%
State:
44%
March 2022 cost of living index in zip code 94538: 120.2 (high, U.S. average is 100)
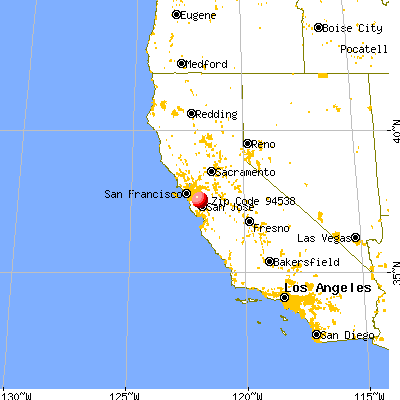
Land area: 16.5 sq. mi. Water area: 0.2 sq. mi.
Population density: 3,989 people per square mile
(average).
OSM Map
General Map
Google Map
MSN Map
OSM Map
General Map
Google Map
MSN Map
OSM Map
General Map
Google Map
MSN Map
OSM Map
General Map
Google Map
MSN Map
Please wait while loading the map...
Real estate property taxes paid for housing units in 2022:
This zip code:
0.6% ($7,492)
California:
0.7% ($4,831)
Median real estate property taxes paid for housing units with mortgages in 2022: $8,322 (0.7%) Median real estate property taxes paid for housing units with no mortgage in 2022: $5,554 (0.5%)
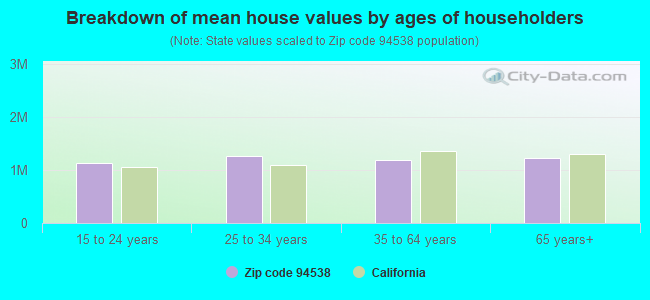
Estimated median house/condo value in 2022: $1,167,396
94538:
$1,167,396
California:
$715,900
According to our research of California and other state lists, there were 36 registered sex offenders living in 94538 zip code as of April 27, 2024. The ratio of all residents to sex offenders in zip code 94538 is 1,874 to 1. The ratio of registered sex offenders to all residents in this zip code is much lower than the state average.
Median resident age:
This zip code:
36.9 years
California median age:
37.9 years
Average household size:
This zip code:
2.9 people
California:
2.8 people
Averages for the 2020 tax year for zip code 94538, filed in 2021:
Average Adjusted Gross Income (AGI) in 2020: $117,668 (Individual Income Tax Returns)
Here:
$117,668
State:
$95,910
Salary/wage: $115,034 (reported on 87.1% of returns)
Here:
$115,034
State:
$77,331
(% of AGI for various income ranges: 1147.5% for AGIs below $25k, 4015.6% for AGIs $25k-50k, 7446.4% for AGIs $50k-75k, 11422.8% for AGIs $75k-100k, 21544.3% for AGIs $100k-200k, 111487.7% for AGIs over 200k)
Taxable interest for individuals: $1,134 (reported on 38.8% of returns)
This zip code:
$1,134
California:
$2,294
(% of AGI for various income ranges: 22.4% for AGIs below $25k, 25.1% for AGIs $25k-50k, 39.8% for AGIs $50k-75k, 50.9% for AGIs $75k-100k, 85.6% for AGIs $100k-200k, 426.3% for AGIs over 200k)
Ordinary dividends: $2,486 (reported on 29.3% of returns)
Here:
$2,486
State:
$10,949
(% of AGI for various income ranges: 23.7% for AGIs below $25k, 30.6% for AGIs $25k-50k, 48.2% for AGIs $50k-75k, 55.3% for AGIs $75k-100k, 120.6% for AGIs $100k-200k, 904.7% for AGIs over 200k)
Net capital gain/loss in AGI: +$19,451 (reported on 32.0% of returns)
Here:
+$19,451
State:
+$49,306
(% of AGI for various income ranges: 18.8% for AGIs below $25k, 56.5% for AGIs $25k-50k, 71.0% for AGIs $50k-75k, 200.2% for AGIs $75k-100k, 459.4% for AGIs $100k-200k, 11391.3% for AGIs over 200k)
Profit/loss from business: +$11,532 (reported on 15.1% of returns)
Here:
+$11,532
State:
+$15,671
(% of AGI for various income ranges: 199.7% for AGIs below $25k, 236.0% for AGIs $25k-50k, 208.6% for AGIs $50k-75k, 252.9% for AGIs $75k-100k, 282.3% for AGIs $100k-200k, 976.6% for AGIs over 200k)
Taxable individual retirement arrangement distribution: $18,244 (reported on 4.3% of returns)
94538:
$18,244
California:
$23,505
(% of AGI for various income ranges: 39.9% for AGIs below $25k, 59.5% for AGIs $25k-50k, 107.5% for AGIs $50k-75k, 133.2% for AGIs $75k-100k, 232.3% for AGIs $100k-200k, 396.2% for AGIs over 200k)
Self-employed (Keogh) retirement plans: $19,876 (reported on 0.5% of returns)
94538:
$19,876
California:
$30,163
(% of AGI for various income ranges: 18.4% for AGIs $50k-75k, 20.7% for AGIs $100k-200k, 137.0% for AGIs over 200k)
Total itemized deductions: $31,316 (reported on 14.9% of returns)
Here:
$31,316
State:
$39,517
(% of AGI for various income ranges: 61.5% for AGIs below $25k, 130.7% for AGIs $25k-50k, 294.7% for AGIs $50k-75k, 575.2% for AGIs $75k-100k, 1098.8% for AGIs $100k-200k, 5102.0% for AGIs over 200k)
Charity contributions: $5,418 (reported on 11.1% of returns)
Here:
$5,418
State:
$12,598
(% of AGI for various income ranges: 2.8% for AGIs below $25k, 10.9% for AGIs $25k-50k, 28.5% for AGIs $50k-75k, 68.3% for AGIs $75k-100k, 138.2% for AGIs $100k-200k, 728.1% for AGIs over 200k)
Taxes paid: $9,330 (reported on 14.8% of returns)
94538:
$9,330
State:
$8,807
(% of AGI for various income ranges: 14.1% for AGIs below $25k, 34.6% for AGIs $25k-50k, 87.1% for AGIs $50k-75k, 179.1% for AGIs $75k-100k, 360.2% for AGIs $100k-200k, 1435.8% for AGIs over 200k)
Earned income credit: $1,747 (reported on 8.2% of returns)
Here:
$1,747
State:
$2,074
(% of AGI for various income ranges: 60.5% for AGIs below $25k, 46.3% for AGIs $25k-50k, 0.5% for AGIs $50k-75k)
Percentage of individuals using paid preparers for their 2020 taxes: 92.5%
Here:
93%
State:
92%
(% for various income ranges: 89.9% for AGIs below $25k, 92.6% for AGIs $25k-50k, 93.2% for AGIs $50k-75k, 92.0% for AGIs $75k-100k, 93.0% for AGIs $100k-200k, 95.2% for AGIs over 200k)
Averages for the 2012 tax year for zip code 94538, filed in 2013:
Average Adjusted Gross Income (AGI) in 2012: $69,368 (Individual Income Tax Returns)
Here:
$69,368
State:
$72,726
Salary/wage: $68,283 (reported on 88.5% of returns)
Here:
$68,283
State:
$59,079
(% of AGI for various income ranges: 76.8% for AGIs below $25k, 82.8% for AGIs $25k-50k, 86.4% for AGIs $50k-75k, 89.9% for AGIs $75k-100k, 91.3% for AGIs $100k-200k, 82.4% for AGIs over 200k)
Taxable interest for individuals: $655 (reported on 37.8% of returns)
This zip code:
$655
California:
$2,146
(% of AGI for various income ranges: 0.9% for AGIs below $25k, 0.4% for AGIs $25k-50k, 0.3% for AGIs $50k-75k, 0.3% for AGIs $75k-100k, 0.3% for AGIs $100k-200k, 0.4% for AGIs over 200k)
Ordinary dividends: $2,180 (reported on 18.7% of returns)
Here:
$2,180
State:
$9,308
(% of AGI for various income ranges: 0.8% for AGIs below $25k, 0.6% for AGIs $25k-50k, 0.5% for AGIs $50k-75k, 0.4% for AGIs $75k-100k, 0.4% for AGIs $100k-200k, 1.0% for AGIs over 200k)
Net capital gain/loss in AGI: +$3,433 (reported on 18.8% of returns)
Here:
+$3,433
State:
+$30,460
(% of AGI for various income ranges: 0.1% for AGIs $25k-50k, 0.2% for AGIs $50k-75k, 0.3% for AGIs $75k-100k, 0.5% for AGIs $100k-200k, 3.7% for AGIs over 200k)
Profit/loss from business: +$12,619 (reported on 13.7% of returns)
Here:
+$12,619
State:
+$17,064
(% of AGI for various income ranges: 9.9% for AGIs below $25k, 4.7% for AGIs $25k-50k, 2.4% for AGIs $50k-75k, 1.5% for AGIs $75k-100k, 1.6% for AGIs $100k-200k, 1.5% for AGIs over 200k)
Taxable individual retirement arrangement distribution: $14,758 (reported on 5.7% of returns)
94538:
$14,758
California:
$19,557
(% of AGI for various income ranges: 2.3% for AGIs below $25k, 1.8% for AGIs $25k-50k, 1.4% for AGIs $50k-75k, 1.4% for AGIs $75k-100k, 1.0% for AGIs $100k-200k, 0.6% for AGIs over 200k)
Self-employment retirement plans: $17,083 (reported on 0.4% of returns)
94538:
$17,083
California:
$24,530
(% of AGI for various income ranges: 0.2% for AGIs $50k-75k, 0.3% for AGIs over 200k)
Total itemized deductions: $25,315 (21% of AGI, reported on 36.2% of returns)
Here:
$25,315
State:
$34,004
Here:
21.2% of AGI
State:
22.7% of AGI
(% of AGI for various income ranges: 9.6% for AGIs below $25k, 9.1% for AGIs $25k-50k, 12.3% for AGIs $50k-75k, 13.0% for AGIs $75k-100k, 14.8% for AGIs $100k-200k, 14.2% for AGIs over 200k)
Charity contributions: $2,423 (reported on 27.8% of returns)
Here:
$2,423
State:
$4,659
(% of AGI for various income ranges: 0.4% for AGIs below $25k, 0.7% for AGIs $25k-50k, 0.8% for AGIs $50k-75k, 1.1% for AGIs $75k-100k, 1.1% for AGIs $100k-200k, 1.0% for AGIs over 200k)
Taxes paid: $10,862 (reported on 36.1% of returns)
94538:
$10,862
State:
$14,448
(% of AGI for various income ranges: 1.9% for AGIs below $25k, 2.1% for AGIs $25k-50k, 3.6% for AGIs $50k-75k, 4.8% for AGIs $75k-100k, 6.7% for AGIs $100k-200k, 8.8% for AGIs over 200k)
Earned income credit: $1,905 (reported on 12.2% of returns)
Here:
$1,905
State:
$2,286
(% of AGI for various income ranges: 4.5% for AGIs below $25k, 0.8% for AGIs $25k-50k)
Percentage of individuals using paid preparers for their 2012 taxes: 55.9%
Here:
56%
State:
64%
(% for various income ranges: 53.6% for AGIs below $25k, 58.1% for AGIs $25k-50k, 59.6% for AGIs $50k-75k, 57.4% for AGIs $75k-100k, 54.0% for AGIs $100k-200k, 52.1% for AGIs over 200k)
Averages for the 2004 tax year for zip code 94538, filed in 2005:
Average Adjusted Gross Income (AGI) in 2004: $53,889 (Individual Income Tax Returns)
Here:
$53,889
State:
$58,600
Salary/wage: $53,227 (reported on 89.3% of returns)
Here:
$53,227
State:
$49,455
(% of AGI for various income ranges: 126.8% for AGIs below $10k, 78.4% for AGIs $10k-25k, 87.4% for AGIs $25k-50k, 90.3% for AGIs $50k-75k, 92.0% for AGIs $75k-100k, 86.1% for AGIs over 100k)
Taxable interest for individuals: $781 (reported on 47.5% of returns)
This zip code:
$781
California:
$2,365
(% of AGI for various income ranges: 5.1% for AGIs below $10k, 1.3% for AGIs $10k-25k, 0.8% for AGIs $25k-50k, 0.6% for AGIs $50k-75k, 0.5% for AGIs $75k-100k, 0.6% for AGIs over 100k)
Taxable dividends: $1,140 (reported on 19.3% of returns)
Here:
$1,140
State:
$4,746
(% of AGI for various income ranges: 2.7% for AGIs below $10k, 0.8% for AGIs $10k-25k, 0.3% for AGIs $25k-50k, 0.3% for AGIs $50k-75k, 0.3% for AGIs $75k-100k, 0.4% for AGIs over 100k)
Net capital gain/loss: +$6,105 (reported on 20.1% of returns)
Here:
+$6,105
State:
+$23,418
(% of AGI for various income ranges: -1.4% for AGIs below $10k, -0.1% for AGIs $10k-25k, 0.0% for AGIs $25k-50k, 0.2% for AGIs $50k-75k, 0.6% for AGIs $75k-100k, 5.7% for AGIs over 100k)
Profit/loss from business: +$12,683 (reported on 12.6% of returns)
Here:
+$12,683
State:
+$16,826
(% of AGI for various income ranges: -4.1% for AGIs below $10k, 6.3% for AGIs $10k-25k, 3.6% for AGIs $25k-50k, 2.1% for AGIs $50k-75k, 2.3% for AGIs $75k-100k, 3.1% for AGIs over 100k)
IRA payment deduction: $3,012 (reported on 3.1% of returns)
94538:
$3,012
California:
$3,192
(% of AGI for various income ranges: 0.4% for AGIs below $10k, 0.2% for AGIs $10k-25k, 0.2% for AGIs $25k-50k, 0.2% for AGIs $50k-75k, 0.2% for AGIs $75k-100k, 0.1% for AGIs over 100k)
Self-employed pension: $14,089 (reported on 0.7% of returns)
Here:
$14,089
California:
$17,688
(% of AGI for various income ranges: 0.1% for AGIs $25k-50k, 0.1% for AGIs $50k-75k, 0.2% for AGIs $75k-100k, 0.3% for AGIs over 100k)
Total itemized deductions: $23,257 (27% of AGI, reported on 38.8% of returns)
Here:
$23,257
State:
$28,113
Here:
26.9% of AGI
State:
25.3% of AGI
(% of AGI for various income ranges: 22.9% for AGIs below $10k, 10.6% for AGIs $10k-25k, 12.9% for AGIs $25k-50k, 17.0% for AGIs $50k-75k, 17.8% for AGIs $75k-100k, 18.7% for AGIs over 100k)
Charity contributions deductions: $2,375 (3% of AGI, reported on 32.5% of returns)
Here:
$2,375
State:
$3,923
Here:
2.7% of AGI
State:
3.3% of AGI
(% of AGI for various income ranges: 0.6% for AGIs below $10k, 0.6% for AGIs $10k-25k, 1.0% for AGIs $25k-50k, 1.4% for AGIs $50k-75k, 1.5% for AGIs $75k-100k, 1.8% for AGIs over 100k)
Total tax: $7,469 (reported on 81.4% of returns)
94538:
$7,469
State:
$10,761
(% of AGI for various income ranges: 3.8% for AGIs below $10k, 4.5% for AGIs $10k-25k, 7.4% for AGIs $25k-50k, 9.5% for AGIs $50k-75k, 10.7% for AGIs $75k-100k, 15.5% for AGIs over 100k)
Earned income credit: $1,454 (reported on 9.6% of returns)
Here:
$1,454
State:
$1,763
Percentage of individuals using paid preparers for their 2004 taxes: 57.2%
Here:
57%
State:
66%
(% for various income ranges: 50.8% for AGIs below $10k, 61.1% for AGIs $10k-25k, 59.7% for AGIs $25k-50k, 58.3% for AGIs $50k-75k, 53.9% for AGIs $75k-100k, 55.0% for AGIs over 100k)
Likely homosexual households (counted as self-reported same-sex unmarried-partner households)
Lesbian couples: 0.1% of all households
Gay men: 0.1% of all households
Household received Food Stamps/SNAP in the past 12 months: 1,183 Household did not receive Food Stamps/SNAP in the past 12 months: 20,951
Women who had a birth in the past 12 months: 728 (662 now married, 62 unmarried) Women who did not have a birth in the past 12 months: 15,988 (8,851 now married, 7,032 unmarried)
Housing units in zip code 94538 with a mortgage: 7,007 (566 second mortgage, 41 home equity loan, 404 both second mortgage and home equity loan) Houses without a mortgage: 117
Median monthly owner costs for units with a mortgage: $3,252 Median monthly owner costs for units without a mortgage: $910
Residents with income below the poverty level in 2022:
This zip code:
5.1%
Whole state:
12.2%
Residents with income below 50% of the poverty level in 2022:
This zip code:
2.0%
Whole state:
6.2%
Median number of rooms in houses and condos:
Here:
5.5
State:
6.0
Median number of rooms in apartments:
Here:
3.4
State:
3.9
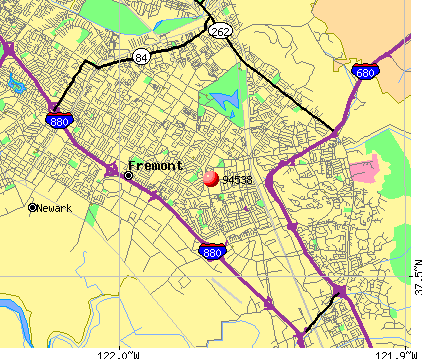
Notable locations in this zip code not listed on our city pages
Notable locations in zip code 94538: Newark Substation (A), South Alameda County Hall of Justice (B), Irvington Branch Alameda County Library (C), Fremont Main Library (D), Fremont Community Center (E), Fremont Fire Department Station 7 (F), Fremont Fire Department Station 3 (G), Fremont Fire Department Station 1 (H). Display/hide their locations on the map
Shopping Centers: Town Fair Shopping Center (1), The Crossroads Shopping Center (2), Mowry East Shopping Center (3), Los Arboles Shopping Center (4), Gateway Plaza Shopping Center (5), Fremont Shopping Center (6), Fremont Plaza Shopping Center (7), Fremont Hub Shopping Center (8). Display/hide their locations on the map
Churches in zip code 94538 include: Vedic Dharma Samaj Temple (A), Our Lady of Guadalupe Church (B), Irvington Presbyterian Church (C), Irvington Baptist Church (D), Good Shepherd Lutheran Church (E), Church of Jesus Christ of Latter Day Saints (F). Display/hide their locations on the map
Parks in zip code 94538 include: Mission View Park (1), Azevada Park (2), Blacow Park (3), Grimmer Park (4), Irvington Community Park (5), Marshall Park (6), Noll Park (7), Rix Park (8), Williams Historical Park (9). Display/hide their locations on the map
10,794 married couples with children.
1,570 single-parent households (320 men, 1,250 women).
34.2% of residents of 94538 zip code speak English at home.
13.4% of residents speak Spanish at home (67% very well, 17% well, 14% not well, 1% not at all).
22.6% of residents speak other Indo-European language at home (76% very well, 18% well, 4% not well, 2% not at all).
29.0% of residents speak Asian or Pacific Island language at home (60% very well, 23% well, 14% not well, 4% not at all).
1.3% of residents speak other language at home (72% very well, 19% well, 8% not well, 1% not at all).
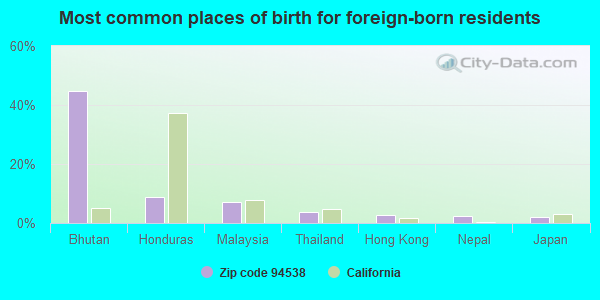
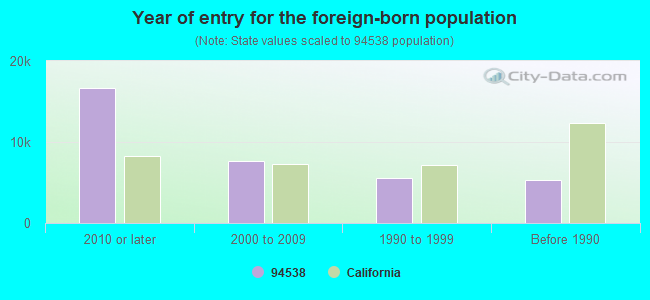
Foreign born population: 32,295 (49.2%) (44.1% of them are naturalized citizens)
Major facilities with environmental interests located in this zip code:
FLASH ELECTRONICS INC (46440 FREMONT BLVD in FREMONT, CA)
STATE MASTER (California - Hazardous Waste Tracking) - HAZARDOU WASTE PROGRAM (Integrated Compliance Information System) - ICIS-09-2004-0049, FORMAL ENFORCEMENT ACTION Large Quantity Generators, more that 1000 kg of hazardous waste/month (Resource Conservation and Recovery Act (tracking hazardous waste)) Large Quantity Generators, more that 1000 kg of hazardous waste/month (Resource Conservation and Recovery Act (tracking hazardous waste)) TRI REPORTER (Tracking of toxic chemicals releasing facilities) Business SIC classification: ELECTRONIC COMPONENTS Business NAICS classification: PRINTED CIRCUIT ASSEMBLY (ELECTRONIC ASSEMBLY) MANUFACTURING. Organizations: MATTHEW LIU (CONTACT/OPERATOR)
, CARR AMERICA (CONTACT/OWNER)
EXCLUSIVE METAL CRAFT INCORPORATED (41041 ALBRAE STREET in FREMONT, CA)
STATE MASTER (California - Hazardous Waste Tracking) - HAZARDOU WASTE PROGRAM CRITERIA AND HAZARDOUS AIR POLLUTANT INVENTORY (Inventory of air pollution sources) (Resource Conservation and Recovery Act (tracking hazardous waste)) Small Quantity Generators, between 100 kg and 1000 kg of hazardous waste/month (Resource Conservation and Recovery Act (tracking hazardous waste)) - notification Business SIC classification: TOP, BODY, AND UPHOLSTERY REPAIR SHOPS AND PAINT SHOPS Business NAICS classification: AUTOMOTIVE BODY, PAINT, AND INTERIOR REPAIR AND MAINTENANCE. Organizations: SHAHIN MOGHADAM (CONTACT/OWNER)
Alternative names: EXCLUSIVE METALCRAFT INC, EXCLUSIVE METALCRAFT INC
HOYA CORPORATION USA (3400 EDISON WAY in FREMONT, CA)
STATE MASTER (California - Hazardous Waste Tracking) - HAZARDOU WASTE PROGRAM CRITERIA AND HAZARDOUS AIR POLLUTANT INVENTORY (Inventory of air pollution sources) HAZARDOUS WASTE BIENNIAL REPORTER (Resource Conservation and Recovery Act (tracking hazardous waste)) Large Quantity Generators, more that 1000 kg of hazardous waste/month (Resource Conservation and Recovery Act (tracking hazardous waste)) Large Quantity Generators, more that 1000 kg of hazardous waste/month (Resource Conservation and Recovery Act (tracking hazardous waste)) TRI REPORTER (Tracking of toxic chemicals releasing facilities) Business SIC classification: FLAT GLASS; OPTICAL INSTRUMENTS AND LENSES Business NAICS classification: OTHER PRESSED AND BLOWN GLASS AND GLASSWARE MANUFACTURING.; OPTICAL INSTRUMENT AND LENS MANUFACTURING. Organizations: HOYA CORP USA (CONTACT/OPERATOR)
, HOYA HOLDINGS INC (CONTACT/OWNER)
NEW UNITED MOTOR MANUFACTURING INCORPORATED (45500 FREMONT BLVD. in FREMONT, CA)
AIR MAJOR (AIRS/AFS) STATE MASTER (California - Hazardous Waste Tracking) - HAZARDOU WASTE PROGRAM COMPLIANCE ACTIVITY (Tracking inspections of insecticide, fungicide, and rodenticide, and toxic substances) CRITERIA AND HAZARDOUS AIR POLLUTANT INVENTORY (Inventory of air pollution sources) HAZARDOUS WASTE BIENNIAL REPORTER (Resource Conservation and Recovery Act (tracking hazardous waste)) Large Quantity Generators, more that 1000 kg of hazardous waste/month (Resource Conservation and Recovery Act (tracking hazardous waste)) TSD (Resource Conservation and Recovery Act (tracking hazardous waste)) TRI REPORTER (Tracking of toxic chemicals releasing facilities) Business SIC classification: MOTOR VEHICLES AND PASSENGER CAR BODIES; ELECTRIC AND OTHER SERVICES COMBINED Business NAICS classification: ALL OTHER PLASTICS PRODUCT MANUFACTURING.; LIGHT TRUCK AND UTILITY VEHICLE MANUFACTURING.; MOTOR VEHICLE BODY MANUFACTURING. Organizations: NEW UNITED MOTOR MANUFACTURING, INC. (CONTACT/OPERATOR)
FLASH ELECTRONICS INC (4050 STARBOARD DR in FREMONT, CA)
STATE MASTER (California - Hazardous Waste Tracking) - HAZARDOU WASTE PROGRAM Large Quantity Generators, more that 1000 kg of hazardous waste/month (Resource Conservation and Recovery Act (tracking hazardous waste)) Large Quantity Generators, more that 1000 kg of hazardous waste/month (Resource Conservation and Recovery Act (tracking hazardous waste)) TRI REPORTER (Tracking of toxic chemicals releasing facilities) Business SIC classification: ELECTRONIC COMPONENTS Business NAICS classification: PRINTED CIRCUIT ASSEMBLY (ELECTRONIC ASSEMBLY) MANUFACTURING. Organizations: MATTHEW LIU (CONTACT/OPERATOR)
, MISSION WEST PROP (CONTACT/OWNER)
CHAHAYA OPTRONICS (1055 PAGE AVENUE in FREMONT, CA)
(Integrated Compliance Information System) - ICIS-09-2000-0248, FORMAL ENFORCEMENT ACTION COMPLIANCE ACTIVITY (Tracking inspections of insecticide, fungicide, and rodenticide, and toxic substances) CRITERIA AND HAZARDOUS AIR POLLUTANT INVENTORY (Inventory of air pollution sources) (Resource Conservation and Recovery Act (tracking hazardous waste)) HAZARDOUS WASTE BIENNIAL REPORTER (Resource Conservation and Recovery Act (tracking hazardous waste)) Small Quantity Generators, between 100 kg and 1000 kg of hazardous waste/month (Resource Conservation and Recovery Act (tracking hazardous waste)) - notification TRI REPORTER (Tracking of toxic chemicals releasing facilities) Business SIC and NAICS classification: MAGNETIC AND OPTICAL RECORDING MEDIA Organizations: MMC TECH (CONTACT/OPERATOR)
, GLOBAL KATO HG LLC (CONTACT/OWNER)
Alternative names: HMT TECH. CORP.
CHEVRON STATION NO 92510 (41500 BLACOW RD in FREMONT, CA)
STATE MASTER (California - Hazardous Waste Tracking) - HAZARDOU WASTE PROGRAM HAZARDOUS WASTE BIENNIAL REPORTER (Resource Conservation and Recovery Act (tracking hazardous waste)) Large Quantity Generators, more that 1000 kg of hazardous waste/month (Resource Conservation and Recovery Act (tracking hazardous waste)) Large Quantity Generators, more that 1000 kg of hazardous waste/month (Resource Conservation and Recovery Act (tracking hazardous waste)) Organizations: CHEVRON PRODUCTS CO. (CONTACT/OPERATOR)
Alternative names: CHEVRON 92510
GLOBAL PLATING INCORPORATED (44620 GRIMMER BLVD. in FREMONT, CA)
STATE MASTER (California - Hazardous Waste Tracking) - HAZARDOU WASTE PROGRAM CRITERIA AND HAZARDOUS AIR POLLUTANT INVENTORY (Inventory of air pollution sources) HAZARDOUS WASTE BIENNIAL REPORTER (Resource Conservation and Recovery Act (tracking hazardous waste)) Large Quantity Generators, more that 1000 kg of hazardous waste/month (Resource Conservation and Recovery Act (tracking hazardous waste)) TRI REPORTER (Tracking of toxic chemicals releasing facilities) Business SIC and NAICS classification: ELECTROPLATING, PLATING, POLISHING, ANODIZING, AND COLORING Organizations: GLOBAL PLATING, INC. (CONTACT/OPERATOR)
AMERICAN XTAL TECHNOLOGY (4311 SOLAR WAY in FREMONT, CA)
STATE MASTER (California - Hazardous Waste Tracking) - HAZARDOU WASTE PROGRAM COMPLIANCE ACTIVITY (Tracking inspections of insecticide, fungicide, and rodenticide, and toxic substances) CRITERIA AND HAZARDOUS AIR POLLUTANT INVENTORY (Inventory of air pollution sources) HAZARDOUS WASTE BIENNIAL REPORTER (Resource Conservation and Recovery Act (tracking hazardous waste)) Large Quantity Generators, more that 1000 kg of hazardous waste/month (Resource Conservation and Recovery Act (tracking hazardous waste)) TRI REPORTER (Tracking of toxic chemicals releasing facilities) Business SIC classification: SEMICONDUCTORS AND RELATED DEVICES; ELECTRICAL APPARATUS AND EQUIPMENT, WIRING SUPPLIES, AND CONSTRUCTION MATERIALS Business NAICS classification: SEMICONDUCTOR AND RELATED DEVICE MANUFACTURING. Alternative names: AXT, AXT INC.
CELOTEX CORPORATION (6400 STEVENSON BLVD in FREMONT, CA)
STATE MASTER (California - Hazardous Waste Tracking) - HAZARDOU WASTE PROGRAM CRITERIA AND HAZARDOUS AIR POLLUTANT INVENTORY (Inventory of air pollution sources) Large Quantity Generators, more that 1000 kg of hazardous waste/month (Resource Conservation and Recovery Act (tracking hazardous waste)) - notification TRI REPORTER (Tracking of toxic chemicals releasing facilities) Business SIC classification: ASPHALT FELTS AND COATINGS Organizations: CERTAINTEED CORPORATION (CONTACT/OWNER)
Alternative names: CERTAINTEED CORP
EIC CORPORATION (45738 NORTHPORT LOOP in FREMONT, CA)
STATE MASTER (California - Hazardous Waste Tracking) - HAZARDOU WASTE PROGRAM CRITERIA AND HAZARDOUS AIR POLLUTANT INVENTORY (Inventory of air pollution sources) HAZARDOUS WASTE BIENNIAL REPORTER (Resource Conservation and Recovery Act (tracking hazardous waste)) Large Quantity Generators, more that 1000 kg of hazardous waste/month (Resource Conservation and Recovery Act (tracking hazardous waste)) - notification Business SIC classification: SEMICONDUCTORS AND RELATED DEVICES Business NAICS classification: SEMICONDUCTOR AND RELATED DEVICE MANUFACTURING.
LAM RESEARCH CORPORATION (4650 CUSHING PKWY in FREMONT, CA)
STATE MASTER (California - Hazardous Waste Tracking) - HAZARDOU WASTE PROGRAM CRITERIA AND HAZARDOUS AIR POLLUTANT INVENTORY (Inventory of air pollution sources) HAZARDOUS WASTE BIENNIAL REPORTER (Resource Conservation and Recovery Act (tracking hazardous waste)) Small Quantity Generators, between 100 kg and 1000 kg of hazardous waste/month (Resource Conservation and Recovery Act (tracking hazardous waste)) - notification TRI REPORTER (Tracking of toxic chemicals releasing facilities) Business SIC classification: SEMICONDUCTORS AND RELATED DEVICES Business NAICS classification: ALL OTHER INDUSTRIAL MACHINERY MANUFACTURING. Organizations: NORTHPORT ASSOCIATERS (CONTACT/OWNER)
FINE PITCH TECHNOLOGY (44300 CHRISTY STREET in FREMONT, CA)
STATE MASTER (California - Hazardous Waste Tracking) - HAZARDOU WASTE PROGRAM CRITERIA AND HAZARDOUS AIR POLLUTANT INVENTORY (Inventory of air pollution sources) Large Quantity Generators, more that 1000 kg of hazardous waste/month (Resource Conservation and Recovery Act (tracking hazardous waste)) - notification TRI REPORTER (Tracking of toxic chemicals releasing facilities) Business SIC classification: PRINTED CIRCUIT BOARDS; ELECTRONIC COMPONENTS Alternative names: FINE PITCH TECH. INC. A SOLECTRON SUBSIDIARY
Housing units lacking complete plumbing facilities: 0.7% Housing units lacking complete kitchen facilities: 1.6%
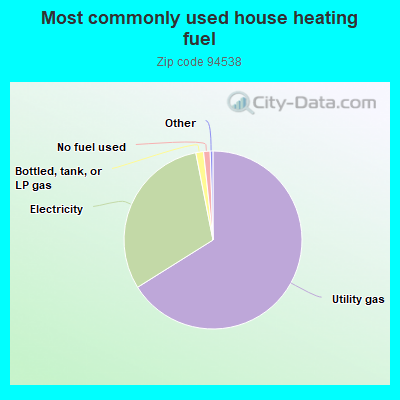
66.1%Utility gas
30.8%Electricity
1.4%Bottled, tank, or LP gas
1.2%No fuel used
Population in 1990: 45,430. Population change in the 1990s: +10,681 (+23.5%).
Place of birth for U.S.-born residents:
This state: 27,070
Northeast: 1,064
Midwest: 1,257
South: 1,588
West: 1,441
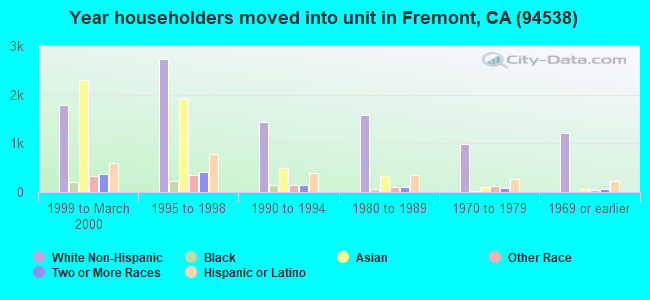
52% of the 94538 zip code residents lived in the same house 5 years ago. Out of people who lived in different houses, 52% lived in this county. Out of people who lived in different counties, 50% lived in California.
84% of the 94538 zip code residents lived in the same house 1 year ago. Out of people who lived in different houses, 42% moved from this county. Out of people who lived in different houses, 29% moved from different county within same state. Out of people who lived in different houses, 11% moved from different state. Out of people who lived in different houses, 20% moved from abroad.
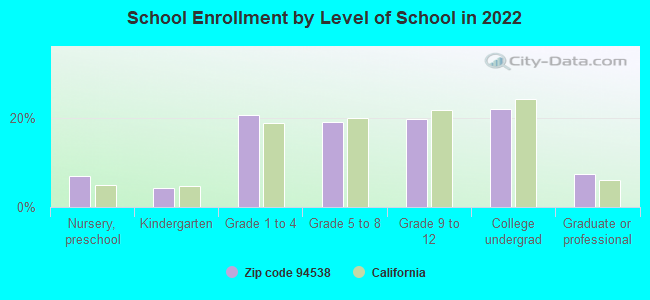
Private vs. public school enrollment:
Students in private schools in grades 1 to 8 (elementary and middle school): 688
Here:
11.5%
California:
10.5%
Students in private schools in grades 9 to 12 (high school): 106
Here:
3.6%
California:
8.5%
Students in private undergraduate colleges: 271
Here:
8.3%
California:
15.9%
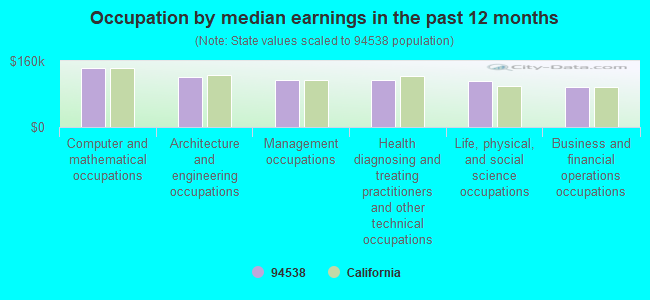
Occupation by median earnings in the past 12 months ($)
143,913Computer and mathematical occupations
120,487Architecture and engineering occupations
114,682Management occupations
114,073Health diagnosing and treating practitioners and other technical occupations
111,537Life, physical, and social science occupations
97,680Business and financial operations occupations
Companies with biggest federal contracts located in this zip code (FREMONT, CA):
TECHNOLOGY FOR COMMUNICATIONS (47300 KATO ROAD; small business) 50 employees, $0 revenue. Small Disadvantaged Business, Woman Owned Business: $16,891,068 in 26 contractsfrom 2000 to 2005
Contracts for Miscellaneous Electrical and Electronic Components, Antennas, Waveguides, and Related Equipment, Laboratory Equipment and Supplies, Hardware, Commercial, and moreby Air Force, Navy, United States Coast Guard (disused code: now 7008), Federal Technology Service, and others Signed by year:2000: $1,796,219; 2001: $5,671,797; 2002: $5,056,508; 2003: $4,234,311; 2004: $123,936; 2005: $8,297; 2006: $0.
Biggest contracts:
$4,776,166 with Air Force for Miscellaneous Electrical and Electronic Components. Signed on 2002-05-08. Completion date: 2004-01-31.
$2,972,553, same as above.Signed on 2001-07-13. Completion date: 2003-09-30.
$2,441,286, same as above.Signed on 2001-05-03. Completion date: 2003-09-30.
$2,398,074 with Air Force for Antennas, Waveguides, and Related Equipment. Signed on 2003-01-31. Completion date: 2003-07-31.
SYSCO FOOD SERVICES OF SAN FRA (5900 STEWART AVE) : $13,697,000 in 2308 contractsfrom 2000 to 2006
Contracts for Dairy Foods and Eggs, Meat, Poultry, and Fish, Drugs and Biologicals, Special Dietary Foods and Food Specialty Preparations, and moreby Defense Logistics Agency, Army, U.S. Coast Guard Signed by year:2000: $94,800; 2001: $430,235; 2002: $191,375; 2003: $91,172; 2004: $2,231,324; 2005: $7,186,624; 2006: $3,471,470.
Biggest contracts:
$880,002 with Defense Logistics Agency for Dairy Foods and Eggs. Signed on 2005-11-28. Completion date: 2005-11-30.
$277,157, same as above.Signed on 2004-11-16. Completion date: 2004-11-16.
$117,000 with Army for Meat, Poultry, and Fish. Taking place in NV. Signed on 2001-03-26. Completion date: 2001-06-01.
$87,464 with Defense Logistics Agency for Dairy Foods and Eggs. Signed on 2001-10-24. Completion date: 2001-10-24.
ATG INC (47375 FREMONT BLVD; small business) : $7,198,382 in 101 contractsfrom 1999 to 2006
Contracts for Development of Environmental Impact Statements and Assessments, Hazardous Substance Removal, Cleanup, and Disposal Services and Operational Support, Maintenance, Repair or Alteration of Real Property -- Waste Treatment and Storage Facilities, Storage Tanks, and moreby Army, Tennessee Valley Authority, Navy, Department of Veterans Affairs, and others Signed by year:2000: $2,069,021; 2001: $2,883,739; 2002: $1,453,056; 2003: $329,753; 2004: -$106,593; 2005: $219,327; 2006: -$1,880.
Biggest contracts:
$844,227 with Army for Development of Environmental Impact Statements and Assessments. Signed on 2001-06-29. Completion date: 2003-09-30.
$842,000 with Tennessee Valley Authority for Hazardous Substance Removal, Cleanup, and Disposal Services and Operational Support. Taking place in TN. Signed on 2000-01-15. Completion date: 2000-09-15.
$574,594 with Army for Development of Environmental Impact Statements and Assessments. Signed on 2001-04-19. Completion date: 2001-09-30.
$325,136 with Navy for Maintenance, Repair or Alteration of Real Property -- Waste Treatment and Storage Facilities. Taking place in TN. Signed on 2002-12-04. Completion date: 2003-12-19.
MISSION MEDICAL, INC (5670 STEWART AVE; small business) : $4,780,541 in 10 contractsfrom 2000 to 2003
Contracts for Other Medical -- Engineering Development (R&D), Other Medical -- Basic Research (R&D) by Army Signed by year:2000: $845,950; 2001: $1,534,659; 2002: $1,929,966; 2003: $469,966; 2004: $0; 2005: $0; 2006: $0.
Biggest contracts:
$1,199,968 with Army for Other Medical -- Engineering Development (R&D). Signed on 2002-08-09. Completion date: 2003-07-25.
$1,080,510, same as above.Signed on 2001-04-09. Completion date: 2003-07-25.
$745,950 with Army for Other Medical -- Basic Research (R&D). Signed on 2000-01-14. Completion date: 2002-06-13.
$469,966 with Army for Other Medical -- Engineering Development (R&D). Signed on 2003-05-13. Completion date: 2005-01-16.
TCI INTERNATIONAL, INC (47300 KATO RD) : $4,354,122 in 17 contractsfrom 1999 to 2005
Contracts for Antennas, Waveguides, and Related Equipment, Miscellaneous Electrical and Electronic Components, Telephone and Telegraph Equipment, Radio and Television Communication Equipment, Except Airborne, and moreby Navy, Broadcasting Board of Governors, Air Force, U.S. Coast Guard, and others Signed by year:2000: $0; 2001: $0; 2002: $0; 2003: $2,566,953; 2004: $796,965; 2005: $381,199; 2006: $0.
Biggest contracts:
$2,004,366 with Navy for Antennas, Waveguides, and Related Equipment. Signed on 2003-03-19. Completion date: 2003-12-15.
$749,000 with Broadcasting Board of Governors for Antennas, Waveguides, and Related Equipment. Signed on 2004-06-28. Completion date: 2004-11-25.
$609,005 with Air Force for Miscellaneous Electrical and Electronic Components. Signed on 1999-12-23. Completion date: 2000-12-31.
$343,373 with Navy for Antennas, Waveguides, and Related Equipment. Signed on 2003-07-29. Completion date: 2004-03-27.
DB CONTROL (1120 AUBURN ST; small business) : $3,124,255 in 22 contractsfrom 1999 to 2005
Contracts for Amplifiers, Radar Equipment, Except Airborne, Radio and Television Communication Equipment, Except Airborne, Electrical and Electronic Properties Measuring and Testing Instruments, and moreby Army, Navy, Air Force Signed by year:2000: $721,420; 2001: $344,650; 2002: $447,340; 2003: $5,050; 2004: $219,695; 2005: $1,211,350; 2006: $0.
Biggest contracts:
$469,000 with Army for Amplifiers. Signed on 2005-07-01. Completion date: 2005-11-10.
$468,500, same as above.Signed on 2005-09-30. Completion date: 2006-07-31.
$293,875 with Navy for Radar Equipment, Except Airborne. Signed on 2002-05-13. Completion date: 2003-05-20.
$287,420 with Army for Amplifiers. Signed on 2000-09-05. Completion date: 2001-02-06.
THEMIS COMPUTER (47200 BAYSIDE PKWY; small business) : $2,737,546 in 40 contractsfrom 1999 to 2006
Contracts for ADP Components, ADP Central Processing Unit (CPU, Computer), Hybrid, Miscellaneous Special Industry Machinery, ADPE System Configuration, and moreby Navy Signed by year:2000: $312,520; 2001: $502,865; 2002: $267,888; 2003: $939,425; 2004: $497,567; 2005: $21,039; 2006: $112,362.
Biggest contracts:
$341,980 with Navy for ADP Components. Taking place in MD. Signed on 2003-03-19. Completion date: 2003-04-21.
$341,840 with Navy for ADP Components. Signed on 2004-03-10. Completion date: 2004-04-09.
$334,020, same as above.Signed on 2001-06-25. Completion date: 2001-09-03.
$312,520 with Navy for ADP Central Processing Unit (CPU, Computer), Hybrid. Signed on 2000-04-24. Completion date: 2000-05-31.
APPLIED SPECTRA, INC (48834 KATO RD; small business) : $1,464,906 in 7 contractsfrom 2004 to 2006
Contracts for Other Research and Development -- Basic Research (R&D), Other Research and Development -- Management and Support (R&D), Other Defense -- Management and Support (R&D), Defense Tank - Automotive -- Basic Research (R&D) by Army, Air Force Signed by year:2000: $0; 2001: $0; 2002: $0; 2003: $0; 2004: $170,000; 2005: $919,906; 2006: $375,000.
Biggest contracts:
$749,954 with Army for Other Research and Development -- Basic Research (R&D). Signed on 2005-09-28. Completion date: 2007-09-28.
$250,000 with Air Force for Other Research and Development -- Management and Support (R&D). Signed on 2006-04-28. Completion date: 2008-04-28.
$125,000, same as above.Signed on 2006-07-11. Completion date: 2008-04-28.
$100,000 with Army for Other Research and Development -- Basic Research (R&D). Signed on 2004-07-19. Completion date: 2005-01-31.
MICROGENICS CORPORATION (46360 FREMONT BLVD) : $1,138,756 in 32 contractsfrom 2000 to 2005
Contracts for In Vitro Diagnostic Substances, Reagents, Test Kits, and Sets, Medical and Surgical Instruments, Equipment, and Supplies, Drugs and Biologicals, Optical Instruments, Test Equipment, Components and Accessories by Army, Navy Signed by year:2000: $112,535; 2001: $0; 2002: $223,481; 2003: $131,653; 2004: $379,049; 2005: $292,038; 2006: $0.
Biggest contracts:
$101,254 with Army for In Vitro Diagnostic Substances, Reagents, Test Kits, and Sets. Taking place in HI. Signed on 2004-11-09. Completion date: 2005-09-30.
$88,704, same as above.Signed on 2004-11-09. Completion date: 2005-09-30.
$70,560 with Army for In Vitro Diagnostic Substances, Reagents, Test Kits, and Sets. Signed on 2002-12-18. Completion date: 2003-09-30.
$68,600 with Army for Medical and Surgical Instruments, Equipment, and Supplies. Signed on 2005-04-01. Completion date: 2005-04-25.
LS TECHNOLOGIES INC (44160 OLD WARM SPRINGS BLV; small business) : $949,421 in 5 contractsfrom 2003 to 2004
Contracts for Other Defense -- Management and Support (R&D), Defense Missile and Space Systems -- Basic Research (R&D), Other Defense -- Operational Systems Development (R&D) by Army, Missile Defense Agency Signed by year:2000: $0; 2001: $0; 2002: $0; 2003: $506,297; 2004: $443,124; 2005: $0; 2006: $0.
Biggest contracts:
$386,726 with Army for Other Defense -- Management and Support (R&D). Signed on 2003-10-31. Completion date: 2005-10-31.
$343,126, same as above.Signed on 2004-10-28. Completion date: 2005-10-31.
$99,998 with Missile Defense Agency for Defense Missile and Space Systems -- Basic Research (R&D). Signed on 2004-06-15. Completion date: 2004-12-15.
$69,738 with Army for Other Defense -- Operational Systems Development (R&D). Signed on 2003-02-04. Completion date: 2003-12-03.
Top industries in this zip code by the number of employees in 2005:
2005 - 2018 National Fire Incident Reporting System (NFIRS) incidents
According to the data from the years 2005 - 2018 the average number of fire incidents per year is 132. The highest number of fires - 217 took place in 2017, and the least - 34 in 2013. The data has an increasing trend.
When looking into fire subcategories, the most incidents belonged to: Structure Fires (42.4%), and Outside Fires (38.3%).
Fire incident types reported to NFIRS in Zip Code 94538


 Nearest zip codes: 94539, 94536, 94560, 95134, 95002, 95035.


 According to the data from the years 2005 - 2018 the average number of fire incidents per year is 132. The highest number of fires - 217 took place in 2017, and the least - 34 in 2013. The data has an increasing trend.
 When looking into fire subcategories, the most incidents belonged to: Structure Fires (42.4%), and Outside Fires (38.3%).