Estimated zip code population in 2022: 70,851 Zip code population in 2010: 68,790 Zip code population in 2000: 66,533
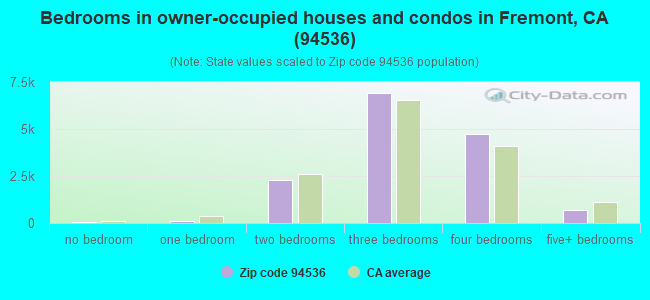
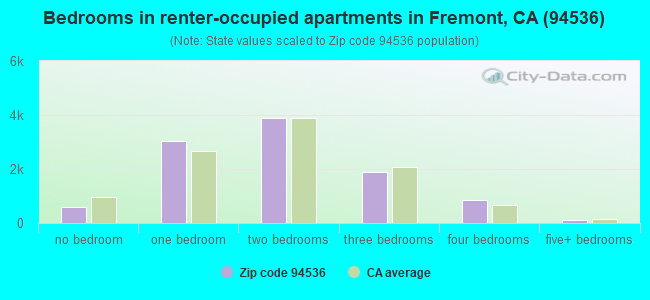
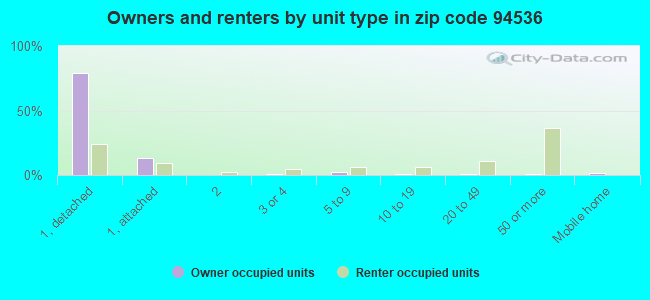
Houses and condos: 26,369 Renter-occupied apartments: 10,395
% of renters here:
41%
State:
44%
March 2022 cost of living index in zip code 94536: 120.4 (high, U.S. average is 100)
Land area: 14.6 sq. mi. Water area: 0.0 sq. mi.
Population density: 4,859 people per square mile
(average).
OSM Map
General Map
Google Map
MSN Map
OSM Map
General Map
Google Map
MSN Map
OSM Map
General Map
Google Map
MSN Map
OSM Map
General Map
Google Map
MSN Map
Please wait while loading the map...
Real estate property taxes paid for housing units in 2022:
This zip code:
0.6% ($7,304)
California:
0.7% ($4,831)
Median real estate property taxes paid for housing units with mortgages in 2022: $8,624 (0.7%) Median real estate property taxes paid for housing units with no mortgage in 2022: $4,697 (0.4%)
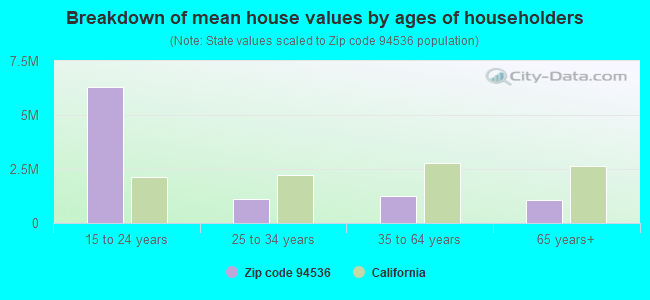
Estimated median house/condo value in 2022: $1,259,802
94536:
$1,259,802
California:
$715,900
According to our research of California and other state lists, there were 29 registered sex offenders living in 94536 zip code as of April 27, 2024. The ratio of all residents to sex offenders in zip code 94536 is 2,539 to 1. The ratio of registered sex offenders to all residents in this zip code is much lower than the state average.
Median resident age:
This zip code:
39.1 years
California median age:
37.9 years
Average household size:
This zip code:
2.8 people
California:
2.8 people
Averages for the 2020 tax year for zip code 94536, filed in 2021:
Average Adjusted Gross Income (AGI) in 2020: $141,831 (Individual Income Tax Returns)
Here:
$141,831
State:
$95,910
Salary/wage: $136,143 (reported on 84.9% of returns)
Here:
$136,143
State:
$77,331
(% of AGI for various income ranges: 1161.2% for AGIs below $25k, 4012.6% for AGIs $25k-50k, 7328.2% for AGIs $50k-75k, 10863.2% for AGIs $75k-100k, 20732.1% for AGIs $100k-200k, 120570.8% for AGIs over 200k)
Taxable interest for individuals: $1,526 (reported on 46.0% of returns)
This zip code:
$1,526
California:
$2,294
(% of AGI for various income ranges: 29.8% for AGIs below $25k, 35.3% for AGIs $25k-50k, 54.9% for AGIs $50k-75k, 75.7% for AGIs $75k-100k, 130.0% for AGIs $100k-200k, 635.3% for AGIs over 200k)
Ordinary dividends: $4,440 (reported on 35.9% of returns)
Here:
$4,440
State:
$10,949
(% of AGI for various income ranges: 36.1% for AGIs below $25k, 61.9% for AGIs $25k-50k, 101.0% for AGIs $50k-75k, 154.2% for AGIs $75k-100k, 283.3% for AGIs $100k-200k, 1610.6% for AGIs over 200k)
Net capital gain/loss in AGI: +$25,171 (reported on 36.9% of returns)
Here:
+$25,171
State:
+$49,306
(% of AGI for various income ranges: 40.0% for AGIs below $25k, 50.3% for AGIs $25k-50k, 132.2% for AGIs $50k-75k, 190.0% for AGIs $75k-100k, 591.6% for AGIs $100k-200k, 13829.9% for AGIs over 200k)
Profit/loss from business: +$14,071 (reported on 14.9% of returns)
Here:
+$14,071
State:
+$15,671
(% of AGI for various income ranges: 164.5% for AGIs below $25k, 215.6% for AGIs $25k-50k, 238.6% for AGIs $50k-75k, 284.0% for AGIs $75k-100k, 414.2% for AGIs $100k-200k, 1327.9% for AGIs over 200k)
Taxable individual retirement arrangement distribution: $22,139 (reported on 6.8% of returns)
94536:
$22,139
California:
$23,505
(% of AGI for various income ranges: 58.7% for AGIs below $25k, 103.5% for AGIs $25k-50k, 159.6% for AGIs $50k-75k, 293.3% for AGIs $75k-100k, 409.3% for AGIs $100k-200k, 864.8% for AGIs over 200k)
Self-employed (Keogh) retirement plans: $18,848 (reported on 0.8% of returns)
94536:
$18,848
California:
$30,163
(% of AGI for various income ranges: 3.4% for AGIs below $25k, 13.9% for AGIs $50k-75k, 33.5% for AGIs $100k-200k, 165.0% for AGIs over 200k)
Total itemized deductions: $34,233 (reported on 19.8% of returns)
Here:
$34,233
State:
$39,517
(% of AGI for various income ranges: 97.6% for AGIs below $25k, 180.4% for AGIs $25k-50k, 428.0% for AGIs $50k-75k, 674.8% for AGIs $75k-100k, 1439.3% for AGIs $100k-200k, 6598.0% for AGIs over 200k)
Charity contributions: $7,077 (reported on 15.6% of returns)
Here:
$7,077
State:
$12,598
(% of AGI for various income ranges: 4.5% for AGIs below $25k, 18.4% for AGIs $25k-50k, 48.5% for AGIs $50k-75k, 67.5% for AGIs $75k-100k, 205.3% for AGIs $100k-200k, 1249.7% for AGIs over 200k)
Taxes paid: $9,429 (reported on 19.8% of returns)
94536:
$9,429
State:
$8,807
(% of AGI for various income ranges: 24.6% for AGIs below $25k, 44.3% for AGIs $25k-50k, 111.9% for AGIs $50k-75k, 210.2% for AGIs $75k-100k, 447.0% for AGIs $100k-200k, 1711.1% for AGIs over 200k)
Earned income credit: $1,730 (reported on 6.4% of returns)
Here:
$1,730
State:
$2,074
(% of AGI for various income ranges: 53.8% for AGIs below $25k, 43.2% for AGIs $25k-50k, 0.6% for AGIs $50k-75k)
Percentage of individuals using paid preparers for their 2020 taxes: 92.8%
Here:
93%
State:
92%
(% for various income ranges: 90.4% for AGIs below $25k, 92.1% for AGIs $25k-50k, 92.6% for AGIs $50k-75k, 92.5% for AGIs $75k-100k, 92.8% for AGIs $100k-200k, 95.7% for AGIs over 200k)
Averages for the 2012 tax year for zip code 94536, filed in 2013:
Average Adjusted Gross Income (AGI) in 2012: $84,383 (Individual Income Tax Returns)
Here:
$84,383
State:
$72,726
Salary/wage: $81,070 (reported on 85.5% of returns)
Here:
$81,070
State:
$59,079
(% of AGI for various income ranges: 72.6% for AGIs below $25k, 79.9% for AGIs $25k-50k, 82.5% for AGIs $50k-75k, 81.5% for AGIs $75k-100k, 86.7% for AGIs $100k-200k, 79.0% for AGIs over 200k)
Taxable interest for individuals: $1,090 (reported on 45.5% of returns)
This zip code:
$1,090
California:
$2,146
(% of AGI for various income ranges: 1.5% for AGIs below $25k, 0.6% for AGIs $25k-50k, 0.6% for AGIs $50k-75k, 0.5% for AGIs $75k-100k, 0.4% for AGIs $100k-200k, 0.6% for AGIs over 200k)
Ordinary dividends: $3,356 (reported on 26.7% of returns)
Here:
$3,356
State:
$9,308
(% of AGI for various income ranges: 1.9% for AGIs below $25k, 1.0% for AGIs $25k-50k, 1.0% for AGIs $50k-75k, 1.1% for AGIs $75k-100k, 1.0% for AGIs $100k-200k, 1.1% for AGIs over 200k)
Net capital gain/loss in AGI: +$7,747 (reported on 24.7% of returns)
Here:
+$7,747
State:
+$30,460
(% of AGI for various income ranges: 0.1% for AGIs $25k-50k, 0.1% for AGIs $50k-75k, 0.3% for AGIs $75k-100k, 0.7% for AGIs $100k-200k, 6.3% for AGIs over 200k)
Profit/loss from business: +$16,818 (reported on 14.6% of returns)
Here:
+$16,818
State:
+$17,064
(% of AGI for various income ranges: 10.5% for AGIs below $25k, 4.5% for AGIs $25k-50k, 3.1% for AGIs $50k-75k, 2.9% for AGIs $75k-100k, 2.5% for AGIs $100k-200k, 1.9% for AGIs over 200k)
Taxable individual retirement arrangement distribution: $16,818 (reported on 8.3% of returns)
94536:
$16,818
California:
$19,557
(% of AGI for various income ranges: 2.9% for AGIs below $25k, 1.9% for AGIs $25k-50k, 2.4% for AGIs $50k-75k, 2.3% for AGIs $75k-100k, 1.5% for AGIs $100k-200k, 1.1% for AGIs over 200k)
Self-employment retirement plans: $19,733 (reported on 0.9% of returns)
94536:
$19,733
California:
$24,530
(% of AGI for various income ranges: 0.2% for AGIs $25k-50k, 0.2% for AGIs $100k-200k, 0.4% for AGIs over 200k)
Total itemized deductions: $30,083 (21% of AGI, reported on 43.4% of returns)
Here:
$30,083
State:
$34,004
Here:
21.2% of AGI
State:
22.7% of AGI
(% of AGI for various income ranges: 11.9% for AGIs below $25k, 10.9% for AGIs $25k-50k, 13.3% for AGIs $50k-75k, 15.4% for AGIs $75k-100k, 17.1% for AGIs $100k-200k, 16.0% for AGIs over 200k)
Charity contributions: $3,168 (reported on 35.5% of returns)
Here:
$3,168
State:
$4,659
(% of AGI for various income ranges: 0.5% for AGIs below $25k, 0.9% for AGIs $25k-50k, 1.1% for AGIs $50k-75k, 1.3% for AGIs $75k-100k, 1.3% for AGIs $100k-200k, 1.6% for AGIs over 200k)
Taxes paid: $13,636 (reported on 43.3% of returns)
94536:
$13,636
State:
$14,448
(% of AGI for various income ranges: 2.6% for AGIs below $25k, 2.6% for AGIs $25k-50k, 4.0% for AGIs $50k-75k, 5.5% for AGIs $75k-100k, 7.7% for AGIs $100k-200k, 9.4% for AGIs over 200k)
Earned income credit: $1,879 (reported on 9.8% of returns)
Here:
$1,879
State:
$2,286
(% of AGI for various income ranges: 4.2% for AGIs below $25k, 0.7% for AGIs $25k-50k)
Percentage of individuals using paid preparers for their 2012 taxes: 54.7%
Here:
55%
State:
64%
(% for various income ranges: 51.7% for AGIs below $25k, 56.7% for AGIs $25k-50k, 56.6% for AGIs $50k-75k, 57.4% for AGIs $75k-100k, 55.0% for AGIs $100k-200k, 52.7% for AGIs over 200k)
Averages for the 2004 tax year for zip code 94536, filed in 2005:
Average Adjusted Gross Income (AGI) in 2004: $63,976 (Individual Income Tax Returns)
Here:
$63,976
State:
$58,600
Salary/wage: $61,796 (reported on 86.1% of returns)
Here:
$61,796
State:
$49,455
(% of AGI for various income ranges: 200.7% for AGIs below $10k, 73.9% for AGIs $10k-25k, 82.3% for AGIs $25k-50k, 84.3% for AGIs $50k-75k, 86.8% for AGIs $75k-100k, 81.7% for AGIs over 100k)
Taxable interest for individuals: $1,307 (reported on 55.9% of returns)
This zip code:
$1,307
California:
$2,365
(% of AGI for various income ranges: 9.9% for AGIs below $10k, 2.7% for AGIs $10k-25k, 1.5% for AGIs $25k-50k, 1.2% for AGIs $50k-75k, 0.8% for AGIs $75k-100k, 0.9% for AGIs over 100k)
Taxable dividends: $1,898 (reported on 28.7% of returns)
Here:
$1,898
State:
$4,746
(% of AGI for various income ranges: 9.1% for AGIs below $10k, 1.6% for AGIs $10k-25k, 1.0% for AGIs $25k-50k, 0.8% for AGIs $50k-75k, 0.7% for AGIs $75k-100k, 0.7% for AGIs over 100k)
Net capital gain/loss: +$7,435 (reported on 27.5% of returns)
Here:
+$7,435
State:
+$23,418
(% of AGI for various income ranges: 0.4% for AGIs below $10k, -0.0% for AGIs $10k-25k, 0.2% for AGIs $25k-50k, 0.3% for AGIs $50k-75k, 0.7% for AGIs $75k-100k, 5.9% for AGIs over 100k)
Profit/loss from business: +$16,531 (reported on 14.7% of returns)
Here:
+$16,531
State:
+$16,826
(% of AGI for various income ranges: -12.7% for AGIs below $10k, 7.6% for AGIs $10k-25k, 4.2% for AGIs $25k-50k, 2.9% for AGIs $50k-75k, 3.4% for AGIs $75k-100k, 3.9% for AGIs over 100k)
IRA payment deduction: $3,270 (reported on 3.8% of returns)
94536:
$3,270
California:
$3,192
(% of AGI for various income ranges: 0.6% for AGIs below $10k, 0.3% for AGIs $10k-25k, 0.3% for AGIs $25k-50k, 0.2% for AGIs $50k-75k, 0.2% for AGIs $75k-100k, 0.1% for AGIs over 100k)
Self-employed pension: $15,119 (reported on 1.3% of returns)
Here:
$15,119
California:
$17,688
(% of AGI for various income ranges: 0.1% for AGIs $10k-25k, 0.1% for AGIs $25k-50k, 0.2% for AGIs $50k-75k, 0.2% for AGIs $75k-100k, 0.5% for AGIs over 100k)
Total itemized deductions: $25,924 (25% of AGI, reported on 45.7% of returns)
Here:
$25,924
State:
$28,113
Here:
25.4% of AGI
State:
25.3% of AGI
(% of AGI for various income ranges: 46.5% for AGIs below $10k, 14.5% for AGIs $10k-25k, 14.3% for AGIs $25k-50k, 18.5% for AGIs $50k-75k, 20.3% for AGIs $75k-100k, 19.1% for AGIs over 100k)
Charity contributions deductions: $2,690 (3% of AGI, reported on 40.1% of returns)
Here:
$2,690
State:
$3,923
Here:
2.5% of AGI
State:
3.3% of AGI
(% of AGI for various income ranges: 1.6% for AGIs below $10k, 0.9% for AGIs $10k-25k, 1.2% for AGIs $25k-50k, 1.6% for AGIs $50k-75k, 1.8% for AGIs $75k-100k, 1.9% for AGIs over 100k)
Total tax: $9,634 (reported on 83.0% of returns)
94536:
$9,634
State:
$10,761
(% of AGI for various income ranges: 7.6% for AGIs below $10k, 4.7% for AGIs $10k-25k, 7.5% for AGIs $25k-50k, 9.5% for AGIs $50k-75k, 10.4% for AGIs $75k-100k, 16.0% for AGIs over 100k)
Earned income credit: $1,442 (reported on 8.2% of returns)
Here:
$1,442
State:
$1,763
Percentage of individuals using paid preparers for their 2004 taxes: 57.2%
Here:
57%
State:
66%
(% for various income ranges: 49.4% for AGIs below $10k, 59.3% for AGIs $10k-25k, 59.4% for AGIs $25k-50k, 61.4% for AGIs $50k-75k, 57.2% for AGIs $75k-100k, 55.4% for AGIs over 100k)
Likely homosexual households (counted as self-reported same-sex unmarried-partner households)
Lesbian couples: 0.0% of all households
Gay men: 0.1% of all households
Household received Food Stamps/SNAP in the past 12 months: 922 Household did not receive Food Stamps/SNAP in the past 12 months: 23,815
Women who had a birth in the past 12 months: 741 (652 now married, 86 unmarried) Women who did not have a birth in the past 12 months: 16,175 (9,325 now married, 6,728 unmarried)
Housing units in zip code 94536 with a mortgage: 10,326 (1,134 second mortgage, 19 home equity loan, 994 both second mortgage and home equity loan) Houses without a mortgage: 171
Median monthly owner costs for units with a mortgage: $3,416 Median monthly owner costs for units without a mortgage: $794
Residents with income below the poverty level in 2022:
This zip code:
7.7%
Whole state:
12.2%
Residents with income below 50% of the poverty level in 2022:
This zip code:
3.5%
Whole state:
6.2%
Median number of rooms in houses and condos:
Here:
5.8
State:
6.0
Median number of rooms in apartments:
Here:
3.3
State:
3.9
Notable locations in this zip code not listed on our city pages
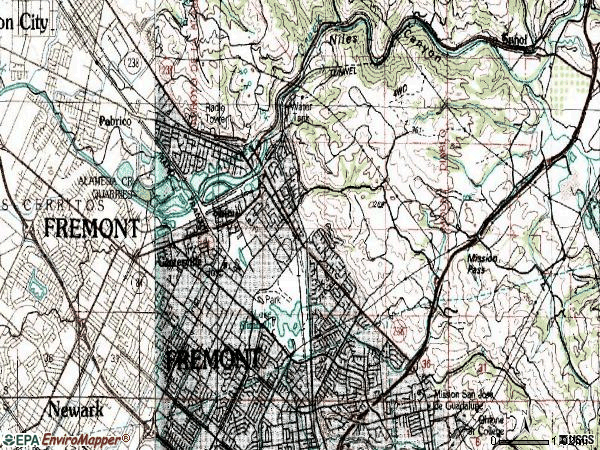
Notable locations in zip code 94536: Federal Aviation Administration Communication Center (A), Vallejo Mill Ruins (B), Landmark Letters (C), Niles Community Center (D), Niles Branch Alameda County Library (E), Centerville Branch Alameda County Library (F), Fremont Fire Department Station 6 (G), Fremont Fire Department Station 2 (H). Display/hide their locations on the map
Churches in zip code 94536 include: Saint James Episcopal Church (A), Revival Tabernacle (B), Prince of Peace Lutheran Church (C), Niles Congregational Church (D), Lighthouse Bible Fellowship Church (E), Holy Spirit Church (F), Grace Baptist Church (G), Central Church of Christ (H), Centerville Presbyterian Church (I). Display/hide their locations on the map
Parks in zip code 94536 include: Alameda Creek Quarries Regional Park (1), Brookvale Park (2), Cabrillo Park (3), Centerville Community Park (4), Tak Fudenna Memorial Stadium (5), Fremont Stadium (6), Niles Community Park (7), Patterson Park (8), Rancho Arroyo Park (9). Display/hide their locations on the map
12,894 married couples with children.
1,356 single-parent households (414 men, 942 women).
45.4% of residents of 94536 zip code speak English at home.
8.6% of residents speak Spanish at home (71% very well, 16% well, 11% not well, 2% not at all).
18.7% of residents speak other Indo-European language at home (81% very well, 12% well, 6% not well, 1% not at all).
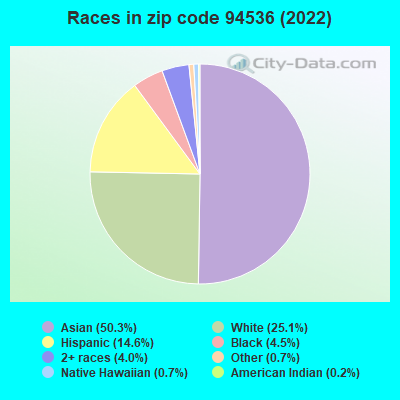
26.4% of residents speak Asian or Pacific Island language at home (67% very well, 21% well, 10% not well, 2% not at all).
1.5% of residents speak other language at home (73% very well, 22% well, 3% not well, 2% not at all).
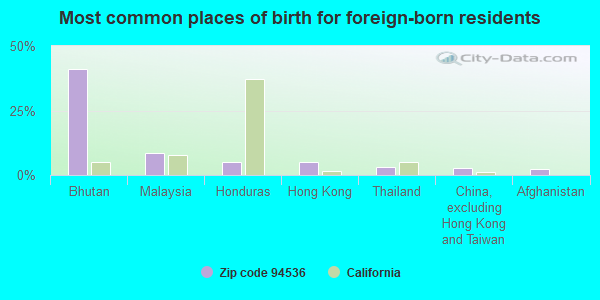
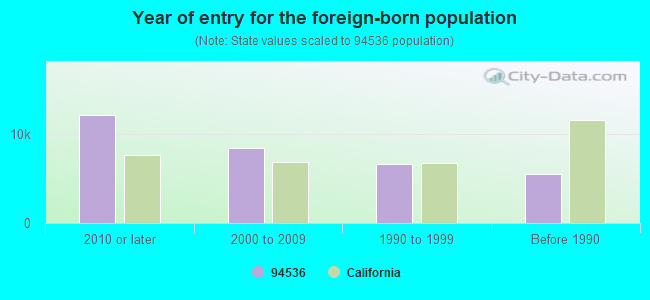
Foreign born population: 30,829 (43.5%) (54.5% of them are naturalized citizens)
Major facilities with environmental interests located in this zip code:
HENKEL SURFACE TECHNOLOGIES (37899 NILES BOULEVARD in FREMONT, CA)
STATE MASTER (California - Hazardous Waste Tracking) - HAZARDOU WASTE PROGRAM HAZARDOUS WASTE BIENNIAL REPORTER (Resource Conservation and Recovery Act (tracking hazardous waste)) Large Quantity Generators, more that 1000 kg of hazardous waste/month (Resource Conservation and Recovery Act (tracking hazardous waste)) TSD (Resource Conservation and Recovery Act (tracking hazardous waste)) TRI REPORTER (Tracking of toxic chemicals releasing facilities) Business SIC classification: CHEMICALS AND CHEMICAL PREPARATIONS Business NAICS classification: ALL OTHER MISCELLANEOUS CHEMICAL PRODUCT AND PREPARATION MANUFACTURING. Alternative names: HENKEL CORP PARKER AMCHEM
EXXON S/S 7-3599 (39990 FREMONT BLVD in FREMONT, CA)
STATE MASTER (California - Hazardous Waste Tracking) - HAZARDOU WASTE PROGRAM Small Quantity Generators, between 100 kg and 1000 kg of hazardous waste/month (Resource Conservation and Recovery Act (tracking hazardous waste)) - notification Small Quantity Generators, between 100 kg and 1000 kg of hazardous waste/month (Resource Conservation and Recovery Act (tracking hazardous waste)) - notification Organizations: EXXON MOBIL (CONTACT/OWNER)
, VALERO REFINING CO CALIF (CONTACT/OWNER)
Alternative names: EXXON MOBIL CORPORATION #735990, EXXON RAS 73599, VALERO REFINING CO CAL NO 73599
CENTRAL CHEVROLET (4949 THORTON AVENUE in FREMONT, CA)
STATE MASTER (California - Hazardous Waste Tracking) - HAZARDOU WASTE PROGRAM CRITERIA AND HAZARDOUS AIR POLLUTANT INVENTORY (Inventory of air pollution sources) Large Quantity Generators, more that 1000 kg of hazardous waste/month (Resource Conservation and Recovery Act (tracking hazardous waste)) Business SIC classification: MOTOR VEHICLE DEALERS (NEW AND USED); TOP, BODY, AND UPHOLSTERY REPAIR SHOPS AND PAINT SHOPS
L&O MACHINE (3900 THORNTON AVE in FREMONT, CA)
STATE MASTER (California - Hazardous Waste Tracking) - HAZARDOU WASTE PROGRAM Small Quantity Generators, between 100 kg and 1000 kg of hazardous waste/month (Resource Conservation and Recovery Act (tracking hazardous waste)) - notification Organizations: H WALKER (CONTACT/OWNER)
CALGON INDUSTRIES INC (37399 CENTRALMONT PLACE in FREMONT, CA)
STATE MASTER (California - Hazardous Waste Tracking) - HAZARDOU WASTE PROGRAM Small Quantity Generators, between 100 kg and 1000 kg of hazardous waste/month (Resource Conservation and Recovery Act (tracking hazardous waste)) - notification Business NAICS classification: SHEET METAL WORK MANUFACTURING. Organizations: MANFRED CALGON (CONTACT/OWNER)
Alternative names: GALGON INDUSTRIES INC
ABES BUILT RIGHT TRANSMISSION (4546 PERALTA BLVD in FREMONT, CA)
STATE MASTER (California - Hazardous Waste Tracking) - HAZARDOU WASTE PROGRAM Small Quantity Generators, between 100 kg and 1000 kg of hazardous waste/month (Resource Conservation and Recovery Act (tracking hazardous waste))
EDS AUTO CLINIC (37557 DUSTERBERRY WAY in FREMONT, CA)
STATE MASTER (California - Hazardous Waste Tracking) - HAZARDOU WASTE PROGRAM Small Quantity Generators, between 100 kg and 1000 kg of hazardous waste/month (Resource Conservation and Recovery Act (tracking hazardous waste)) - notification Business NAICS classification: GENERAL AUTOMOTIVE REPAIR.
CHEVRON STATION NO 97526 (37011 FREMONT BLVD in FREMONT, CA)
STATE MASTER (California - Hazardous Waste Tracking) - HAZARDOU WASTE PROGRAM Small Quantity Generators, between 100 kg and 1000 kg of hazardous waste/month (Resource Conservation and Recovery Act (tracking hazardous waste)) - notification Organizations: CHEVRON PRODUCTS CO (CONTACT/OWNER)
CHEVRON INC (501 MOWRY AVENUE in FREMONT, CA)
STATE MASTER (California - Hazardous Waste Tracking) - HAZARDOU WASTE PROGRAM Small Quantity Generators, between 100 kg and 1000 kg of hazardous waste/month (Resource Conservation and Recovery Act (tracking hazardous waste)) - notification Organizations: CHEVRON PRODUCTS CO (CONTACT/OWNER)
Alternative names: CHEVRON STATION NO 95795
AMERICAN HIGH (36300 FREMONT BLVD. in FREMONT, CA)
(National Center for Education Statistics) - STATE ID-0130062 Organizations: FREMONT UNIFIED (SCHOOL DISTRICT)
MATTOS (JOHN G.) ELEMENTARY (37944 FARWELL DR. in FREMONT, CA)
(National Center for Education Statistics) - STATE ID-6000723 Organizations: FREMONT UNIFIED (SCHOOL DISTRICT)
MALONEY (TOM) ELEMENTARY (38700 LOGAN DR. in FREMONT, CA)
(National Center for Education Statistics) - STATE ID-6000715 Organizations: FREMONT UNIFIED (SCHOOL DISTRICT)
CENTERVILLE JUNIOR HIGH (37720 FREMONT BLVD. in FREMONT, CA)
(National Center for Education Statistics) - STATE ID-6056873 Organizations: FREMONT UNIFIED (SCHOOL DISTRICT)
Housing units lacking complete plumbing facilities: 0.4% Housing units lacking complete kitchen facilities: 1.5%
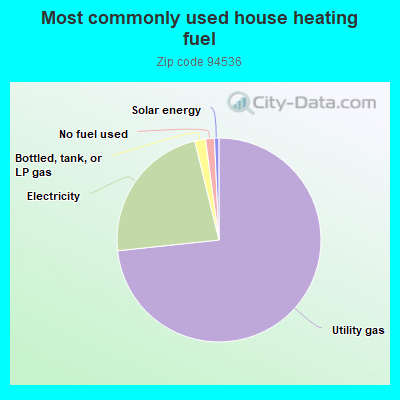
73.1%Utility gas
22.8%Electricity
1.7%Bottled, tank, or LP gas
1.4%No fuel used
0.7%Solar energy
Population in 1990: 58,580. Population change in the 1990s: +7,953 (+13.6%).
Place of birth for U.S.-born residents:
This state: 31,445
Northeast: 1,581
Midwest: 2,444
South: 2,393
West: 1,445
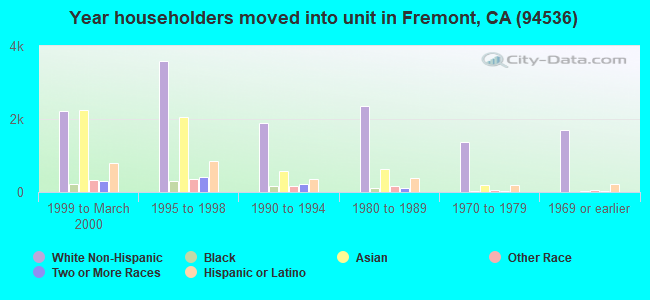
52% of the 94536 zip code residents lived in the same house 5 years ago. Out of people who lived in different houses, 56% lived in this county. Out of people who lived in different counties, 50% lived in California.
91% of the 94536 zip code residents lived in the same house 1 year ago. Out of people who lived in different houses, 39% moved from this county. Out of people who lived in different houses, 28% moved from different county within same state. Out of people who lived in different houses, 14% moved from different state. Out of people who lived in different houses, 25% moved from abroad.
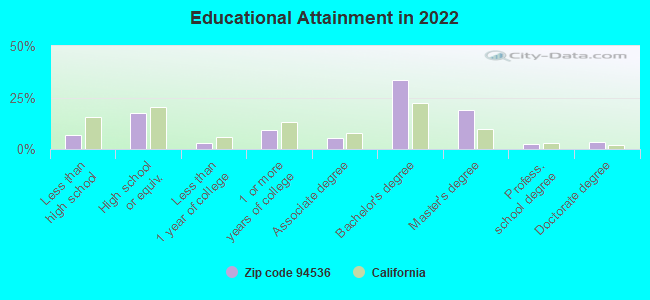
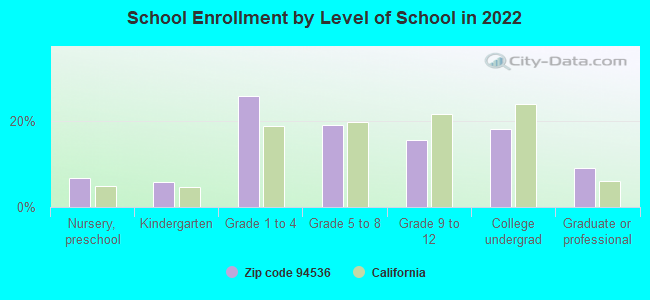
Private vs. public school enrollment:
Students in private schools in grades 1 to 8 (elementary and middle school): 883
Here:
12.2%
California:
10.5%
Students in private schools in grades 9 to 12 (high school): 245
Here:
9.7%
California:
8.5%
Students in private undergraduate colleges: 227
Here:
7.8%
California:
15.9%
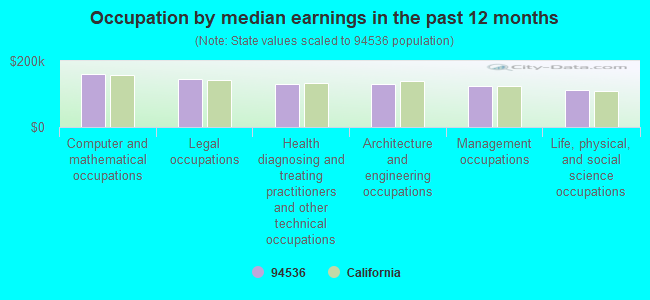
Occupation by median earnings in the past 12 months ($)
161,339Computer and mathematical occupations
144,957Legal occupations
131,529Health diagnosing and treating practitioners and other technical occupations
129,848Architecture and engineering occupations
125,328Management occupations
111,585Life, physical, and social science occupations
Companies with federal contracts located in this zip code (FREMONT, CA):
NOVA COMMERCIAL COMPANY INC (38323 BLACOW RD; small business) : $20,788,032 in 162 contractsfrom 1999 to 2006
Contracts for Custodial Janitorial Services, Facilities Operations Support Services, Non-nuclear Ship Repair (West) Ship repair (including overhauls and conversions) performed on. non-nuclear propelled and nonpropelled ships west of the 108th meridian, Maintenance, Repair or Alteration of Real Property -- Other Administrative Facilities and Service Buildings, and moreby Navy, U.S. Coast Guard, United States Coast Guard (disused code: now 7008) Signed by year:2000: $299,067; 2001: $4,416,210; 2002: $1,181,480; 2003: $6,171,222; 2004: $2,808,082; 2005: $2,841,993; 2006: $152,760.
Biggest contracts:
$1,871,338 with Navy for Custodial Janitorial Services. Signed on 1999-10-01. Completion date: 2000-09-30.
$1,825,621, same as above.Signed on 2004-10-01. Completion date: 2005-09-30.
$1,754,275, same as above.Signed on 2001-10-01. Completion date: 2001-10-01.
$1,724,651 with Navy for Facilities Operations Support Services. Signed on 2005-09-30. Completion date: 2006-09-30.
LW MICROSYSTEMS (37466 STONEWOOD DR; small business) : $339,994 in 4 contractsfrom 2004 to 2005
$100,000 with Air Force for Defense Missile and Space Systems -- Operational Systems Development (R&D). Signed on 2005-01-28. Completion date: 2005-11-14.
$100,000 with Missile Defense Agency for Defense Missile and Space Systems -- Basic Research (R&D). Signed on 2004-06-18. Completion date: 2004-12-18.
$70,000 with NASA for Aeronautics and Space Technology -- Basic Research (R&D). Signed on 2005-01-21. Completion date: 2005-07-25.
$69,994, same as above.Signed on 2005-01-21. Completion date: 2005-07-25.
EBAYTEK USA INC (2450 PERACTA BLVD SUITE 11; small business)
$47,200 with Army for ADP Support Equipment. Signed on 2003-06-19. Completion date: 2003-07-11.
MACSDESIGN STUDIO (4866 RICHMOND AVE; small business) : $8,665 in 3 contractsfrom 2004 to 2006
$3,415 with Army for ADP Software. Taking place in NH. Signed on 2006-02-27. Completion date: 2006-03-01.
$2,750 with Army for ADP Software. Taking place in RI. Signed on 2004-07-02. Completion date: 2004-07-09.
$2,500 with Army for ADP Software. Taking place in NH. Signed on 2005-09-12. Completion date: 2005-10-11.
Top industries in this zip code by the number of employees in 2005:
Administrative and Support and Waste Management and Remediation Services: Temporary Help Services (250-499 employees: 1 establishment, 100-249 employees: 1 establishment, 50-99 employees: 2 establishments, 20-49 employees: 1 establishment, 1-4 employees: 1 establishment)
Health Care and Social Assistance: Nursing Care Facilities (100-249: 2, 50-99: 1, 20-49: 1, 10-19: 1)
Health Care and Social Assistance: Child Day Care Services (100-249: 1, 20-49: 2, 5-9: 11, 1-4: 15)
2005 - 2018 National Fire Incident Reporting System (NFIRS) incidents
According to the data from the years 2005 - 2018 the average number of fire incidents per year is 83. The highest number of fires - 145 took place in 2018, and the least - 15 in 2013. The data has an increasing trend.
When looking into fire subcategories, the most incidents belonged to: Outside Fires (44.8%), and Structure Fires (40.2%).
Fire incident types reported to NFIRS in Zip Code 94536


 Nearest zip codes: 94587, 94538, 94560, 94539, 94544, 94542.
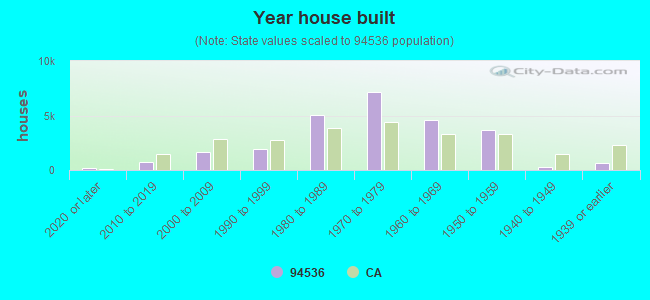


 According to the data from the years 2005 - 2018 the average number of fire incidents per year is 83. The highest number of fires - 145 took place in 2018, and the least - 15 in 2013. The data has an increasing trend.
 When looking into fire subcategories, the most incidents belonged to: Outside Fires (44.8%), and Structure Fires (40.2%).