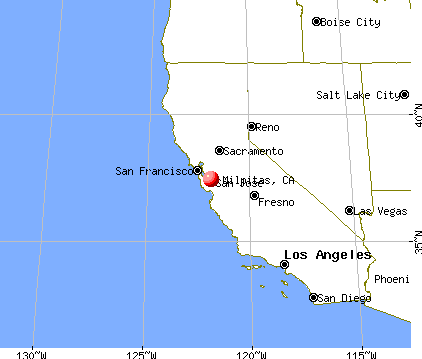
Milpitas, California
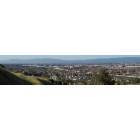
Milpitas: Milpitas Panorama, taken from Summitpoint
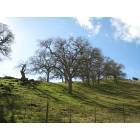
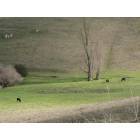
Milpitas: Hill with trees in Milpitas
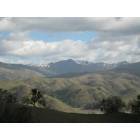
Milpitas: Snowtop in winter time

Milpitas: Milpitas City Hall at night. Pond side, with Pan sculpture.
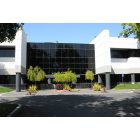
Milpitas: California College of Nursing is a great Nursing School in Milpitas.
Milpitas: Pastures in east Milpitas
- add
your
Submit your own pictures of this city and show them to the world
- OSM Map
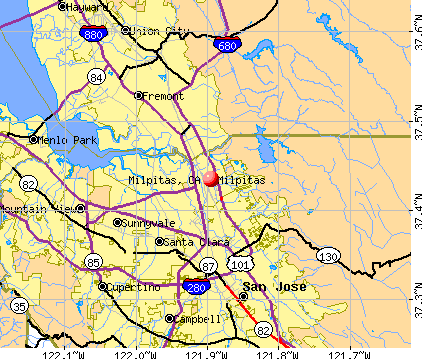
- General Map
- Google Map
- MSN Map
Population change since 2000: +24.0%
 |
| Males: 40,383 | |
| Females: 37,355 |
| Median resident age: | 38.2 years |
| California median age: | 37.9 years |
Zip codes: 95035.
| Milpitas: | $169,818 |
| CA: | $91,551 |
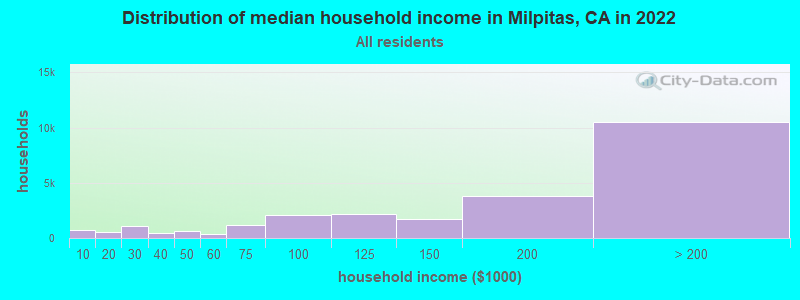
Estimated per capita income in 2022: $67,918 (it was $27,823 in 2000)
Milpitas city income, earnings, and wages data
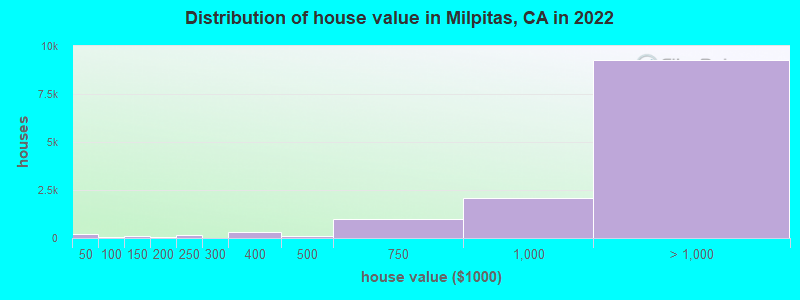
Estimated median house or condo value in 2022: over $1,000,000 (it was $363,100 in 2000)
| Milpitas: | over $1,000,000 |
| CA: | $715,900 |
Mean prices in 2022: all housing units: over $1,000,000; detached houses: over $1,000,000; townhouses or other attached units: over $1,000,000; in 3-to-4-unit structures: over $1,000,000; in 5-or-more-unit structures: over $1,000,000; mobile homes: $387,996
Median gross rent in 2022: $3,010.
(4.3% for White Non-Hispanic residents, 7.1% for Black residents, 10.7% for Hispanic or Latino residents, 19.3% for American Indian residents, 9.4% for other race residents, 3.9% for two or more races residents)
Detailed information about poverty and poor residents in Milpitas, CA

Compare current foreclosures in Milpitas, CA:
| Photo | Address | Area | Beds / Baths | Price | Details |
|---|---|---|---|---|---|

|
#1
Russell Ln
Milpitas, CA 95035
|
2,144 sq. feet
|
2 baths 4 beds |
show details | |

|
#2
Pescadero Ct
Milpitas, CA 95035
|
1,773 sq. feet
|
2 baths 4 beds |
show details | |

|
#3
Parc Place Dr
Milpitas, CA 95035
|
1,530 sq. feet
|
2 baths 3 beds |
show details | |

|
#4
Alvarez Cmn
Milpitas, CA 95035
|
2,045 sq. feet
|
2 baths 3 beds |
show details | |

|
#5
Mattos Dr
Milpitas, CA 95035
|
1,387 sq. feet
|
2 baths 3 beds |
show details | |

|
#6
Calle Mesa Alta
Milpitas, CA 95035
|
1,528 sq. feet
|
2 baths 3 beds |
show details | |

|
#7
Valmy St
Milpitas, CA 95035
|
2,050 sq. feet
|
2 baths 3 beds |
show details | |

|
#8
Traughber St
Milpitas, CA 95035
|
1,186 sq. feet
|
2 baths 4 beds |
show details | |

|
#9
Autumn Wind
Milpitas, CA 95035
|
1,353 sq. feet
|
2 baths 2 beds |
show details | |

|
#10
Lawton Dr
Milpitas, CA 95035
|
1,187 sq. feet
|
2 baths 4 beds |
show details |
| Photo | Address | Area | Beds / Baths | Price | Details |
|---|---|---|---|---|---|

|
#11
Canton Dr
Milpitas, CA 95035
|
1,867 sq. feet
|
2 baths 4 beds |
show details | |

|
#12
N Abbott Ave
Milpitas, CA 95035
|
1,174 sq. feet
|
2 baths 2 beds |
show details | |

|
#13
Lexington St
Milpitas, CA 95035
|
1,734 sq. feet
|
2 baths 4 beds |
show details | |

|
#14
Yosemite Dr
Milpitas, CA 95035
|
1,484 sq. feet
|
2 baths 3 beds |
show details | |

|
#15
Heath St
Milpitas, CA 95035
|
980 sq. feet
|
1 baths 3 beds |
show details | |

|
#16
Olympic Dr
Milpitas, CA 95035
|
2,029 sq. feet
|
3 baths 4 beds |
show details | |

|
#17
Washington Dr
Milpitas, CA 95035
|
1,358 sq. feet
|
2 baths 4 beds |
show details | |

|
#18
Parc Place Dr
Milpitas, CA 95035
|
1,530 sq. feet
|
2 baths 3 beds |
show details | |

|
#19
Carnegie Dr
Milpitas, CA 95035
|
1,154 sq. feet
|
2 baths 4 beds |
show details | |

|
#20
Dixon Rd
Milpitas, CA 95035
|
1,320 sq. feet
|
1 baths 4 beds |
show details |
| Photo | Address | Area | Beds / Baths | Price | Details |
|---|---|---|---|---|---|

|
#21
Singley Dr
Milpitas, CA 95035
|
1,545 sq. feet
|
2 baths 3 beds |
show details | |

|
#22
Mccandless Dr, Apt 242
Milpitas, CA 95035
|
- sq. feet
|
- baths - beds |
show details | |

|
#23
Mccarthy Blvd Ste 1000
Milpitas, CA 95035
|
- sq. feet
|
- baths - beds |
show details | |

|
#24
E Calaveras Blvd
Milpitas, CA 95035
|
- sq. feet
|
- baths - beds |
show details | |

|
#25
N Milpitas Blvd # 166
Milpitas, CA 95035
|
- sq. feet
|
- baths - beds |
show details | |

|
#26
Mccandless Dr, Apt 439
Milpitas, CA 95035
|
- sq. feet
|
- baths - beds |
show details | |

|
#27
S Park Victoria Dr Apt 617
Milpitas, CA 95035
|
- sq. feet
|
- baths - beds |
show details | |

|
#28
N Gadsden Dr
Milpitas, CA 95035
|
- sq. feet
|
- baths - beds |
show details | |

|
#29
Pescadero Ct
Milpitas, CA 95035
|
- sq. feet
|
- baths - beds |
show details | |

|
#30
Nightshade Rd, Unit 20
Milpitas, CA 95035
|
- sq. feet
|
- baths - beds |
show details |
| Photo | Address | Area | Beds / Baths | Price | Details |
|---|---|---|---|---|---|

|
#31
Dixon Landing Rd Apt 115
Milpitas, CA 95035
|
- sq. feet
|
- baths - beds |
show details | |

|
#32
Cypress Dr
Milpitas, CA 95035
|
- sq. feet
|
- baths - beds |
show details | |

|
#33
Milmont Dr Apt P205
Milpitas, CA 95035
|
- sq. feet
|
- baths - beds |
show details | |

|
#34
S Main St Apt 411
Milpitas, CA 95035
|
- sq. feet
|
- baths - beds |
show details | |

|
#35
Junipero Dr Apt 4
Milpitas, CA 95035
|
- sq. feet
|
- baths - beds |
show details | |

|
#36
N Milpitas Blvd
Milpitas, CA 95035
|
- sq. feet
|
- baths - beds |
show details | |

|
#37
N Abel St
Milpitas, CA 95035
|
- sq. feet
|
- baths - beds |
show details | |

|
#38
Landess Ave # 199
Milpitas, CA 95035
|
- sq. feet
|
- baths - beds |
show details | |

|
#39
N Milpitas Blvd Spc 15
Milpitas, CA 95035
|
- sq. feet
|
- baths - beds |
show details | |

|
#40
Dixon Landing Rd Spc 136
Milpitas, CA 95035
|
- sq. feet
|
- baths - beds |
show details |
| Photo | Address | Area | Beds / Baths | Price | Details |
|---|---|---|---|---|---|

|
Check over 1 million property listings on Foreclosure.com!
|
browse all offers | |||
| Photo | Address | Area | Beds / Baths | Price | Details |
|---|


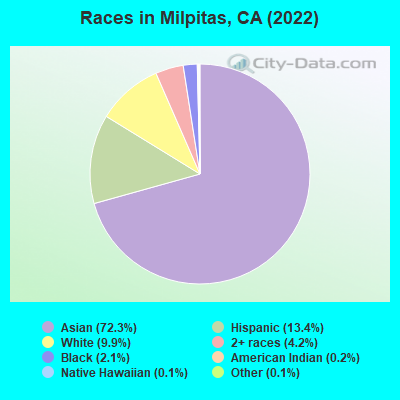
- 55,83072.3%Asian alone
- 10,36513.4%Hispanic
- 7,6389.9%White alone
- 3,2694.2%Two or more races
- 1,6012.1%Black alone
- 1480.2%American Indian alone
- 1040.1%Native Hawaiian and Other
Pacific Islander alone - 1000.1%Other race alone
According to our research of California and other state lists, there were 72 registered sex offenders living in Milpitas, California as of April 27, 2024.
The ratio of all residents to sex offenders in Milpitas is 1,077 to 1.
The ratio of registered sex offenders to all residents in this city is lower than the state average.
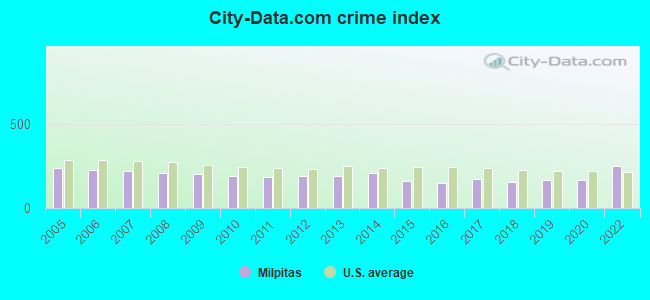
The City-Data.com crime index weighs serious crimes and violent crimes more heavily. Higher means more crime, U.S. average is 246.1. It adjusts for the number of visitors and daily workers commuting into cities.
- means the value is smaller than the state average.- means the value is about the same as the state average.
- means the value is bigger than the state average.
- means the value is much bigger than the state average.
Crime rate in Milpitas detailed stats: murders, rapes, robberies, assaults, burglaries, thefts, arson
Full-time law enforcement employees in 2021, including police officers: 115 (84 officers - 71 male; 13 female).
| Officers per 1,000 residents here: | 1.09 |
| California average: | 2.30 |
 Recent articles from our blog. Our writers, many of them Ph.D. graduates or candidates, create easy-to-read articles on a wide variety of topics.

 | Good/Bad areas of Milpitas (2 replies) |
| Apartments or condos near fremont (6 replies) |
| Bay Area commute: south sf - milpitass or south sf - Dublin? (10 replies) |
| Buying a townhouse in Milpitas... (15 replies) |
| Milpitas passed a bag ordinance did anyone notice? (11 replies) |
| Milpitas? Is it a good choice for us to live? (DINKS) (6 replies) |
Latest news from Milpitas, CA collected exclusively by city-data.com from local newspapers, TV, and radio stations
Current Local Time: PST time zone
Elevation: 19 feet
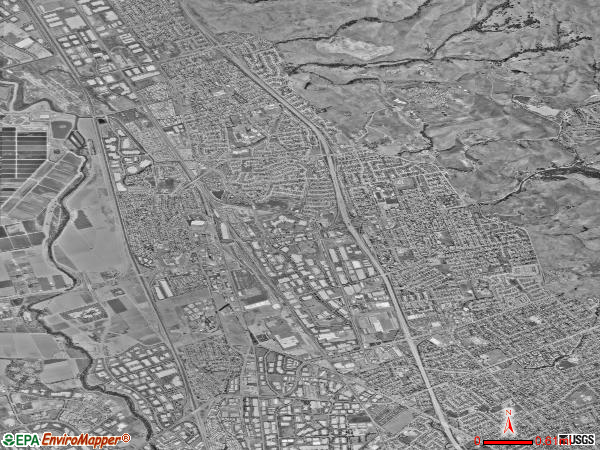
Land area: 13.6 square miles.
Population density: 5,732 people per square mile (average).
42,548 residents are foreign born (47.6% Asia).
| This city: | 55.1% |
| California: | 26.5% |
Median real estate property taxes paid for housing units with mortgages in 2022: $9,679 (0.8%)
Median real estate property taxes paid for housing units with no mortgage in 2022: $6,180 (0.5%)
Nearest city with pop. 200,000+: Fremont, CA  (8.9 miles , pop. 203,413).
Nearest city with pop. 1,000,000+: Los Angeles, CA (304.3 miles , pop. 3,694,820).
Nearest cities:
), ), ), ), Latitude: 37.43 N, Longitude: 121.90 W
Daytime population change due to commuting: +6,154 (+7.9%)
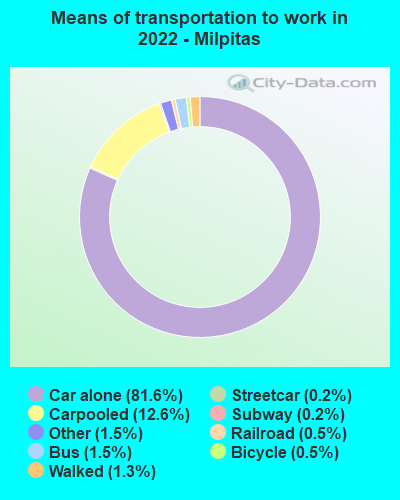
Workers who live and work in this city: 18,808 (47.0%)
Area code commonly used in this area: 408
Milpitas, California accommodation & food services, waste management - Economy and Business Data
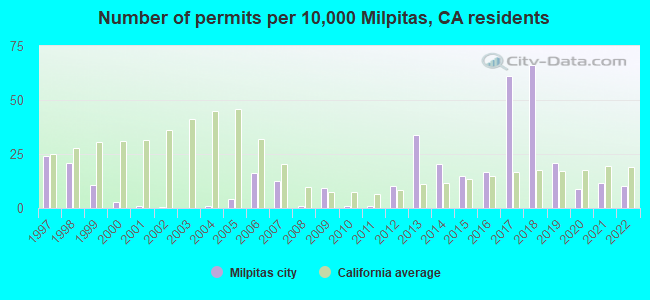
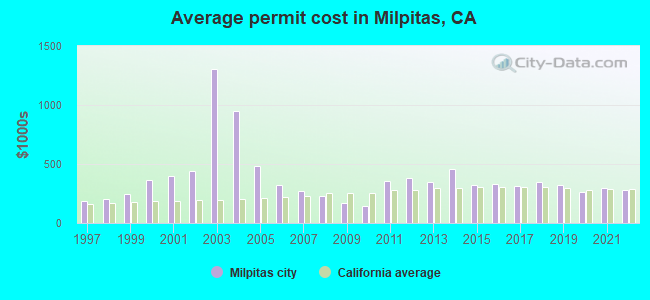
Single-family new house construction building permits:
- 2022: 65 buildings, average cost: $276,100
- 2021: 73 buildings, average cost: $292,800
- 2020: 55 buildings, average cost: $263,800
- 2019: 131 buildings, average cost: $323,800
- 2018: 415 buildings, average cost: $349,800
- 2017: 383 buildings, average cost: $314,100
- 2016: 104 buildings, average cost: $331,600
- 2015: 92 buildings, average cost: $320,900
- 2014: 127 buildings, average cost: $455,500
- 2013: 212 buildings, average cost: $349,300
- 2012: 65 buildings, average cost: $382,800
- 2011: 7 buildings, average cost: $360,400
- 2010: 6 buildings, average cost: $144,800
- 2009: 57 buildings, average cost: $166,800
- 2008: 5 buildings, average cost: $227,900
- 2007: 79 buildings, average cost: $269,400
- 2006: 103 buildings, average cost: $321,200
- 2005: 26 buildings, average cost: $483,000
- 2004: 5 buildings, average cost: $949,900
- 2003: 1 building, cost: $1,306,000
- 2002: 3 buildings, average cost: $437,000
- 2001: 5 buildings, average cost: $400,600
- 2000: 17 buildings, average cost: $367,400
- 1999: 66 buildings, average cost: $247,300
- 1998: 131 buildings, average cost: $202,200
- 1997: 151 buildings, average cost: $185,800
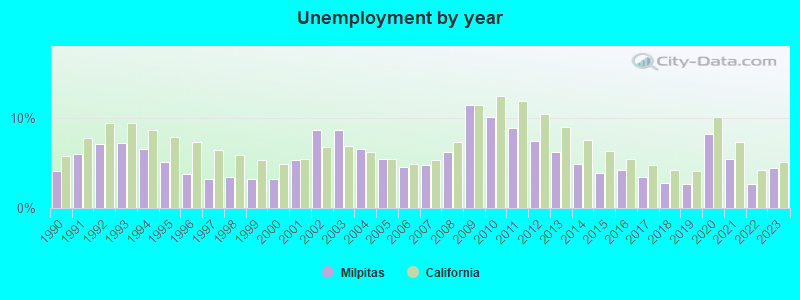
| Here: | 4.4% |
| California: | 5.1% |
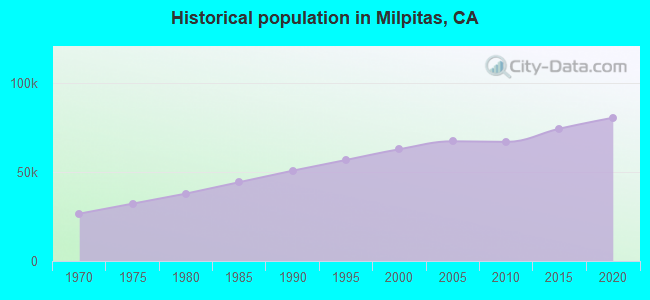
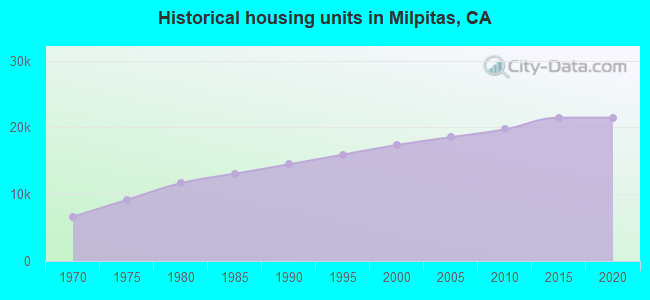
Population change in the 1990s: +11,741 (+23.0%).
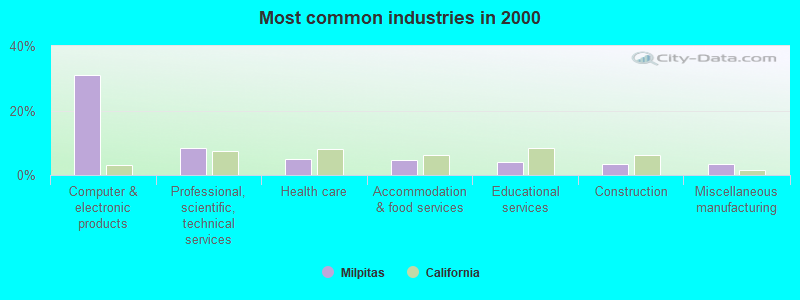
- Computer & electronic products (30.9%)
- Professional, scientific, technical services (8.3%)
- Health care (5.0%)
- Accommodation & food services (4.5%)
- Educational services (3.9%)
- Construction (3.5%)
- Miscellaneous manufacturing (3.3%)
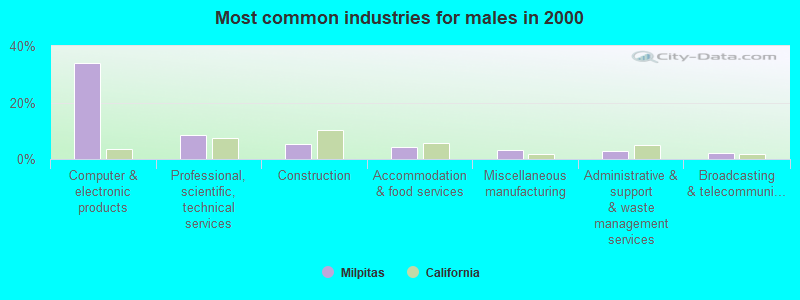
- Computer & electronic products (34.1%)
- Professional, scientific, technical services (8.6%)
- Construction (5.3%)
- Accommodation & food services (4.3%)
- Miscellaneous manufacturing (3.2%)
- Administrative & support & waste management services (2.7%)
- Broadcasting & telecommunications (2.2%)
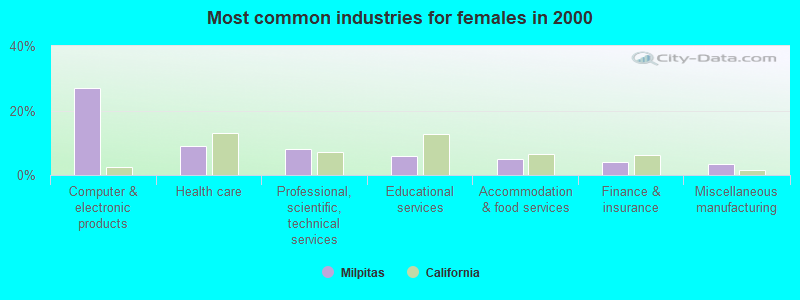
- Computer & electronic products (26.9%)
- Health care (8.9%)
- Professional, scientific, technical services (8.0%)
- Educational services (6.0%)
- Accommodation & food services (4.8%)
- Finance & insurance (4.2%)
- Miscellaneous manufacturing (3.5%)

- Computer specialists (10.7%)
- Engineers (8.3%)
- Other production occupations, including supervisors (6.4%)
- Assemblers and fabricators (4.3%)
- Other management occupations, except farmers and farm managers (3.7%)
- Other office and administrative support workers, including supervisors (3.5%)
- Material recording, scheduling, dispatching, and distributing workers (3.1%)
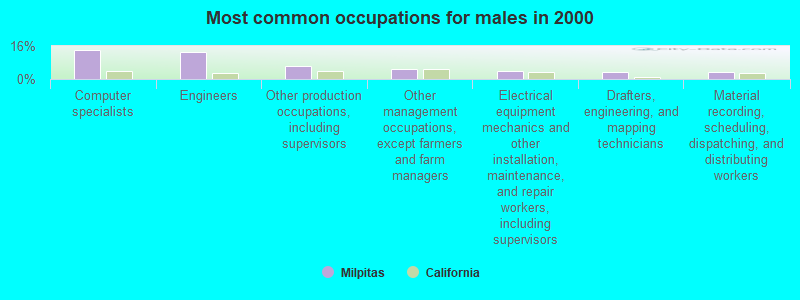
- Computer specialists (13.9%)
- Engineers (13.2%)
- Other production occupations, including supervisors (6.1%)
- Other management occupations, except farmers and farm managers (4.7%)
- Electrical equipment mechanics and other installation, maintenance, and repair workers, including supervisors (3.7%)
- Drafters, engineering, and mapping technicians (3.6%)
- Material recording, scheduling, dispatching, and distributing workers (3.4%)
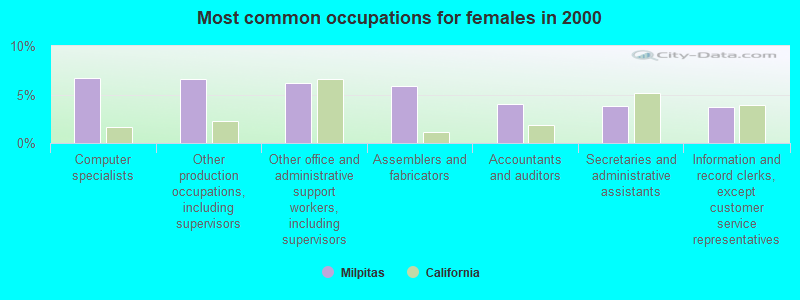
- Computer specialists (6.7%)
- Other production occupations, including supervisors (6.6%)
- Other office and administrative support workers, including supervisors (6.1%)
- Assemblers and fabricators (5.9%)
- Accountants and auditors (4.0%)
- Secretaries and administrative assistants (3.8%)
- Information and record clerks, except customer service representatives (3.7%)
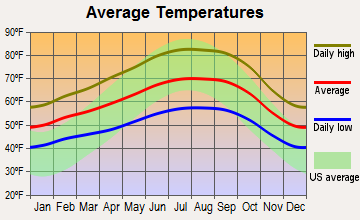
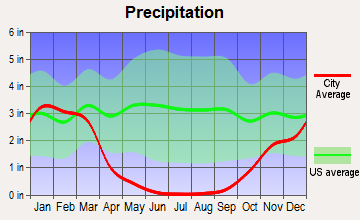
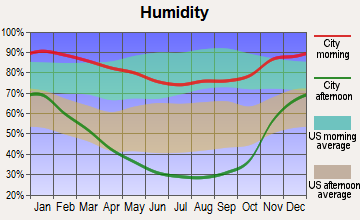
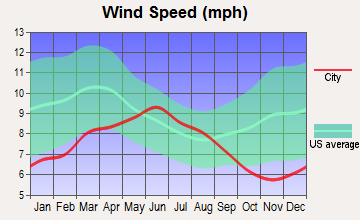
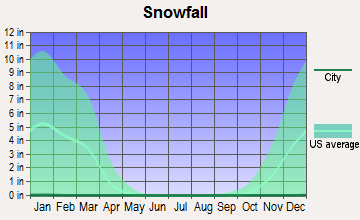
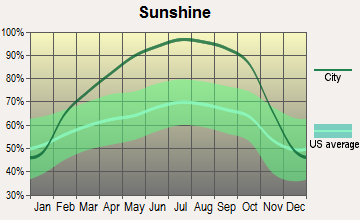
Average climate in Milpitas, California
Based on data reported by over 4,000 weather stations
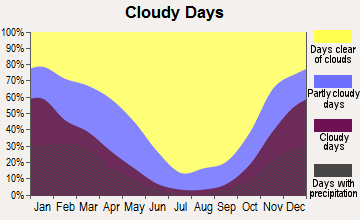
|
|

(lower is better)
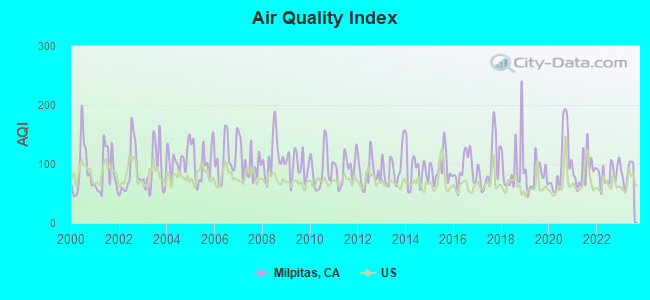
Air Quality Index (AQI) level in 2023 was 85.6. This is about average.
| City: | 85.6 |
| U.S.: | 72.6 |
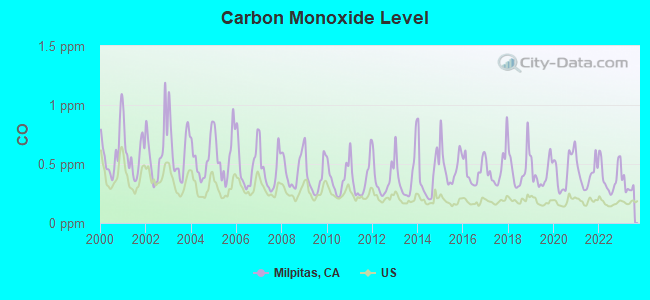
Carbon Monoxide (CO) [ppm] level in 2023 was 0.314. This is worse than average. Closest monitor was 6.0 miles away from the city center.
| City: | 0.314 |
| U.S.: | 0.251 |
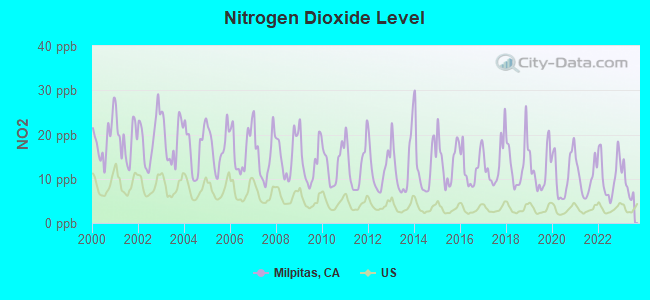
Nitrogen Dioxide (NO2) [ppb] level in 2023 was 8.68. This is significantly worse than average. Closest monitor was 6.0 miles away from the city center.
| City: | 8.68 |
| U.S.: | 5.11 |
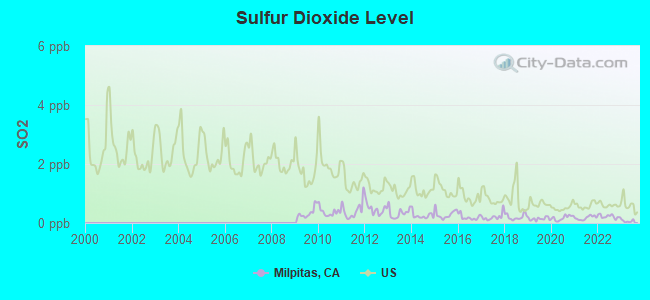
Sulfur Dioxide (SO2) [ppb] level in 2023 was 0.0660. This is significantly better than average. Closest monitor was 6.0 miles away from the city center.
| City: | 0.0660 |
| U.S.: | 1.5147 |
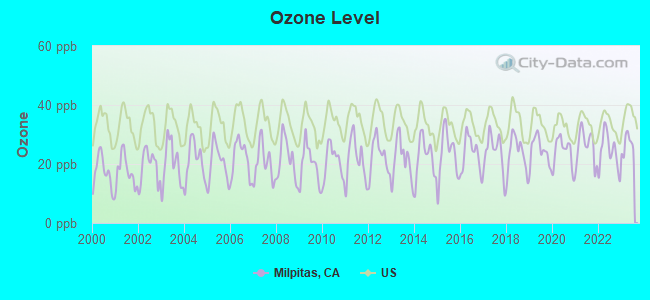
Ozone [ppb] level in 2023 was 26.7. This is better than average. Closest monitor was 4.1 miles away from the city center.
| City: | 26.7 |
| U.S.: | 33.3 |
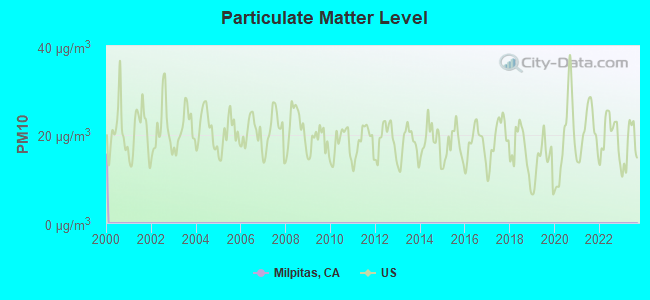
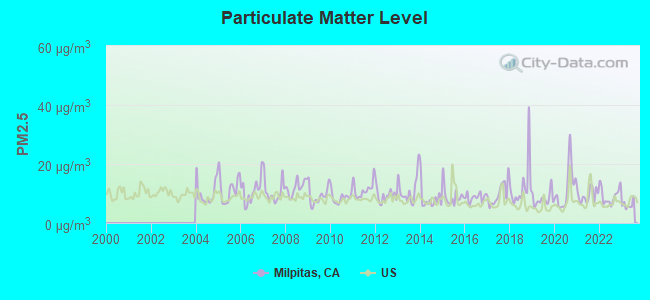
Particulate Matter (PM2.5) [µg/m3] level in 2023 was 6.16. This is better than average. Closest monitor was 6.0 miles away from the city center.
| City: | 6.16 |
| U.S.: | 8.11 |
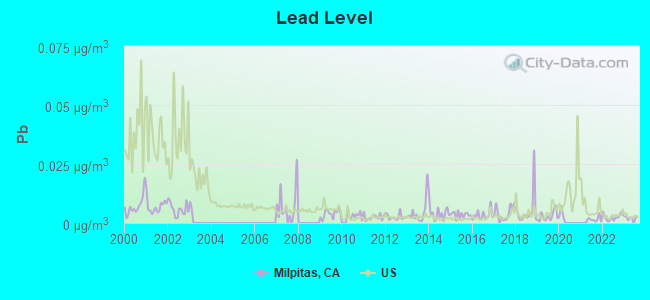
Lead (Pb) [µg/m3] level in 2023 was 0.00228. This is significantly better than average. Closest monitor was 6.0 miles away from the city center.
| City: | 0.00228 |
| U.S.: | 0.00931 |
Earthquake activity:
Milpitas-area historical earthquake activity is significantly above California state average. It is 7705% greater than the overall U.S. average.On 4/18/1906 at 13:12:21, a magnitude 7.9 (7.9 UK, Class: Major, Intensity: VIII - XII) earthquake occurred 72.0 miles away from the city center, causing $524,000,000 total damage
On 10/18/1989 at 00:04:15, a magnitude 7.1 (6.5 MB, 7.1 MS, 6.9 MW, 7.0 ML) earthquake occurred 23.5 miles away from the city center, causing 62 deaths (62 shaking deaths) and 3757 injuries, causing $1,305,032,704 total damage
On 11/4/1927 at 13:51:53, a magnitude 7.5 (7.5 UK) earthquake occurred 180.8 miles away from Milpitas center
On 7/21/1952 at 11:52:14, a magnitude 7.7 (7.7 UK) earthquake occurred 233.3 miles away from Milpitas center, causing $50,000,000 total damage
On 1/31/1922 at 13:17:28, a magnitude 7.6 (7.6 UK) earthquake occurred 299.3 miles away from Milpitas center
On 12/21/1932 at 06:10:09, a magnitude 7.2 (7.2 UK) earthquake occurred 220.7 miles away from the city center
Magnitude types: body-wave magnitude (MB), local magnitude (ML), surface-wave magnitude (MS), moment magnitude (MW)
Natural disasters:
The number of natural disasters in Santa Clara County (19) is greater than the US average (15).Major Disasters (Presidential) Declared: 10
Emergencies Declared: 3
Causes of natural disasters: Floods: 9, Fires: 5, Winter Storms: 5, Storms: 4, Mudslides: 3, Landslides: 2, Drought: 1, Earthquake: 1, Freeze: 1, Hurricane: 1, Tornado: 1, Other: 1 (Note: some incidents may be assigned to more than one category).
Main business address for: XICOR INC (SEMICONDUCTORS & RELATED DEVICES), GoRemote Internet Communications, Inc. (SERVICES-PREPACKAGED SOFTWARE), LSI LOGIC CORP (SEMICONDUCTORS & RELATED DEVICES), CALIFORNIA MICRO DEVICES CORP (ELECTRONIC COMPONENTS & ACCESSORIES), SIGMA DESIGNS INC (COMPUTER PERIPHERAL EQUIPMENT, NEC), LINEAR TECHNOLOGY CORP /CA/ (SEMICONDUCTORS & RELATED DEVICES), NANOMETRICS INC (MEASURING & CONTROLLING DEVICES, NEC), PHOENIX TECHNOLOGIES LTD (SERVICES-PREPACKAGED SOFTWARE) and 8 other public companies.
Hospitals and medical centers in Milpitas:
Amtrak stations near Milpitas:
- 5 miles: SANTA CLARA-GREAT AMERICA (SANTA CLARA, FOOT OF STARS & STRIPES DR.) . Services: partially wheelchair accessible, free short-term parking.
- 8 miles: SAN JOSE (65 CAHILL ST.) . Services: ticket office, fully wheelchair accessible, enclosed waiting area, public restrooms, public payphones, paid short-term parking, free long-term parking, taxi stand, public transit connection.
- 8 miles: FREEMONT-MISSION SAN JOSE (FREMONT, MISSION BLVD. & I-680) - Bus Station . Services: fully wheelchair accessible, public payphones, free short-term parking, call for taxi service, public transit connection.
College/University in Milpitas:
Colleges/universities with over 2000 students nearest to Milpitas:
- Wyotech-Fremont (about 3 miles; Fremont, CA; Full-time enrollment: 2,383)
- Mission College (about 6 miles; Santa Clara, CA; FT enrollment: 5,625)
- Santa Clara University (about 7 miles; Santa Clara, CA; FT enrollment: 7,640)
- Ohlone College (about 7 miles; Fremont, CA; FT enrollment: 6,153)
- San Jose State University (about 7 miles; San Jose, CA; FT enrollment: 23,357)
- San Jose City College (about 9 miles; San Jose, CA; FT enrollment: 5,526)
- De Anza College (about 12 miles; Cupertino, CA; FT enrollment: 16,729)
Public high schools in Milpitas:
- MILPITAS HIGH (Students: 2,045, Location: 1285 ESCUELA PKWY., Grades: 9-12)
- CALAVERAS HILLS (Students: 52, Location: 1331 E. CALAVERAS BLVD., Grades: 9-12)
Biggest public elementary/middle schools in Milpitas:
- THOMAS RUSSELL MIDDLE (Students: 759, Location: 1500 ESCUELA PKWY., Grades: 7-8)
- RANCHO MILPITAS MIDDLE (Students: 661, Location: 1915 YELLOWSTONE AVE., Grades: 7-8)
- JOHN SINNOTT ELEMENTARY (Students: 513, Location: 2025 YELLOWSTONE AVE., Grades: KG-6)
- MARSHALL POMEROY ELEMENTARY (Students: 473, Location: 1505 ESCUELA PKWY., Grades: KG-6)
- CURTNER ELEMENTARY (Students: 452, Location: 275 REDWOOD, Grades: KG-6)
- WILLIAM BURNETT ELEMENTARY (Students: 426, Location: 400 FANYON, Grades: KG-6)
- ANTHONY SPANGLER ELEMENTARY (Students: 403, Location: 140 N. ABBOTT, Grades: KG-6)
- PEARL ZANKER ELEMENTARY (Students: 345, Location: 1585 FALLEN LEAF DR., Grades: KG-6)
- ALEXANDER ROSE ELEMENTARY (Students: 299, Location: 250 ROSWELL DR., Grades: KG-6)
- ROBERT RANDALL ELEMENTARY (Students: 288, Location: 1300 EDSEL DR., Grades: KG-6)
Private elementary/middle schools in Milpitas:
- ST JOHN THE BAPTIST CATHOLIC SCHOOL (Students: 223, Location: 360 S ABEL ST, Grades: PK-8)
- FOOTHILL ADVENTIST ELEMENTARY SCHOOL (Students: 105, Location: 1991 LANDESS AVE, Grades: KG-8)
- MONARCH CHRISTIAN SCHOOL (Students: 104, Location: 1715 E CALAVERAS BLVD, Grades: PK-4)
- MILPITAS MONTESSORI SCHOOL (Students: 16, Location: 1500 YOSEMITE DR, Grades: 1-2)
Points of interest:
Notable locations in Milpitas: Tularcitos Golf and Country Club (A), Sunny Hills Golf Center (B), Spring Valley Golf Club (C), Milpitas Sewage Disposal (D), Milpitas Fire Department Station 2 (E), Milpitas Fire Department Station 4 (F), Milpitas Fire Department Station 3 (G), Milpitas Fire Department Station 1 (H), Milpitas Community Library (I), Milpitas Community Center (J), Milpitas Civic Center (K). Display/hide their locations on the map
Shopping Centers: Great Mall of the Bay Area (1), Parktown Plaza Shopping Center (2), Town Center Shopping Center (3), Sunnyhills Shopping Center (4), Serra Shopping Center (5), Park Victoria Shopping Center (6), Milpitas Shopping Center (7), Mercado Real Shopping Center (8), Fiesta Shopping Center (9). Display/hide their locations on the map
Main business address in Milpitas include: XICOR INC (A), GoRemote Internet Communications, Inc. (B), LSI LOGIC CORP (C), CALIFORNIA MICRO DEVICES CORP (D), SIGMA DESIGNS INC (E), LINEAR TECHNOLOGY CORP /CA/ (F), NANOMETRICS INC (G), PHOENIX TECHNOLOGIES LTD (H). Display/hide their locations on the map
Church in Milpitas: Santa Teresa Catholic Church (A). Display/hide its location on the map
Cemetery: Saint Johns Catholic Cemetery (1). Display/hide its location on the map
Reservoir: Sandy Wool Lake (A). Display/hide its location on the map
Streams, rivers, and creeks: Calera Creek (A), Tularcitos Creek (B), Lower Penitencia Creek (C), Piedmont Creek (D), Arroyo De Los Coches (E), Berryessa Creek (F). Display/hide their locations on the map
Parks in Milpitas include: Hall Memorial Park (1), Murphy Park (2), Sandlewood Park (3), Selwyn Park (4), Starlite Park (5), Strickroth Park (6), Sunnyhills Park (7), Yellowstone Park (8). Display/hide their locations on the map
Hotels: Best Western Brookside Inn (400 Valley Way), Best Value Inn & Suites (485 South Main Street), Brookside Inn (400 Valley Way).
Birthplace of: Tab Perry - 2005 NFL player (Cincinnati Bengals, born: Jan 20, 1982).
Drinking water stations with addresses in Milpitas and their reported violations in the past:
COLLEGEVILLE MARKET & CAFE (Population served: 150, Groundwater):Past health violations:
- MCL, Monthly (TCR) - In JUL-2011, Contaminant: Coliform
| This city: | 3.3 people |
| California: | 2.9 people |
| This city: | 81.4% |
| Whole state: | 68.7% |
| This city: | 4.5% |
| Whole state: | 7.2% |
Likely homosexual households (counted as self-reported same-sex unmarried-partner households)
- Lesbian couples: 0.3% of all households
- Gay men: 0.2% of all households
People in group quarters in Milpitas in 2010:
- 2,549 people in local jails and other municipal confinement facilities
- 49 people in workers' group living quarters and job corps centers
- 34 people in nursing facilities/skilled-nursing facilities
- 33 people in other noninstitutional facilities
- 15 people in group homes intended for adults
- 11 people in group homes for juveniles (non-correctional)
- 7 people in residential treatment centers for adults
People in group quarters in Milpitas in 2000:
- 3,092 people in local jails and other confinement facilities (including police lockups)
- 48 people in agriculture workers' dormitories on farms
- 24 people in nursing homes
- 5 people in other noninstitutional group quarters
- 3 people in other nonhousehold living situations
- 2 people in religious group quarters
Banks with most branches in Milpitas (2011 data):
- Wells Fargo Bank, National Association: Milpitas Branch, Mccarthy Ranch Branch, Parktown Plaza Branch, Great Mall- Milpitas Branch. Info updated 2011/04/05: Bank assets: $1,161,490.0 mil, Deposits: $905,653.0 mil, headquarters in Sioux Falls, SD, positive income, 6395 total offices, Holding Company: Wells Fargo & Company
- East West Bank: 99 Milpitas Branch at 338 Barber Lane, branch established on 1998/10/13; Milpitas Branch at Building G, Unit #380a, 468 Barber Lane, branch established on 2007/05/01. Info updated 2010/06/14: Bank assets: $21,962.4 mil, Deposits: $17,501.8 mil, headquarters in Pasadena, CA, positive income, Commercial Lending Specialization, 131 total offices, Holding Company: East West Bancorp, Inc.
- U.S. Bank National Association: Milpitas Seafood City Branch at 1535 Landess Avenue, Unit #107, branch established on 2010/05/27; Milpitas Branch at 100 North Milpitas Boulevard, branch established on 1989/04/17. Info updated 2012/01/30: Bank assets: $330,470.8 mil, Deposits: $236,091.5 mil, headquarters in Cincinnati, OH, positive income, 3121 total offices, Holding Company: U.S. Bancorp
- Bank of America, National Association: Milpitas Branch at 740 East Calaveras Boulevard, branch established on 1936/05/04; Mccarthy Ranch at 20 Ranch Road, branch established on 2001/04/30. Info updated 2009/11/18: Bank assets: $1,451,969.3 mil, Deposits: $1,077,176.8 mil, headquarters in Charlotte, NC, positive income, 5782 total offices, Holding Company: Bank Of America Corporation
- JPMorgan Chase Bank, National Association: Milpitas Branch at 1285 South Park Victoria Drive, branch established on 1934/11/01; Mulpitas Branch at 37 North Milpitas Boulevard, branch established on 2006/09/05. Info updated 2011/11/10: Bank assets: $1,811,678.0 mil, Deposits: $1,190,738.0 mil, headquarters in Columbus, OH, positive income, International Specialization, 5577 total offices, Holding Company: Jpmorgan Chase & Co.
- HSBC Bank USA, National Association: Milpitas Branch at 603 E. Calaveras Boulevard, branch established on 2007/08/13. Info updated 2010/11/30: Bank assets: $206,009.7 mil, Deposits: $149,026.8 mil, headquarters in Mc Lean, VA, positive income, 474 total offices, Holding Company: Hsbc Holdings Plc
- Cathay Bank: Milpitas Branch at 1759 North Milpitas Boulevard, branch established on 1994/11/17. Info updated 2010/12/08: Bank assets: $10,628.9 mil, Deposits: $7,249.8 mil, headquarters in Los Angeles, CA, positive income, Commercial Lending Specialization, 52 total offices, Holding Company: Cathay General Bancorp
- Comerica Bank: Milpitas Branch at 1289 South Park Victoria Drive, branch established on 1982/04/13. Info updated 2011/07/29: Bank assets: $60,970.5 mil, Deposits: $48,300.9 mil, headquarters in Dallas, TX, positive income, Commercial Lending Specialization, 497 total offices, Holding Company: Comerica Incorporated
- Chinatrust Bank (U.S.A.): Milpitas Branch at 258 Barber Court, branch established on 1996/07/31. Info updated 2012/02/10: Bank assets: $1,418.6 mil, Deposits: $1,066.3 mil, headquarters in Torrance, CA, positive income, Commercial Lending Specialization, 12 total offices, Holding Company: Chinatrust Financial Holding Company, Ltd.
- 3 other banks with 3 local branches
For population 15 years and over in Milpitas:
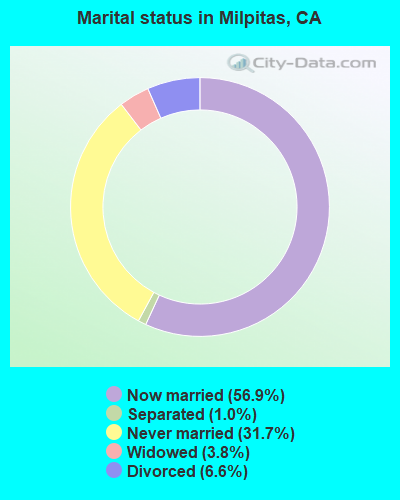
- Never married: 31.7%
- Now married: 56.9%
- Separated: 1.0%
- Widowed: 3.8%
- Divorced: 6.6%
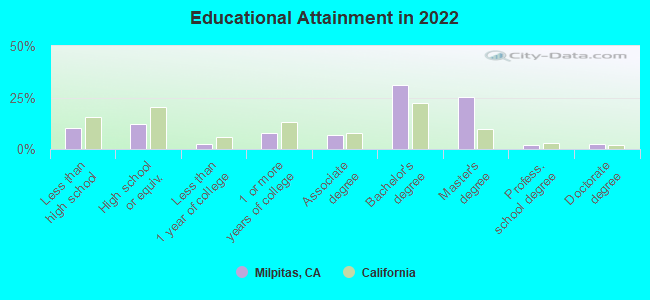
For population 25 years and over in Milpitas:
- High school or higher: 90.0%
- Bachelor's degree or higher: 61.0%
- Graduate or professional degree: 29.9%
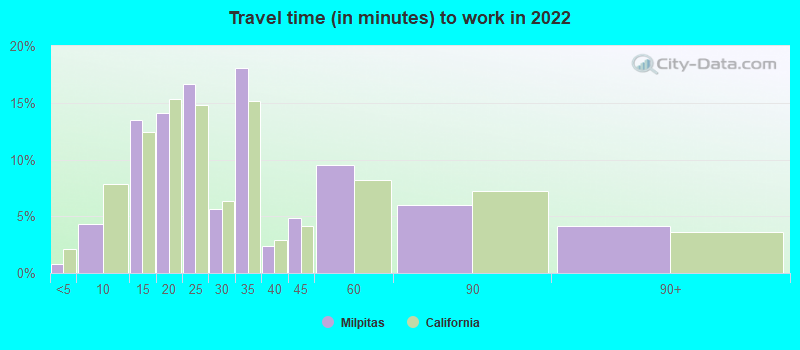
- Unemployed: 3.7%
- Mean travel time to work (commute): 14.9 minutes
| Here: | 12.8 |
| California average: | 15.5 |
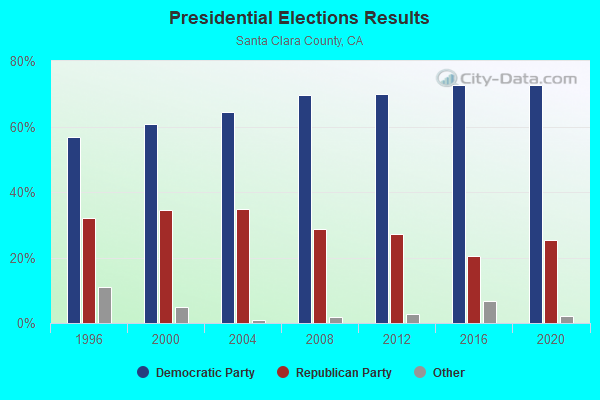
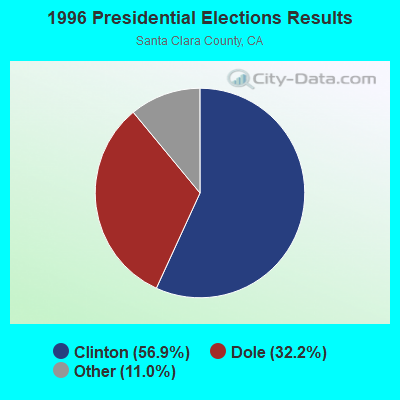
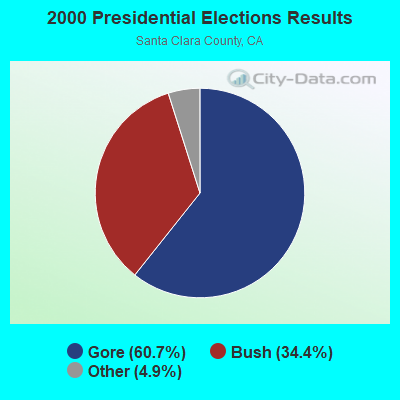

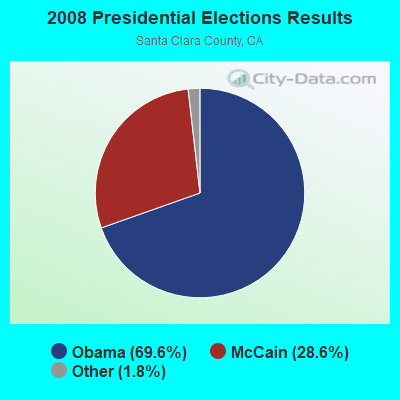
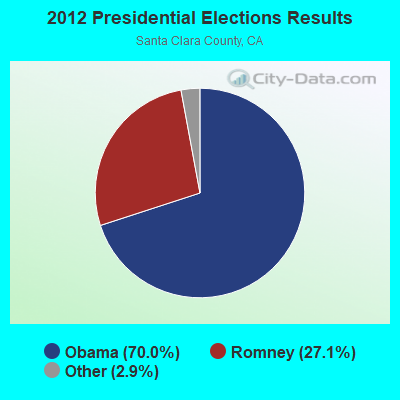
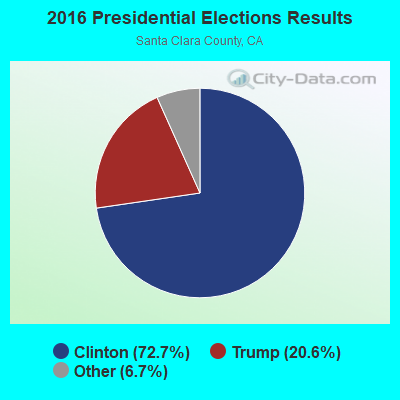
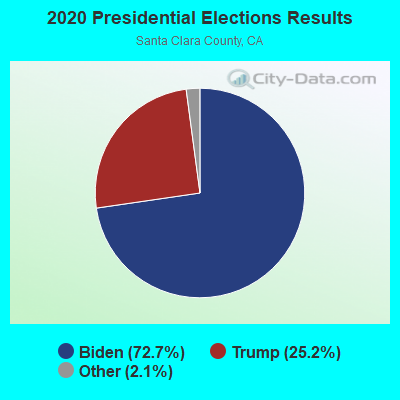
Graphs represent county-level data. Detailed 2008 Election Results
Religion statistics for Milpitas, CA (based on Santa Clara County data)
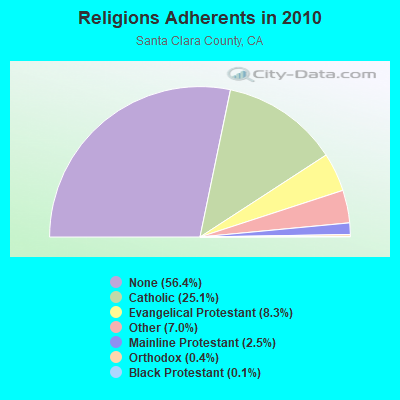
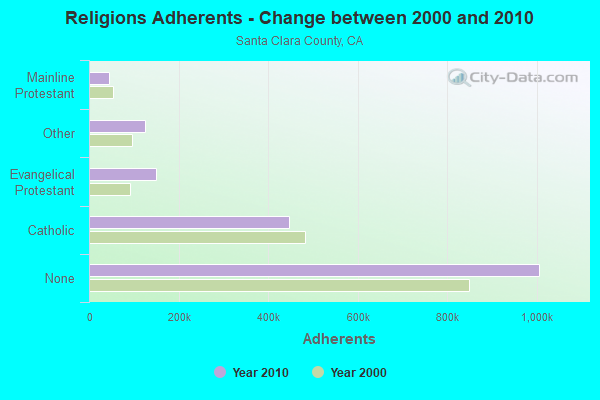
| Religion | Adherents | Congregations |
|---|---|---|
| Catholic | 447,369 | 56 |
| Evangelical Protestant | 148,599 | 481 |
| Other | 125,165 | 221 |
| Mainline Protestant | 44,623 | 132 |
| Orthodox | 7,720 | 17 |
| Black Protestant | 2,552 | 20 |
| None | 1,005,614 | - |
Food Environment Statistics:
| Santa Clara County: | 1.99 / 10,000 pop. |
| California: | 2.14 / 10,000 pop. |
| Santa Clara County: | 0.04 / 10,000 pop. |
| California: | 0.04 / 10,000 pop. |
| Santa Clara County: | 0.68 / 10,000 pop. |
| State: | 0.62 / 10,000 pop. |
| Here: | 1.38 / 10,000 pop. |
| California: | 1.49 / 10,000 pop. |
| This county: | 8.59 / 10,000 pop. |
| California: | 7.42 / 10,000 pop. |
| Santa Clara County: | 7.1% |
| California: | 7.3% |
| This county: | 19.0% |
| State: | 21.3% |
| Santa Clara County: | 16.6% |
| California: | 17.9% |
Health and Nutrition:
| Milpitas: | 55.5% |
| California: | 49.4% |
| Here: | 52.3% |
| California: | 48.0% |
| Milpitas: | 26.3 |
| California: | 28.1 |
| Milpitas: | 15.5% |
| California: | 20.2% |
| Milpitas: | 16.8% |
| State: | 11.2% |
| This city: | 6.8 |
| California: | 6.8 |
| This city: | 24.3% |
| State: | 31.5% |
| Milpitas: | 60.1% |
| California: | 56.4% |
| Milpitas: | 84.0% |
| California: | 80.9% |
More about Health and Nutrition of Milpitas, CA Residents
| Local government employment and payroll (March 2022) | |||||
| Function | Full-time employees | Monthly full-time payroll | Average yearly full-time wage | Part-time employees | Monthly part-time payroll |
|---|---|---|---|---|---|
| Police Protection - Officers | 84 | $1,213,911 | $173,416 | 0 | $0 |
| Firefighters | 68 | $1,021,344 | $180,237 | 0 | $0 |
| Police - Other | 33 | $387,646 | $140,962 | 33 | $44,952 |
| Solid Waste Management | 32 | $334,964 | $125,612 | 5 | $2,742 |
| Other Government Administration | 32 | $367,640 | $137,865 | 6 | $5,449 |
| Financial Administration | 32 | $333,930 | $125,224 | 12 | $21,784 |
| Other and Unallocable | 31 | $138,515 | $53,619 | 0 | $0 |
| Streets and Highways | 21 | $244,679 | $139,817 | 1 | $369 |
| Water Supply | 20 | $204,288 | $122,573 | 1 | $2,887 |
| Parks and Recreation | 14 | $131,991 | $113,135 | 84 | $88,735 |
| Fire - Other | 12 | $81,905 | $81,905 | 0 | $0 |
| Housing and Community Development (Local) | 6 | $84,657 | $169,314 | 1 | $1,210 |
| Totals for Government | 385 | $4,545,469 | $141,677 | 143 | $168,129 |
Milpitas government finances - Expenditure in 2021 (per resident):
- Construction - Regular Highways: $15,762,000 ($202.76)
General - Other: $9,852,000 ($126.73)
Parks and Recreation: $4,831,000 ($62.14)
Police Protection: $3,203,000 ($41.20)
- Current Operations - Police Protection: $34,802,000 ($447.68)
Water Utilities: $26,721,000 ($343.73)
Central Staff Services: $23,415,000 ($301.20)
Health - Other: $22,910,000 ($294.71)
Regular Highways: $13,945,000 ($179.38)
Sewerage: $9,772,000 ($125.70)
Protective Inspection and Regulation - Other: $5,892,000 ($75.79)
Local Fire Protection: $5,290,000 ($68.05)
Parks and Recreation: $3,661,000 ($47.09)
Housing and Community Development: $2,038,000 ($26.22)
Solid Waste Management: $510,000 ($6.56)
- General - Interest on Debt: $4,979,000 ($64.05)
- Water Utilities - Interest on Debt: $593,000 ($7.63)
Milpitas government finances - Revenue in 2021 (per resident):
- Charges - Sewerage: $20,574,000 ($264.66)
Other: $10,383,000 ($133.56)
Parks and Recreation: $743,000 ($9.56)
Solid Waste Management: $273,000 ($3.51)
- Federal Intergovernmental - Other: $7,320,000 ($94.16)
Housing and Community Development: $1,076,000 ($13.84)
Water Utilities: $14,000 ($0.18)
Sewerage: $14,000 ($0.18)
- Local Intergovernmental - Other: $275,000 ($3.54)
- Miscellaneous - Interest Earnings: $7,329,000 ($94.28)
General Revenue - Other: $820,000 ($10.55)
Rents: $726,000 ($9.34)
Special Assessments: $702,000 ($9.03)
Fines and Forfeits: $265,000 ($3.41)
Donations From Private Sources: $104,000 ($1.34)
Sale of Property: $3,000 ($0.04)
- Revenue - Water Utilities: $34,967,000 ($449.81)
- State Intergovernmental - Highways: $3,144,000 ($40.44)
Other: $1,004,000 ($12.92)
General Local Government Support: $114,000 ($1.47)
Water Utilities: $98,000 ($1.26)
- Tax - Property: $40,979,000 ($527.14)
General Sales and Gross Receipts: $25,114,000 ($323.06)
Other License: $24,784,000 ($318.81)
Public Utilities Sales: $5,035,000 ($64.77)
Other Selective Sales: $4,214,000 ($54.21)
Documentary and Stock Transfer: $677,000 ($8.71)
Occupation and Business License - Other: $313,000 ($4.03)
Milpitas government finances - Debt in 2021 (per resident):
- Long Term Debt - Outstanding Unspecified Public Purpose: $155,866,000 ($2005.02)
Beginning Outstanding - Unspecified Public Purpose: $120,922,000 ($1555.51)
Issue, Unspecified Public Purpose: $36,890,000 ($474.54)
Retired Unspecified Public Purpose: $1,945,000 ($25.02)
Milpitas government finances - Cash and Securities in 2021 (per resident):
- Bond Funds - Cash and Securities: $134,958,000 ($1736.06)
- Other Funds - Cash and Securities: $136,956,000 ($1761.76)
- Sinking Funds - Cash and Securities: $9,559,000 ($122.96)
5.37% of this county's 2021 resident taxpayers lived in other counties in 2020 ($152,550 average adjusted gross income)
| Here: | 5.37% |
| California average: | 5.19% |
0.01% of residents moved from foreign countries ($93 average AGI)
Santa Clara County: 0.01% California average: 0.03%
Top counties from which taxpayers relocated into this county between 2020 and 2021:
| from Alameda County, CA | |
| from San Mateo County, CA | |
| from San Francisco County, CA |
7.70% of this county's 2020 resident taxpayers moved to other counties in 2021 ($201,706 average adjusted gross income)
| Here: | 7.70% |
| California average: | 6.14% |
0.01% of residents moved to foreign countries ($110 average AGI)
Santa Clara County: 0.01% California average: 0.02%
Top counties to which taxpayers relocated from this county between 2020 and 2021:
| to Alameda County, CA | |
| to San Mateo County, CA | |
| to San Francisco County, CA |
| Businesses in Milpitas, CA | ||||
| Name | Count | Name | Count | |
|---|---|---|---|---|
| 24 Hour Fitness | 1 | Justice | 1 | |
| 7-Eleven | 6 | KFC | 1 | |
| ALDO | 1 | Kohl's | 1 | |
| AMF Bowling | 1 | Lane Bryant | 1 | |
| AT&T | 3 | Levi Strauss & Co. | 1 | |
| Aeropostale | 1 | Little Caesars Pizza | 1 | |
| American Eagle Outfitters | 1 | Marriott | 2 | |
| Applebee's | 1 | Marshalls | 1 | |
| Arby's | 1 | McDonald's | 7 | |
| Banana Republic | 1 | Men's Wearhouse | 1 | |
| Baskin-Robbins | 1 | Motherhood Maternity | 1 | |
| Bath & Body Works | 1 | New Balance | 1 | |
| Bed Bath & Beyond | 1 | Nike | 9 | |
| Best Western | 1 | Old Navy | 1 | |
| Blockbuster | 1 | Olive Garden | 1 | |
| Budget Car Rental | 1 | On The Border | 1 | |
| Burger King | 2 | Outback | 1 | |
| Burlington Coat Factory | 1 | Outback Steakhouse | 1 | |
| CVS | 1 | Pac Sun | 1 | |
| Carl\s Jr. | 2 | Panda Express | 1 | |
| Charlotte Russe | 1 | Payless | 1 | |
| Chipotle | 1 | Penske | 1 | |
| Cinnabon | 1 | PetSmart | 1 | |
| Clarks | 1 | Pizza Hut | 1 | |
| Cold Stone Creamery | 1 | Quiznos | 1 | |
| Curves | 1 | RadioShack | 1 | |
| Days Inn | 1 | Red Lobster | 1 | |
| Dennys | 1 | Rite Aid | 1 | |
| Extended Stay America | 1 | SAS Shoes | 1 | |
| Famous Footwear | 1 | Safeway | 1 | |
| FedEx | 11 | Sears | 2 | |
| Finish Line | 1 | Sheraton | 1 | |
| Firestone Complete Auto Care | 1 | Skechers USA | 1 | |
| Foot Locker | 1 | Spencer Gifts | 1 | |
| Forever 21 | 1 | Sprint Nextel | 3 | |
| GNC | 4 | Staples | 1 | |
| GameStop | 1 | Starbucks | 8 | |
| Gap | 1 | Subway | 3 | |
| Gymboree | 1 | T-Mobile | 3 | |
| H&M | 1 | Taco Bell | 3 | |
| H&R Block | 3 | Toyota | 1 | |
| Haworth | 1 | Toys"R"Us | 1 | |
| Hilton | 3 | Travelodge | 1 | |
| Holiday Inn | 2 | U-Haul | 1 | |
| Home Depot | 1 | UPS | 6 | |
| HomeTown Buffet | 1 | Vans | 4 | |
| Homestead Studio Suites | 1 | Verizon Wireless | 3 | |
| Honda | 1 | Victoria's Secret | 1 | |
| Hot Topic | 1 | Vons | 1 | |
| IHOP | 1 | Walgreens | 2 | |
| Jack In The Box | 1 | Walmart | 1 | |
| Jamba Juice | 2 | Wet Seal | 1 | |
| Journeys | 1 | |||
Strongest AM radio stations in Milpitas:
- KLOK (1170 AM; 50 kW; SAN JOSE, CA; Owner: ENTRAVISION HOLDINGS, LLC)
- KGO (810 AM; 50 kW; SAN FRANCISCO, CA; Owner: KGO-AM RADIO, INC.)
- KSJX (1500 AM; 10 kW; SAN JOSE, CA; Owner: MULTICULTURAL RADIO BROADCASTING INC)
- KNBR (680 AM; 50 kW; SAN FRANCISCO, CA; Owner: KNBR LICO, INC.)
- KZSF (1370 AM; 5 kW; SAN JOSE, CA; Owner: CARLOS A. DUHARTE)
- KFAX (1100 AM; 50 kW; SAN FRANCISCO, CA; Owner: GOLDEN GATE BROADCASTING CO, INC.)
- KTCT (1050 AM; 50 kW; SAN MATEO, CA; Owner: SUSQUEHANNA RADIO CORP.)
- KYCY (1550 AM; 50 kW; SAN FRANCISCO, CA; Owner: INFINITY BROADCASTING OPERATIONS, INC.)
- KLIV (1590 AM; 5 kW; SAN JOSE, CA; Owner: EMPIRE BROADCASTING COMPANY)
- KTRB (860 AM; 50 kW; MODESTO, CA; Owner: PAPPAS RADIO OF CALIFORNIA, A CALIFORNIA LIMITED PARTNERSHIP)
- KVVN (1430 AM; 2 kW; SANTA CLARA, CA; Owner: ICBC BROADCAST HOLDINGS - CA, INC.)
- KIQI (1010 AM; 35 kW; SAN FRANCISCO, CA; Owner: RADIO UNICA OF SAN FRANCISCO LICENSE CORP.)
- KSFB (1220 AM; 5 kW; PALO ALTO, CA; Owner: SCA-PALO ALTO, LLC)
Strongest FM radio stations in Milpitas:
- KBAA (94.5 FM; GILROY, CA; Owner: INFINITY RADIO OPERATIONS INC.)
- KZBR-FM2 (95.7 FM; LIVERMORE, ETC., CA; Owner: BONNEVILLE HOLDING COMPANY)
- KFJC (89.7 FM; LOS ALTOS, CA; Owner: FOOTHILL-DE ANZA COMM. COLLEGE DIST.)
- KSQL (99.1 FM; SANTA CRUZ, CA; Owner: TMS LICENSE CALIFORNIA, INC)
- KKUP (91.5 FM; CUPERTINO, CA; Owner: ASSURANCE SCIENCES FOUNDATION)
- KBRG (100.3 FM; SAN JOSE, CA; Owner: ENTRAVISION HOLDINGS, LLC)
- KKSF-FM1 (103.7 FM; PLEASANTON, ETC., CA; Owner: AMFM RADIO LICENSES, L.L.C.)
- KFRC-FM3 (99.7 FM; WALNUT CREEK, CA; Owner: INFINITY KFRC-FM, INC.)
- KZBR-FM1 (95.7 FM; WALNUT CREEK, CA; Owner: BONNEVILLE HOLDING COMPANY)
- KBLX-FM2 (102.9 FM; PLEASANTON, CA; Owner: ICBC BROADCAST HOLDINGS -CA, INC.)
- KSOL-FM3 (98.9 FM; PLEASANTON, CA; Owner: TMS LICENSE CALIFORNIA, INC)
- K238AC (95.5 FM; SALIDA, CA; Owner: FAMILY STATIONS, INC.)
- KISQ-FM3 (98.1 FM; CONCORD, CA; Owner: AMFM RADIO LICENSES, L.L.C.)
- KOHL (89.3 FM; FREMONT, CA; Owner: FREMONT-NEWARK COMMUNITY COLL. DIST.)
- KMEL-FM1 (106.1 FM; CONCORD, CA; Owner: AMFM RADIO LICENSES, L.L.C.)
- KEMR (105.7 FM; SANTA CLARA, CA; Owner: HBC LICENSE CORPORATION)
- KUFX (98.5 FM; SAN JOSE, CA; Owner: CITICASTERS LICENSES, L.P.)
- KRTY (95.3 FM; LOS GATOS, CA; Owner: KRTY, LTD.)
- KUOP (91.3 FM; STOCKTON, CA; Owner: UNIVERSITY OF THE PACIFIC)
- KTEE (93.7 FM; FELTON, CA; Owner: MAPLETON COMMUNICATIONS, L.L.C.)
TV broadcast stations around Milpitas:
- KBIT-CA (Channel 28; SAN FRANCISCO, ETC., CA; Owner: POLAR BROADCASTING, INC.)
- KICU-TV (Channel 36; SAN JOSE, CA; Owner: KTVU PARTNERSHIP)
- KTEH (Channel 54; SAN JOSE, CA; Owner: KTEH FOUNDATION)
- KDTV (Channel 14; SAN FRANCISCO, CA; Owner: KDTV LICENSE PARTNERSHIP, G.P.)
- KSTS (Channel 48; SAN JOSE, CA; Owner: TELEMUNDO OF NORTHERN CALIFORNIA LICENSE CORP.)
- KQED (Channel 9; SAN FRANCISCO, CA; Owner: KQED, INC.)
- KGO-TV (Channel 7; SAN FRANCISCO, CA; Owner: KGO TELEVISION, INC.)
- KPIX-TV (Channel 5; SAN FRANCISCO, CA; Owner: CBS BROADCASTING INC.)
- KTVU (Channel 2; OAKLAND, CA; Owner: KTVU PARTNERSHIP)
- KOVR (Channel 13; STOCKTON, CA; Owner: SCI - SACRAMENTO LICENSEE, LLC)
- KXTV (Channel 10; SACRAMENTO, CA; Owner: KXTV, INC.)
- KSPX (Channel 29; SACRAMENTO, CA; Owner: PAXSON SACRAMENTO LICENSE, INC.)
- KUVS (Channel 19; MODESTO, CA; Owner: KUVS LICENSE PARTNERSHIP, G.P.)
- KTXL (Channel 40; SACRAMENTO, CA; Owner: CHANNEL 40, INC.)
- KQCA (Channel 58; STOCKTON, CA; Owner: KCRA HEARST-ARGYLE TELEVISION, INC.)
- KRON-TV (Channel 4; SAN FRANCISCO, CA; Owner: YOUNG BROADCASTING OF SAN FRANCISCO, INC.)
- KMTP-TV (Channel 32; SAN FRANCISCO, CA; Owner: MINORITY TELEVISION PROJECT)
- KBHK-TV (Channel 44; SAN FRANCISCO, CA; Owner: VIACOM TELEVISION STATIONS GROUP OF SAN FRANCISCO INC.)
- KAXT-CA (Channel 22; SANTA CLARA-SAN JOSE, CA; Owner: LINDA K. TRUMBLY)
- KBWB (Channel 20; SAN FRANCISCO, CA; Owner: KBWB LICENSE, INC.)
- KFSF (Channel 66; VALLEJO, CA; Owner: TELEFUTURA SAN FRANCISCO LLC)
- KCSM-TV (Channel 60; SAN MATEO, CA; Owner: SAN MATEO COUNTY COMMUNITY COLLEGE DISTRICT)
- KCNS (Channel 38; SAN FRANCISCO, CA; Owner: WRAY, INC.)
- KNTV (Channel 11; SAN JOSE, CA; Owner: KNTV LICENSE, INC.)
- KKPX (Channel 65; SAN JOSE, CA; Owner: PAXSON SAN JOSE LICENSE, INC.)
- National Bridge Inventory (NBI) Statistics
- 78Number of bridges
- 1,883ft / 574mTotal length
- $441,000Total costs
- 4,067,581Total average daily traffic
- 363,850Total average daily truck traffic
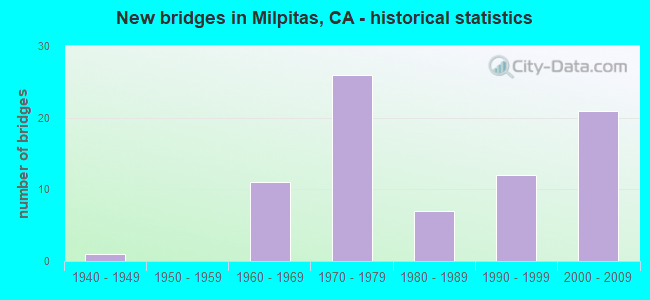
- New bridges - historical statistics
- 11940-1949
- 111960-1969
- 261970-1979
- 71980-1989
- 121990-1999
- 212000-2009
FCC Registered Antenna Towers: 87 (See the full list of FCC Registered Antenna Towers)
FCC Registered Commercial Land Mobile Towers: 2 (See the full list of FCC Registered Commercial Land Mobile Towers in Milpitas, CA)
FCC Registered Private Land Mobile Towers: 4 (See the full list of FCC Registered Private Land Mobile Towers)
FCC Registered Broadcast Land Mobile Towers: 43 (See the full list of FCC Registered Broadcast Land Mobile Towers)
FCC Registered Microwave Towers: 114 (See the full list of FCC Registered Microwave Towers in this town)
FCC Registered Paging Towers: 11 (See the full list of FCC Registered Paging Towers)
FCC Registered Amateur Radio Licenses: 480 (See the full list of FCC Registered Amateur Radio Licenses in Milpitas)
FAA Registered Aircraft: 16 (See the full list of FAA Registered Aircraft in Milpitas)
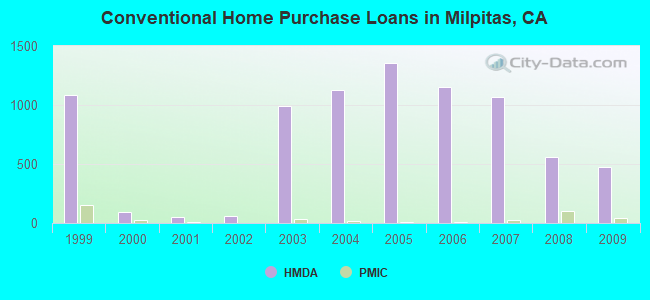
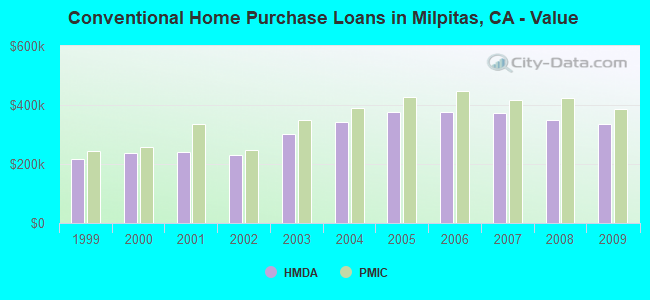
| Home Mortgage Disclosure Act Aggregated Statistics For Year 2009 (Based on 12 full and 3 partial tracts) | ||||||||||||||
| A) FHA, FSA/RHS & VA Home Purchase Loans | B) Conventional Home Purchase Loans | C) Refinancings | D) Home Improvement Loans | E) Loans on Dwellings For 5+ Families | F) Non-occupant Loans on < 5 Family Dwellings (A B C & D) | G) Loans On Manufactured Home Dwelling (A B C & D) | ||||||||
|---|---|---|---|---|---|---|---|---|---|---|---|---|---|---|
| Number | Average Value | Number | Average Value | Number | Average Value | Number | Average Value | Number | Average Value | Number | Average Value | Number | Average Value | |
| LOANS ORIGINATED | 102 | $349,342 | 475 | $335,637 | 1,953 | $331,564 | 57 | $276,648 | 3 | $26,537,607 | 110 | $267,904 | 6 | $105,145 |
| APPLICATIONS APPROVED, NOT ACCEPTED | 3 | $391,173 | 72 | $334,041 | 374 | $353,396 | 13 | $294,772 | 0 | $0 | 16 | $307,136 | 4 | $96,750 |
| APPLICATIONS DENIED | 25 | $361,749 | 115 | $337,216 | 565 | $369,116 | 17 | $201,245 | 0 | $0 | 44 | $278,529 | 7 | $120,989 |
| APPLICATIONS WITHDRAWN | 26 | $379,158 | 94 | $326,306 | 299 | $348,727 | 23 | $238,519 | 0 | $0 | 23 | $196,377 | 0 | $0 |
| FILES CLOSED FOR INCOMPLETENESS | 4 | $382,500 | 18 | $344,667 | 104 | $369,004 | 6 | $137,000 | 0 | $0 | 5 | $281,688 | 0 | $0 |
Detailed mortgage data for all 15 tracts in Milpitas, CA
| Private Mortgage Insurance Companies Aggregated Statistics For Year 2009 (Based on 12 full and 3 partial tracts) | ||||
| A) Conventional Home Purchase Loans | B) Refinancings | |||
|---|---|---|---|---|
| Number | Average Value | Number | Average Value | |
| LOANS ORIGINATED | 43 | $386,364 | 7 | $385,481 |
| APPLICATIONS APPROVED, NOT ACCEPTED | 20 | $417,209 | 8 | $391,936 |
| APPLICATIONS DENIED | 2 | $446,910 | 13 | $430,203 |
| APPLICATIONS WITHDRAWN | 5 | $408,600 | 1 | $587,000 |
| FILES CLOSED FOR INCOMPLETENESS | 2 | $364,500 | 1 | $472,000 |
2009 - 2018 National Fire Incident Reporting System (NFIRS) incidents
- Fire incident types reported to NFIRS in Milpitas, CA
- 27334.6%Structure Fires
- 26934.1%Outside Fires
- 15019.0%Mobile Property/Vehicle Fires
- 9612.2%Other
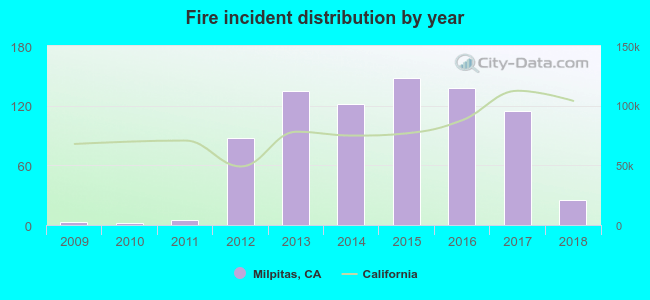 According to the data from the years 2009 - 2018 the average number of fires per year is 78. The highest number of fires - 148 took place in 2015, and the least - 2 in 2010. The data has a rising trend.
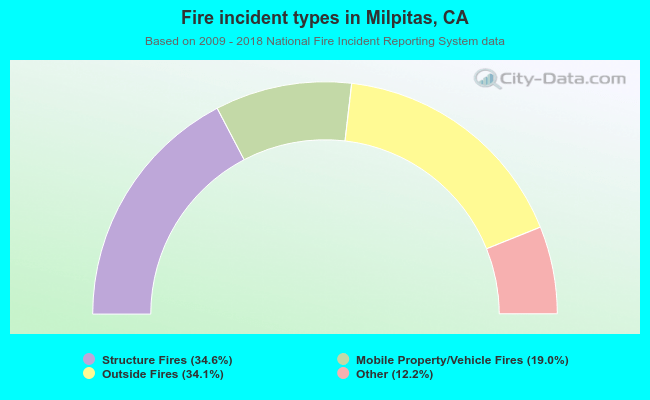 When looking into fire subcategories, the most reports belonged to: Structure Fires (34.6%), and Outside Fires (34.1%).
Fire-safe hotels and motels in Milpitas, California:
- Embassy Suites Milpitas, 901 E Calaveras Blvd, Milpitas, California 95035 , Phone: (408) 942-0400, Fax: (408) 262-8604
- Days Inn, 270 S Abbott Ave, Milpitas, California 95035 , Phone: (408) 946-8889, Fax: (408) 946-0748
- Sheraton San Jose Hotel, 1801 Barber Ln, Milpitas, California 95035 , Phone: (408) 943-0600, Fax: (408) 943-1707
- Baymont Inn & Suites, 66 S Main St, Milpitas, California 95035 , Phone: (408) 262-7685, Fax: (408) 262-2026
- Extended Stay America - San Jose - Milpitas - Mccarthy Ranch, 330 Cypress Dr, Milpitas, California 95035 , Phone: (408) 433-9700, Fax: (408) 433-9790
- Extended Stay America - San Jose - Milpitas, 1000 Hillview Ct, Milpitas, California 95035 , Phone: (408) 941-9977, Fax: (408) 941-9976
- Hilton Garden Inn, San Jose/Milpitas, 30 Ranch Dr, Milpitas, California 95035 , Phone: (408) 719-1313, Fax: (408) 719-0191
- Milpitas Courtyard By Marriott, 1480 Falcon Dr, Milpitas, California 95035 , Phone: (408) 719-1966, Fax: (408) 719-1962
- 4 other hotels and motels
| Most common first names in Milpitas, CA among deceased individuals | ||
| Name | Count | Lived (average) |
|---|---|---|
| John | 102 | 71.7 years |
| Mary | 78 | 75.9 years |
| Robert | 78 | 64.8 years |
| William | 69 | 69.2 years |
| James | 65 | 67.5 years |
| Charles | 48 | 73.4 years |
| Frank | 45 | 71.1 years |
| Joseph | 45 | 73.0 years |
| George | 36 | 70.8 years |
| Dorothy | 32 | 76.3 years |
| Most common last names in Milpitas, CA among deceased individuals | ||
| Last name | Count | Lived (average) |
|---|---|---|
| Nguyen | 75 | 74.3 years |
| Tran | 37 | 76.0 years |
| Smith | 31 | 73.8 years |
| Johnson | 26 | 72.6 years |
| Garcia | 26 | 74.5 years |
| Pham | 20 | 78.7 years |
| Brown | 20 | 76.8 years |
| Le | 20 | 73.5 years |
| Martinez | 19 | 58.1 years |
| Jones | 18 | 77.0 years |
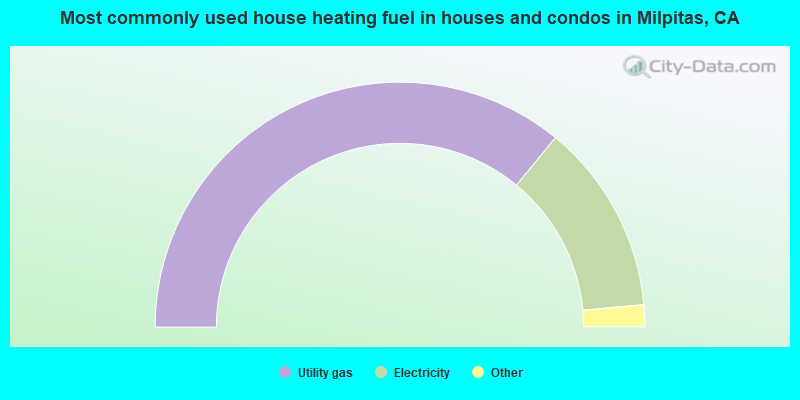
- 71.9%Utility gas
- 25.2%Electricity
- 1.6%Bottled, tank, or LP gas
- 0.8%Solar energy
- 0.3%No fuel used
- 0.2%Fuel oil, kerosene, etc.
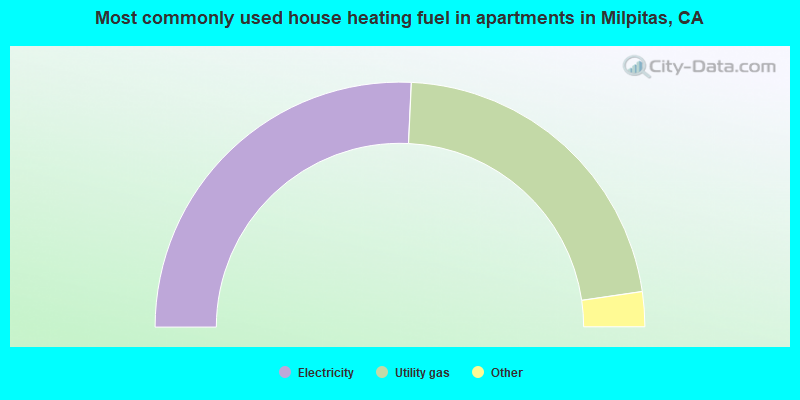
- 51.5%Electricity
- 43.9%Utility gas
- 2.3%No fuel used
- 1.8%Bottled, tank, or LP gas
- 0.3%Solar energy
Milpitas compared to California state average:
- Median household income above state average.
- Median house value above state average.
- Unemployed percentage significantly below state average.
- Black race population percentage below state average.
- Hispanic race population percentage below state average.
- Foreign-born population percentage significantly above state average.
- House age below state average.
- Institutionalized population percentage above state average.
- Percentage of population with a bachelor's degree or higher significantly above state average.
Milpitas on our top lists:
- #1 on the list of "Top 101 cities with the most cars per house, population 50,000+"
- #7 on the list of "Top 101 cities with largest percentage of males in occupations: architecture and engineering occupations (population 50,000+)"
- #9 on the list of "Top 101 cities with largest percentage of males in occupations: computer and mathematical occupations (population 50,000+)"
- #12 on the list of "Top 101 cities with largest percentage of females in occupations: computer and mathematical occupations (population 50,000+)"
- #12 on the list of "Top 101 cities with the most residents born in Vietnam (population 500+)"
- #13 on the list of "Top 101 cities with largest percentage of females in industries: manufacturing (population 50,000+)"
- #15 on the list of "Top 101 cities with the largest humidity differences during a year (population 50,000+)"
- #15 on the list of "Top 101 cities with the most residents born in Asia (population 500+)"
- #15 on the list of "Top 101 cities with the largest differences between morning and afternoon humidity (population 50,000+)"
- #16 on the list of "Top 100 cities with highest percentage of foreign-born residents (pop. 50,000+)"
- #21 on the list of "Top 101 cities with the most residents born in South Eastern Asia (population 500+)"
- #23 on the list of "Top 101 cities with largest percentage of males in industries: manufacturing (population 50,000+)"
- #29 on the list of "Top 101 cities with largest percentage of females in occupations: architecture and engineering occupations (population 50,000+)"
- #32 on the list of "Top 100 cities with the largest percentage of males (pop. 50,000+)"
- #35 on the list of "Top 100 high-educated but low-earning cities (pop. 50,000+)"
- #40 on the list of "Top 101 cities with the lowest percentage of English-only speaking households, population 50,000+"
- #51 on the list of "Top 101 cities with the highest cost per building permit(population 50,000+)"
- #54 on the list of "Top 101 cities with the lowest number of assaults per 100,000 residents (population 50,000+)"
- #55 on the list of "Top 101 cities with the most residents born in Philippines (population 500+)"
- #58 on the list of "Top 101 cities with the highest average sunshine amount (population 50,000+)"
- #35 (95035) on the list of "Top 101 zip codes with the most full service restaurants in 2005"
- #5 on the list of "Top 101 counties with the highest percentage of residents that visited a dentist within the past year"
- #9 on the list of "Top 101 counties with the lowest percentage of residents that smoked 100+ cigarettes in their lives"
- #16 on the list of "Top 101 counties with the most Other adherents"
- #16 on the list of "Top 101 counties with the most Catholic adherents"
- #17 on the list of "Top 101 counties with the highest percentage of residents that drank alcohol in the past 30 days"

|
|
Total of 7395 patent applications in 2008-2024.