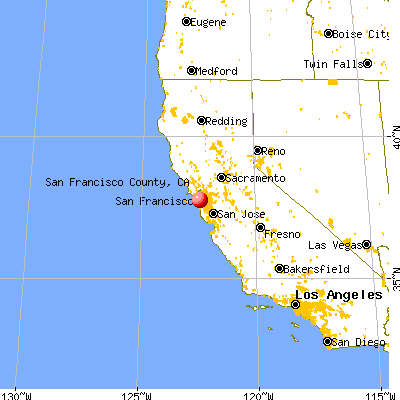
San Francisco County, California (CA)
County owner-occupied free and clear houses and condos in 2010: 32,635
County owner-occupied houses and condos in 2000: 115,315
Renter-occupied apartments: 222,165 (it was 214,385 in 2000)
| % of renters here: | 65% |
| State: | 44% |
Land area: 47 sq. mi.
Water area: 185.2 sq. mi.
Population density: 17313 people per square mile (very high).
Industries providing employment: Professional, scientific, management, administrative, and waste management services (27.1%), Educational, health and social services (20.8%).
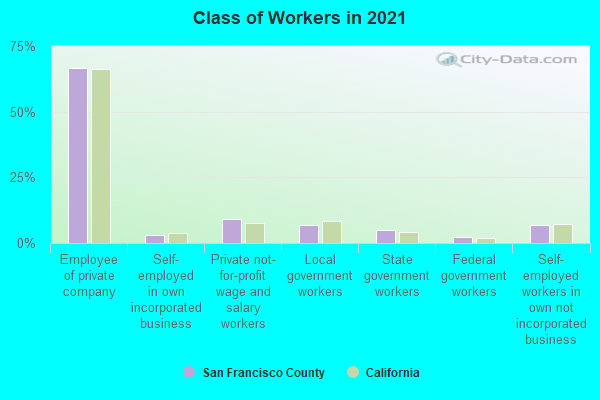
Type of workers:
- Private wage or salary: 80%
- Government: 13%
- Self-employed, not incorporated: 6%
- Unpaid family work: 0%
- OSM Map
- General Map
- Google Map
- MSN Map


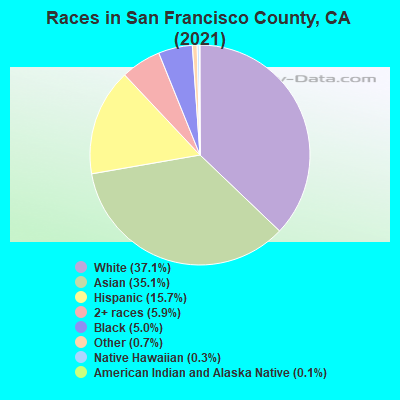
- 295,34336.5%White Non-Hispanic Alone
- 287,42135.6%Asian alone
- 128,16215.9%Hispanic or Latino
- 49,7596.2%Two or more races
- 36,7944.6%Black Non-Hispanic Alone
- 6,2520.8%Some other race alone
- 3,2750.4%Native Hawaiian and Other
Pacific Islander alone - 1,4310.2%American Indian and Alaska Native alone
| Median resident age: | 40.4 years |
| California median age: | 37.9 years |
| Males: 414,691 | |
| Females: 393,746 |

 | SF/Bay Area Crime Thread (1410 replies) |
| Bay Area exodus: Residents still want out, new poll finds. Here’s who is most anxious to leave (229 replies) |
| Why so many covid 19 cases and deaths in LA County (1268 replies) |
| LAPD Still Won't Get Vaccinated (1539 replies) |
| Are there any established middle class black communities in the Bay Area? (182 replies) |
| Coronavirus (12544 replies) |
| San Francisco County: | 2.0 people |
| California: | 3 people |
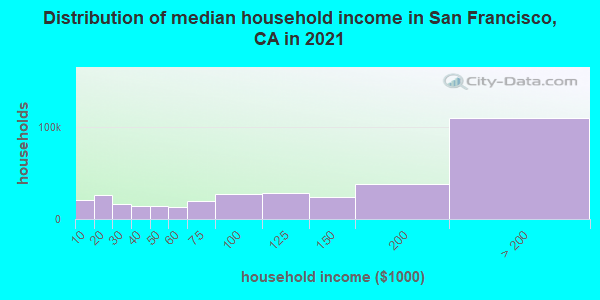
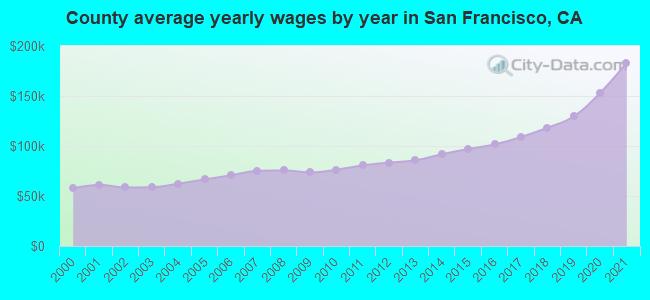
Estimated median household income in 2022: $136,692 ($55,221 in 1999)
| This county: | $136,692 |
| California: | $91,551 |
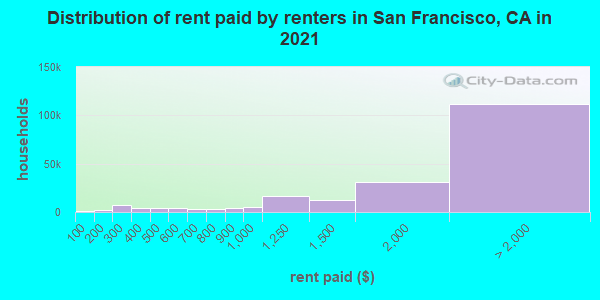
Median contract rent in 2022 for apartments: $2,226 (lower quartile is $1,319, upper quartile is $3,236)
| This county: | $2226 |
| State: | $1719 |
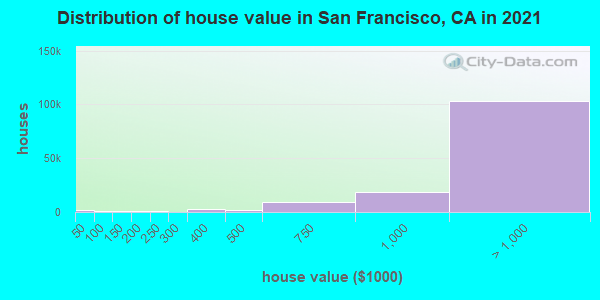
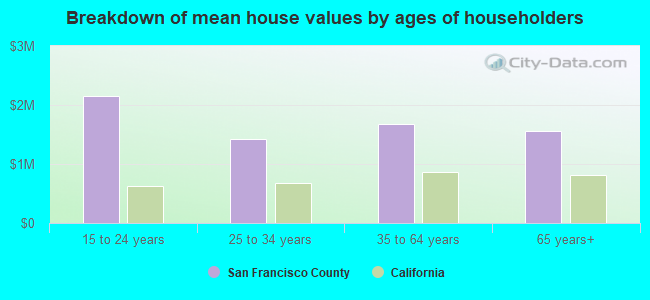
Estimated median house or condo value in 2022: $1,343,700 (it was $422,700 in 2000)
| San Francisco: | $1,343,700 |
| California: | $715,900 |
Mean price in 2022:
Median monthly housing costs for homes and condos with a mortgage: $4,001Detached houses: $1,942,973
Here: $1,942,973 State: $988,808 Townhouses or other attached units: $1,528,422
Here: $1,528,422 State: $838,546 In 2-unit structures: $1,536,932
Here: $1,536,932 State: $1,138,100 In 3-to-4-unit structures: $1,622,965
Here: $1,622,965 State: $824,253 In 5-or-more-unit structures: $1,155,972
Here: $1,155,972 State: $730,996 Mobile homes: $410,526
Here: $410,526 State: $184,506
Median monthly housing costs for units without a mortgage: $876
Institutionalized population: 5,362
Crime in 1986 (reported by the sheriff's office or county police, not the county total):
- Murders: 0
- Rapes: 0
- Robberies: 0
- Assaults: 6
- Burglaries: 0
- Thefts: 0
- Auto thefts: 0
Crime in 1985 (reported by the sheriff's office or county police, not the county total):
- Murders: 0
- Rapes: 0
- Robberies: 0
- Assaults: 43
- Burglaries: 0
- Thefts: 0
- Auto thefts: 0
Health of residents in San Francisco County based on CDC Behavioral Risk Factor Surveillance System Survey Questionnaires from 2003 to 2012:
General health status score of residents in this county from 1 (poor) to 5 (excellent) is 3.6. This is about average.81.8% of residents exercised in the past month. This is more than average.
39.5% of residents smoked 100+ cigarettes in their lives. This is less than average.
99.8% of adult residents drank alcohol in the past 30 days. This is more than average.
73.1% of residents visited a dentist within the past year. This is about average.
Average weight of males is 179 pounds. This is less than average.
Average weight of females is 144 pounds. This is less than average.
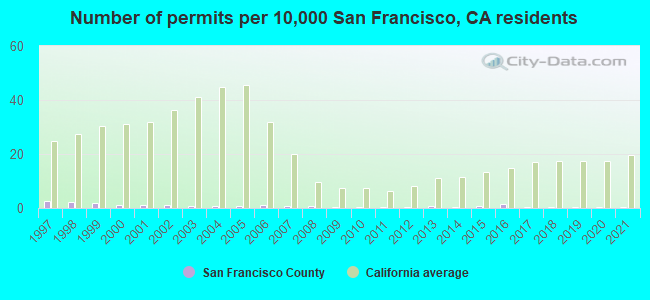
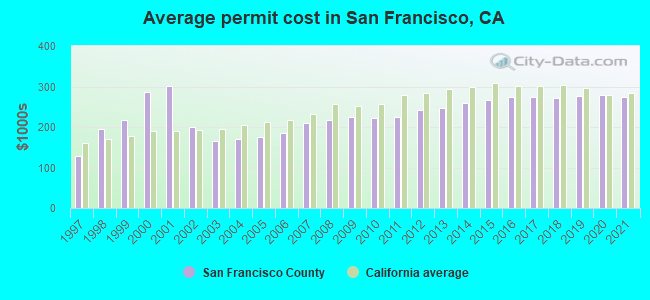
Single-family new house construction building permits:
- 2022: 38 buildings, average cost: $282,400
- 2021: 33 buildings, average cost: $275,200
- 2020: 21 buildings, average cost: $277,700
- 2019: 22 buildings, average cost: $276,100
- 2018: 28 buildings, average cost: $271,200
- 2017: 43 buildings, average cost: $273,900
- 2016: 123 buildings, average cost: $273,000
- 2015: 64 buildings, average cost: $266,400
- 2014: 35 buildings, average cost: $259,700
- 2013: 54 buildings, average cost: $247,900
- 2012: 22 buildings, average cost: $241,300
- 2011: 31 buildings, average cost: $224,600
- 2010: 22 buildings, average cost: $221,400
- 2009: 17 buildings, average cost: $223,500
- 2008: 57 buildings, average cost: $218,300
- 2007: 55 buildings, average cost: $208,800
- 2006: 95 buildings, average cost: $183,900
- 2005: 51 buildings, average cost: $176,300
- 2004: 58 buildings, average cost: $170,400
- 2003: 63 buildings, average cost: $164,600
- 2002: 82 buildings, average cost: $201,200
- 2001: 94 buildings, average cost: $299,700
- 2000: 81 buildings, average cost: $285,700
- 1999: 146 buildings, average cost: $216,500
- 1998: 178 buildings, average cost: $193,800
- 1997: 189 buildings, average cost: $129,400
Median real estate property taxes paid for housing units with mortgages in 2022: $10,001 (0.7%)
Median real estate property taxes paid for housing units with no mortgage in 2022: $5,164 (0.4%)
| San Francisco County: | 10.4% |
| California: | 12.2% |
Median age of residents in 2022: 40.4 years old
(Males: 40.3 years old, Females: 40.5 years old)
(Median age for: White residents: 42.1 years old, Black residents: 40.5 years old, American Indian residents: 36.0 years old, Asian residents: 44.8 years old, Hispanic or Latino residents: 35.5 years old, Other race residents: 36.0 years old)
Area name: San Francisco, CA HUD Metro FMR Area
Fair market rent in 2006 for a 1-bedroom apartment in San Francisco County is $1227 a month.
Fair market rent for a 2-bedroom apartment is $1536 a month.
Fair market rent for a 3-bedroom apartment is $2051 a month.
Cities in this county include: San Francisco.
| Zip code | City | Number of tests | Number of tests >= 4 pCi/L |
|---|---|---|---|
| 94101 | San Francisco | 2 | 0 |
| 94102 | San Francisco | 36 | 0 |
| 94103 | San Francisco | 9 | 1 |
| 94104 | San Francisco | 5 | 0 |
| 94105 | San Francisco | 10 | 0 |
| 94107 | San Francisco | 34 | 0 |
| 94108 | San Francisco | 5 | 0 |
| 94109 | San Francisco | 27 | 0 |
| 94110 | San Francisco | 28 | 1 |
| 94111 | San Francisco | 13 | 0 |
| 94112 | San Francisco | 21 | 0 |
| 94114 | San Francisco | 45 | 2 |
| 94115 | San Francisco | 9 | 0 |
| 94116 | San Francisco | 26 | 0 |
| 94117 | San Francisco | 20 | 4 |
| 94118 | San Francisco | 22 | 1 |
| 94119 | San Francisco | 1 | 0 |
| 94121 | San Francisco | 23 | 0 |
| 94122 | San Francisco | 38 | 2 |
| 94123 | San Francisco | 10 | 0 |
| 94124 | San Francisco | 7 | 0 |
| 94127 | San Francisco | 26 | 2 |
| 94129 | San Francisco | 10 | 1 |
| 94131 | San Francisco | 17 | 0 |
| 94132 | San Francisco | 3 | 0 |
| 94133 | San Francisco | 20 | 0 |
| 94134 | San Francisco | 5 | 1 |
| 94137 | San Francisco | 1 | 0 |
| 94142 | San Francisco | 1 | 0 |
| 94188 | San Francisco | 1 | 0 |
2023 air pollution in San Francisco County:
Carbon Monoxide: 0.235 ppm (standard limit: 9 ppm). Near U.S. average.
Nitrogen Dioxide: 0.01 ppm (standard limit: 0.053 ppm). Above U.S. average.
Ozone (1-hour): 0.025 ppm (standard limit: 0.12 ppm). Below U.S. average.
Particulate Matter (PM2.5) Annual: 5.3 µg/m3(standard limit: 15.0 µg/m3). Below U.S. average.
Neighboring counties: Butler County, Kansas  , Crawford County, Kansas , Washington County, Utah , Martin County, Kentucky , Shannon County, Missouri .
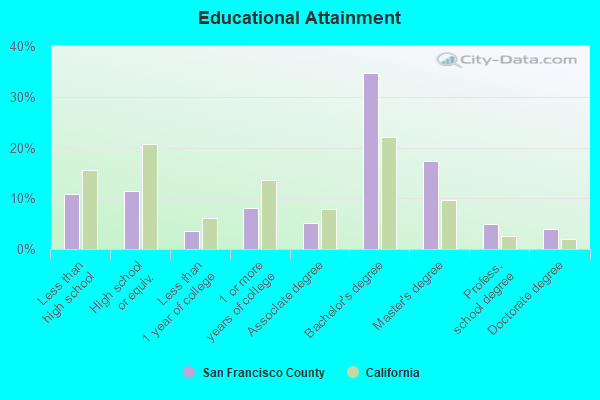
Current college students: 85,159
People 25 years of age or older with a high school degree or higher: 88.9%
People 25 years of age or older with a bachelor's degree or higher: 61.4%
Number of foreign born residents: 268,197 (63.3% naturalized citizens)
| San Francisco County: | 33.2% |
| Whole state: | 26.7% |
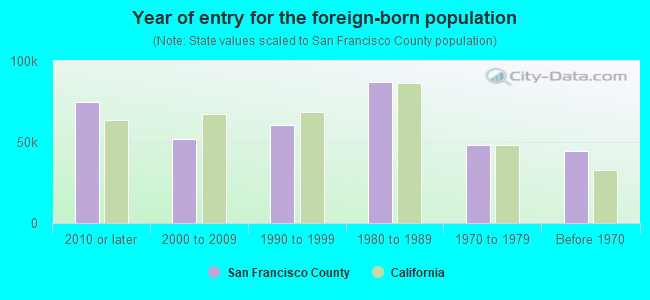
- Year of entry for the foreign-born population
- 73,2082010 or later
- 50,5482000 to 2009
- 51,4111990 to 1999
- 86,9491980 to 1989
- 47,9991970 to 1979
- 44,393Before 1970
Mean travel time to work (commute): minutes
Percentage of county residents living and working in this county: 99.6%
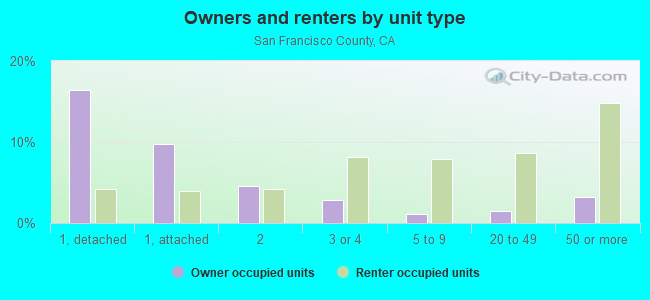
Housing units in structures:
- One, detached: 74,994
- One, attached: 47,815
- Two: 39,593
- 3 or 4: 49,051
- 5 to 9: 36,968
- 10 to 19: 38,953
- 20 to 49: 43,311
- 50 or more: 83,197
- Mobile homes: 350
- Boats, RVs, vans, etc.: 321
Housing units in San Francisco County with a mortgage: 88,355 (11,037 second mortgage, 418 home equity loan, 8,730 both second mortgage and home equity loan)
Houses without a mortgage: 1,471
| Here: | 98.9% with mortgage |
| State: | 98.6% with mortgage |
Religion statistics for San Francisco County
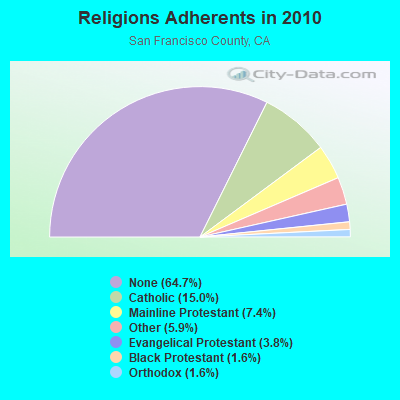
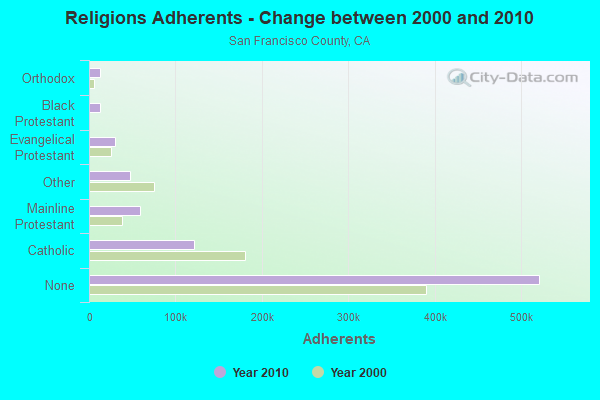
| Religion | Adherents | Congregations |
|---|---|---|
| Catholic | 120,988 | 50 |
| Mainline Protestant | 59,308 | 91 |
| Other | 47,820 | 114 |
| Evangelical Protestant | 30,348 | 199 |
| Black Protestant | 13,176 | 51 |
| Orthodox | 12,670 | 16 |
| None | 520,925 | - |
Source: Clifford Grammich, Kirk Hadaway, Richard Houseal, Dale E.Jones, Alexei Krindatch, Richie Stanley and Richard H.Taylor. 2012. 2010 U.S.Religion Census: Religious Congregations & Membership Study. Association of Statisticians of American Religious Bodies. Jones, Dale E., et al. 2002. Congregations and Membership in the United States 2000. Nashville, TN: Glenmary Research Center.
Food Environment Statistics:
| San Francisco County: | 3.89 / 10,000 pop. |
| State: | 2.14 / 10,000 pop. |
| Here: | 0.01 / 10,000 pop. |
| California: | 0.04 / 10,000 pop. |
| This county: | 0.59 / 10,000 pop. |
| California: | 0.62 / 10,000 pop. |
| San Francisco County: | 0.81 / 10,000 pop. |
| California: | 1.49 / 10,000 pop. |
| This county: | 19.77 / 10,000 pop. |
| State: | 7.42 / 10,000 pop. |
| San Francisco County: | 7.4% |
| California: | 7.3% |
| San Francisco County: | 16.1% |
| State: | 21.3% |
| Here: | 16.3% |
| State: | 17.9% |
Agriculture in San Francisco County:
Average value of agricultural products sold per farm: $126,530Average total farm production expenses per farm: $92,089
Average market value of all machinery and equipment per farm: $1,933
The percentage of farms operated by a family or individual: 87.50%
Average age of principal farm operators: 52 years
Earthquake activity:
San Francisco County-area historical earthquake activity is significantly above California state average. It is 7368% greater than the overall U.S. average.On 4/18/1906 at 13:12:21, a magnitude 7.9 (7.9 UK, Class: Major, Intensity: VIII - XII) earthquake occurred 34.9 miles away from San Francisco County center, causing $524,000,000 total damage
On 10/18/1989 at 00:04:15, a magnitude 7.1 (6.5 MB, 7.1 MS, 6.9 MW, 7.0 ML) earthquake occurred 58.0 miles away from the county center, causing 62 deaths (62 shaking deaths) and 3757 injuries, causing $1,305,032,704 total damage
On 11/4/1927 at 13:51:53, a magnitude 7.5 (7.5 UK) earthquake occurred 211.8 miles away from the county center
On 7/21/1952 at 11:52:14, a magnitude 7.7 (7.7 UK) earthquake occurred 270.3 miles away from the county center, causing $50,000,000 total damage
On 1/31/1922 at 13:17:28, a magnitude 7.6 (7.6 UK) earthquake occurred 263.1 miles away from San Francisco County center
On 4/25/1992 at 18:06:04, a magnitude 7.2 (6.3 MB, 7.1 MS, 7.2 MW, 7.1 MW, Depth: 9.4 mi) earthquake occurred 199.4 miles away from the county center, causing $75,000,000 total damage
Magnitude types: body-wave magnitude (MB), local magnitude (ML), surface-wave magnitude (MS), moment magnitude (MW)
Most recent natural disasters:
- California Covid-19 Pandemic, Incident Period: January 20, 2020, FEMA Id: 4482, Natural disaster type: Other
- California Hurricane Katrina Evacuation, Incident Period: August 29, 2005 to October 01, 2005, Emergency Declared EM-3248: September 13, 2005, FEMA Id: 3248, Natural disaster type: Hurricane
- California Severe Winter Storms and Flooding, Incident Period: February 02, 1998 to April 30, 1998, Major Disaster (Presidential) Declared DR-1203: February 09, 1998, FEMA Id: 1203, Natural disaster type: Winter Storm, Flood
- California Severe Storms/Flooding, Incident Period: December 28, 1996 to April 01, 1997, Major Disaster (Presidential) Declared DR-1155: January 04, 1997, FEMA Id: 1155, Natural disaster type: Storm, Flood
- California Severe Winter Storms, Flooding, Landslides, Mud Flows, Incident Period: February 13, 1995 to April 19, 1995, Major Disaster (Presidential) Declared DR-1046: March 12, 1995, FEMA Id: 1046, Natural disaster type: Winter Storm, Landslide, Flood
- California Loma Prieta Earthquake, Incident Period: October 17, 1989 to December 18, 1989, Major Disaster (Presidential) Declared DR-845: October 18, 1989, FEMA Id: 845, Natural disaster type: Earthquake
The number of natural disasters in San Francisco County (6) is a lot smaller than the US average (15).
Major Disasters (Presidential) Declared: 4
Emergencies Declared: 1
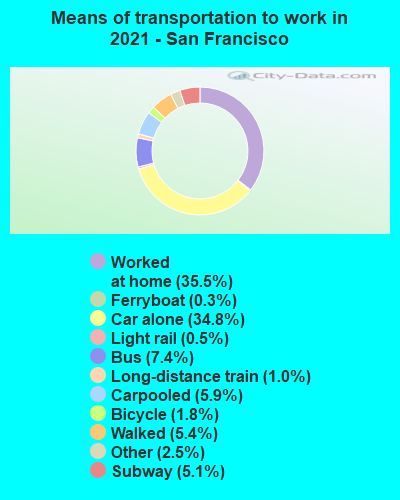
Means of transportation to work:
- Drove a car alone: 212,061 (35.2%)
- Carpooled: 44,065 (7.3%)
- Bus: 55,563 (9.2%)
- Subway or elevated rail: 46,153 (7.7%)
- Long-distance train or commuter rail: 9,622 (1.6%)
- Light rail, streetcar or trolley: 5,726 (0.9%)
- Ferryboat: 4,973 (0.8%)
- Taxicab, motorcycle, or other means: 14,648 (2.4%)
- Bicycle: 16,237 (2.7%)
- Walked: 42,815 (7.1%)
- Worked at home: 151,314 (25.1%)
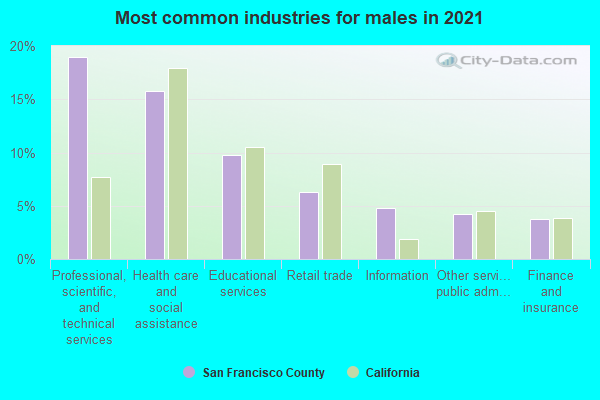
- Professional, scientific, and technical services (18%)
- Health care and social assistance (15%)
- Educational services (10%)
- Retail trade (7%)
- Accommodation and food services (5%)
- Finance and insurance (5%)
- Other services, except public administration (4%)
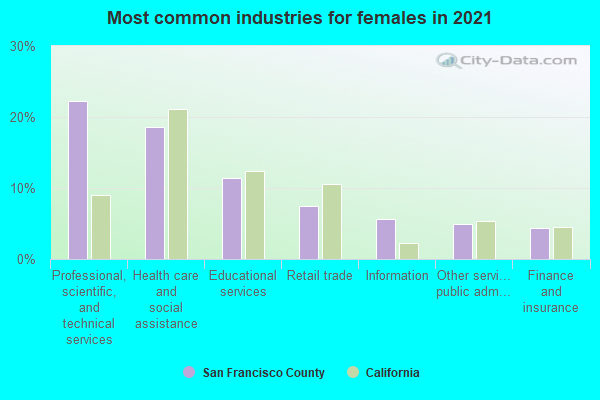
- Professional, scientific, and technical services (21%)
- Health care and social assistance (18%)
- Educational services (12%)
- Retail trade (8%)
- Accommodation and food services (6%)
- Finance and insurance (5%)
- Other services, except public administration (5%)
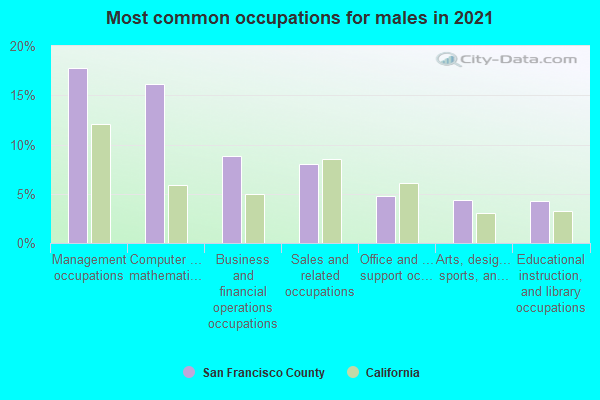
- Management occupations (18%)
- Computer and mathematical occupations (15%)
- Business and financial operations occupations (8%)
- Sales and related occupations (8%)
- Office and administrative support occupations (5%)
- Arts, design, entertainment, sports, and media occupations (5%)
- Food preparation and serving related occupations (5%)
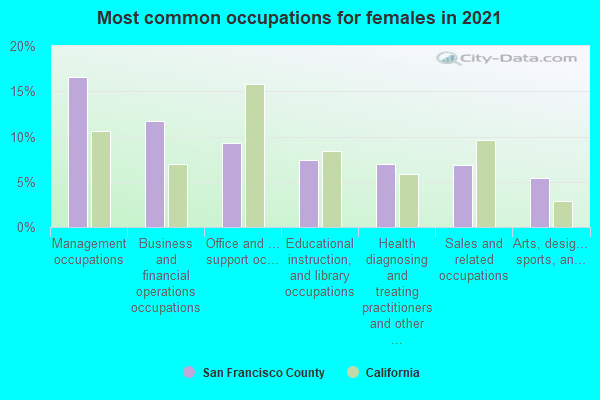
- Management occupations (17%)
- Business and financial operations occupations (11%)
- Office and administrative support occupations (10%)
- Educational instruction, and library occupations (9%)
- Health diagnosing and treating practitioners and other technical occupations (8%)
- Sales and related occupations (8%)
- Computer and mathematical occupations (6%)
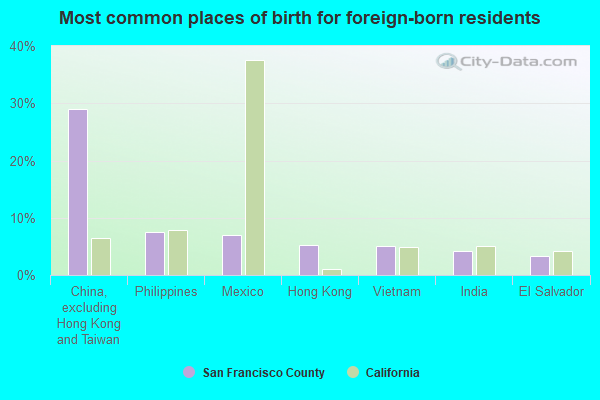
- China, excluding Hong Kong and Taiwan (29%)
- Philippines (8%)
- Mexico (7%)
- Hong Kong (5%)
- Vietnam (5%)
- India (5%)
- El Salvador (3%)
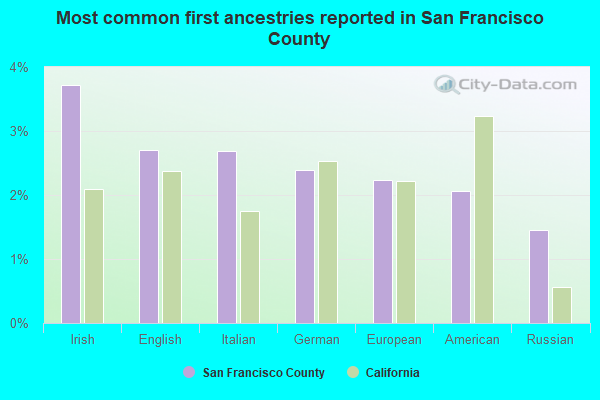
- Irish (3%)
- English (3%)
- European (3%)
- German (3%)
- Italian (2%)
- American (1%)
- Russian (1%)
People in group quarters in San Francisco County, California in 2010:
- 8,151 people in college/university student housing
- 4,772 people in other noninstitutional facilities
- 2,942 people in nursing facilities/skilled-nursing facilities
- 2,303 people in emergency and transitional shelters (with sleeping facilities) for people experiencing homelessness
- 1,499 people in group homes intended for adults
- 1,210 people in local jails and other municipal confinement facilities
- 1,138 people in residential treatment centers for adults
- 1,008 people in workers' group living quarters and job corps centers
- 377 people in hospitals with patients who have no usual home elsewhere
- 224 people in correctional residential facilities
- 169 people in correctional facilities intended for juveniles
- 139 people in state prisons
- 95 people in mental (psychiatric) hospitals and psychiatric units in other hospitals
- 91 people in residential treatment centers for juveniles (non-correctional)
- 87 people in group homes for juveniles (non-correctional)
- 31 people in maritime/merchant vessels
- 28 people in in-patient hospice facilities
People in group quarters in San Francisco County, California in 2000:
- 5,120 people in other noninstitutional group quarters
- 3,926 people in college dormitories (includes college quarters off campus)
- 2,306 people in other nonhousehold living situations
- 1,685 people in nursing homes
- 1,584 people in other group homes
- 1,232 people in local jails and other confinement facilities (including police lockups)
- 943 people in homes or halfway houses for drug/alcohol abuse
- 619 people in religious group quarters
- 406 people in wards in general hospitals for patients who have no usual home elsewhere
- 389 people in homes for the mentally ill
- 277 people in homes for the mentally retarded
- 223 people in schools, hospitals, or wards for the intellectually disabled
- 183 people in job corps and vocational training facilities
- 174 people in mental (psychiatric) hospitals or wards
- 125 people in short-term care, detention or diagnostic centers for delinquent children
- 96 people in hospitals or wards for drug/alcohol abuse
- 92 people in halfway houses
- 71 people in agriculture workers' dormitories on farms
- 64 people in hospitals/wards and hospices for chronically ill
- 43 people in crews of maritime vessels
- 41 people in other workers' dormitories
- 37 people in other hospitals or wards for chronically ill
- 36 people in federal prisons and detention centers
- 30 people in homes for abused, dependent, and neglected children
- 27 people in hospices or homes for chronically ill
- 22 people in military barracks, etc.
- 21 people in orthopedic wards and institutions for the physically handicapped
- 19 people in homes for the physically handicapped
- 16 people in other types of correctional institutions
- 14 people in military ships
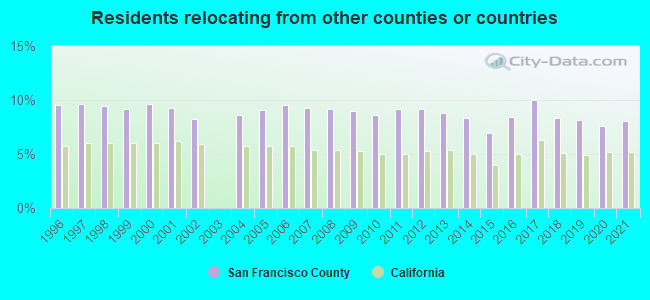
8.02% of this county's 2021 resident taxpayers lived in other counties in 2020 ($134,049 average adjusted gross income)
| Here: | 8.02% |
| California average: | 5.19% |
0.01% of residents moved from foreign countries ($70 average AGI)
San Francisco County: 0.01% California average: 0.03%
5.34% relocated from other counties in California ($90,000 average AGI)
2.68% relocated from other states ($43,980 average AGI)
San Francisco County: 2.68% California average: 1.56%
Top counties from which taxpayers relocated into this county between 2020 and 2021:
| from San Mateo County, CA | |
| from Alameda County, CA | |
| from Santa Clara County, CA | |
| from Los Angeles County, CA | |
| from Contra Costa County, CA | |
| from Marin County, CA | |
| from New York County, NY |
12.53% of this county's 2020 resident taxpayers moved to other counties in 2021 ($239,664 average adjusted gross income)
| Here: | 12.53% |
| California average: | 6.14% |
0.01% of residents moved to foreign countries ($137 average AGI)
San Francisco County: 0.01% California average: 0.02%
8.15% relocated to other counties in California ($139,051 average AGI)
4.36% relocated to other states ($100,476 average AGI)
San Francisco County: 4.36% California average: 2.55%

Top counties to which taxpayers relocated from this county between 2020 and 2021:
| to Alameda County, CA | |
| to San Mateo County, CA | |
| to Los Angeles County, CA | |
| to Contra Costa County, CA | |
| to Santa Clara County, CA | |
| to Marin County, CA | |
| to San Diego County, CA |
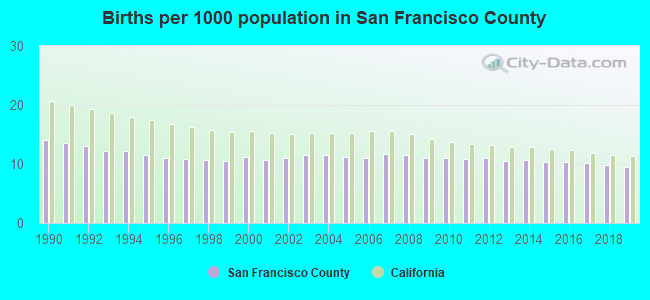
Births per 1000 population from 1990 to 1999: 12.0
Births per 1000 population from 2000 to 2009: 11.2
Births per 1000 population from 2010 to 2022: 8.7
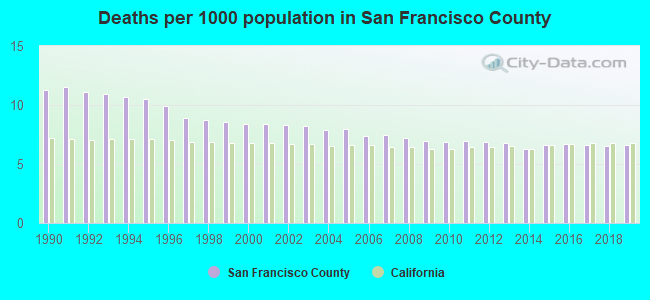
Deaths per 1000 population from 1990 to 1999: 10.2
Deaths per 1000 population from 2000 to 2009: 7.8
Deaths per 1000 population from 2010 to 2020: 6.7
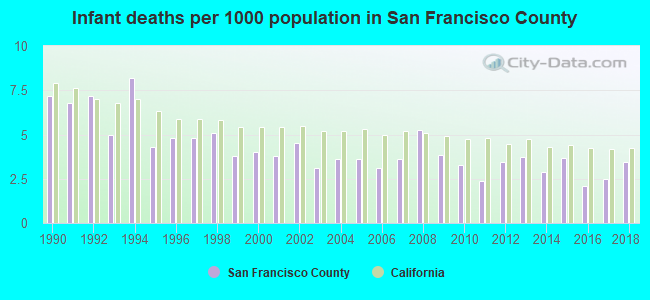
Infant deaths per 1000 live births from 1990 to 1999: 5.7
Infant deaths per 1000 live births from 2000 to 2009: 3.8
Infant deaths per 1000 live births from 2010 to 2021: 2.9
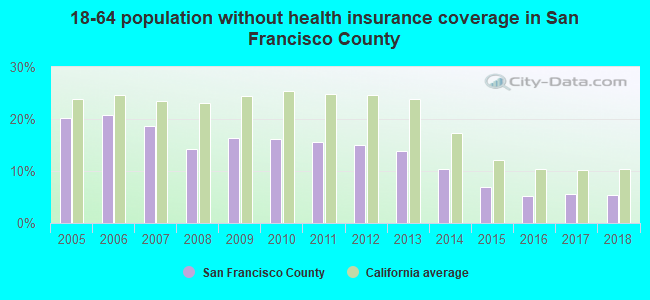
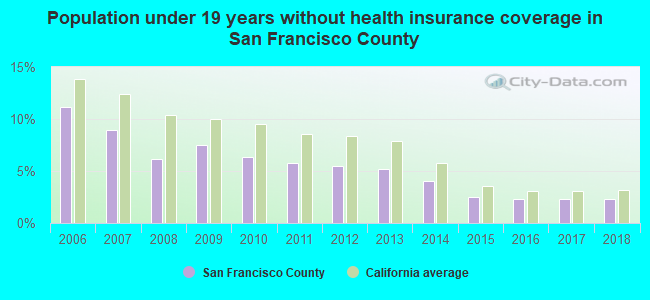
Persons under 19 years old without health insurance coverage in 2018: 2.3%

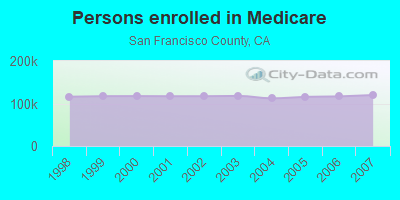
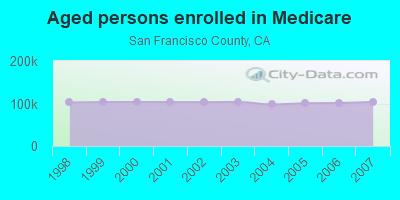
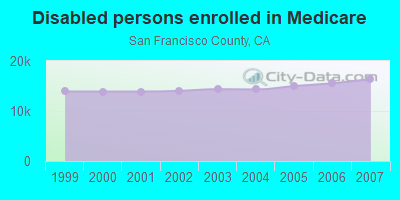
Persons enrolled in hospital insurance and/or supplemental medical insurance (Medicare) in July 1, 2007: 119,847 (103,491 aged, 16,356 disabled)
Children under 18 without health insurance coverage in 2007: 10,314 (8%)
Most common underlying causes of death in San Francisco County, California in 1999 - 2019:
- Atherosclerotic heart disease (7,190)
- Bronchus or lung, unspecified - Malignant neoplasms (6,723)
- Acute myocardial infarction, unspecified (5,491)
- Alzheimer disease, unspecified (4,782)
- Atherosclerotic cardiovascular disease, so described (4,712)
- Stroke, not specified as haemorrhage or infarction (3,720)
- Chronic obstructive pulmonary disease, unspecified (3,426)
- Hypertensive heart disease without (congestive) heart failure (3,355)
- Pneumonia, unspecified (3,279)
- Unspecified dementia (2,038)
Population without health insurance coverage in 2000: 13%
Children under 18 without health insurance coverage in 2000: 11%
Homicides per 1,000,000 population from 2000 to 2006: 80.9. This is less than state average.
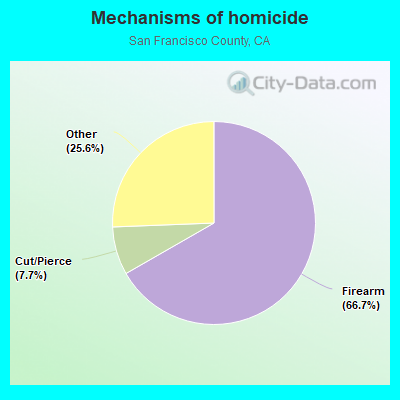
- Firearm - 53.9
- Cut/Pierce - 6.2
- Other - 20.7
Suicides per 1,000,000 population from 2000 to 2006: 120.3. This is less than state average.
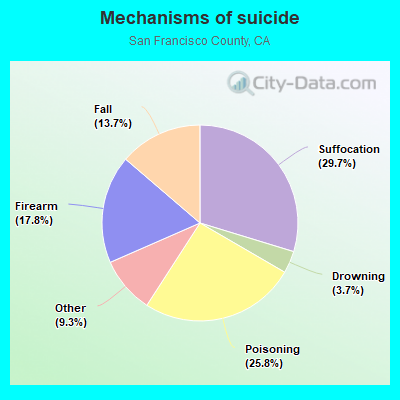
- Suffocation - 35.8
- Poisoning - 31.0
- Firearm - 21.5
- Fall - 16.5
- Drowning - 4.4
- Other - 11.2
Household type by relationship:
Households: 808,437- Male householders: 198,501 (72,245 living alone), Female householders: 163,411 (66,183 living alone)
127,807 spouses (120,689 opposite-sex spouses), 31,896 unmarried partners, (27,755 opposite-sex unmarried partners), 140,761 children (136,217 natural, 1,648 adopted, 2,896 stepchildren), 9,472 grandchildren, 12,023 brothers or sisters, 19,932 parents, 186 foster children, 18,801 other relatives, 59,443 non-relatives
- In group quarters: 26,204
Size of family households: 79,690 2-persons, 38,182 3-persons, 29,794 4-persons, 12,749 5-persons, 5,342 6-persons, 3,527 7-or-more-persons.
Size of nonfamily households: 138,428 1-person, 39,569 2-persons, 9,591 3-persons, 3,063 4-persons, 1,050 5-persons, 143 6-persons, 784 7-or-more-persons.
77,405 married couples with children.
19,126 single-parent households (6,278 men, 12,848 women).
56.7% of residents of San Francisco speak English at home.
10.4% of residents speak Spanish at home (64% speak English very well, 17% speak English well, 14% speak English not well, 4% don't speak English at all).
6.9% of residents speak other Indo-European language at home (81% speak English very well, 13% speak English well, 5% speak English not well, 1% don't speak English at all).
25.0% of residents speak Asian or Pacific Island language at home (45% speak English very well, 21% speak English well, 21% speak English not well, 12% don't speak English at all).
1.0% of residents speak other language at home (74% speak English very well, 17% speak English well, 6% speak English not well, 3% don't speak English at all).
In fiscal year 2004:
Federal Government expenditure: $7,606,654,000 ($10,221 per capita)
Department of Defense expenditure: $361,522,000
Federal direct payments to individuals for retirement and disability: $1,516,391,000
Federal other direct payments to individuals: $1,267,797,000
Federal direct payments not to individuals: $43,739,000
Federal grants: $2,609,875,000
Federal procurement contracts: $1,002,059,000 ($295,346,000 Department of Defense)
Federal salaries and wages: $1,166,793,000 ($26,058,000 Department of Defense)
Federal Government direct loans: $282,430,000
Federal guaranteed/insured loans: $155,414,000
Federal Government insurance: $1,547,000
Population change from April 1, 2000 to July 1, 2005:
Births: 43,679| Here: | 59 per 1000 residents |
| State: | 77 per 1000 residents |
Deaths: 33,128
| Here: | 45 per 1000 residents |
| State: | 34 per 1000 residents |
Net international migration: +44,659
| Here: | +60 per 1000 residents |
| State: | +39 per 1000 residents |
Net internal migration: -91,409
| Here: | |
| State: |
Total withdrawal of fresh water for public supply: 81.37 millions of gallons per day (all from surface)
| Here: | 5.5 |
| State: | 6.0 |
| Here: | 3.3 |
| State: | 3.9 |
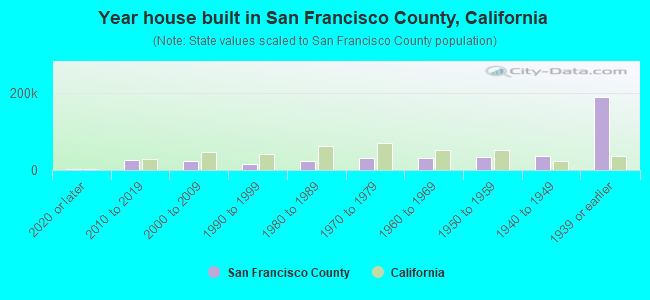
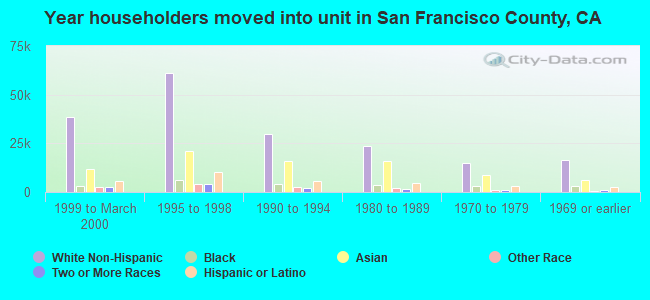
- Year house built in San Francisco County, California
- 5,6882020 or later
- 30,1542010 to 2019
- 26,6152000 to 2009
- 16,1761990 to 1999
- 20,5771980 to 1989
- 27,4791970 to 1979
- 34,7881960 to 1969
- 29,9131950 to 1959
- 35,1861940 to 1949
- 187,9771939 or earlier
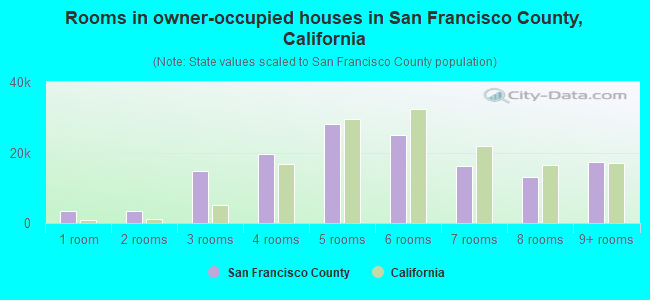
- Rooms in owner-occupied houses in San Francisco County, California
- 3,1511 room
- 5,1532 rooms
- 11,7763 rooms
- 20,7664 rooms
- 29,1685 rooms
- 28,8376 rooms
- 16,0137 rooms
- 12,5488 rooms
- 14,5239+ rooms
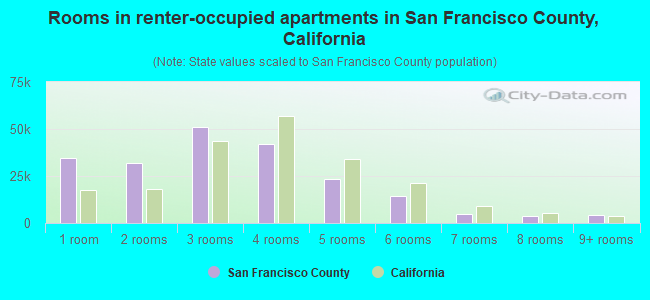
- Rooms in renter-occupied apartments in San Francisco County, California
- 33,9311 room
- 36,2512 rooms
- 51,5563 rooms
- 43,7064 rooms
- 28,6225 rooms
- 13,1786 rooms
- 5,2087 rooms
- 4,1218 rooms
- 3,4049+ rooms
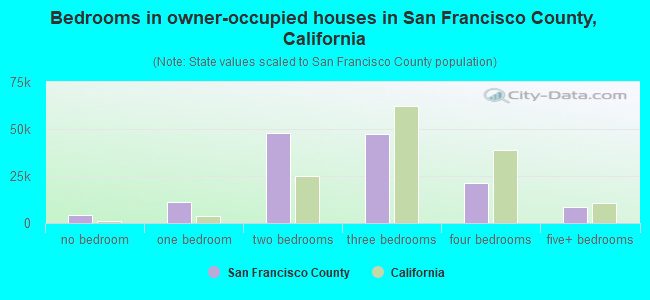
- Bedrooms in owner-occupied houses in San Francisco County, California
- 3,683no bedroom
- 12,9271 bedroom
- 50,0342 bedrooms
- 47,5093 bedrooms
- 20,2534 bedrooms
- 7,5295+ bedrooms
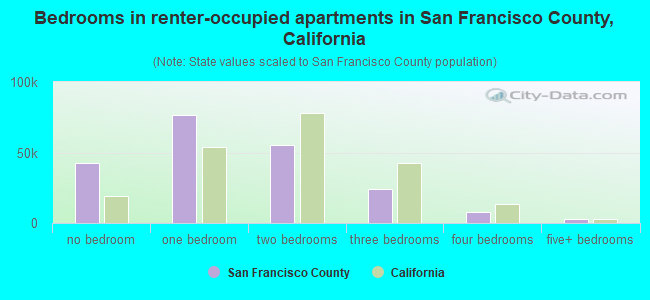
- Bedrooms in renter-occupied apartments in San Francisco County, California
- 44,588no bedroom
- 78,4391 bedroom
- 60,3082 bedrooms
- 26,8713 bedrooms
- 7,6354 bedrooms
- 2,1365+ bedrooms
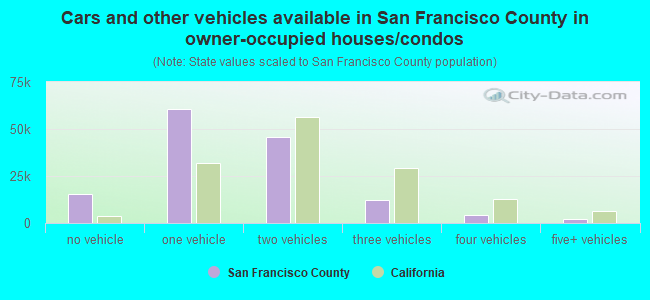
- Cars and other vehicles available in San Francisco County in owner-occupied houses/condos
- 15,519no vehicle
- 65,1181 vehicle
- 45,2122 vehicles
- 10,4603 vehicles
- 3,8614 vehicles
- 1,7655+ vehicles
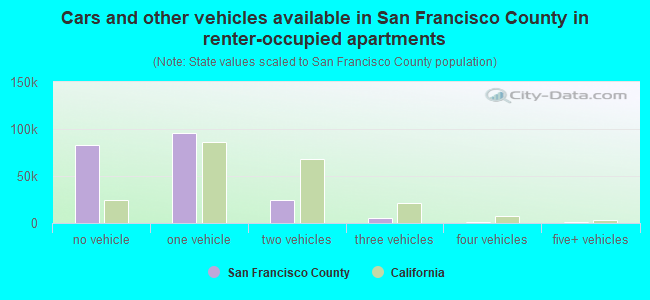
- Cars and other vehicles available in San Francisco County in renter-occupied apartments
- 87,552no vehicle
- 100,3341 vehicle
- 24,5472 vehicles
- 5,6013 vehicles
- 1,1894 vehicles
- 7545+ vehicles
84.5% of San Francisco County residents lived in the same house 1 years ago.
Out of people who lived in different houses, 34% lived in this county.
Out of people who lived in different counties, 58% lived in California.
| San Francisco County: | 84.5% |
| State average: | 88.9% |
Place of birth for U.S.-born residents:
- This state: 329,753
- Other state: 189,258
- Northeast: 64,541
- Midwest: 52,215
- South: 43,663
- West: 28,839
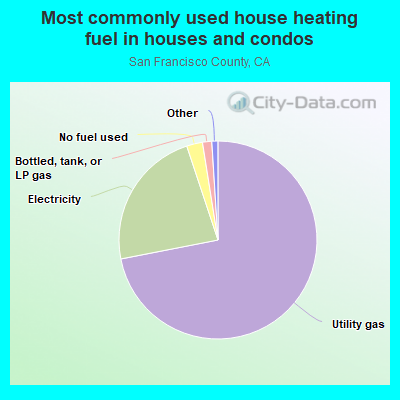
- 72.3%Utility gas
- 22.5%Electricity
- 2.9%No fuel used
- 1.6%Bottled, tank, or LP gas
- 0.4%Solar energy
- 0.2%Other fuel
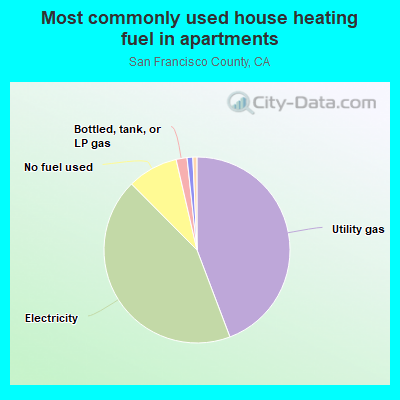
- 44.6%Utility gas
- 42.7%Electricity
- 8.2%No fuel used
- 2.0%Other fuel
- 1.9%Bottled, tank, or LP gas
- 0.3%Solar energy
- 0.1%Fuel oil, kerosene, etc.
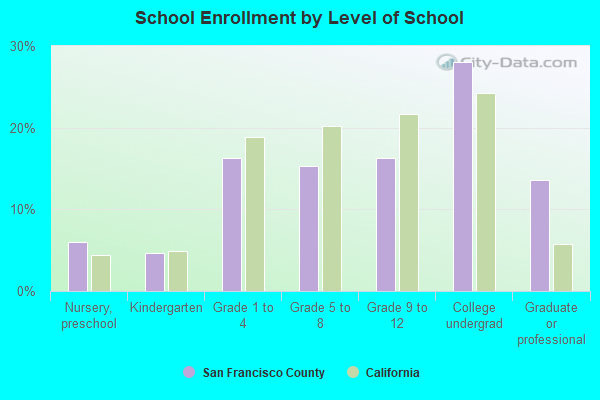
Private vs. public school enrollment:
| Here: | 38.2% |
| California: | 10.5% |
| Here: | 34.2% |
| California: | 8.5% |
| Here: | 26.5% |
| California: | 15.9% |
Supplemental Security Income (SSI) in 2006:
- Total number of recipients: 46,287
- Number of aged recipients: 20,700
- Number of blind and disabled recipients: 25,587
- Number of recipients under 18: 830
- Number of recipients between 18 and 64: 17,836
- Number of recipients older than 64: 27,621
- Number of recipients also receiving OASDI: 16,808
- Amount of payments (thousands of dollars): 29,433
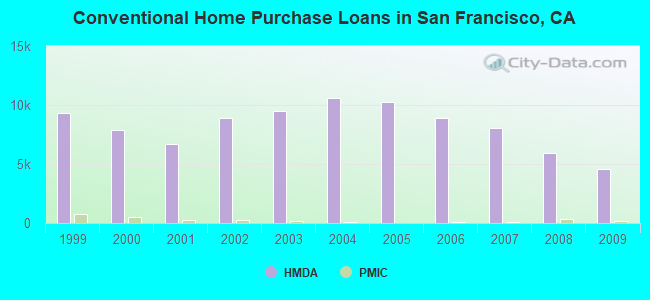
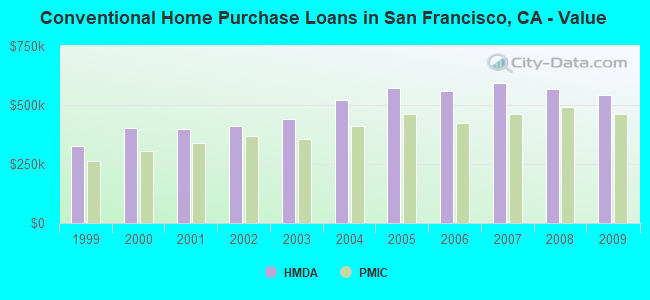
| Home Mortgage Disclosure Act Aggregated Statistics For Year 2009 (Based on 176 full tracts) | ||||||||||||||
| A) FHA, FSA/RHS & VA Home Purchase Loans | B) Conventional Home Purchase Loans | C) Refinancings | D) Home Improvement Loans | E) Loans on Dwellings For 5+ Families | F) Non-occupant Loans on < 5 Family Dwellings (A B C & D) | G) Loans On Manufactured Home Dwelling (A B C & D) | ||||||||
|---|---|---|---|---|---|---|---|---|---|---|---|---|---|---|
| Number | Average Value | Number | Average Value | Number | Average Value | Number | Average Value | Number | Average Value | Number | Average Value | Number | Average Value | |
| LOANS ORIGINATED | 372 | $545,978 | 4,613 | $540,330 | 16,501 | $432,617 | 761 | $313,781 | 186 | $2,158,774 | 1,732 | $431,472 | 4 | $475,500 |
| APPLICATIONS APPROVED, NOT ACCEPTED | 30 | $513,067 | 581 | $521,165 | 2,030 | $444,153 | 62 | $233,742 | 4 | $1,493,000 | 203 | $433,232 | 0 | $0 |
| APPLICATIONS DENIED | 99 | $514,404 | 950 | $506,145 | 5,075 | $489,940 | 328 | $240,372 | 35 | $1,119,200 | 700 | $411,860 | 2 | $107,000 |
| APPLICATIONS WITHDRAWN | 92 | $475,707 | 697 | $528,319 | 2,979 | $464,153 | 200 | $258,340 | 17 | $5,964,235 | 374 | $402,091 | 2 | $394,500 |
| FILES CLOSED FOR INCOMPLETENESS | 17 | $496,647 | 171 | $443,234 | 834 | $453,836 | 63 | $198,746 | 5 | $1,355,200 | 92 | $415,576 | 0 | $0 |
| Private Mortgage Insurance Companies Aggregated Statistics For Year 2009 (Based on 112 full tracts) | ||||||||
| A) Conventional Home Purchase Loans | B) Refinancings | C) Non-occupant Loans on < 5 Family Dwellings (A & B) | D) Loans On Manufactured Home Dwelling (A & B) | |||||
|---|---|---|---|---|---|---|---|---|
| Number | Average Value | Number | Average Value | Number | Average Value | Number | Average Value | |
| LOANS ORIGINATED | 131 | $463,344 | 22 | $469,318 | 2 | $321,500 | 0 | $0 |
| APPLICATIONS APPROVED, NOT ACCEPTED | 77 | $520,727 | 24 | $534,417 | 4 | $368,250 | 0 | $0 |
| APPLICATIONS DENIED | 55 | $501,691 | 25 | $486,720 | 1 | $400,000 | 0 | $0 |
| APPLICATIONS WITHDRAWN | 22 | $327,182 | 17 | $495,059 | 0 | $0 | 3 | $91,667 |
| FILES CLOSED FOR INCOMPLETENESS | 9 | $714,667 | 1 | $514,000 | 2 | $417,000 | 0 | $0 |
| Most common first names in San Francisco County, CA among deceased individuals | ||
| Name | Count | Lived (average) |
|---|---|---|
| John | 6,348 | 72.1 years |
| William | 4,583 | 72.1 years |
| Mary | 4,498 | 80.5 years |
| James | 3,727 | 68.8 years |
| Robert | 3,451 | 66.9 years |
| George | 3,262 | 75.0 years |
| Joseph | 3,118 | 73.8 years |
| Charles | 2,671 | 72.0 years |
| Frank | 2,417 | 75.1 years |
| Helen | 2,100 | 79.5 years |
| Most common last names in San Francisco County, CA among deceased individuals | ||
| Last name | Count | Lived (average) |
|---|---|---|
| Wong | 2,350 | 77.1 years |
| Lee | 2,230 | 76.4 years |
| Smith | 1,608 | 72.2 years |
| Johnson | 1,509 | 72.1 years |
| Williams | 1,132 | 71.2 years |
| Chan | 928 | 77.6 years |
| Brown | 913 | 71.6 years |
| Jones | 903 | 71.1 years |
| Davis | 746 | 71.4 years |
| Miller | 740 | 72.9 years |
| Businesses in San Francisco County, CA | ||||
| Name | Count | Name | Count | |
|---|---|---|---|---|
| 24 Hour Fitness | 11 | Knights Inn | 1 | |
| 7-Eleven | 12 | Kroger | 3 | |
| ALDO | 6 | Lane Bryant | 1 | |
| AT&T | 11 | Lane Furniture | 1 | |
| Abercrombie & Fitch | 1 | LensCrafters | 3 | |
| Abercrombie Kids | 1 | Levi Strauss & Co. | 3 | |
| Ace Hardware | 12 | Little Caesars Pizza | 1 | |
| Aeropostale | 1 | Lowe's | 1 | |
| Aerosoles | 2 | Macy's | 2 | |
| American Eagle Outfitters | 2 | Marriott | 8 | |
| Ann Taylor | 3 | Marshalls | 1 | |
| Apple Store | 3 | MasterBrand Cabinets | 29 | |
| Arby's | 1 | Mazda | 1 | |
| Audi | 1 | McDonald's | 19 | |
| BMW | 1 | Men's Wearhouse | 1 | |
| Bakers | 1 | Motel 6 | 1 | |
| Bally Total Fitness | 1 | Motherhood Maternity | 3 | |
| Banana Republic | 5 | New Balance | 16 | |
| Baskin-Robbins | 1 | Nike | 42 | |
| Bath & Body Works | 2 | Nissan | 1 | |
| Bebe | 3 | Nordstrom | 3 | |
| Bed Bath & Beyond | 1 | Office Depot | 3 | |
| Ben & Jerry's | 4 | OfficeMax | 2 | |
| Bentleymotors.Com | 1 | Old Navy | 1 | |
| Best Western | 5 | Olive Garden | 1 | |
| Big O Tires | 2 | Pac Sun | 1 | |
| Blockbuster | 5 | Panda Express | 3 | |
| Brooks Brothers | 2 | Panera Bread | 1 | |
| Brookstone | 2 | Papa John's Pizza | 1 | |
| Budget Car Rental | 3 | Payless | 7 | |
| Burger King | 12 | Penske | 1 | |
| CVS | 2 | Pier 1 Imports | 2 | |
| Cache | 1 | Pizza Hut | 3 | |
| Carl\s Jr. | 2 | Popeyes | 4 | |
| Chico's | 3 | Pottery Barn | 2 | |
| Chipotle | 3 | Quiznos | 7 | |
| Clarks | 1 | RadioShack | 18 | |
| Cold Stone Creamery | 2 | Ramada | 1 | |
| Comfort Inn | 1 | Rodeway Inn | 2 | |
| Costco | 1 | Ryder Rental & Truck Leasing | 1 | |
| Crate & Barrel | 1 | SAS Shoes | 5 | |
| Curves | 3 | Safeway | 15 | |
| DHL | 25 | Saks Fifth Avenue | 2 | |
| Days Inn | 3 | Sephora | 3 | |
| Decora Cabinetry | 2 | Sheraton | 1 | |
| Dennys | 2 | Skechers USA | 2 | |
| Domino's Pizza | 5 | Sprint Nextel | 9 | |
| DressBarn | 1 | Staples | 2 | |
| Dressbarn | 1 | Starbucks | 78 | |
| Eddie Bauer | 2 | Subway | 39 | |
| Express | 2 | Super 8 | 2 | |
| FedEx | 136 | T-Mobile | 30 | |
| Firestone Complete Auto Care | 3 | T.J.Maxx | 1 | |
| Foot Locker | 4 | Taco Bell | 10 | |
| Forever 21 | 2 | Talbots | 1 | |
| Fredericks Of Hollywood | 1 | The Cheesecake Factory | 1 | |
| GNC | 10 | The Room Place | 1 | |
| GameStop | 5 | Torrid | 1 | |
| Gap | 9 | Toyota | 1 | |
| Gymboree | 3 | Toys"R"Us | 1 | |
| H&M | 2 | Trader Joe's | 4 | |
| H&R Block | 16 | Travelodge | 4 | |
| Haagen-Dazs | 2 | True Value | 8 | |
| Haworth | 2 | U-Haul | 8 | |
| Hilton | 3 | UPS | 110 | |
| Holiday Inn | 6 | Urban Outfitters | 2 | |
| Hollister Co. | 1 | Vans | 18 | |
| Honda | 1 | Verizon Wireless | 7 | |
| Hot Topic | 1 | Victoria's Secret | 5 | |
| Hyatt | 3 | Volkswagen | 1 | |
| IHOP | 2 | Vons | 15 | |
| J. Jill | 1 | Walgreens | 29 | |
| J.Crew | 2 | Westin | 2 | |
| Jamba Juice | 8 | Wet Seal | 2 | |
| JoS. A. Bank | 2 | Whole Foods Market | 4 | |
| Johnny Rockets | 2 | World Gym | 1 | |
| Jones New York | 10 | YMCA | 11 | |
| KFC | 10 | Z Gallerie | 1 | |
San Francisco County on our top lists:
- #1 on the list of "Top 101 counties with the lowest average weight of females"
- #2 on the list of "Top 101 counties with the highest percentage of residents that drank alcohol in the past 30 days"
- #12 on the list of "Top 101 counties with highest percentage of residents voting for Obama (Democrat) in the 2012 Presidential Election (pop. 50,000+)"
- #14 on the list of "Top 101 counties with the lowest lead air pollution readings in 2012 (µg/m3)"
- #16 on the list of "Top 101 counties with the largest decrease in the number of deaths per 1000 residents 2000-2006 to 2007-2013 (pop. 50,000+)"
- #17 on the list of "Top 101 counties with highest percentage of residents voting for 3rd party candidates in the 2012 Presidential Election (pop. 50,000+)"
- #19 on the list of "Top 101 counties with the most Orthodox adherents"
- #19 on the list of "Top 101 counties with the most Orthodox adherents (pop. 50,000+)"
- #20 on the list of "Top 101 counties with highest percentage of residents voting for Obama (Democrat) in the 2012 Presidential Election"
- #20 on the list of "Top 101 counties with the lowest Ozone (1-hour) air pollution readings in 2012 (ppm)"
- #23 on the list of "Top 101 counties with the highest lead air pollution readings in 2012 (µg/m3)"
- #25 on the list of "Top 101 counties with the highest percentage of residents that exercised in the past month"
- #26 on the list of "Top 101 counties with the most Orthodox congregations (pop. 50,000+)"
- #26 on the list of "Top 101 counties with the most Orthodox congregations"
- #27 on the list of "Top 101 counties with the lowest number of infant deaths per 1000 residents 2007-2013 (pop. 50,000+)"
- #28 on the list of "Top 101 counties with the highest Nitrogen Dioxide air pollution readings in 2012 (ppm)"
- #43 on the list of "Top 101 counties with the lowest percentage of residents that smoked 100+ cigarettes in their lives"
- #47 on the list of "Top 101 counties with the most Other congregations (pop. 50,000+)"
- #49 on the list of "Top 101 counties with the most Other congregations"
- #52 on the list of "Top 101 counties with the largest increase in the number of infant deaths per 1000 residents 2000-2006 to 2007-2013 (pop. 50,000+)"