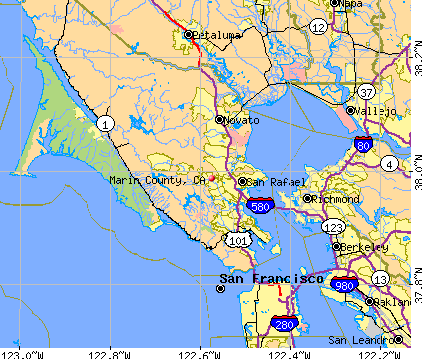
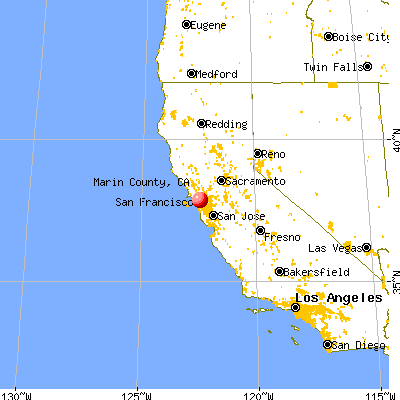
Marin County, California (CA)
County owner-occupied free and clear houses and condos in 2010: 16,183
County owner-occupied houses and condos in 2000: 64,018
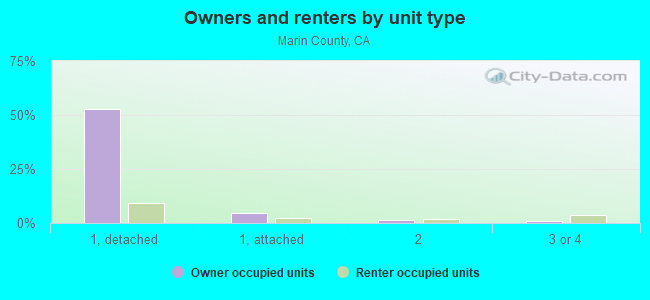
Renter-occupied apartments: 38,573 (it was 36,632 in 2000)
| % of renters here: | 36% |
| State: | 44% |
Land area: 520 sq. mi.
Water area: 308.4 sq. mi.
Population density: 493 people per square mile (high).
Industries providing employment: Professional, scientific, management, administrative, and waste management services (23.1%), Educational, health and social services (21.6%).
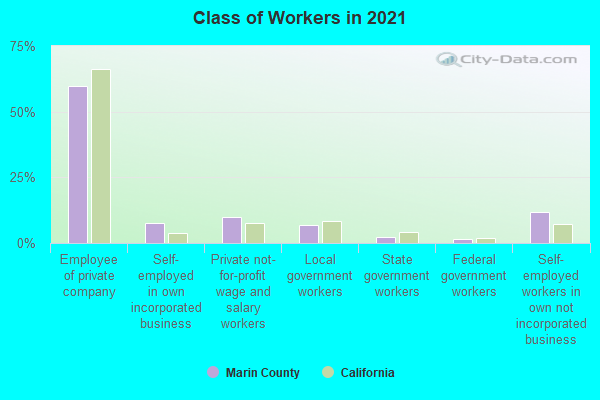
Type of workers:
- Private wage or salary: 76%
- Government: 10%
- Self-employed, not incorporated: 13%
- Unpaid family work: 0%
- OSM Map
- General Map
- Google Map
- MSN Map

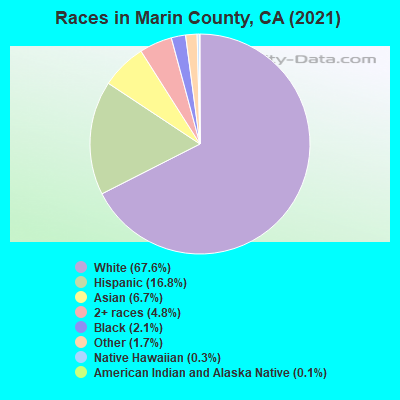
- 171,49667.0%White Non-Hispanic Alone
- 43,80117.1%Hispanic or Latino
- 17,4186.8%Asian alone
- 13,8625.4%Two or more races
- 6,2722.4%Black Non-Hispanic Alone
- 2,5331.0%Some other race alone
- 3500.1%American Indian and Alaska Native alone
- 2860.1%Native Hawaiian and Other
Pacific Islander alone
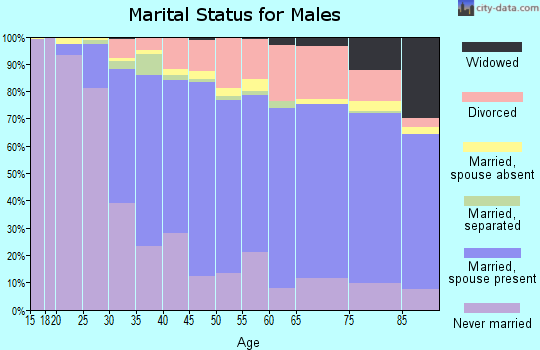
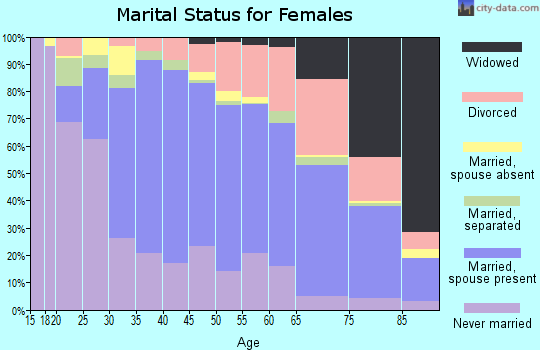
| Median resident age: | 47.9 years |
| California median age: | 37.9 years |
| Males: 124,273 | |
| Females: 131,745 |

 | Is Marin County very liberal? (99 replies) |
| Keep Marin County Beautiful! (13 replies) |
| Marin County Transportation (15 replies) |
| Are there any cities in other states similar to Marin County, Newport Beach, Laguna Beach, etc.? (72 replies) |
| What cities in other states are similar to Marin County, Newport Beach, Laguna Beach, etc.? (35 replies) |
| Best NorCal areas for family, criteria inside (125 replies) |
| Marin County: | 2.0 people |
| California: | 3 people |
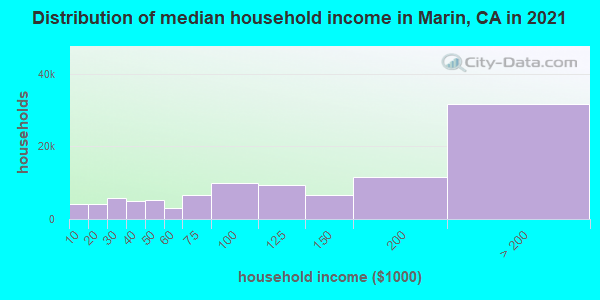
Estimated median household income in 2022: $136,214 ($71,306 in 1999)
| This county: | $136,214 |
| California: | $91,551 |
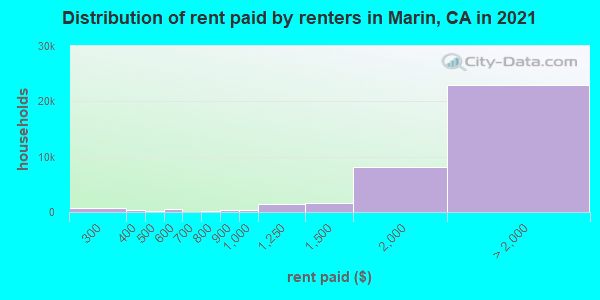
Median contract rent in 2022 for apartments: $2,257 (lower quartile is $1,644, upper quartile is $3,169)
| This county: | $2257 |
| State: | $1719 |
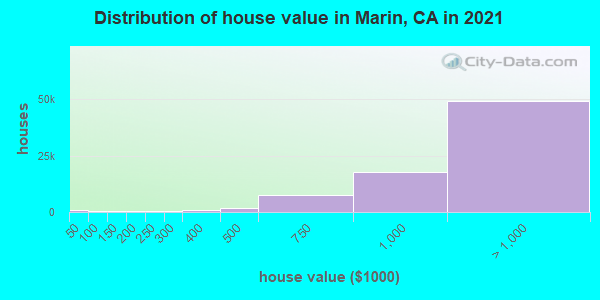
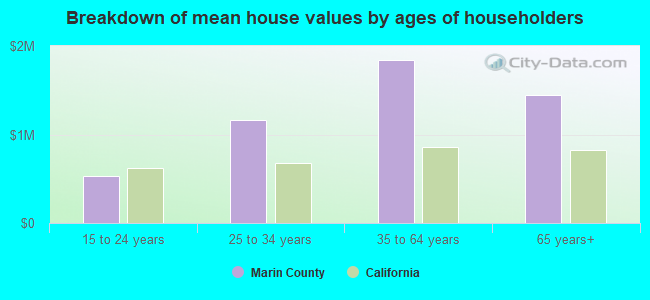
Estimated median house or condo value in 2022: $1,466,500 (it was $493,300 in 2000)
| Marin: | $1,466,500 |
| California: | $715,900 |
Mean price in 2022:
Median monthly housing costs for homes and condos with a mortgage: $4,001Detached houses: $1,964,612
Here: $1,964,612 State: $988,808 Townhouses or other attached units: $1,059,924
Here: $1,059,924 State: $838,546 In 2-unit structures: $1,850,849
Here: $1,850,849 State: $1,138,100 In 3-to-4-unit structures: $642,426
Here: $642,426 State: $824,253 In 5-or-more-unit structures: $643,765
Here: $643,765 State: $730,996 Mobile homes: $318,350
Here: $318,350 State: $184,506 Occupied boats, RVs, vans, etc.: $175,455
Here: $175,455 State: $204,957
Median monthly housing costs for units without a mortgage: $1,244
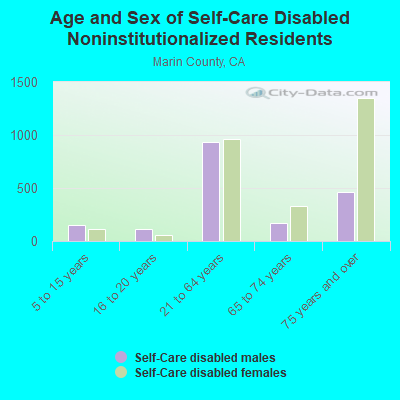
Institutionalized population: 6,299
Crime in 2020 (reported by the sheriff's office or county police, not the county total):
- Murders: 1
- Rapes: 7
- Robberies: 13
- Assaults: 69
- Burglaries: 151
- Thefts: 656
- Auto thefts: 5
Crime in 2019 (reported by the sheriff's office or county police, not the county total):
- Murders: 1
- Rapes: 5
- Robberies: 12
- Assaults: 45
- Burglaries: 143
- Thefts: 591
- Auto thefts: 4
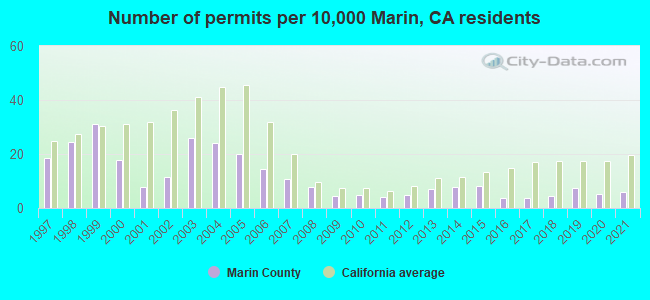
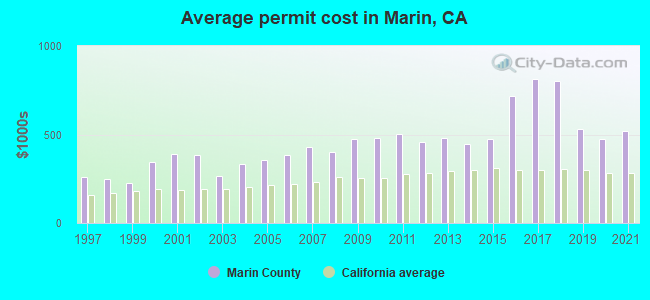
Single-family new house construction building permits:
- 2022: 285 buildings, average cost: $410,600
- 2021: 149 buildings, average cost: $517,000
- 2020: 127 buildings, average cost: $473,700
- 2019: 179 buildings, average cost: $532,900
- 2018: 108 buildings, average cost: $804,700
- 2017: 94 buildings, average cost: $813,200
- 2016: 95 buildings, average cost: $716,800
- 2015: 201 buildings, average cost: $472,700
- 2014: 194 buildings, average cost: $448,600
- 2013: 170 buildings, average cost: $479,800
- 2012: 118 buildings, average cost: $455,800
- 2011: 98 buildings, average cost: $503,700
- 2010: 121 buildings, average cost: $478,300
- 2009: 112 buildings, average cost: $474,900
- 2008: 192 buildings, average cost: $400,800
- 2007: 268 buildings, average cost: $427,100
- 2006: 356 buildings, average cost: $382,700
- 2005: 499 buildings, average cost: $356,500
- 2004: 599 buildings, average cost: $336,000
- 2003: 641 buildings, average cost: $268,300
- 2002: 281 buildings, average cost: $383,600
- 2001: 191 buildings, average cost: $391,000
- 2000: 437 buildings, average cost: $342,100
- 1999: 772 buildings, average cost: $227,300
- 1998: 606 buildings, average cost: $250,300
- 1997: 457 buildings, average cost: $261,700
Median real estate property taxes paid for housing units with mortgages in 2022: $10,001 (0.7%)
Median real estate property taxes paid for housing units with no mortgage in 2022: $7,823 (0.6%)
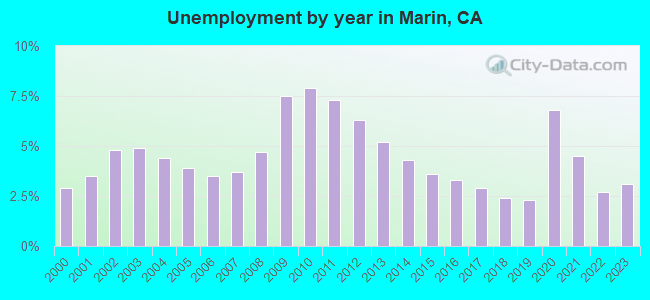
| Marin County: | 7.7% |
| California: | 12.2% |
Median age of residents in 2022: 47.9 years old
(Males: 46.9 years old, Females: 49.2 years old)
(Median age for: White residents: 54.1 years old, Black residents: 42.2 years old, American Indian residents: 50.9 years old, Asian residents: 43.0 years old, Hispanic or Latino residents: 31.1 years old, Other race residents: 31.6 years old)
Area name: San Francisco, CA HUD Metro FMR Area
Fair market rent in 2006 for a 1-bedroom apartment in Marin County is $1227 a month.
Fair market rent for a 2-bedroom apartment is $1536 a month.
Fair market rent for a 3-bedroom apartment is $2051 a month.
Cities in this county include: Ross Valley, San Rafael, Northeast Marin, Southeast Marin, Novato, Mill Valley, San Anselmo, Larkspur, Tamalpais-Homestead Valley, Northwest Marin.
| Zip code | City | Number of tests | Number of tests >= 4 pCi/L |
|---|---|---|---|
| 94901 | San Rafael | 41 | 0 |
| 94903 | San Rafael | 27 | 2 |
| 94904 | Greenbrae | 18 | 2 |
| 94920 | Belvedere Tiburon | 20 | 0 |
| 94924 | Bolinas | 3 | 0 |
| 94925 | Corte Madera | 13 | 1 |
| 94930 | Fairfax | 8 | 0 |
| 94933 | Forest Knolls | 3 | 0 |
| 94937 | Inverness | 5 | 2 |
| 94939 | Larkspur | 12 | 0 |
| 94941 | Mill Valley | 43 | 2 |
| 94942 | Mill Valley | 1 | 0 |
| 94945 | Novato | 29 | 0 |
| 94946- | Nicasio | 1 | 0 |
| 94947 | Novato | 40 | 3 |
| 94949 | Novato | 17 | 0 |
| 94950 | Olema | 1 | 0 |
| 94956 | Point Reyes Station | 3 | 0 |
| 94957 | Ross | 3 | 0 |
| 94960 | San Anselmo | 15 | 0 |
| 94965 | Sausalito | 28 | 0 |
| 94970 | Stinson Beach | 1 | 0 |
| 94973 | Woodacre | 1 | 0 |
| 94979 | San Anselmo | 1 | 0 |
2023 air pollution in Marin County:
Carbon Monoxide: 0.264 ppm (standard limit: 9 ppm). Near U.S. average.
Nitrogen Dioxide: 0.00 ppm (standard limit: 0.053 ppm). Below U.S. average.
Ozone (1-hour): 0.026 ppm (standard limit: 0.12 ppm). Below U.S. average.
Particulate Matter (PM2.5) Annual: 4.8 µg/m3(standard limit: 15.0 µg/m3). Below U.S. average.
Neighboring counties: Bollinger County, Missouri  , Kearny County, Kansas , Larue County, Kentucky , Lawrence County, Kentucky , Nelson County, Kentucky , Taylor County, Kentucky .
| Here: | 3.7% |
| California: | 5.1% |
Current college students: 14,513
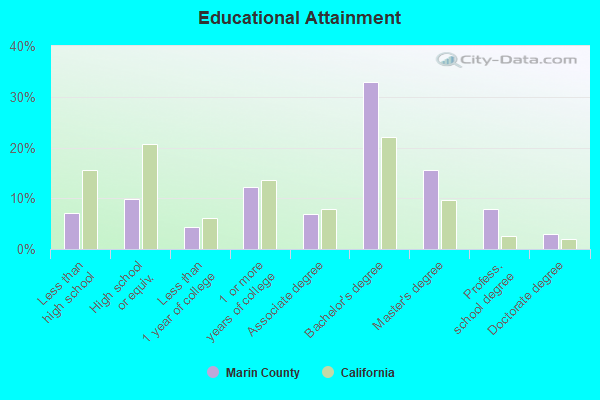
People 25 years of age or older with a high school degree or higher: 93.4%
People 25 years of age or older with a bachelor's degree or higher: 62.6%
Number of foreign born residents: 47,996 (56.4% naturalized citizens)
| Marin County: | 18.7% |
| Whole state: | 26.7% |
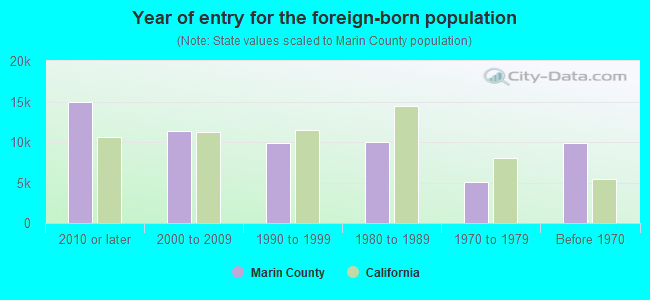
- Year of entry for the foreign-born population
- 13,5802010 or later
- 10,0422000 to 2009
- 8,5031990 to 1999
- 9,9981980 to 1989
- 5,0911970 to 1979
- 9,898Before 1970
Mean travel time to work (commute): minutes
Percentage of county residents living and working in this county: 99.9%
Housing units in structures:
- One, detached: 71,019
- One, attached: 8,926
- Two: 4,252
- 3 or 4: 6,246
- 5 to 9: 4,907
- 10 to 19: 4,610
- 20 to 49: 5,162
- 50 or more: 5,247
- Mobile homes: 1,457
- Boats, RVs, vans, etc.: 143
Housing units in Marin County with a mortgage: 44,861 (7,725 second mortgage, 253 home equity loan, 6,636 both second mortgage and home equity loan)
Houses without a mortgage: 969
| Here: | 4.3% with mortgage |
| State: | 98.6% with mortgage |
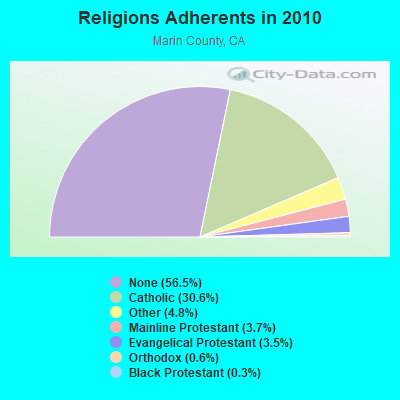
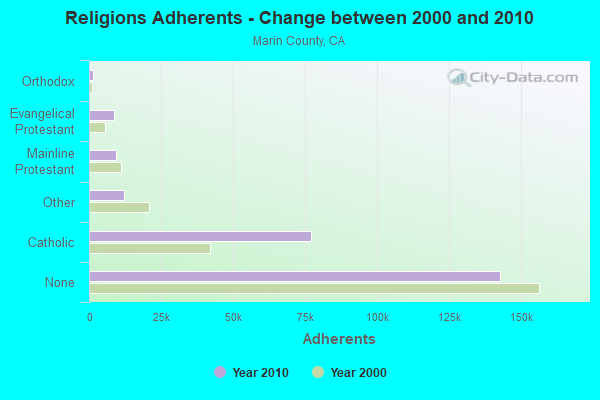
Religion statistics for Marin County
| Religion | Adherents | Congregations |
|---|---|---|
| Catholic | 77,114 | 30 |
| Other | 12,119 | 50 |
| Mainline Protestant | 9,458 | 48 |
| Evangelical Protestant | 8,817 | 71 |
| Orthodox | 1,525 | 3 |
| Black Protestant | 775 | 2 |
| None | 142,601 | - |
Source: Clifford Grammich, Kirk Hadaway, Richard Houseal, Dale E.Jones, Alexei Krindatch, Richie Stanley and Richard H.Taylor. 2012. 2010 U.S.Religion Census: Religious Congregations & Membership Study. Association of Statisticians of American Religious Bodies. Jones, Dale E., et al. 2002. Congregations and Membership in the United States 2000. Nashville, TN: Glenmary Research Center.
Food Environment Statistics:
| Marin County: | 2.59 / 10,000 pop. |
| State: | 2.14 / 10,000 pop. |
| Here: | 0.04 / 10,000 pop. |
| California: | 0.04 / 10,000 pop. |
| This county: | 0.61 / 10,000 pop. |
| California: | 0.62 / 10,000 pop. |
| Marin County: | 1.30 / 10,000 pop. |
| California: | 1.49 / 10,000 pop. |
| This county: | 11.95 / 10,000 pop. |
| State: | 7.42 / 10,000 pop. |
| Marin County: | 7.0% |
| California: | 7.3% |
| Marin County: | 17.1% |
| State: | 21.3% |
| Here: | 17.1% |
| State: | 17.9% |
Agriculture in Marin County:
Average size of farms: 593 acresAverage value of agricultural products sold per farm: $169,396
Average value of crops sold per acre for harvested cropland: $1176.10
The value of nursery, greenhouse, floriculture, and sod as a percentage of the total market value of agricultural products sold: 10.66%
The value of livestock, poultry, and their products as a percentage of the total market value of agricultural products sold: 84.40%
Average total farm production expenses per farm: $139,596
Harvested cropland as a percentage of land in farms: 3.79%
Irrigated harvested cropland as a percentage of land in farms: 19.21%
Average market value of all machinery and equipment per farm: $52,525
The percentage of farms operated by a family or individual: 71.65%
Average age of principal farm operators: 58 years
Average number of cattle and calves per 100 acres of all land in farms: 23.51
Milk cows as a percentage of all cattle and calves: 29.11%
Vegetables: 88 harvested acres
Land in orchards: 288 acres
Earthquake activity:
Marin County-area historical earthquake activity is significantly above California state average. It is 7328% greater than the overall U.S. average.On 4/18/1906 at 13:12:21, a magnitude 7.9 (7.9 UK, Class: Major, Intensity: VIII - XII) earthquake occurred 23.1 miles away from Marin County center, causing $524,000,000 total damage
On 10/18/1989 at 00:04:15, a magnitude 7.1 (6.5 MB, 7.1 MS, 6.9 MW, 7.0 ML) earthquake occurred 75.0 miles away from the county center, causing 62 deaths (62 shaking deaths) and 3757 injuries, causing $1,305,032,704 total damage
On 1/31/1922 at 13:17:28, a magnitude 7.6 (7.6 UK) earthquake occurred 246.1 miles away from the county center
On 11/4/1927 at 13:51:53, a magnitude 7.5 (7.5 UK) earthquake occurred 229.1 miles away from the county center
On 7/21/1952 at 11:52:14, a magnitude 7.7 (7.7 UK) earthquake occurred 286.6 miles away from Marin County center, causing $50,000,000 total damage
On 4/25/1992 at 18:06:04, a magnitude 7.2 (6.3 MB, 7.1 MS, 7.2 MW, 7.1 MW, Depth: 9.4 mi) earthquake occurred 182.0 miles away from the county center, causing $75,000,000 total damage
Magnitude types: body-wave magnitude (MB), local magnitude (ML), surface-wave magnitude (MS), moment magnitude (MW)
Most recent natural disasters:
- California Covid-19 Pandemic, Incident Period: January 20, 2020, FEMA Id: 4482, Natural disaster type: Other
- California Severe Winter Storms, Flooding, Landslides, And Mudslides, Incident Period: February 24, 2019 - March 1, 2019, FEMA Id: 4434, Natural disaster type: Winter Storm, Mudslide, Landslide, Flood
- California Severe Winter Storms, Flooding, Landslides, And Mudslides, Incident Period: February 13, 2019 - February 15, 2019, FEMA Id: 4431, Natural disaster type: Winter Storm, Mudslide, Landslide, Flood
- California Severe Winter Storms, Flooding, Mudslides, Incident Period: February 1, 2017 - February 23, 2017, FEMA Id: 4308, Natural disaster type: Winter Storm, Mudslide, Flood
- California Severe Winter Storms, Flooding, And Mudslides, Incident Period: January 3, 2017 - January 12, 2017, FEMA Id: 4301, Natural disaster type: Winter Storm, Mudslide, Flood
- California Severe Storms, Flooding, Landslides, and Mudslides, Incident Period: March 29, 2006 to April 16, 2006, Major Disaster (Presidential) Declared DR-1646: June 05, 2006, FEMA Id: 1646, Natural disaster type: Storm, Mudslide, Landslide, Flood
- California Severe Storms, Flooding, Mudslides, and Landslides, Incident Period: December 17, 2005 to January 03, 2006, Major Disaster (Presidential) Declared DR-1628: February 03, 2006, FEMA Id: 1628, Natural disaster type: Storm, Mudslide, Landslide, Flood
- California Hurricane Katrina Evacuation, Incident Period: August 29, 2005 to October 01, 2005, Emergency Declared EM-3248: September 13, 2005, FEMA Id: 3248, Natural disaster type: Hurricane
- California Severe Winter Storms and Flooding, Incident Period: February 02, 1998 to April 30, 1998, Major Disaster (Presidential) Declared DR-1203: February 09, 1998, FEMA Id: 1203, Natural disaster type: Winter Storm, Flood
- California Severe Storms/Flooding, Incident Period: December 28, 1996 to April 01, 1997, Major Disaster (Presidential) Declared DR-1155: January 04, 1997, FEMA Id: 1155, Natural disaster type: Storm, Flood
- 12 other natural disasters have been reported since 1953.
The number of natural disasters in Marin County (22) is greater than the US average (15).
Major Disasters (Presidential) Declared: 15
Emergencies Declared: 2
Causes of natural disasters: Floods: 17, Storms: 9, Mudslides: 7, Winter Storms: 7, Landslides: 6, Drought: 1, Earthquake: 1, Freeze: 1, Heavy Rain: 1, Hurricane: 1, Tornado: 1, Other: 1 (Note: some incidents may be assigned to more than one category).
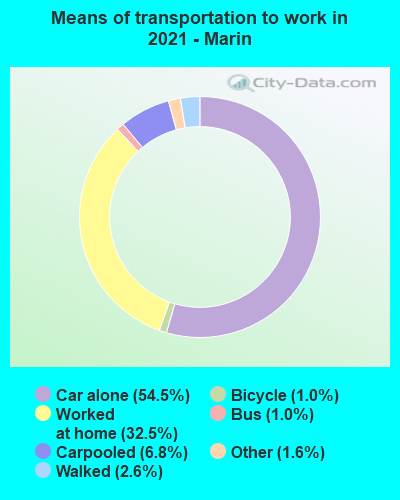
Means of transportation to work:
- Drove a car alone: 69,078 (52.9%)
- Carpooled: 9,755 (7.5%)
- Bus: 2,504 (1.9%)
- Subway or elevated rail: 52 (0.0%)
- Long-distance train or commuter rail: 637 (0.5%)
- Taxicab, motorcycle, or other means: 2,301 (1.8%)
- Bicycle: 1,851 (1.4%)
- Walked: 4,383 (3.4%)
- Worked at home: 40,124 (30.7%)
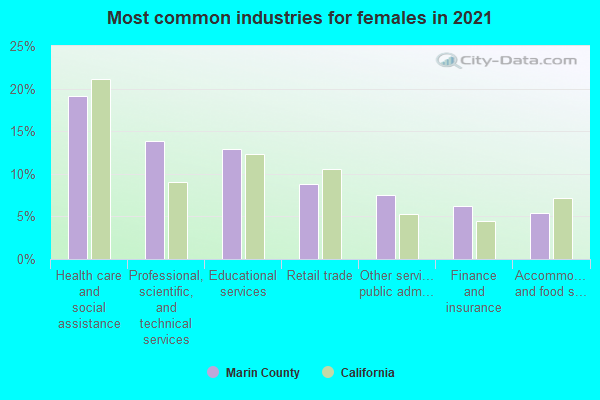
- Professional, scientific, and technical services (17%)
- Health care and social assistance (17%)
- Educational services (11%)
- Other services, except public administration (9%)
- Retail trade (6%)
- Accommodation and food services (5%)
- Administrative and support and waste management services (4%)
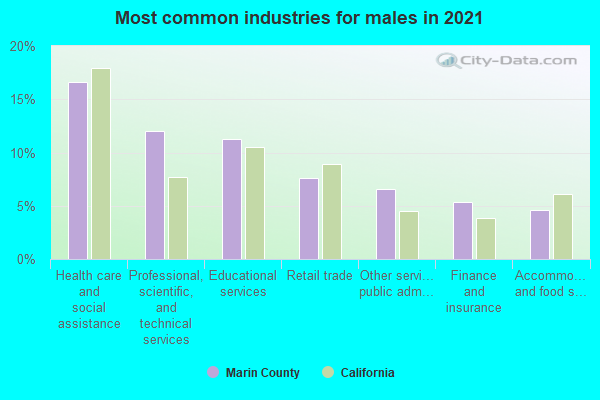
- Professional, scientific, and technical services (18%)
- Health care and social assistance (18%)
- Educational services (12%)
- Other services, except public administration (10%)
- Retail trade (7%)
- Accommodation and food services (6%)
- Administrative and support and waste management services (4%)
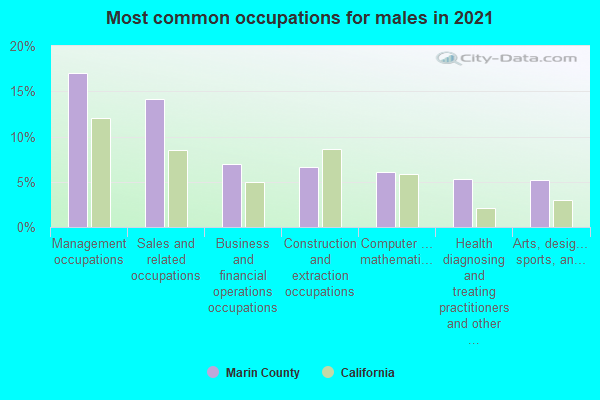
- Management occupations (22%)
- Sales and related occupations (10%)
- Business and financial operations occupations (9%)
- Construction and extraction occupations (8%)
- Arts, design, entertainment, sports, and media occupations (6%)
- Computer and mathematical occupations (6%)
- Educational instruction, and library occupations (5%)
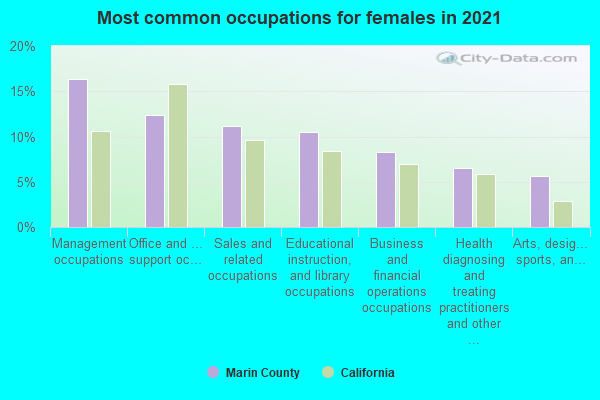
- Management occupations (21%)
- Office and administrative support occupations (13%)
- Business and financial operations occupations (9%)
- Educational instruction, and library occupations (8%)
- Personal care and service occupations (7%)
- Health diagnosing and treating practitioners and other technical occupations (7%)
- Sales and related occupations (7%)
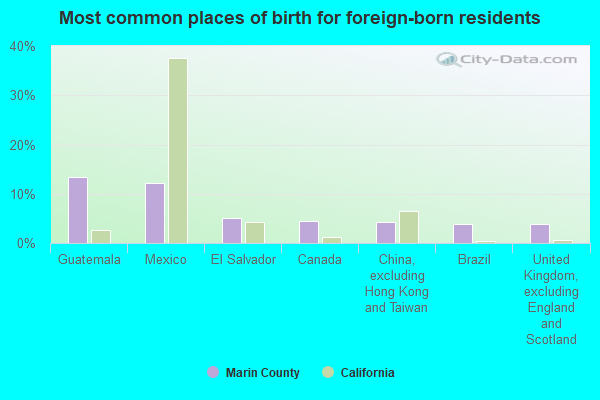
- Guatemala (13%)
- Mexico (13%)
- Canada (4%)
- El Salvador (4%)
- China, excluding Hong Kong and Taiwan (4%)
- United Kingdom, excluding England and Scotland (4%)
- Brazil (4%)
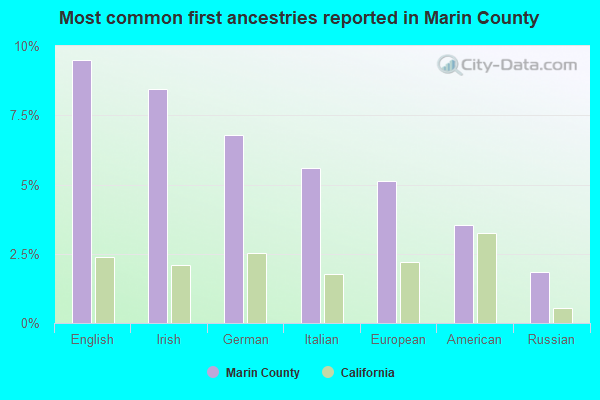
- English (9%)
- Irish (7%)
- German (6%)
- Italian (6%)
- European (5%)
- American (4%)
- French (except Basque) (2%)
People in group quarters in Marin County, California in 2010:
- 4,854 people in state prisons
- 1,019 people in nursing facilities/skilled-nursing facilities
- 855 people in college/university student housing
- 615 people in other noninstitutional facilities
- 570 people in group homes intended for adults
- 266 people in workers' group living quarters and job corps centers
- 259 people in local jails and other municipal confinement facilities
- 217 people in residential treatment centers for adults
- 216 people in emergency and transitional shelters (with sleeping facilities) for people experiencing homelessness
- 81 people in residential treatment centers for juveniles (non-correctional)
- 46 people in in-patient hospice facilities
- 26 people in correctional facilities intended for juveniles
- 12 people in group homes for juveniles (non-correctional)
- 6 people in maritime/merchant vessels
- 2 people in correctional residential facilities
People in group quarters in Marin County, California in 2000:
- 6,212 people in state prisons
- 1,704 people in nursing homes
- 724 people in other noninstitutional group quarters
- 609 people in college dormitories (includes college quarters off campus)
- 451 people in other workers' dormitories
- 424 people in homes for the mentally retarded
- 293 people in local jails and other confinement facilities (including police lockups)
- 257 people in religious group quarters
- 221 people in homes for the mentally ill
- 173 people in other group homes
- 91 people in homes or halfway houses for drug/alcohol abuse
- 78 people in mental (psychiatric) hospitals or wards
- 78 people in unknown juvenile institutions
- 33 people in hospitals or wards for drug/alcohol abuse
- 31 people in short-term care, detention or diagnostic centers for delinquent children
- 25 people in other nonhousehold living situations
- 22 people in agriculture workers' dormitories on farms
- 18 people in other types of correctional institutions
- 16 people in military barracks, etc.
- 7 people in wards in general hospitals for patients who have no usual home elsewhere
- 6 people in schools, hospitals, or wards for the intellectually disabled
- 6 people in residential treatment centers for emotionally disturbed children
- 6 people in homes for the physically handicapped
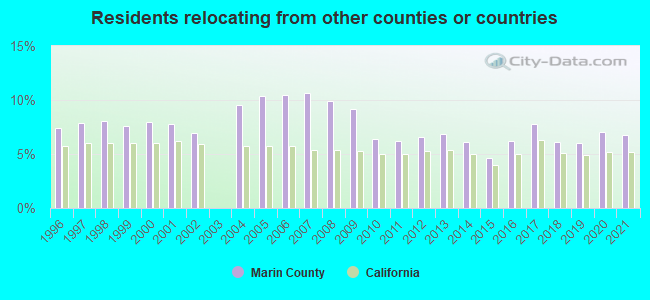
6.74% of this county's 2021 resident taxpayers lived in other counties in 2020 ($226,484 average adjusted gross income)
| Here: | 6.74% |
| California average: | 5.19% |
10 or fewer of this county's residents moved from foreign countries.
5.35% relocated from other counties in California ($194,548 average AGI)
1.39% relocated from other states ($31,936 average AGI)
Marin County: 1.39% California average: 1.56%
Top counties from which taxpayers relocated into this county between 2020 and 2021:
| from San Francisco County, CA | |
| from Sonoma County, CA | |
| from Alameda County, CA | |
| from Contra Costa County, CA | |
| from Los Angeles County, CA | |
| from San Mateo County, CA | |
| from Santa Clara County, CA |
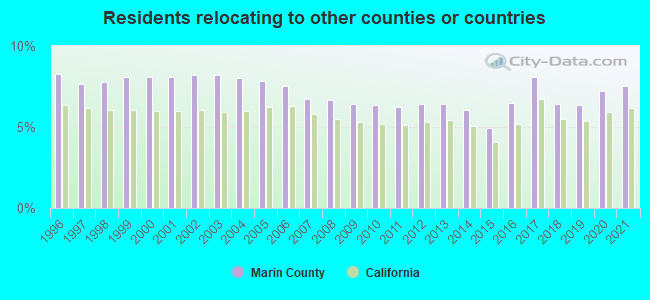
7.55% of this county's 2020 resident taxpayers moved to other counties in 2021 ($173,763 average adjusted gross income)
| Here: | 7.55% |
| California average: | 6.14% |
10 or fewer of this county's residents moved to foreign countries.
4.87% relocated to other counties in California ($92,506 average AGI)
2.68% relocated to other states ($81,256 average AGI)
Marin County: 2.68% California average: 2.55%
Top counties to which taxpayers relocated from this county between 2020 and 2021:
| to Sonoma County, CA | |
| to San Francisco County, CA | |
| to Contra Costa County, CA | |
| to Alameda County, CA | |
| to Los Angeles County, CA | |
| to Solano County, CA | |
| to San Diego County, CA |
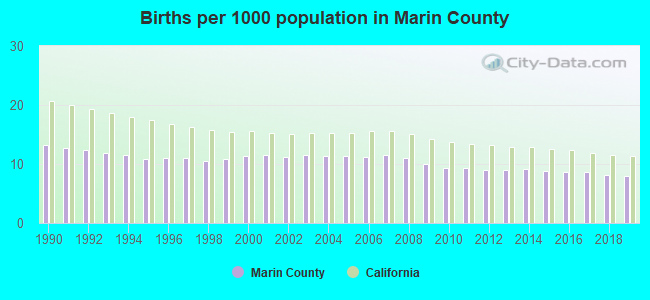
Births per 1000 population from 1990 to 1999: 11.6
Births per 1000 population from 2000 to 2009: 11.2
Births per 1000 population from 2010 to 2022: 7.4
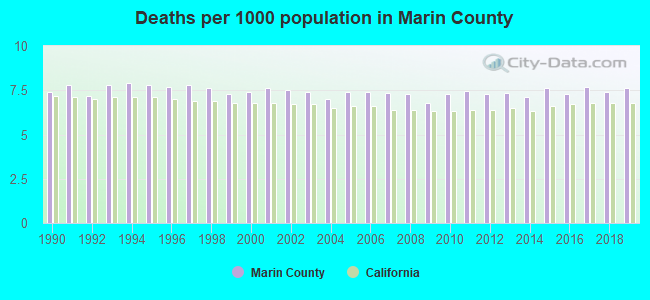
Deaths per 1000 population from 1990 to 1999: 7.6
Deaths per 1000 population from 2000 to 2009: 7.3
Deaths per 1000 population from 2010 to 2020: 7.5
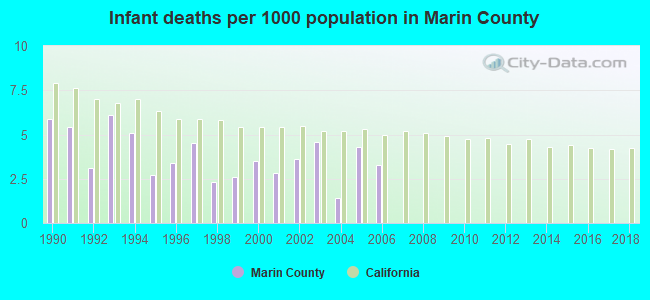
Infant deaths per 1000 live births from 1990 to 1999: 4.1
Infant deaths per 1000 live births from 2000 to 2006: 3.4
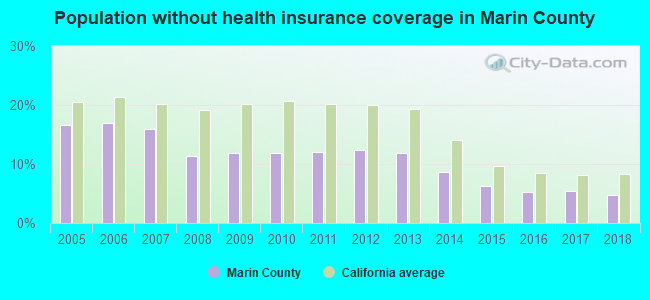
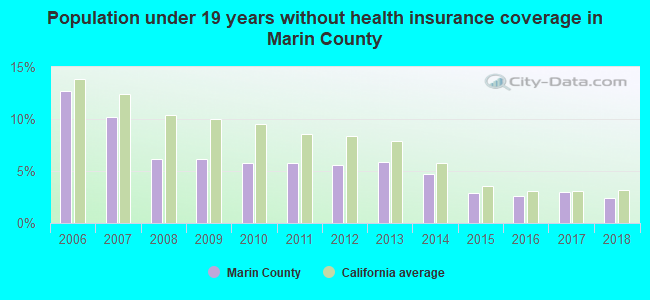
Persons under 19 years old without health insurance coverage in 2018: 2.4%
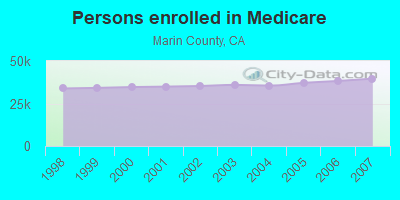
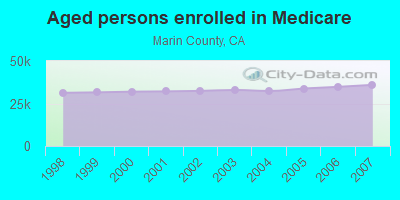
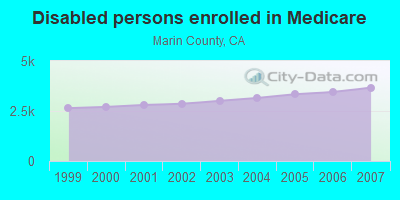
Persons enrolled in hospital insurance and/or supplemental medical insurance (Medicare) in July 1, 2007: 39,629 (35,957 aged, 3,672 disabled)
Children under 18 without health insurance coverage in 2007: 4,842 (10%)
Most common underlying causes of death in Marin County, California in 1999 - 2019:
- Atherosclerotic heart disease (2,419)
- Alzheimer disease, unspecified (2,214)
- Bronchus or lung, unspecified - Malignant neoplasms (2,090)
- Acute myocardial infarction, unspecified (1,471)
- Atherosclerotic cardiovascular disease, so described (1,367)
- Stroke, not specified as haemorrhage or infarction (1,206)
- Chronic obstructive pulmonary disease, unspecified (1,186)
- Pneumonia, unspecified (858)
- Breast, unspecified - Malignant neoplasms (848)
- Unspecified dementia (768)
Population without health insurance coverage in 2000: 10%
Children under 18 without health insurance coverage in 2000: 8%
Homicides per 1,000,000 population from 2000 to 2006: 17.5. This is less than state average.
Suicides per 1,000,000 population from 2000 to 2006: 133.2. This is less than state average.
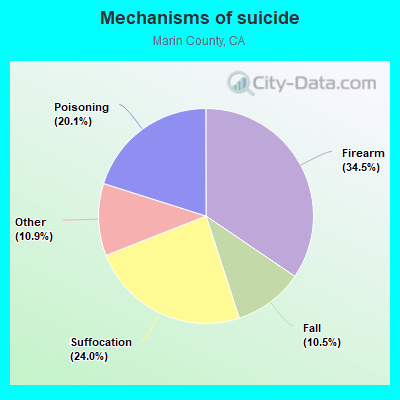
- Firearm - 46.0
- Suffocation - 32.0
- Poisoning - 26.8
- Fall - 14.0
- Other - 14.5
Household type by relationship:
Households: 256,018- Male householders: 48,051 (10,992 living alone), Female householders: 55,234 (21,230 living alone)
52,304 spouses (51,815 opposite-sex spouses), 5,654 unmarried partners, (5,467 opposite-sex unmarried partners), 63,510 children (60,349 natural, 2,438 adopted, 723 stepchildren), 1,872 grandchildren, 3,815 brothers or sisters, 2,991 parents, 100 foster children, 4,711 other relatives, 10,619 non-relatives
- In group quarters: 7,157
Size of family households: 29,918 2-persons, 16,353 3-persons, 13,247 4-persons, 3,709 5-persons, 1,238 6-persons, 299 7-or-more-persons.
Size of nonfamily households: 32,222 1-person, 5,171 2-persons, 755 3-persons, 284 4-persons, 31 5-persons, 58 7-or-more-persons.
36,410 married couples with children.
8,996 single-parent households (2,916 men, 6,080 women).
78.7% of residents of Marin speak English at home.
11.2% of residents speak Spanish at home (53% speak English very well, 19% speak English well, 19% speak English not well, 9% don't speak English at all).
5.7% of residents speak other Indo-European language at home (79% speak English very well, 14% speak English well, 6% speak English not well, 1% don't speak English at all).
3.4% of residents speak Asian or Pacific Island language at home (51% speak English very well, 27% speak English well, 15% speak English not well, 6% don't speak English at all).
1.2% of residents speak other language at home (51% speak English very well, 45% speak English well, 5% speak English not well).
In fiscal year 2004:
Federal Government expenditure: $1,269,972,000 ($5,162 per capita)
Department of Defense expenditure: $47,925,000
Federal direct payments to individuals for retirement and disability: $576,754,000
Federal other direct payments to individuals: $286,717,000
Federal direct payments not to individuals: $2,404,000
Federal grants: $278,842,000
Federal procurement contracts: $51,502,000 ($9,576,000 Department of Defense)
Federal salaries and wages: $73,751,000 ($5,752,000 Department of Defense)
Federal Government direct loans: $3,386,000
Federal guaranteed/insured loans: $24,075,000
Federal Government insurance: $1,376,379,000
Population change from April 1, 2000 to July 1, 2005:
Births: 14,643| Here: | 59 per 1000 residents |
| State: | 77 per 1000 residents |
Deaths: 9,625
| Here: | 39 per 1000 residents |
| State: | 34 per 1000 residents |
Net international migration: +7,681
| Here: | +31 per 1000 residents |
| State: | +39 per 1000 residents |
Net internal migration: -12,768
| Here: | |
| State: |
Total withdrawal of fresh water for public supply: 37.69 millions of gallons per day (41% from ground, 59% from surface)
| Here: | 6.4 |
| State: | 6.0 |
| Here: | 3.6 |
| State: | 3.9 |
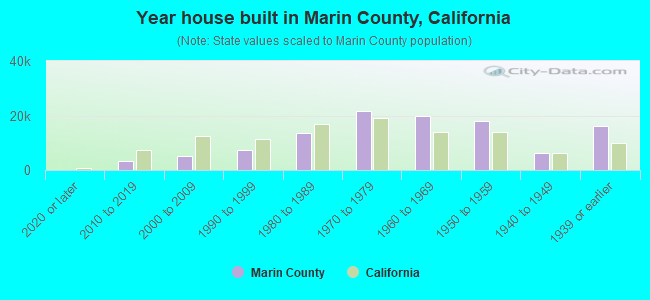
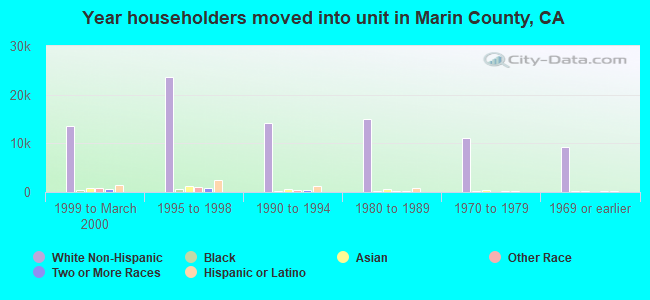
- Year house built in Marin County, California
- 4242020 or later
- 1,8292010 to 2019
- 6,1422000 to 2009
- 7,8661990 to 1999
- 10,8881980 to 1989
- 23,3981970 to 1979
- 19,6411960 to 1969
- 20,1411950 to 1959
- 7,7671940 to 1949
- 13,8731939 or earlier
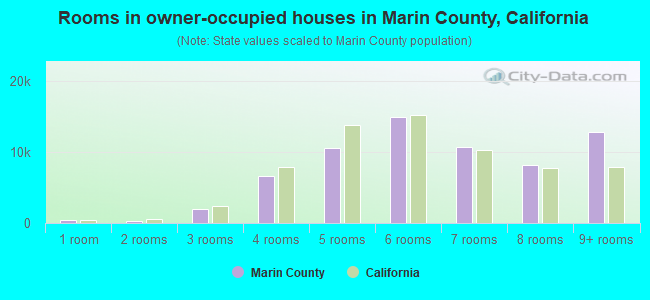
- Rooms in owner-occupied houses in Marin County, California
- 6431 room
- 7372 rooms
- 2,5533 rooms
- 6,3794 rooms
- 10,8275 rooms
- 14,2426 rooms
- 12,3477 rooms
- 8,8378 rooms
- 10,8049+ rooms
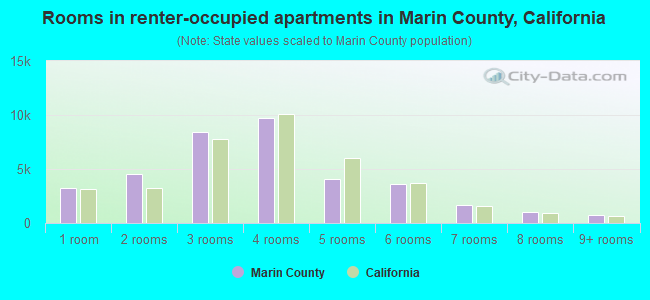
- Rooms in renter-occupied apartments in Marin County, California
- 3,1371 room
- 4,9852 rooms
- 8,7443 rooms
- 9,0464 rooms
- 4,0475 rooms
- 2,0406 rooms
- 1,7857 rooms
- 4968 rooms
- 1,6369+ rooms
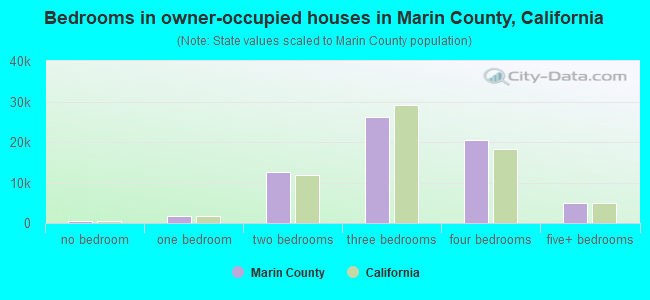
- Bedrooms in owner-occupied houses in Marin County, California
- 643no bedroom
- 2,7931 bedroom
- 10,2052 bedrooms
- 30,1443 bedrooms
- 18,6434 bedrooms
- 4,9415+ bedrooms
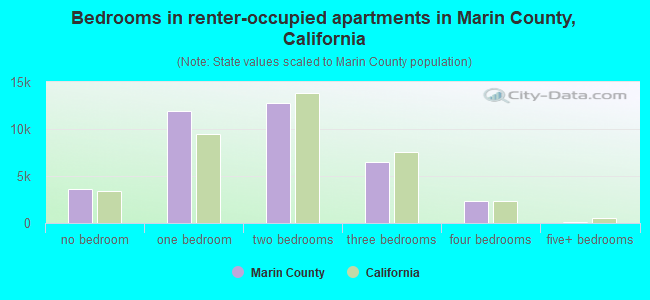
- Bedrooms in renter-occupied apartments in Marin County, California
- 3,867no bedroom
- 11,6191 bedroom
- 11,8192 bedrooms
- 6,3553 bedrooms
- 1,9654 bedrooms
- 2915+ bedrooms
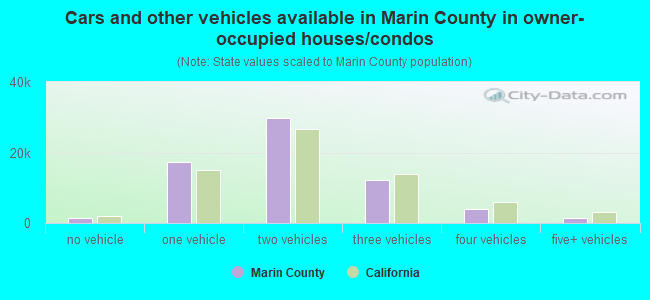
- Cars and other vehicles available in Marin County in owner-occupied houses/condos
- 1,546no vehicle
- 17,0861 vehicle
- 29,5462 vehicles
- 13,8433 vehicles
- 4,1864 vehicles
- 1,1625+ vehicles
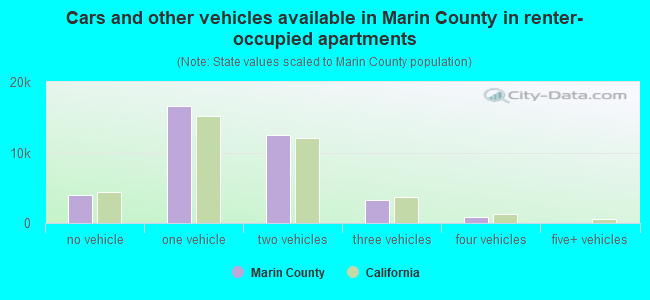
- Cars and other vehicles available in Marin County in renter-occupied apartments
- 3,568no vehicle
- 19,9891 vehicle
- 10,2432 vehicles
- 1,6743 vehicles
- 4424 vehicles
- 05+ vehicles
88.5% of Marin County residents lived in the same house 1 years ago.
Out of people who lived in different houses, 33% lived in this county.
Out of people who lived in different counties, 68% lived in California.
| Marin County: | 88.5% |
| State average: | 88.9% |
Place of birth for U.S.-born residents:
- This state: 128,533
- Other state: 74,845
- Northeast: 27,496
- Midwest: 21,343
- South: 13,548
- West: 12,458
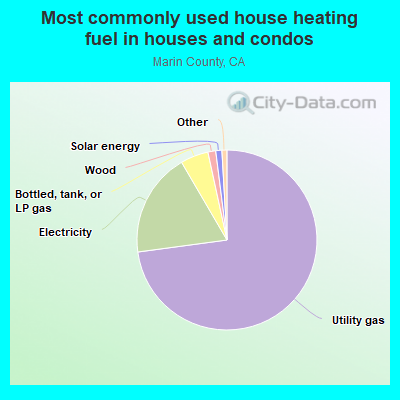
- 75.6%Utility gas
- 18.5%Electricity
- 3.3%Bottled, tank, or LP gas
- 1.5%Solar energy
- 0.7%Wood
- 0.3%No fuel used
- 0.1%Other fuel
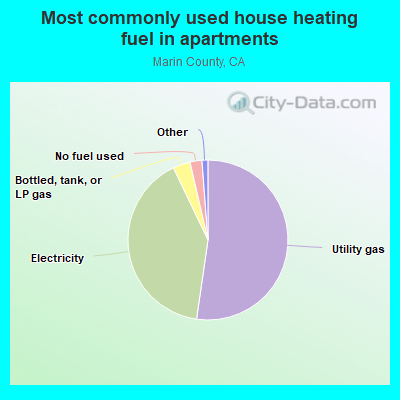
- 54.2%Utility gas
- 36.6%Electricity
- 6.0%Bottled, tank, or LP gas
- 2.7%No fuel used
- 0.4%Wood
- 0.1%Other fuel
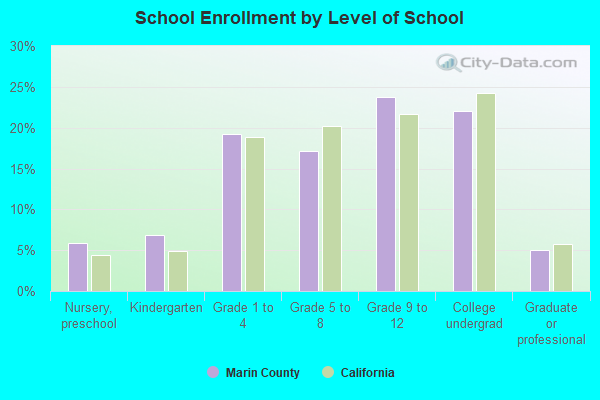
Private vs. public school enrollment:
| Here: | 26.4% |
| California: | 10.5% |
| Here: | 10.8% |
| California: | 8.5% |
| Here: | 23.2% |
| California: | 15.9% |
Marin County government finances - Expenditure in 2020:
- Assistance and Subsidies - Public Welfare, Cash Assistance Programs - Other: $15,626,000
Public Welfare, Cash Assistance Programs - Other: $14,703,000
- Charges - Other: $67,198,000
Other: $57,277,000
Sewerage: $17,093,000
Sewerage: $16,936,000
Elementary and Secondary Education - Other: $6,101,000
Elementary and Secondary Education - Other: $5,532,000
Parks and Recreation: $4,060,000
Parks and Recreation: $2,936,000
Housing and Community Development: $2,796,000
Natural Resources - Other: $2,643,000
Air Transportation: $737,000
Air Transportation: $631,000
Solid Waste Management: $164,000
Solid Waste Management: $160,000
Natural Resources - Other: $28,000
- Construction - Water Utilities: $5,084,000
Water Utilities: $4,872,000
Parks and Recreation: $3,651,000
Parks and Recreation: $725,000
Elementary and Secondary Education: $566,000
Elementary and Secondary Education: $214,000
Natural Resources - Other: $165,000
- Current Operations - Health - Other: $104,954,000
Health - Other: $94,514,000
General - Other: $67,678,000
Housing and Community Development: $58,015,000
Public Welfare - Other: $54,327,000
Public Welfare - Other: $50,221,000
Elementary and Secondary Education: $47,720,000
General - Other: $46,999,000
Elementary and Secondary Education: $41,498,000
Parks and Recreation: $35,404,000
Police Protection: $35,097,000
Police Protection: $34,283,000
Parks and Recreation: $31,338,000
Transit Utilities: $31,336,000
Correctional Institutions: $29,750,000
Central Staff Services: $28,926,000
Transit Utilities: $28,898,000
Correctional Institutions: $28,029,000
Central Staff Services: $27,855,000
Judicial and Legal Services: $25,828,000
Local Fire Protection: $23,657,000
Judicial and Legal Services: $23,623,000
Local Fire Protection: $20,055,000
Regular Highways: $13,760,000
Financial Administration: $13,655,000
Corrections - Other: $13,498,000
Libraries: $13,266,000
Regular Highways: $12,815,000
Financial Administration: $12,535,000
Libraries: $12,257,000
Sewerage: $11,798,000
Natural Resources - Other: $11,552,000
Natural Resources - Other: $11,252,000
Sewerage: $10,501,000
Corrections - Other: $9,334,000
General Public Buildings: $6,814,000
Protective Inspection and Regulation - Other: $3,385,000
Solid Waste Management: $1,748,000
Solid Waste Management: $1,273,000
Air Transportation: $694,000
Air Transportation: $647,000
Protective Inspection and Regulation - Other: $59,000
- Federal Intergovernmental - Housing and Community Development: $57,883,000
Transit Utilities: $33,094,000
Other: $17,353,000
Other: $15,219,000
Transit Utilities: $8,551,000
Air Transportation: $2,568,000
Housing and Community Development: $1,526,000
Natural Resources: $416,000
Air Transportation: $281,000
General Local Government Support: $258,000
Natural Resources: $243,000
General Local Government Support: $220,000
Education: $38,000
Education: $29,000
- General - Interest on Debt: $11,740,000
Interest on Debt: $10,871,000
- Intergovernmental to Local - Other - Elementary and Secondary Education: $25,990,000
Other - Elementary and Secondary Education: $23,060,000
Other - Natural Resources - Other: $8,000
Other - Parks and Recreation: $5,000
- Local Intergovernmental - Transit Utilities: $24,836,000
Transit Utilities: $22,631,000
Education: $12,091,000
Education: $10,411,000
Other: $4,097,000
Other: $3,692,000
Housing and Community Development: $218,000
- Long Term Debt - Outstanding Unspecified Public Purpose: $250,361,000
Beginning Outstanding - Unspecified Public Purpose: $249,298,000
Beginning Outstanding - Unspecified Public Purpose: $246,574,000
Outstanding Unspecified Public Purpose: $235,805,000
Retired Unspecified Public Purpose: $14,528,000
Issue, Unspecified Public Purpose: $11,209,000
Retired Unspecified Public Purpose: $10,146,000
Issue, Unspecified Public Purpose: $3,759,000
- Miscellaneous - Interest Earnings: $19,183,000
General Revenue - Other: $7,404,000
General Revenue - Other: $6,549,000
Special Assessments: $6,187,000
Interest Earnings: $5,606,000
Fines and Forfeits: $4,269,000
Fines and Forfeits: $3,885,000
Rents: $2,229,000
Rents: $1,904,000
Special Assessments: $850,000
Sale of Property: $13,000
Sale of Property: $1,000
- Other Capital Outlay - General - Other: $93,599,000
General - Other: $92,944,000
General Public Building: $13,923,000
Regular Highways: $12,360,000
Regular Highways: $5,466,000
Public Welfare - Other: $4,308,000
Parks and Recreation: $1,447,000
Parks and Recreation: $1,324,000
Natural Resources - Other: $1,111,000
Police Protection: $886,000
Local Fire Protection: $786,000
Corrections - Other: $785,000
Elementary and Secondary Education: $678,000
Elementary and Secondary Education: $667,000
Health - Other: $616,000
Public Welfare - Other: $447,000
Correctional Institutions: $391,000
Libraries: $378,000
Financial Administration: $162,000
Health - Other: $92,000
Central Staff Services: $65,000
Protective Inspection and Regulation - Other: $63,000
Police Protection: $53,000
Judicial and Legal Services: $47,000
- Other Funds - Cash and Securities: $218,780,000
Cash and Securities: $154,042,000
- Revenue - Transit Utilities: $6,250,000
Transit Utilities: $5,340,000
- Sinking Funds - Cash and Securities: $1,303,000
Cash and Securities: $1,194,000
- State Intergovernmental - Other: $120,620,000
Other: $111,669,000
Public Welfare: $90,019,000
Public Welfare: $72,241,000
Health and Hospitals: $61,209,000
Health and Hospitals: $54,177,000
Education: $20,753,000
Education: $15,928,000
Highways: $9,564,000
Highways: $6,633,000
Transit Utilities: $2,836,000
Transit Utilities: $1,871,000
Housing and Community Development: $1,417,000
General Local Government Support: $771,000
General Local Government Support: $704,000
Sewerage: $59,000
Sewerage: $6,000
- Tax - Property: $254,619,000
Property: $218,609,000
General Sales and Gross Receipts: $18,456,000
General Sales and Gross Receipts: $17,833,000
Other: $9,670,000
Occupation and Business License - Other: $7,662,000
Occupation and Business License - Other: $7,109,000
Other: $5,816,000
Other Selective Sales: $5,699,000
Other Selective Sales: $4,534,000
Other License: $4,357,000
Other License: $4,126,000
Documentary and Stock Transfer: $3,988,000
Documentary and Stock Transfer: $3,924,000
Public Utilities Sales: $3,578,000
Public Utilities Sales: $3,263,000
- Total Salaries and Wages: $23,792,000
: $20,877,000
Marin County government finances - Revenue in 2020:
- Assistance and Subsidies - Public Welfare, Cash Assistance Programs - Other: $15,626,000
Public Welfare, Cash Assistance Programs - Other: $14,703,000
- Charges - Other: $67,198,000
Other: $57,277,000
Sewerage: $17,093,000
Sewerage: $16,936,000
Elementary and Secondary Education - Other: $6,101,000
Elementary and Secondary Education - Other: $5,532,000
Parks and Recreation: $4,060,000
Parks and Recreation: $2,936,000
Housing and Community Development: $2,796,000
Natural Resources - Other: $2,643,000
Air Transportation: $737,000
Air Transportation: $631,000
Solid Waste Management: $164,000
Solid Waste Management: $160,000
Natural Resources - Other: $28,000
- Construction - Water Utilities: $5,084,000
Water Utilities: $4,872,000
Parks and Recreation: $3,651,000
Parks and Recreation: $725,000
Elementary and Secondary Education: $566,000
Elementary and Secondary Education: $214,000
Natural Resources - Other: $165,000
- Current Operations - Health - Other: $104,954,000
Health - Other: $94,514,000
General - Other: $67,678,000
Housing and Community Development: $58,015,000
Public Welfare - Other: $54,327,000
Public Welfare - Other: $50,221,000
Elementary and Secondary Education: $47,720,000
General - Other: $46,999,000
Elementary and Secondary Education: $41,498,000
Parks and Recreation: $35,404,000
Police Protection: $35,097,000
Police Protection: $34,283,000
Parks and Recreation: $31,338,000
Transit Utilities: $31,336,000
Correctional Institutions: $29,750,000
Central Staff Services: $28,926,000
Transit Utilities: $28,898,000
Correctional Institutions: $28,029,000
Central Staff Services: $27,855,000
Judicial and Legal Services: $25,828,000
Local Fire Protection: $23,657,000
Judicial and Legal Services: $23,623,000
Local Fire Protection: $20,055,000
Regular Highways: $13,760,000
Financial Administration: $13,655,000
Corrections - Other: $13,498,000
Libraries: $13,266,000
Regular Highways: $12,815,000
Financial Administration: $12,535,000
Libraries: $12,257,000
Sewerage: $11,798,000
Natural Resources - Other: $11,552,000
Natural Resources - Other: $11,252,000
Sewerage: $10,501,000
Corrections - Other: $9,334,000
General Public Buildings: $6,814,000
Protective Inspection and Regulation - Other: $3,385,000
Solid Waste Management: $1,748,000
Solid Waste Management: $1,273,000
Air Transportation: $694,000
Air Transportation: $647,000
Protective Inspection and Regulation - Other: $59,000
- Federal Intergovernmental - Housing and Community Development: $57,883,000
Transit Utilities: $33,094,000
Other: $17,353,000
Other: $15,219,000
Transit Utilities: $8,551,000
Air Transportation: $2,568,000
Housing and Community Development: $1,526,000
Natural Resources: $416,000
Air Transportation: $281,000
General Local Government Support: $258,000
Natural Resources: $243,000
General Local Government Support: $220,000
Education: $38,000
Education: $29,000
- General - Interest on Debt: $11,740,000
Interest on Debt: $10,871,000
- Intergovernmental to Local - Other - Elementary and Secondary Education: $25,990,000
Other - Elementary and Secondary Education: $23,060,000
Other - Natural Resources - Other: $8,000
Other - Parks and Recreation: $5,000
- Local Intergovernmental - Transit Utilities: $24,836,000
Transit Utilities: $22,631,000
Education: $12,091,000
Education: $10,411,000
Other: $4,097,000
Other: $3,692,000
Housing and Community Development: $218,000
- Long Term Debt - Outstanding Unspecified Public Purpose: $250,361,000
Beginning Outstanding - Unspecified Public Purpose: $249,298,000
Beginning Outstanding - Unspecified Public Purpose: $246,574,000
Outstanding Unspecified Public Purpose: $235,805,000
Retired Unspecified Public Purpose: $14,528,000
Issue, Unspecified Public Purpose: $11,209,000
Retired Unspecified Public Purpose: $10,146,000
Issue, Unspecified Public Purpose: $3,759,000
- Miscellaneous - Interest Earnings: $19,183,000
General Revenue - Other: $7,404,000
General Revenue - Other: $6,549,000
Special Assessments: $6,187,000
Interest Earnings: $5,606,000
Fines and Forfeits: $4,269,000
Fines and Forfeits: $3,885,000
Rents: $2,229,000
Rents: $1,904,000
Special Assessments: $850,000
Sale of Property: $13,000
Sale of Property: $1,000
- Other Capital Outlay - General - Other: $93,599,000
General - Other: $92,944,000
General Public Building: $13,923,000
Regular Highways: $12,360,000
Regular Highways: $5,466,000
Public Welfare - Other: $4,308,000
Parks and Recreation: $1,447,000
Parks and Recreation: $1,324,000
Natural Resources - Other: $1,111,000
Police Protection: $886,000
Local Fire Protection: $786,000
Corrections - Other: $785,000
Elementary and Secondary Education: $678,000
Elementary and Secondary Education: $667,000
Health - Other: $616,000
Public Welfare - Other: $447,000
Correctional Institutions: $391,000
Libraries: $378,000
Financial Administration: $162,000
Health - Other: $92,000
Central Staff Services: $65,000
Protective Inspection and Regulation - Other: $63,000
Police Protection: $53,000
Judicial and Legal Services: $47,000
- Other Funds - Cash and Securities: $218,780,000
Cash and Securities: $154,042,000
- Revenue - Transit Utilities: $6,250,000
Transit Utilities: $5,340,000
- Sinking Funds - Cash and Securities: $1,303,000
Cash and Securities: $1,194,000
- State Intergovernmental - Other: $120,620,000
Other: $111,669,000
Public Welfare: $90,019,000
Public Welfare: $72,241,000
Health and Hospitals: $61,209,000
Health and Hospitals: $54,177,000
Education: $20,753,000
Education: $15,928,000
Highways: $9,564,000
Highways: $6,633,000
Transit Utilities: $2,836,000
Transit Utilities: $1,871,000
Housing and Community Development: $1,417,000
General Local Government Support: $771,000
General Local Government Support: $704,000
Sewerage: $59,000
Sewerage: $6,000
- Tax - Property: $254,619,000
Property: $218,609,000
General Sales and Gross Receipts: $18,456,000
General Sales and Gross Receipts: $17,833,000
Other: $9,670,000
Occupation and Business License - Other: $7,662,000
Occupation and Business License - Other: $7,109,000
Other: $5,816,000
Other Selective Sales: $5,699,000
Other Selective Sales: $4,534,000
Other License: $4,357,000
Other License: $4,126,000
Documentary and Stock Transfer: $3,988,000
Documentary and Stock Transfer: $3,924,000
Public Utilities Sales: $3,578,000
Public Utilities Sales: $3,263,000
- Total Salaries and Wages: $23,792,000
: $20,877,000
Marin County government finances - Debt in 2020:
- Assistance and Subsidies - Public Welfare, Cash Assistance Programs - Other: $15,626,000
Public Welfare, Cash Assistance Programs - Other: $14,703,000
- Charges - Other: $67,198,000
Other: $57,277,000
Sewerage: $17,093,000
Sewerage: $16,936,000
Elementary and Secondary Education - Other: $6,101,000
Elementary and Secondary Education - Other: $5,532,000
Parks and Recreation: $4,060,000
Parks and Recreation: $2,936,000
Housing and Community Development: $2,796,000
Natural Resources - Other: $2,643,000
Air Transportation: $737,000
Air Transportation: $631,000
Solid Waste Management: $164,000
Solid Waste Management: $160,000
Natural Resources - Other: $28,000
- Construction - Water Utilities: $5,084,000
Water Utilities: $4,872,000
Parks and Recreation: $3,651,000
Parks and Recreation: $725,000
Elementary and Secondary Education: $566,000
Elementary and Secondary Education: $214,000
Natural Resources - Other: $165,000
- Current Operations - Health - Other: $104,954,000
Health - Other: $94,514,000
General - Other: $67,678,000
Housing and Community Development: $58,015,000
Public Welfare - Other: $54,327,000
Public Welfare - Other: $50,221,000
Elementary and Secondary Education: $47,720,000
General - Other: $46,999,000
Elementary and Secondary Education: $41,498,000
Parks and Recreation: $35,404,000
Police Protection: $35,097,000
Police Protection: $34,283,000
Parks and Recreation: $31,338,000
Transit Utilities: $31,336,000
Correctional Institutions: $29,750,000
Central Staff Services: $28,926,000
Transit Utilities: $28,898,000
Correctional Institutions: $28,029,000
Central Staff Services: $27,855,000
Judicial and Legal Services: $25,828,000
Local Fire Protection: $23,657,000
Judicial and Legal Services: $23,623,000
Local Fire Protection: $20,055,000
Regular Highways: $13,760,000
Financial Administration: $13,655,000
Corrections - Other: $13,498,000
Libraries: $13,266,000
Regular Highways: $12,815,000
Financial Administration: $12,535,000
Libraries: $12,257,000
Sewerage: $11,798,000
Natural Resources - Other: $11,552,000
Natural Resources - Other: $11,252,000
Sewerage: $10,501,000
Corrections - Other: $9,334,000
General Public Buildings: $6,814,000
Protective Inspection and Regulation - Other: $3,385,000
Solid Waste Management: $1,748,000
Solid Waste Management: $1,273,000
Air Transportation: $694,000
Air Transportation: $647,000
Protective Inspection and Regulation - Other: $59,000
- Federal Intergovernmental - Housing and Community Development: $57,883,000
Transit Utilities: $33,094,000
Other: $17,353,000
Other: $15,219,000
Transit Utilities: $8,551,000
Air Transportation: $2,568,000
Housing and Community Development: $1,526,000
Natural Resources: $416,000
Air Transportation: $281,000
General Local Government Support: $258,000
Natural Resources: $243,000
General Local Government Support: $220,000
Education: $38,000
Education: $29,000
- General - Interest on Debt: $11,740,000
Interest on Debt: $10,871,000
- Intergovernmental to Local - Other - Elementary and Secondary Education: $25,990,000
Other - Elementary and Secondary Education: $23,060,000
Other - Natural Resources - Other: $8,000
Other - Parks and Recreation: $5,000
- Local Intergovernmental - Transit Utilities: $24,836,000
Transit Utilities: $22,631,000
Education: $12,091,000
Education: $10,411,000
Other: $4,097,000
Other: $3,692,000
Housing and Community Development: $218,000
- Long Term Debt - Outstanding Unspecified Public Purpose: $250,361,000
Beginning Outstanding - Unspecified Public Purpose: $249,298,000
Beginning Outstanding - Unspecified Public Purpose: $246,574,000
Outstanding Unspecified Public Purpose: $235,805,000
Retired Unspecified Public Purpose: $14,528,000
Issue, Unspecified Public Purpose: $11,209,000
Retired Unspecified Public Purpose: $10,146,000
Issue, Unspecified Public Purpose: $3,759,000
- Miscellaneous - Interest Earnings: $19,183,000
General Revenue - Other: $7,404,000
General Revenue - Other: $6,549,000
Special Assessments: $6,187,000
Interest Earnings: $5,606,000
Fines and Forfeits: $4,269,000
Fines and Forfeits: $3,885,000
Rents: $2,229,000
Rents: $1,904,000
Special Assessments: $850,000
Sale of Property: $13,000
Sale of Property: $1,000
- Other Capital Outlay - General - Other: $93,599,000
General - Other: $92,944,000
General Public Building: $13,923,000
Regular Highways: $12,360,000
Regular Highways: $5,466,000
Public Welfare - Other: $4,308,000
Parks and Recreation: $1,447,000
Parks and Recreation: $1,324,000
Natural Resources - Other: $1,111,000
Police Protection: $886,000
Local Fire Protection: $786,000
Corrections - Other: $785,000
Elementary and Secondary Education: $678,000
Elementary and Secondary Education: $667,000
Health - Other: $616,000
Public Welfare - Other: $447,000
Correctional Institutions: $391,000
Libraries: $378,000
Financial Administration: $162,000
Health - Other: $92,000
Central Staff Services: $65,000
Protective Inspection and Regulation - Other: $63,000
Police Protection: $53,000
Judicial and Legal Services: $47,000
- Other Funds - Cash and Securities: $218,780,000
Cash and Securities: $154,042,000
- Revenue - Transit Utilities: $6,250,000
Transit Utilities: $5,340,000
- Sinking Funds - Cash and Securities: $1,303,000
Cash and Securities: $1,194,000
- State Intergovernmental - Other: $120,620,000
Other: $111,669,000
Public Welfare: $90,019,000
Public Welfare: $72,241,000
Health and Hospitals: $61,209,000
Health and Hospitals: $54,177,000
Education: $20,753,000
Education: $15,928,000
Highways: $9,564,000
Highways: $6,633,000
Transit Utilities: $2,836,000
Transit Utilities: $1,871,000
Housing and Community Development: $1,417,000
General Local Government Support: $771,000
General Local Government Support: $704,000
Sewerage: $59,000
Sewerage: $6,000
- Tax - Property: $254,619,000
Property: $218,609,000
General Sales and Gross Receipts: $18,456,000
General Sales and Gross Receipts: $17,833,000
Other: $9,670,000
Occupation and Business License - Other: $7,662,000
Occupation and Business License - Other: $7,109,000
Other: $5,816,000
Other Selective Sales: $5,699,000
Other Selective Sales: $4,534,000
Other License: $4,357,000
Other License: $4,126,000
Documentary and Stock Transfer: $3,988,000
Documentary and Stock Transfer: $3,924,000
Public Utilities Sales: $3,578,000
Public Utilities Sales: $3,263,000
- Total Salaries and Wages: $23,792,000
: $20,877,000
Marin County government finances - Cash and Securities in 2020:
- Assistance and Subsidies - Public Welfare, Cash Assistance Programs - Other: $15,626,000
Public Welfare, Cash Assistance Programs - Other: $14,703,000
- Charges - Other: $67,198,000
Other: $57,277,000
Sewerage: $17,093,000
Sewerage: $16,936,000
Elementary and Secondary Education - Other: $6,101,000
Elementary and Secondary Education - Other: $5,532,000
Parks and Recreation: $4,060,000
Parks and Recreation: $2,936,000
Housing and Community Development: $2,796,000
Natural Resources - Other: $2,643,000
Air Transportation: $737,000
Air Transportation: $631,000
Solid Waste Management: $164,000
Solid Waste Management: $160,000
Natural Resources - Other: $28,000
- Construction - Water Utilities: $5,084,000
Water Utilities: $4,872,000
Parks and Recreation: $3,651,000
Parks and Recreation: $725,000
Elementary and Secondary Education: $566,000
Elementary and Secondary Education: $214,000
Natural Resources - Other: $165,000
- Current Operations - Health - Other: $104,954,000
Health - Other: $94,514,000
General - Other: $67,678,000
Housing and Community Development: $58,015,000
Public Welfare - Other: $54,327,000
Public Welfare - Other: $50,221,000
Elementary and Secondary Education: $47,720,000
General - Other: $46,999,000
Elementary and Secondary Education: $41,498,000
Parks and Recreation: $35,404,000
Police Protection: $35,097,000
Police Protection: $34,283,000
Parks and Recreation: $31,338,000
Transit Utilities: $31,336,000
Correctional Institutions: $29,750,000
Central Staff Services: $28,926,000
Transit Utilities: $28,898,000
Correctional Institutions: $28,029,000
Central Staff Services: $27,855,000
Judicial and Legal Services: $25,828,000
Local Fire Protection: $23,657,000
Judicial and Legal Services: $23,623,000
Local Fire Protection: $20,055,000
Regular Highways: $13,760,000
Financial Administration: $13,655,000
Corrections - Other: $13,498,000
Libraries: $13,266,000
Regular Highways: $12,815,000
Financial Administration: $12,535,000
Libraries: $12,257,000
Sewerage: $11,798,000
Natural Resources - Other: $11,552,000
Natural Resources - Other: $11,252,000
Sewerage: $10,501,000
Corrections - Other: $9,334,000
General Public Buildings: $6,814,000
Protective Inspection and Regulation - Other: $3,385,000
Solid Waste Management: $1,748,000
Solid Waste Management: $1,273,000
Air Transportation: $694,000
Air Transportation: $647,000
Protective Inspection and Regulation - Other: $59,000
- Federal Intergovernmental - Housing and Community Development: $57,883,000
Transit Utilities: $33,094,000
Other: $17,353,000
Other: $15,219,000
Transit Utilities: $8,551,000
Air Transportation: $2,568,000
Housing and Community Development: $1,526,000
Natural Resources: $416,000
Air Transportation: $281,000
General Local Government Support: $258,000
Natural Resources: $243,000
General Local Government Support: $220,000
Education: $38,000
Education: $29,000
- General - Interest on Debt: $11,740,000
Interest on Debt: $10,871,000
- Intergovernmental to Local - Other - Elementary and Secondary Education: $25,990,000
Other - Elementary and Secondary Education: $23,060,000
Other - Natural Resources - Other: $8,000
Other - Parks and Recreation: $5,000
- Local Intergovernmental - Transit Utilities: $24,836,000
Transit Utilities: $22,631,000
Education: $12,091,000
Education: $10,411,000
Other: $4,097,000
Other: $3,692,000
Housing and Community Development: $218,000
- Long Term Debt - Outstanding Unspecified Public Purpose: $250,361,000
Beginning Outstanding - Unspecified Public Purpose: $249,298,000
Beginning Outstanding - Unspecified Public Purpose: $246,574,000
Outstanding Unspecified Public Purpose: $235,805,000
Retired Unspecified Public Purpose: $14,528,000
Issue, Unspecified Public Purpose: $11,209,000
Retired Unspecified Public Purpose: $10,146,000
Issue, Unspecified Public Purpose: $3,759,000
- Miscellaneous - Interest Earnings: $19,183,000
General Revenue - Other: $7,404,000
General Revenue - Other: $6,549,000
Special Assessments: $6,187,000
Interest Earnings: $5,606,000
Fines and Forfeits: $4,269,000
Fines and Forfeits: $3,885,000
Rents: $2,229,000
Rents: $1,904,000
Special Assessments: $850,000
Sale of Property: $13,000
Sale of Property: $1,000
- Other Capital Outlay - General - Other: $93,599,000
General - Other: $92,944,000
General Public Building: $13,923,000
Regular Highways: $12,360,000
Regular Highways: $5,466,000
Public Welfare - Other: $4,308,000
Parks and Recreation: $1,447,000
Parks and Recreation: $1,324,000
Natural Resources - Other: $1,111,000
Police Protection: $886,000
Local Fire Protection: $786,000
Corrections - Other: $785,000
Elementary and Secondary Education: $678,000
Elementary and Secondary Education: $667,000
Health - Other: $616,000
Public Welfare - Other: $447,000
Correctional Institutions: $391,000
Libraries: $378,000
Financial Administration: $162,000
Health - Other: $92,000
Central Staff Services: $65,000
Protective Inspection and Regulation - Other: $63,000
Police Protection: $53,000
Judicial and Legal Services: $47,000
- Other Funds - Cash and Securities: $218,780,000
Cash and Securities: $154,042,000
- Revenue - Transit Utilities: $6,250,000
Transit Utilities: $5,340,000
- Sinking Funds - Cash and Securities: $1,303,000
Cash and Securities: $1,194,000
- State Intergovernmental - Other: $120,620,000
Other: $111,669,000
Public Welfare: $90,019,000
Public Welfare: $72,241,000
Health and Hospitals: $61,209,000
Health and Hospitals: $54,177,000
Education: $20,753,000
Education: $15,928,000
Highways: $9,564,000
Highways: $6,633,000
Transit Utilities: $2,836,000
Transit Utilities: $1,871,000
Housing and Community Development: $1,417,000
General Local Government Support: $771,000
General Local Government Support: $704,000
Sewerage: $59,000
Sewerage: $6,000
- Tax - Property: $254,619,000
Property: $218,609,000
General Sales and Gross Receipts: $18,456,000
General Sales and Gross Receipts: $17,833,000
Other: $9,670,000
Occupation and Business License - Other: $7,662,000
Occupation and Business License - Other: $7,109,000
Other: $5,816,000
Other Selective Sales: $5,699,000
Other Selective Sales: $4,534,000
Other License: $4,357,000
Other License: $4,126,000
Documentary and Stock Transfer: $3,988,000
Documentary and Stock Transfer: $3,924,000
Public Utilities Sales: $3,578,000
Public Utilities Sales: $3,263,000
- Total Salaries and Wages: $23,792,000
: $20,877,000
Supplemental Security Income (SSI) in 2006:
- Total number of recipients: 3,795
- Number of aged recipients: 828
- Number of blind and disabled recipients: 2,967
- Number of recipients under 18: 145
- Number of recipients between 18 and 64: 2,427
- Number of recipients older than 64: 1,223
- Number of recipients also receiving OASDI: 1,634
- Amount of payments (thousands of dollars): 2,216
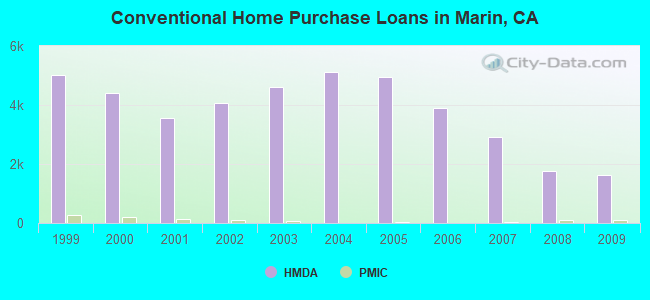
| Home Mortgage Disclosure Act Aggregated Statistics For Year 2009 (Based on 51 full tracts) | ||||||||||||||
| A) FHA, FSA/RHS & VA Home Purchase Loans | B) Conventional Home Purchase Loans | C) Refinancings | D) Home Improvement Loans | E) Loans on Dwellings For 5+ Families | F) Non-occupant Loans on < 5 Family Dwellings (A B C & D) | G) Loans On Manufactured Home Dwelling (A B C & D) | ||||||||
|---|---|---|---|---|---|---|---|---|---|---|---|---|---|---|
| Number | Average Value | Number | Average Value | Number | Average Value | Number | Average Value | Number | Average Value | Number | Average Value | Number | Average Value | |
| LOANS ORIGINATED | 284 | $488,877 | 1,615 | $539,254 | 9,475 | $447,429 | 361 | $313,942 | 14 | $4,233,500 | 661 | $403,365 | 6 | $178,667 |
| APPLICATIONS APPROVED, NOT ACCEPTED | 33 | $504,061 | 238 | $535,315 | 1,093 | $476,266 | 28 | $266,786 | 1 | $600,000 | 101 | $375,980 | 4 | $35,250 |
| APPLICATIONS DENIED | 46 | $418,891 | 310 | $512,494 | 2,394 | $529,158 | 104 | $281,856 | 3 | $1,958,333 | 257 | $379,568 | 9 | $141,444 |
| APPLICATIONS WITHDRAWN | 40 | $439,800 | 242 | $551,223 | 1,361 | $497,510 | 84 | $306,357 | 0 | $0 | 124 | $416,968 | 2 | $137,500 |
| FILES CLOSED FOR INCOMPLETENESS | 8 | $489,000 | 65 | $506,569 | 406 | $493,692 | 12 | $268,167 | 1 | $750,000 | 25 | $453,720 | 0 | $0 |
| Private Mortgage Insurance Companies Aggregated Statistics For Year 2009 (Based on 38 full tracts) | ||||
| A) Conventional Home Purchase Loans | B) Refinancings | |||
|---|---|---|---|---|
| Number | Average Value | Number | Average Value | |
| LOANS ORIGINATED | 87 | $399,437 | 15 | $467,333 |
| APPLICATIONS APPROVED, NOT ACCEPTED | 31 | $405,419 | 5 | $537,200 |
| APPLICATIONS DENIED | 23 | $441,957 | 8 | $412,500 |
| APPLICATIONS WITHDRAWN | 9 | $455,333 | 3 | $302,333 |
| FILES CLOSED FOR INCOMPLETENESS | 3 | $690,667 | 0 | $0 |
| Most common first names in Marin County, CA among deceased individuals | ||
| Name | Count | Lived (average) |
|---|---|---|
| John | 1,347 | 75.2 years |
| Mary | 1,123 | 81.3 years |
| William | 1,085 | 74.4 years |
| Robert | 1,027 | 72.6 years |
| James | 806 | 72.2 years |
| Helen | 669 | 82.3 years |
| George | 644 | 76.9 years |
| Margaret | 636 | 81.5 years |
| Charles | 600 | 76.9 years |
| Joseph | 581 | 76.9 years |
| Most common last names in Marin County, CA among deceased individuals | ||
| Last name | Count | Lived (average) |
|---|---|---|
| Smith | 385 | 78.0 years |
| Johnson | 300 | 77.0 years |
| Miller | 195 | 78.3 years |
| Brown | 191 | 77.1 years |
| Jones | 177 | 76.5 years |
| Williams | 174 | 75.9 years |
| Anderson | 171 | 77.0 years |
| Wilson | 140 | 77.5 years |
| Taylor | 133 | 76.7 years |
| Martin | 118 | 75.1 years |
| Businesses in Marin County, CA | ||||
| Name | Count | Name | Count | |
|---|---|---|---|---|
| 24 Hour Fitness | 4 | Kohl's | 1 | |
| 7-Eleven | 11 | Lane Furniture | 1 | |
| AT&T | 7 | LensCrafters | 2 | |
| Abercrombie & Fitch | 1 | Little Caesars Pizza | 1 | |
| Ace Hardware | 6 | Long John Silver's | 1 | |
| Aerosoles | 1 | Macy's | 3 | |
| Ann Taylor | 3 | Marriott | 2 | |
| Apple Store | 1 | Marshalls | 1 | |
| Applebee's | 1 | MasterBrand Cabinets | 17 | |
| Audi | 1 | Mazda | 1 | |
| BMW | 1 | McDonald's | 4 | |
| Baja Fresh Mexican Grill | 1 | Men's Wearhouse | 2 | |
| Banana Republic | 1 | Motel 6 | 1 | |
| Barnes & Noble | 1 | Motherhood Maternity | 3 | |
| Baskin-Robbins | 1 | New Balance | 6 | |
| Bath & Body Works | 1 | Nike | 27 | |
| Bebe | 1 | Nissan | 1 | |
| Bed Bath & Beyond | 1 | Nordstrom | 1 | |
| Ben & Jerry's | 1 | Office Depot | 1 | |
| Best Western | 2 | Old Navy | 1 | |
| Big O Tires | 1 | Outback | 1 | |
| Blockbuster | 2 | Outback Steakhouse | 1 | |
| Brookstone | 1 | Pac Sun | 1 | |
| Burger King | 4 | Panda Express | 1 | |
| CVS | 8 | Panera Bread | 1 | |
| Carl\s Jr. | 1 | Payless | 3 | |
| Chevrolet | 1 | Penske | 2 | |
| Chico's | 1 | Pier 1 Imports | 1 | |
| Chipotle | 1 | Pottery Barn | 1 | |
| Clarks | 1 | Pottery Barn Kids | 1 | |
| Cold Stone Creamery | 1 | Quiznos | 1 | |
| Costco | 1 | RadioShack | 4 | |
| Crate & Barrel | 1 | Rite Aid | 5 | |
| Curves | 4 | Safeway | 8 | |
| DHL | 7 | Sears | 4 | |
| Decora Cabinetry | 1 | Sephora | 1 | |
| Dennys | 1 | Sprint Nextel | 3 | |
| Domino's Pizza | 2 | Staples | 2 | |
| Eddie Bauer | 1 | Starbucks | 21 | |
| Ethan Allen | 1 | Subaru | 1 | |
| Express | 1 | Subway | 13 | |
| Extended Stay Deluxe | 1 | T-Mobile | 6 | |
| FedEx | 73 | Taco Bell | 4 | |
| Foot Locker | 1 | Talbots | 1 | |
| Forever 21 | 1 | Target | 1 | |
| GNC | 5 | The Cheesecake Factory | 1 | |
| GameStop | 2 | Toyota | 2 | |
| Gap | 3 | Toys"R"Us | 2 | |
| Goodwill | 2 | Trader Joe's | 3 | |
| Gymboree | 3 | Travelodge | 2 | |
| H&M | 1 | True Value | 1 | |
| H&R Block | 5 | U-Haul | 5 | |
| Hilton | 1 | UPS | 67 | |
| Home Depot | 1 | Urban Outfitters | 1 | |
| Honda | 1 | Vans | 6 | |
| Hot Topic | 1 | Verizon Wireless | 1 | |
| IHOP | 2 | Victoria's Secret | 1 | |
| J. Jill | 1 | Volkswagen | 1 | |
| J.Crew | 1 | Vons | 8 | |
| Jack In The Box | 2 | Walgreens | 4 | |
| Jamba Juice | 4 | Wendy's | 1 | |
| JoS. A. Bank | 1 | Whole Foods Market | 4 | |
| Jones New York | 6 | YMCA | 2 | |
| Justice | 1 | Z Gallerie | 1 | |
| KFC | 3 | |||
Marin County on our top lists:
- #13 on the list of "Top 101 counties with the largest number of people without health insurance coverage in 2000 (pop. 50,000+)"
- #17 on the list of "Top 101 counties with the highest carbon monoxide air pollution readings in 2012 (ppm)"
- #17 on the list of "Top 101 counties with the lowest Ozone (1-hour) air pollution readings in 2012 (ppm)"
- #30 on the list of "Top 101 counties with highest percentage of residents voting for Obama (Democrat) in the 2012 Presidential Election (pop. 50,000+)"
- #43 on the list of "Top 101 counties with the lowest number of births per 1000 residents 2007-2013"
- #43 on the list of "Top 101 counties with the lowest number of births per 1000 residents 2007-2013 (pop 50,000+)"
- #44 on the list of "Top 101 counties with the highest Nitrogen Dioxide air pollution readings in 2012 (ppm)"
- #50 on the list of "Top 101 counties with the lowest Particulate Matter (PM10) Annual air pollution readings in 2012 (µg/m3)"
- #63 on the list of "Top 101 counties with highest percentage of residents voting for Obama (Democrat) in the 2012 Presidential Election"
- #64 on the list of "Top 101 counties with the largest decrease in the number of births per 1000 residents 2000-2006 to 2007-2013 (pop 50,000+)"
- #74 on the list of "Top 101 counties with the largest number of children under 18 without health insurance coverage in 2000 (pop. 50,000+)"
- #98 on the list of "Top 101 counties with highest percentage of residents voting for 3rd party candidates in the 2012 Presidential Election (pop. 50,000+)"