Novato, California Submit your own pictures of this city and show them to the world
OSM Map
General Map
Google Map
MSN Map
OSM Map
General Map
Google Map
MSN Map
OSM Map
General Map
Google Map
MSN Map
OSM Map
General Map
Google Map
MSN Map
Please wait while loading the map...
Population in 2022: 52,184 (95% urban, 5% rural). Population change since 2000: +9.6%Males: 26,070 Females: 26,114
March 2022 cost of living index in Novato: 132.9 (high, U.S. average is 100) Percentage of residents living in poverty in 2022: 8.8%for White Non-Hispanic residents , 24.8% for Black residents , 16.0% for Hispanic or Latino residents , 14.4% for American Indian residents , 20.4% for other race residents , 13.9% for two or more races residents )
Profiles of local businesses
Business Search - 14 Million verified businesses
Data:
Median household income ($)
Median household income (% change since 2000)
Household income diversity
Ratio of average income to average house value (%)
Ratio of average income to average rent
Median household income ($) - White
Median household income ($) - Black or African American
Median household income ($) - Asian
Median household income ($) - Hispanic or Latino
Median household income ($) - American Indian and Alaska Native
Median household income ($) - Multirace
Median household income ($) - Other Race
Median household income for houses/condos with a mortgage ($)
Median household income for apartments without a mortgage ($)
Races - White alone (%)
Races - White alone (% change since 2000)
Races - Black alone (%)
Races - Black alone (% change since 2000)
Races - American Indian alone (%)
Races - American Indian alone (% change since 2000)
Races - Asian alone (%)
Races - Asian alone (% change since 2000)
Races - Hispanic (%)
Races - Hispanic (% change since 2000)
Races - Native Hawaiian and Other Pacific Islander alone (%)
Races - Native Hawaiian and Other Pacific Islander alone (% change since 2000)
Races - Two or more races (%)
Races - Two or more races (% change since 2000)
Races - Other race alone (%)
Races - Other race alone (% change since 2000)
Racial diversity
Unemployment (%)
Unemployment (% change since 2000)
Unemployment (%) - White
Unemployment (%) - Black or African American
Unemployment (%) - Asian
Unemployment (%) - Hispanic or Latino
Unemployment (%) - American Indian and Alaska Native
Unemployment (%) - Multirace
Unemployment (%) - Other Race
Population density (people per square mile)
Population - Males (%)
Population - Females (%)
Population - Males (%) - White
Population - Males (%) - Black or African American
Population - Males (%) - Asian
Population - Males (%) - Hispanic or Latino
Population - Males (%) - American Indian and Alaska Native
Population - Males (%) - Multirace
Population - Males (%) - Other Race
Population - Females (%) - White
Population - Females (%) - Black or African American
Population - Females (%) - Asian
Population - Females (%) - Hispanic or Latino
Population - Females (%) - American Indian and Alaska Native
Population - Females (%) - Multirace
Population - Females (%) - Other Race
Coronavirus confirmed cases (Apr 27, 2024)
Deaths caused by coronavirus (Apr 27, 2024)
Coronavirus confirmed cases (per 100k population) (Apr 27, 2024)
Deaths caused by coronavirus (per 100k population) (Apr 27, 2024)
Daily increase in number of cases (Apr 27, 2024)
Weekly increase in number of cases (Apr 27, 2024)
Cases doubled (in days) (Apr 27, 2024)
Hospitalized patients (Apr 18, 2022)
Negative test results (Apr 18, 2022)
Total test results (Apr 18, 2022)
COVID Vaccine doses distributed (per 100k population) (Sep 19, 2023)
COVID Vaccine doses administered (per 100k population) (Sep 19, 2023)
COVID Vaccine doses distributed (Sep 19, 2023)
COVID Vaccine doses administered (Sep 19, 2023)
Likely homosexual households (%)
Likely homosexual households (% change since 2000)
Likely homosexual households - Lesbian couples (%)
Likely homosexual households - Lesbian couples (% change since 2000)
Likely homosexual households - Gay men (%)
Likely homosexual households - Gay men (% change since 2000)
Cost of living index
Median gross rent ($)
Median contract rent ($)
Median monthly housing costs ($)
Median house or condo value ($)
Median house or condo value ($ change since 2000)
Mean house or condo value by units in structure - 1, detached ($)
Mean house or condo value by units in structure - 1, attached ($)
Mean house or condo value by units in structure - 2 ($)
Mean house or condo value by units in structure by units in structure - 3 or 4 ($)
Mean house or condo value by units in structure - 5 or more ($)
Mean house or condo value by units in structure - Boat, RV, van, etc. ($)
Mean house or condo value by units in structure - Mobile home ($)
Median house or condo value ($) - White
Median house or condo value ($) - Black or African American
Median house or condo value ($) - Asian
Median house or condo value ($) - Hispanic or Latino
Median house or condo value ($) - American Indian and Alaska Native
Median house or condo value ($) - Multirace
Median house or condo value ($) - Other Race
Median resident age
Resident age diversity
Median resident age - Males
Median resident age - Females
Median resident age - White
Median resident age - Black or African American
Median resident age - Asian
Median resident age - Hispanic or Latino
Median resident age - American Indian and Alaska Native
Median resident age - Multirace
Median resident age - Other Race
Median resident age - Males - White
Median resident age - Males - Black or African American
Median resident age - Males - Asian
Median resident age - Males - Hispanic or Latino
Median resident age - Males - American Indian and Alaska Native
Median resident age - Males - Multirace
Median resident age - Males - Other Race
Median resident age - Females - White
Median resident age - Females - Black or African American
Median resident age - Females - Asian
Median resident age - Females - Hispanic or Latino
Median resident age - Females - American Indian and Alaska Native
Median resident age - Females - Multirace
Median resident age - Females - Other Race
Commute - mean travel time to work (minutes)
Travel time to work - Less than 5 minutes (%)
Travel time to work - Less than 5 minutes (% change since 2000)
Travel time to work - 5 to 9 minutes (%)
Travel time to work - 5 to 9 minutes (% change since 2000)
Travel time to work - 10 to 19 minutes (%)
Travel time to work - 10 to 19 minutes (% change since 2000)
Travel time to work - 20 to 29 minutes (%)
Travel time to work - 20 to 29 minutes (% change since 2000)
Travel time to work - 30 to 39 minutes (%)
Travel time to work - 30 to 39 minutes (% change since 2000)
Travel time to work - 40 to 59 minutes (%)
Travel time to work - 40 to 59 minutes (% change since 2000)
Travel time to work - 60 to 89 minutes (%)
Travel time to work - 60 to 89 minutes (% change since 2000)
Travel time to work - 90 or more minutes (%)
Travel time to work - 90 or more minutes (% change since 2000)
Marital status - Never married (%)
Marital status - Now married (%)
Marital status - Separated (%)
Marital status - Widowed (%)
Marital status - Divorced (%)
Median family income ($)
Median family income (% change since 2000)
Median non-family income ($)
Median non-family income (% change since 2000)
Median per capita income ($)
Median per capita income (% change since 2000)
Median family income ($) - White
Median family income ($) - Black or African American
Median family income ($) - Asian
Median family income ($) - Hispanic or Latino
Median family income ($) - American Indian and Alaska Native
Median family income ($) - Multirace
Median family income ($) - Other Race
Median year house/condo built
Median year apartment built
Year house built - Built 2005 or later (%)
Year house built - Built 2000 to 2004 (%)
Year house built - Built 1990 to 1999 (%)
Year house built - Built 1980 to 1989 (%)
Year house built - Built 1970 to 1979 (%)
Year house built - Built 1960 to 1969 (%)
Year house built - Built 1950 to 1959 (%)
Year house built - Built 1940 to 1949 (%)
Year house built - Built 1939 or earlier (%)
Average household size
Household density (households per square mile)
Average household size - White
Average household size - Black or African American
Average household size - Asian
Average household size - Hispanic or Latino
Average household size - American Indian and Alaska Native
Average household size - Multirace
Average household size - Other Race
Occupied housing units (%)
Vacant housing units (%)
Owner occupied housing units (%)
Renter occupied housing units (%)
Vacancy status - For rent (%)
Vacancy status - For sale only (%)
Vacancy status - Rented or sold, not occupied (%)
Vacancy status - For seasonal, recreational, or occasional use (%)
Vacancy status - For migrant workers (%)
Vacancy status - Other vacant (%)
Residents with income below the poverty level (%)
Residents with income below 50% of the poverty level (%)
Children below poverty level (%)
Poor families by family type - Married-couple family (%)
Poor families by family type - Male, no wife present (%)
Poor families by family type - Female, no husband present (%)
Poverty status for native-born residents (%)
Poverty status for foreign-born residents (%)
Poverty among high school graduates not in families (%)
Poverty among people who did not graduate high school not in families (%)
Residents with income below the poverty level (%) - White
Residents with income below the poverty level (%) - Black or African American
Residents with income below the poverty level (%) - Asian
Residents with income below the poverty level (%) - Hispanic or Latino
Residents with income below the poverty level (%) - American Indian and Alaska Native
Residents with income below the poverty level (%) - Multirace
Residents with income below the poverty level (%) - Other Race
Air pollution - Air Quality Index (AQI)
Air pollution - CO
Air pollution - NO2
Air pollution - SO2
Air pollution - Ozone
Air pollution - PM10
Air pollution - PM25
Air pollution - Pb
Crime - Murders per 100,000 population
Crime - Rapes per 100,000 population
Crime - Robberies per 100,000 population
Crime - Assaults per 100,000 population
Crime - Burglaries per 100,000 population
Crime - Thefts per 100,000 population
Crime - Auto thefts per 100,000 population
Crime - Arson per 100,000 population
Crime - City-data.com crime index
Crime - Violent crime index
Crime - Property crime index
Crime - Murders per 100,000 population (5 year average)
Crime - Rapes per 100,000 population (5 year average)
Crime - Robberies per 100,000 population (5 year average)
Crime - Assaults per 100,000 population (5 year average)
Crime - Burglaries per 100,000 population (5 year average)
Crime - Thefts per 100,000 population (5 year average)
Crime - Auto thefts per 100,000 population (5 year average)
Crime - Arson per 100,000 population (5 year average)
Crime - City-data.com crime index (5 year average)
Crime - Violent crime index (5 year average)
Crime - Property crime index (5 year average)
1996 Presidential Elections Results (%) - Democratic Party (Clinton)
1996 Presidential Elections Results (%) - Republican Party (Dole)
1996 Presidential Elections Results (%) - Other
2000 Presidential Elections Results (%) - Democratic Party (Gore)
2000 Presidential Elections Results (%) - Republican Party (Bush)
2000 Presidential Elections Results (%) - Other
2004 Presidential Elections Results (%) - Democratic Party (Kerry)
2004 Presidential Elections Results (%) - Republican Party (Bush)
2004 Presidential Elections Results (%) - Other
2008 Presidential Elections Results (%) - Democratic Party (Obama)
2008 Presidential Elections Results (%) - Republican Party (McCain)
2008 Presidential Elections Results (%) - Other
2012 Presidential Elections Results (%) - Democratic Party (Obama)
2012 Presidential Elections Results (%) - Republican Party (Romney)
2012 Presidential Elections Results (%) - Other
2016 Presidential Elections Results (%) - Democratic Party (Clinton)
2016 Presidential Elections Results (%) - Republican Party (Trump)
2016 Presidential Elections Results (%) - Other
2020 Presidential Elections Results (%) - Democratic Party (Biden)
2020 Presidential Elections Results (%) - Republican Party (Trump)
2020 Presidential Elections Results (%) - Other
Ancestries Reported - Arab (%)
Ancestries Reported - Czech (%)
Ancestries Reported - Danish (%)
Ancestries Reported - Dutch (%)
Ancestries Reported - English (%)
Ancestries Reported - French (%)
Ancestries Reported - French Canadian (%)
Ancestries Reported - German (%)
Ancestries Reported - Greek (%)
Ancestries Reported - Hungarian (%)
Ancestries Reported - Irish (%)
Ancestries Reported - Italian (%)
Ancestries Reported - Lithuanian (%)
Ancestries Reported - Norwegian (%)
Ancestries Reported - Polish (%)
Ancestries Reported - Portuguese (%)
Ancestries Reported - Russian (%)
Ancestries Reported - Scotch-Irish (%)
Ancestries Reported - Scottish (%)
Ancestries Reported - Slovak (%)
Ancestries Reported - Subsaharan African (%)
Ancestries Reported - Swedish (%)
Ancestries Reported - Swiss (%)
Ancestries Reported - Ukrainian (%)
Ancestries Reported - United States (%)
Ancestries Reported - Welsh (%)
Ancestries Reported - West Indian (%)
Ancestries Reported - Other (%)
Educational Attainment - No schooling completed (%)
Educational Attainment - Less than high school (%)
Educational Attainment - High school or equivalent (%)
Educational Attainment - Less than 1 year of college (%)
Educational Attainment - 1 or more years of college (%)
Educational Attainment - Associate degree (%)
Educational Attainment - Bachelor's degree (%)
Educational Attainment - Master's degree (%)
Educational Attainment - Professional school degree (%)
Educational Attainment - Doctorate degree (%)
School Enrollment - Nursery, preschool (%)
School Enrollment - Kindergarten (%)
School Enrollment - Grade 1 to 4 (%)
School Enrollment - Grade 5 to 8 (%)
School Enrollment - Grade 9 to 12 (%)
School Enrollment - College undergrad (%)
School Enrollment - Graduate or professional (%)
School Enrollment - Not enrolled in school (%)
School enrollment - Public schools (%)
School enrollment - Private schools (%)
School enrollment - Not enrolled (%)
Median number of rooms in houses and condos
Median number of rooms in apartments
Housing units lacking complete plumbing facilities (%)
Housing units lacking complete kitchen facilities (%)
Density of houses
Urban houses (%)
Rural houses (%)
Households with people 60 years and over (%)
Households with people 65 years and over (%)
Households with people 75 years and over (%)
Households with one or more nonrelatives (%)
Households with no nonrelatives (%)
Population in households (%)
Family households (%)
Nonfamily households (%)
Population in families (%)
Family households with own children (%)
Median number of bedrooms in owner occupied houses
Mean number of bedrooms in owner occupied houses
Median number of bedrooms in renter occupied houses
Mean number of bedrooms in renter occupied houses
Median number of vehichles in owner occupied houses
Mean number of vehichles in owner occupied houses
Median number of vehichles in renter occupied houses
Mean number of vehichles in renter occupied houses
Mortgage status - with mortgage (%)
Mortgage status - with second mortgage (%)
Mortgage status - with home equity loan (%)
Mortgage status - with both second mortgage and home equity loan (%)
Mortgage status - without a mortgage (%)
Average family size
Average family size - White
Average family size - Black or African American
Average family size - Asian
Average family size - Hispanic or Latino
Average family size - American Indian and Alaska Native
Average family size - Multirace
Average family size - Other Race
Geographical mobility - Same house 1 year ago (%)
Geographical mobility - Moved within same county (%)
Geographical mobility - Moved from different county within same state (%)
Geographical mobility - Moved from different state (%)
Geographical mobility - Moved from abroad (%)
Place of birth - Born in state of residence (%)
Place of birth - Born in other state (%)
Place of birth - Native, outside of US (%)
Place of birth - Foreign born (%)
Housing units in structures - 1, detached (%)
Housing units in structures - 1, attached (%)
Housing units in structures - 2 (%)
Housing units in structures - 3 or 4 (%)
Housing units in structures - 5 to 9 (%)
Housing units in structures - 10 to 19 (%)
Housing units in structures - 20 to 49 (%)
Housing units in structures - 50 or more (%)
Housing units in structures - Mobile home (%)
Housing units in structures - Boat, RV, van, etc. (%)
House/condo owner moved in on average (years ago)
Renter moved in on average (years ago)
Year householder moved into unit - Moved in 1999 to March 2000 (%)
Year householder moved into unit - Moved in 1995 to 1998 (%)
Year householder moved into unit - Moved in 1990 to 1994 (%)
Year householder moved into unit - Moved in 1980 to 1989 (%)
Year householder moved into unit - Moved in 1970 to 1979 (%)
Year householder moved into unit - Moved in 1969 or earlier (%)
Means of transportation to work - Drove car alone (%)
Means of transportation to work - Carpooled (%)
Means of transportation to work - Public transportation (%)
Means of transportation to work - Bus or trolley bus (%)
Means of transportation to work - Streetcar or trolley car (%)
Means of transportation to work - Subway or elevated (%)
Means of transportation to work - Railroad (%)
Means of transportation to work - Ferryboat (%)
Means of transportation to work - Taxicab (%)
Means of transportation to work - Motorcycle (%)
Means of transportation to work - Bicycle (%)
Means of transportation to work - Walked (%)
Means of transportation to work - Other means (%)
Working at home (%)
Industry diversity
Most Common Industries - Agriculture, forestry, fishing and hunting, and mining (%)
Most Common Industries - Agriculture, forestry, fishing and hunting (%)
Most Common Industries - Mining, quarrying, and oil and gas extraction (%)
Most Common Industries - Construction (%)
Most Common Industries - Manufacturing (%)
Most Common Industries - Wholesale trade (%)
Most Common Industries - Retail trade (%)
Most Common Industries - Transportation and warehousing, and utilities (%)
Most Common Industries - Transportation and warehousing (%)
Most Common Industries - Utilities (%)
Most Common Industries - Information (%)
Most Common Industries - Finance and insurance, and real estate and rental and leasing (%)
Most Common Industries - Finance and insurance (%)
Most Common Industries - Real estate and rental and leasing (%)
Most Common Industries - Professional, scientific, and management, and administrative and waste management services (%)
Most Common Industries - Professional, scientific, and technical services (%)
Most Common Industries - Management of companies and enterprises (%)
Most Common Industries - Administrative and support and waste management services (%)
Most Common Industries - Educational services, and health care and social assistance (%)
Most Common Industries - Educational services (%)
Most Common Industries - Health care and social assistance (%)
Most Common Industries - Arts, entertainment, and recreation, and accommodation and food services (%)
Most Common Industries - Arts, entertainment, and recreation (%)
Most Common Industries - Accommodation and food services (%)
Most Common Industries - Other services, except public administration (%)
Most Common Industries - Public administration (%)
Occupation diversity
Most Common Occupations - Management, business, science, and arts occupations (%)
Most Common Occupations - Management, business, and financial occupations (%)
Most Common Occupations - Management occupations (%)
Most Common Occupations - Business and financial operations occupations (%)
Most Common Occupations - Computer, engineering, and science occupations (%)
Most Common Occupations - Computer and mathematical occupations (%)
Most Common Occupations - Architecture and engineering occupations (%)
Most Common Occupations - Life, physical, and social science occupations (%)
Most Common Occupations - Education, legal, community service, arts, and media occupations (%)
Most Common Occupations - Community and social service occupations (%)
Most Common Occupations - Legal occupations (%)
Most Common Occupations - Education, training, and library occupations (%)
Most Common Occupations - Arts, design, entertainment, sports, and media occupations (%)
Most Common Occupations - Healthcare practitioners and technical occupations (%)
Most Common Occupations - Health diagnosing and treating practitioners and other technical occupations (%)
Most Common Occupations - Health technologists and technicians (%)
Most Common Occupations - Service occupations (%)
Most Common Occupations - Healthcare support occupations (%)
Most Common Occupations - Protective service occupations (%)
Most Common Occupations - Fire fighting and prevention, and other protective service workers including supervisors (%)
Most Common Occupations - Law enforcement workers including supervisors (%)
Most Common Occupations - Food preparation and serving related occupations (%)
Most Common Occupations - Building and grounds cleaning and maintenance occupations (%)
Most Common Occupations - Personal care and service occupations (%)
Most Common Occupations - Sales and office occupations (%)
Most Common Occupations - Sales and related occupations (%)
Most Common Occupations - Office and administrative support occupations (%)
Most Common Occupations - Natural resources, construction, and maintenance occupations (%)
Most Common Occupations - Farming, fishing, and forestry occupations (%)
Most Common Occupations - Construction and extraction occupations (%)
Most Common Occupations - Installation, maintenance, and repair occupations (%)
Most Common Occupations - Production, transportation, and material moving occupations (%)
Most Common Occupations - Production occupations (%)
Most Common Occupations - Transportation occupations (%)
Most Common Occupations - Material moving occupations (%)
People in Group quarters - Institutionalized population (%)
People in Group quarters - Correctional institutions (%)
People in Group quarters - Federal prisons and detention centers (%)
People in Group quarters - Halfway houses (%)
People in Group quarters - Local jails and other confinement facilities (including police lockups) (%)
People in Group quarters - Military disciplinary barracks (%)
People in Group quarters - State prisons (%)
People in Group quarters - Other types of correctional institutions (%)
People in Group quarters - Nursing homes (%)
People in Group quarters - Hospitals/wards, hospices, and schools for the handicapped (%)
People in Group quarters - Hospitals/wards and hospices for chronically ill (%)
People in Group quarters - Hospices or homes for chronically ill (%)
People in Group quarters - Military hospitals or wards for chronically ill (%)
People in Group quarters - Other hospitals or wards for chronically ill (%)
People in Group quarters - Hospitals or wards for drug/alcohol abuse (%)
People in Group quarters - Mental (Psychiatric) hospitals or wards (%)
People in Group quarters - Schools, hospitals, or wards for the mentally retarded (%)
People in Group quarters - Schools, hospitals, or wards for the physically handicapped (%)
People in Group quarters - Institutions for the deaf (%)
People in Group quarters - Institutions for the blind (%)
People in Group quarters - Orthopedic wards and institutions for the physically handicapped (%)
People in Group quarters - Wards in general hospitals for patients who have no usual home elsewhere (%)
People in Group quarters - Wards in military hospitals for patients who have no usual home elsewhere (%)
People in Group quarters - Juvenile institutions (%)
People in Group quarters - Long-term care (%)
People in Group quarters - Homes for abused, dependent, and neglected children (%)
People in Group quarters - Residential treatment centers for emotionally disturbed children (%)
People in Group quarters - Training schools for juvenile delinquents (%)
People in Group quarters - Short-term care, detention or diagnostic centers for delinquent children (%)
People in Group quarters - Type of juvenile institution unknown (%)
People in Group quarters - Noninstitutionalized population (%)
People in Group quarters - College dormitories (includes college quarters off campus) (%)
People in Group quarters - Military quarters (%)
People in Group quarters - On base (%)
People in Group quarters - Barracks, unaccompanied personnel housing (UPH), (Enlisted/Officer), ;and similar group living quarters for military personnel (%)
People in Group quarters - Transient quarters for temporary residents (%)
People in Group quarters - Military ships (%)
People in Group quarters - Group homes (%)
People in Group quarters - Homes or halfway houses for drug/alcohol abuse (%)
People in Group quarters - Homes for the mentally ill (%)
People in Group quarters - Homes for the mentally retarded (%)
People in Group quarters - Homes for the physically handicapped (%)
People in Group quarters - Other group homes (%)
People in Group quarters - Religious group quarters (%)
People in Group quarters - Dormitories (%)
People in Group quarters - Agriculture workers' dormitories on farms (%)
People in Group quarters - Job Corps and vocational training facilities (%)
People in Group quarters - Other workers' dormitories (%)
People in Group quarters - Crews of maritime vessels (%)
People in Group quarters - Other nonhousehold living situations (%)
People in Group quarters - Other noninstitutional group quarters (%)
Residents speaking English at home (%)
Residents speaking English at home - Born in the United States (%)
Residents speaking English at home - Native, born elsewhere (%)
Residents speaking English at home - Foreign born (%)
Residents speaking Spanish at home (%)
Residents speaking Spanish at home - Born in the United States (%)
Residents speaking Spanish at home - Native, born elsewhere (%)
Residents speaking Spanish at home - Foreign born (%)
Residents speaking other language at home (%)
Residents speaking other language at home - Born in the United States (%)
Residents speaking other language at home - Native, born elsewhere (%)
Residents speaking other language at home - Foreign born (%)
Class of Workers - Employee of private company (%)
Class of Workers - Self-employed in own incorporated business (%)
Class of Workers - Private not-for-profit wage and salary workers (%)
Class of Workers - Local government workers (%)
Class of Workers - State government workers (%)
Class of Workers - Federal government workers (%)
Class of Workers - Self-employed workers in own not incorporated business and Unpaid family workers (%)
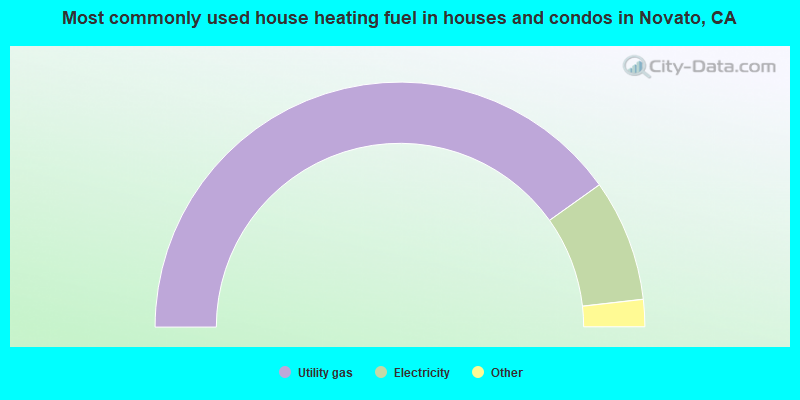
House heating fuel used in houses and condos - Utility gas (%)
House heating fuel used in houses and condos - Bottled, tank, or LP gas (%)
House heating fuel used in houses and condos - Electricity (%)
House heating fuel used in houses and condos - Fuel oil, kerosene, etc. (%)
House heating fuel used in houses and condos - Coal or coke (%)
House heating fuel used in houses and condos - Wood (%)
House heating fuel used in houses and condos - Solar energy (%)
House heating fuel used in houses and condos - Other fuel (%)
House heating fuel used in houses and condos - No fuel used (%)
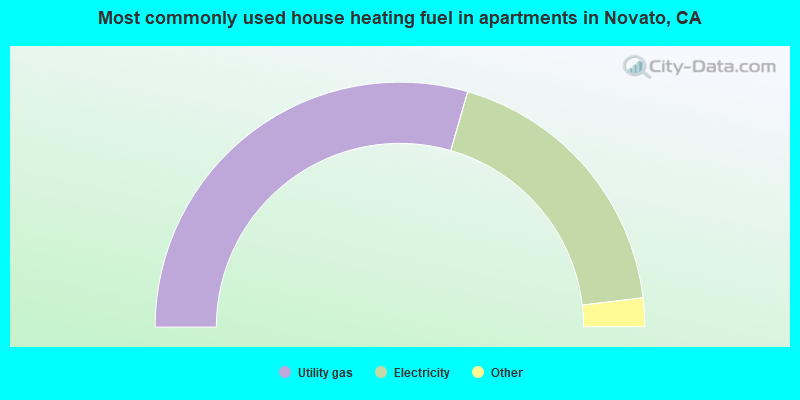
House heating fuel used in apartments - Utility gas (%)
House heating fuel used in apartments - Bottled, tank, or LP gas (%)
House heating fuel used in apartments - Electricity (%)
House heating fuel used in apartments - Fuel oil, kerosene, etc. (%)
House heating fuel used in apartments - Coal or coke (%)
House heating fuel used in apartments - Wood (%)
House heating fuel used in apartments - Solar energy (%)
House heating fuel used in apartments - Other fuel (%)
House heating fuel used in apartments - No fuel used (%)
Armed forces status - In Armed Forces (%)
Armed forces status - Civilian (%)
Armed forces status - Civilian - Veteran (%)
Armed forces status - Civilian - Nonveteran (%)
Fatal accidents locations in years 2005-2021
Fatal accidents locations in 2005
Fatal accidents locations in 2006
Fatal accidents locations in 2007
Fatal accidents locations in 2008
Fatal accidents locations in 2009
Fatal accidents locations in 2010
Fatal accidents locations in 2011
Fatal accidents locations in 2012
Fatal accidents locations in 2013
Fatal accidents locations in 2014
Fatal accidents locations in 2015
Fatal accidents locations in 2016
Fatal accidents locations in 2017
Fatal accidents locations in 2018
Fatal accidents locations in 2019
Fatal accidents locations in 2020
Fatal accidents locations in 2021
Alcohol use - People drinking some alcohol every month (%)
Alcohol use - People not drinking at all (%)
Alcohol use - Average days/month drinking alcohol
Alcohol use - Average drinks/week
Alcohol use - Average days/year people drink much
Audiometry - Average condition of hearing (%)
Audiometry - People that can hear a whisper from across a quiet room (%)
Audiometry - People that can hear normal voice from across a quiet room (%)
Audiometry - Ears ringing, roaring, buzzing (%)
Audiometry - Had a job exposure to loud noise (%)
Audiometry - Had off-work exposure to loud noise (%)
Blood Pressure & Cholesterol - Has high blood pressure (%)
Blood Pressure & Cholesterol - Checking blood pressure at home (%)
Blood Pressure & Cholesterol - Frequently checking blood cholesterol (%)
Blood Pressure & Cholesterol - Has high cholesterol level (%)
Consumer Behavior - Money monthly spent on food at supermarket/grocery store
Consumer Behavior - Money monthly spent on food at other stores
Consumer Behavior - Money monthly spent on eating out
Consumer Behavior - Money monthly spent on carryout/delivered foods
Consumer Behavior - Income spent on food at supermarket/grocery store (%)
Consumer Behavior - Income spent on food at other stores (%)
Consumer Behavior - Income spent on eating out (%)
Consumer Behavior - Income spent on carryout/delivered foods (%)
Current Health Status - General health condition (%)
Current Health Status - Blood donors (%)
Current Health Status - Has blood ever tested for HIV virus (%)
Current Health Status - Left-handed people (%)
Dermatology - People using sunscreen (%)
Diabetes - Diabetics (%)
Diabetes - Had a blood test for high blood sugar (%)
Diabetes - People taking insulin (%)
Diet Behavior & Nutrition - Diet health (%)
Diet Behavior & Nutrition - Milk product consumption (# of products/month)
Diet Behavior & Nutrition - Meals not home prepared (#/week)
Diet Behavior & Nutrition - Meals from fast food or pizza place (#/week)
Diet Behavior & Nutrition - Ready-to-eat foods (#/month)
Diet Behavior & Nutrition - Frozen meals/pizza (#/month)
Drug Use - People that ever used marijuana or hashish (%)
Drug Use - Ever used hard drugs (%)
Drug Use - Ever used any form of cocaine (%)
Drug Use - Ever used heroin (%)
Drug Use - Ever used methamphetamine (%)
Health Insurance - People covered by health insurance (%)
Kidney Conditions-Urology - Avg. # of times urinating at night
Medical Conditions - People with asthma (%)
Medical Conditions - People with anemia (%)
Medical Conditions - People with psoriasis (%)
Medical Conditions - People with overweight (%)
Medical Conditions - Elderly people having difficulties in thinking or remembering (%)
Medical Conditions - People who ever received blood transfusion (%)
Medical Conditions - People having trouble seeing even with glass/contacts (%)
Medical Conditions - People with arthritis (%)
Medical Conditions - People with gout (%)
Medical Conditions - People with congestive heart failure (%)
Medical Conditions - People with coronary heart disease (%)
Medical Conditions - People with angina pectoris (%)
Medical Conditions - People who ever had heart attack (%)
Medical Conditions - People who ever had stroke (%)
Medical Conditions - People with emphysema (%)
Medical Conditions - People with thyroid problem (%)
Medical Conditions - People with chronic bronchitis (%)
Medical Conditions - People with any liver condition (%)
Medical Conditions - People who ever had cancer or malignancy (%)
Mental Health - People who have little interest in doing things (%)
Mental Health - People feeling down, depressed, or hopeless (%)
Mental Health - People who have trouble sleeping or sleeping too much (%)
Mental Health - People feeling tired or having little energy (%)
Mental Health - People with poor appetite or overeating (%)
Mental Health - People feeling bad about themself (%)
Mental Health - People who have trouble concentrating on things (%)
Mental Health - People moving or speaking slowly or too fast (%)
Mental Health - People having thoughts they would be better off dead (%)
Oral Health - Average years since last visit a dentist
Oral Health - People embarrassed because of mouth (%)
Oral Health - People with gum disease (%)
Oral Health - General health of teeth and gums (%)
Oral Health - Average days a week using dental floss/device
Oral Health - Average days a week using mouthwash for dental problem
Oral Health - Average number of teeth
Pesticide Use - Households using pesticides to control insects (%)
Pesticide Use - Households using pesticides to kill weeds (%)
Physical Activity - People doing vigorous-intensity work activities (%)
Physical Activity - People doing moderate-intensity work activities (%)
Physical Activity - People walking or bicycling (%)
Physical Activity - People doing vigorous-intensity recreational activities (%)
Physical Activity - People doing moderate-intensity recreational activities (%)
Physical Activity - Average hours a day doing sedentary activities
Physical Activity - Average hours a day watching TV or videos
Physical Activity - Average hours a day using computer
Physical Functioning - People having limitations keeping them from working (%)
Physical Functioning - People limited in amount of work they can do (%)
Physical Functioning - People that need special equipment to walk (%)
Physical Functioning - People experiencing confusion/memory problems (%)
Physical Functioning - People requiring special healthcare equipment (%)
Prescription Medications - Average number of prescription medicines taking
Preventive Aspirin Use - Adults 40+ taking low-dose aspirin (%)
Reproductive Health - Vaginal deliveries (%)
Reproductive Health - Cesarean deliveries (%)
Reproductive Health - Deliveries resulted in a live birth (%)
Reproductive Health - Pregnancies resulted in a delivery (%)
Reproductive Health - Women breastfeeding newborns (%)
Reproductive Health - Women that had a hysterectomy (%)
Reproductive Health - Women that had both ovaries removed (%)
Reproductive Health - Women that have ever taken birth control pills (%)
Reproductive Health - Women taking birth control pills (%)
Reproductive Health - Women that have ever used Depo-Provera or injectables (%)
Reproductive Health - Women that have ever used female hormones (%)
Sexual Behavior - People 18+ that ever had sex (vaginal, anal, or oral) (%)
Sexual Behavior - Males 18+ that ever had vaginal sex with a woman (%)
Sexual Behavior - Males 18+ that ever performed oral sex on a woman (%)
Sexual Behavior - Males 18+ that ever had anal sex with a woman (%)
Sexual Behavior - Males 18+ that ever had any sex with a man (%)
Sexual Behavior - Females 18+ that ever had vaginal sex with a man (%)
Sexual Behavior - Females 18+ that ever performed oral sex on a man (%)
Sexual Behavior - Females 18+ that ever had anal sex with a man (%)
Sexual Behavior - Females 18+ that ever had any kind of sex with a woman (%)
Sexual Behavior - Average age people first had sex
Sexual Behavior - Average number of female sex partners in lifetime (males 18+)
Sexual Behavior - Average number of female vaginal sex partners in lifetime (males 18+)
Sexual Behavior - Average age people first performed oral sex on a woman (18+)
Sexual Behavior - Average number of woman performed oral sex on in lifetime (18+)
Sexual Behavior - Average number of male sex partners in lifetime (males 18+)
Sexual Behavior - Average number of male anal sex partners in lifetime (males 18+)
Sexual Behavior - Average age people first performed oral sex on a man (18+)
Sexual Behavior - Average number of male oral sex partners in lifetime (18+)
Sexual Behavior - People using protection when performing oral sex (%)
Sexual Behavior - Average number of times people have vaginal or anal sex a year
Sexual Behavior - People having sex without condom (%)
Sexual Behavior - Average number of male sex partners in lifetime (females 18+)
Sexual Behavior - Average number of male vaginal sex partners in lifetime (females 18+)
Sexual Behavior - Average number of female sex partners in lifetime (females 18+)
Sexual Behavior - Circumcised males 18+ (%)
Sleep Disorders - Average hours sleeping at night
Sleep Disorders - People that has trouble sleeping (%)
Smoking-Cigarette Use - People smoking cigarettes (%)
Taste & Smell - People 40+ having problems with smell (%)
Taste & Smell - People 40+ having problems with taste (%)
Taste & Smell - People 40+ that ever had wisdom teeth removed (%)
Taste & Smell - People 40+ that ever had tonsils teeth removed (%)
Taste & Smell - People 40+ that ever had a loss of consciousness because of a head injury (%)
Taste & Smell - People 40+ that ever had a broken nose or other serious injury to face or skull (%)
Taste & Smell - People 40+ that ever had two or more sinus infections (%)
Weight - Average height (inches)
Weight - Average weight (pounds)
Weight - Average BMI
Weight - People that are obese (%)
Weight - People that ever were obese (%)
Weight - People trying to lose weight (%)
30,908 59.3% White alone 12,007 23.0% Hispanic 3,954 7.6% Asian alone 2,927 5.6% Two or more races 1,979 3.8% Black alone 676 1.3% Other race alone 70 0.1% American Indian alone 25 0.05% Native Hawaiian and Other
According to our research of California and other state lists, there were 34 registered sex offenders living in Novato, California as of April 27, 2024 . The ratio of all residents to sex offenders in Novato is 1,620 to 1.The ratio of registered sex offenders to all residents in this city is lower than the state average.
The City-Data.com crime index weighs serious crimes and violent crimes more heavily. Higher means more crime, U.S. average is 246.1. It adjusts for the number of visitors and daily workers commuting into cities.
- means the value is smaller than the state average.
- means the value is about the same as the state average.
- means the value is bigger than the state average.
Crime rate in Novato detailed stats: murders, rapes, robberies, assaults, burglaries, thefts, arson Officers per 1,000 residents here:
1.03California average:
2.30
Latest news from Novato, CA collected exclusively by city-data.com from local newspapers, TV, and radio stations
Ancestries: Irish (6.4%), English (5.7%), Italian (5.5%), German (5.0%), European (4.1%), American (3.9%).
Current Local Time:
Land area: 27.7 square miles.
Population density: 1,884 people per square mile (low).
11,208 residents are foreign born (10.1% Latin America , 5.4% Asia , 4.2% Europe ).
This city:
21.5%California:
26.5%
Median real estate property taxes paid for housing units with mortgages in 2022: $8,804 (0.8%)Median real estate property taxes paid for housing units with no mortgage in 2022: $5,362 (0.6%)
Nearest city with pop. 50,000+: Northeast Marin, CA (0.3 miles
Nearest city with pop. 200,000+: West Contra Costa, CA (16.4 miles
Nearest city with pop. 1,000,000+: Los Angeles, CA
Nearest cities:
Nicasio, CA (2.7 miles),
Latitude: 38.09 N, Longitude: 122.57 W
Daytime population change due to commuting: -1,842 (-3.5%)Workers who live and work in this city: 11,519 (48.0%)
Novato tourist attractions:
Single-family new house construction building permits:
2022: 76 buildings , average cost: $218,1002021: 47 buildings , average cost: $312,7002020: 27 buildings , average cost: $347,1002019: 75 buildings , average cost: $279,8002018: 14 buildings , average cost: $406,3002017: 6 buildings , average cost: $975,1002016: 10 buildings , average cost: $459,3002015: 104 buildings , average cost: $307,4002014: 90 buildings , average cost: $307,4002013: 91 buildings , average cost: $307,4002012: 75 buildings , average cost: $307,4002011: 52 buildings , average cost: $307,4002010: 59 buildings , average cost: $307,4002009: 57 buildings , average cost: $307,4002008: 79 buildings , average cost: $307,3002007: 159 buildings , average cost: $307,8002006: 242 buildings , average cost: $306,1002005: 319 buildings , average cost: $311,7002004: 366 buildings , average cost: $294,6002003: 457 buildings , average cost: $229,9002002: 133 buildings , average cost: $295,8002001: 55 buildings , average cost: $334,8002000: 268 buildings , average cost: $311,5001999: 497 buildings , average cost: $198,7001998: 276 buildings , average cost: $199,0001997: 41 buildings , average cost: $257,700Unemployment in December 2023:
Population change in the 1990s: +73 (+0.2%).
Most common occupations in Novato, CA (%)
Both Males Females
Other management occupations, except farmers and farm managers (6.3%)
Other sales and related occupations, including supervisors (4.8%)
Sales representatives, services, wholesale and manufacturing (4.4%)
Computer specialists (4.3%)
Other office and administrative support workers, including supervisors (4.0%)
Retail sales workers, except cashiers (3.4%)
Secretaries and administrative assistants (3.4%)
Other management occupations, except farmers and farm managers (7.3%)
Computer specialists (5.4%)
Other sales and related occupations, including supervisors (4.9%)
Sales representatives, services, wholesale and manufacturing (4.8%)
Top executives (4.0%)
Building and grounds cleaning and maintenance occupations (3.7%)
Retail sales workers, except cashiers (3.0%)
Secretaries and administrative assistants (6.7%)
Other office and administrative support workers, including supervisors (6.5%)
Other management occupations, except farmers and farm managers (5.3%)
Preschool, kindergarten, elementary, and middle school teachers (4.7%)
Other sales and related occupations, including supervisors (4.6%)
Sales representatives, services, wholesale and manufacturing (3.9%)
Registered nurses (3.9%)
Earthquake activity:
Novato-area historical earthquake activity is significantly above California state average. It is 7373% greater than the overall U.S. average. On 4/18/1906 at 13:12:21, a magnitude 7.9 (7.9 UK, Class: Major, Intensity: VIII - XII) earthquake occurred 24.5 miles away from the city center, causing $524,000,000 total damage On 10/18/1989 at 00:04:15, a magnitude 7.1 (6.5 MB, 7.1 MS, 6.9 MW, 7.0 ML) earthquake occurred 80.8 miles away from Novato center, causing 62 deaths ( 62 shaking deaths) and 3757 injuries, causing $1,305,032,704 total damage On 1/31/1922 at 13:17:28, a magnitude 7.6 (7.6 UK) earthquake occurred 240.8 miles away from Novato center On 11/4/1927 at 13:51:53, a magnitude 7.5 (7.5 UK) earthquake occurred 235.8 miles away from Novato center On 4/25/1992 at 18:06:04, a magnitude 7.2 (6.3 MB, 7.1 MS, 7.2 MW, 7.1 MW, Depth: 9.4 mi) earthquake occurred 175.6 miles away from Novato center, causing $75,000,000 total damage On 7/21/1952 at 11:52:14, a magnitude 7.7 (7.7 UK) earthquake occurred 291.5 miles away from Novato center, causing $50,000,000 total damage Magnitude types: body-wave magnitude (MB), local magnitude (ML), surface-wave magnitude (MS), moment magnitude (MW) Natural disasters: The number of natural disasters in Marin County (22) is greater than the US average (15).Major Disasters (Presidential) Declared: 15Emergencies Declared: 2Floods: 17, Storms: 9, Mudslides: 7, Winter Storms: 7, Landslides: 6, Drought: 1, Earthquake: 1, Freeze: 1, Heavy Rain: 1, Hurricane: 1, Tornado: 1, Other: 1 (Note: some incidents may be assigned to more than one category). Main business address for: BIOMARIN PHARMACEUTICAL INC PHARMACEUTICAL PREPARATIONS ), SPATIALIGHT INC PHOTOGRAPHIC EQUIPMENT & SUPPLIES ), HALL KINION & ASSOCIATES INC SERVICES-HELP SUPPLY SERVICES ), SONIC SOLUTIONS/CA/ SERVICES-COMPUTER INTEGRATED SYSTEMS DESIGN ).
Hospitals and medical centers in Novato: MILES - CENTER ROAD HOUSE (1649 CENTER ROAD) NOVATO COMMUNITY HOSPITAL (Voluntary non-profit - Other, 180 ROWLAND WAY) OUR LADY OF PEACE HOSPICE (100 MEDICAL PLAZA CIRCLE, #112) SUNRISE I (627 WILSON AVENUE) KAISER FOUNDATION HOSPITAL HOME HEALTH - NOVATO (7200 REDWOOD BOULEVARD, SUITE 200)
CANYON MANOR (655 CANYON ROAD)
NOVATO COMMUNITY HOSPITAL (1625 HILL ROAD)
NOVATO HEALTHCARE CENTER (1565 HILL ROAD)
Airports located in Novato: Amtrak stations near Novato: 11 miles: PETALUMA (100 FAIRGROUNDS DR.) - Bus Station Services: snack bar, free short-term parking, free long-term parking, call for taxi service.
16 miles: RICHMOND (16TH ST. & MACDONALD AVE.) Services: fully wheelchair accessible, enclosed waiting area, public restrooms, public payphones, free short-term parking, call for taxi service, public transit connection.
19 miles: VALLEJO-MARINE WORLD (VALLEJO, 1000 FAIRGROUNDS DR.) - Bus Station Services: fully wheelchair accessible, public restrooms, public payphones, snack bar, free short-term parking, free long-term parking, call for taxi service.
Colleges/universities with over 2000 students nearest to Novato:
College of Marin (about 10 miles; Kentfield, CA ; Full-time enrollment: 4,489)
Contra Costa College (about 15 miles; San Pablo, CA ; FT enrollment: 4,249)
Sonoma State University (about 19 miles; Rohnert Park, CA ; FT enrollment: 7,796)
Napa Valley College (about 21 miles; Napa, CA ; FT enrollment: 3,780)
Berkeley City College (about 23 miles; Berkeley, CA ; FT enrollment: 3,146)
University of California-Berkeley (about 23 miles; Berkeley, CA ; FT enrollment: 37,127)
University of San Francisco (about 23 miles; San Francisco, CA ; FT enrollment: 9,190)
Public high schools in Novato: NOVATO HIGH Students: 909, Location: 625 ARTHUR ST., Grades: 9-12)SAN MARIN HIGH Students: 669, Location: 15 SAN MARIN DR., Grades: 9-12)NOVA EDUCATION CENTER Students: 38, Location: 720 DIABLO BLVD., Grades: KG-12)MARIN OAKS HIGH Students: 30, Location: 720 DIABLO AVE., Grades: 9-12)NEXUS ACADEMY Location: 720 DIABLO AVE., Grades: 7-10)
Biggest public elementary/middle schools in Novato: SINALOA MIDDLE Students: 642, Location: 2045 VINEYARD RD., Grades: 6-8)RANCHO ELEMENTARY Students: 339, Location: 1430 JOHNSON ST., Grades: KG-5)HAMILTON MEADOW PARK Students: 316, Location: 1 MAIN GATE RD., Grades: KG-8)SAN RAMON ELEMENTARY Students: 312, Location: 45 SAN RAMON WAY, Grades: KG-5)LU SUTTON ELEMENTARY Students: 275, Location: 1800 CENTER RD., Grades: KG-5)OLIVE ELEMENTARY Students: 254, Location: 629 PLUM ST., Grades: KG-5)LYNWOOD ELEMENTARY Students: 241, Location: 1320 LYNWOOD DR., Grades: KG-5)PLEASANT VALLEY ELEMENTARY Students: 225, Location: 755 SUTRO AVE., Grades: KG-5)LOMA VERDE ELEMENTARY Students: 216, Location: 399 ALAMEDA DE LA LOMA, Grades: KG-5)NOVATO CHARTER Students: 170, Location: 940 C ST., Grades: KG-8, Charter school )Private elementary/middle schools in Novato: GOOD SHEPHERD LUTHERAN SCHOOL Students: 284, Location: 1180 LYNWOOD DR, Grades: PK-8)
OUR LADY OF LORETTO SCHOOL Students: 229, Location: 1811 VIRGINIA AVE, Grades: KG-8)
MARIN CHRISTIAN ACADEMY Students: 204, Location: 1370 S NOVATO BLVD, Grades: PK-8)
See full list of schools located in Novato User-submitted facts and corrections:
Hospital/medical center in Novato: NOVATO COMMUNITY HOSPITAL (165 Rowland Way)
the hospital has moved from hill road to the vintage oaks area
the hospital has moved from hill road to the vintage oaks area
Notable locations in Novato: (A) , Morning Star Farms (B) , Marin Country Club (C) , Rolling Hills Country Club (D) , Novato Youth Center (E) , Novato Regional Branch Marin County Free Library (F) , Novato Human Needs Center (G) , Novato City Hall (H) , Marin Museum of the American Indian (I) , Indian Valley Colleges Library (J) , Novato Fire Protection District Station 3 (K) , Novato Fire Protection District Station 5 (L) , Novato Fire Protection District Station 4 (M) , Novato Fire Protection District Station 1 (N) . Display/hide their locations on the map
Shopping Centers: (1) , Tresch-Triangle Shopping Center (2) , The Square Shopping Center (3) , Novato Fair Shopping Center (4) , Nave Shopping Center (5) , Downtown Novato Shopping Center (6) , Pacheco Plaza Shopping Center (7) , Ignacio Center Shopping Center (8) , Del Prado Shopping Center (9) . Display/hide their locations on the map
Main business address in Novato include: (A) , SPATIALIGHT INC (B) , HALL KINION & ASSOCIATES INC (C) , SONIC SOLUTIONS/CA/ (D) . Display/hide their locations on the map
Cemetery: (1) . Display/hide its location on the map
Reservoir: (A) . Display/hide its location on the map
Streams, rivers, and creeks: (A) , Arroyo Jan Jose (B) . Display/hide their locations on the map
Parks in Novato include: (1) , Partridge Knolls Mini Park (2) , Arroyo Avichi Park (3) , Deer Island Preserve (4) , Hamann Field (5) , Hill Park (6) , Ignacio Valley Preserve (7) , Indian Valley Preserve (8) , Josef Hoog Park (9) . Display/hide their locations on the map
Hotels: (1) , Amish Country Cookies (75 Digital Drive) (2) . Display/hide their approximate locations on the map
Birthplace of: Brande Roderick - Television actor, Bret Bergmark - Martial artist, Brad Muster - College football player, Brent Moore - Football linebacker.
Marin County has a predicted average indoor radon screening level less than 2 pCi/L (pico curies per liter) - Low Potential Drinking water stations with addresses in Novato that have no violations reported:
LAKE DEATON TR PK (Serves FL, Population served: 90, Primary Water Source Type: Groundwater)
MARINER COVE MARINA (Population served: 80, Primary Water Source Type: Groundwater)
Average household size: This city:
2.5 peopleCalifornia:
2.9 people
Percentage of family households: This city:
66.5%Whole state:
68.7%
Percentage of households with unmarried partners: This city:
5.9%Whole state:
7.2%
Likely homosexual households (counted as self-reported same-sex unmarried-partner households)
Lesbian couples: 0.6% of all households Gay men: 0.4% of all households
People in group quarters in Novato in 2010:
175 people in nursing facilities/skilled-nursing facilities
139 people in group homes intended for adults
112 people in workers' group living quarters and job corps centers
111 people in residential treatment centers for adults
81 people in emergency and transitional shelters (with sleeping facilities) for people experiencing homelessness
6 people in other noninstitutional facilities
2 people in correctional residential facilities
People in group quarters in Novato in 2000:
521 people in nursing homes
140 people in other noninstitutional group quarters
132 people in homes for the mentally retarded
78 people in mental (psychiatric) hospitals or wards
37 people in homes or halfway houses for drug/alcohol abuse
26 people in other group homes
15 people in homes for the mentally ill
9 people in other workers' dormitories
7 people in wards in general hospitals for patients who have no usual home elsewhere
6 people in schools, hospitals, or wards for the intellectually disabled
6 people in residential treatment centers for emotionally disturbed children
5 people in religious group quarters
Banks with most branches in Novato (2011 data):
Bank of Marin: Bank Of Marin, Ignacio Branch, Novato Branch. Info updated 2011/02/22: Bank assets: $1,393.3 mil, Deposits: $1,206.0 mil, local headquarters , positive income , Commercial Lending Specialization, 18 total offices , Holding Company: Bank Of Marin Bancorp
Wells Fargo Bank, National Association: Diablo Avenue Branch, Novato Branch, Hamilton Gateway Branch. Info updated 2011/04/05: Bank assets: $1,161,490.0 mil, Deposits: $905,653.0 mil, headquarters in Sioux Falls, SD, positive income , 6395 total offices , Holding Company: Wells Fargo & Company
Westamerica Bank: Ignacio Branch at 402 Ignacio Boulevard, branch established on 1972/08/31; Novato Branch at 7333 Redwood Boulevard, branch established on 1964/11/13. Info updated 2011/06/21: Bank assets: $4,998.1 mil, Deposits: $4,253.2 mil, headquarters in San Rafael, CA, positive income , Commercial Lending Specialization, 98 total offices , Holding Company: Westamerica Bancorporation
JPMorgan Chase Bank, National Association: Novato Branch at 1595 Grant Avenue, branch established on 1889/01/01; 251 Vintage Wy Branch at 251 Vintage Way, branch established on 1919/01/01. Info updated 2011/11/10: Bank assets: $1,811,678.0 mil, Deposits: $1,190,738.0 mil, headquarters in Columbus, OH, positive income , International Specialization, 5577 total offices , Holding Company: Jpmorgan Chase & Co.
U.S. Bank National Association: Novato Downtown Branch at 1711 Grant Avenue, branch established on 1890/01/01; Nave & Ignacio Safeway at 5720 Nave Drive, branch established on 2008/08/22. Info updated 2012/01/30: Bank assets: $330,470.8 mil, Deposits: $236,091.5 mil, headquarters in Cincinnati, OH, positive income , 3121 total offices , Holding Company: U.S. Bancorp
Sterling Savings Bank: Novato Branch at 1555 Grant Avenue, branch established on 2007/03/01. Info updated 2012/03/21: Bank assets: $9,207.8 mil, Deposits: $6,454.1 mil, headquarters in Spokane, WA, positive income , Commercial Lending Specialization, 192 total offices , Holding Company: Sterling Financial Corporation
Citibank, National Association: Novato Branch at 1525 Grant Avenue, branch established on 1921/01/01. Info updated 2012/01/10: Bank assets: $1,288,658.0 mil, Deposits: $882,541.0 mil, headquarters in Sioux Falls, SD, positive income , International Specialization, 1048 total offices , Holding Company: Citigroup Inc.
Bank of America, National Association: Novato Branch at 1600 Grant Avenue, branch established on 1966/11/14. Info updated 2009/11/18: Bank assets: $1,451,969.3 mil, Deposits: $1,077,176.8 mil, headquarters in Charlotte, NC, positive income , 5782 total offices , Holding Company: Bank Of America Corporation
Circle Bank: at 1400 Grant Avenue, branch established on 1990/01/22. Info updated 2009/01/29: Bank assets: $316.2 mil, Deposits: $236.7 mil, local headquarters , positive income , Commercial Lending Specialization, 6 total offices
For population 15 years and over in Novato:
Never married: 28.8%Now married: 54.7%Separated: 1.3%Widowed: 4.9%Divorced: 10.3% For population 25 years and over in Novato:
High school or higher: 92.2%Bachelor's degree or higher: 48.4%Graduate or professional degree: 18.6%Unemployed: 3.6%Mean travel time to work (commute): 21.3 minutes
Education Gini index (Inequality in education) Here:
12.0California average:
15.5
Religion statistics for Novato, CA (based on Marin County data)
Religion Adherents Congregations Catholic 77,114 30 Other 12,119 50 Mainline Protestant 9,458 48 Evangelical Protestant 8,817 71 Orthodox 1,525 3 Black Protestant 775 2 None 142,601 -
Source: Clifford Grammich, Kirk Hadaway, Richard Houseal, Dale E.Jones, Alexei Krindatch, Richie Stanley and Richard H.Taylor. 2012. 2010 U.S.Religion Census: Religious Congregations & Membership Study. Association of Statisticians of American Religious Bodies. Jones, Dale E., et al. 2002. Congregations and Membership in the United States 2000. Nashville, TN: Glenmary Research Center. Graphs represent county-level data
Food Environment Statistics: Number of grocery stores : 64This county :
2.59 / 10,000 pop.State :
2.14 / 10,000 pop.
Number of supercenters and club stores : 1Here :
0.04 / 10,000 pop.California :
0.04 / 10,000 pop.
Number of convenience stores (no gas) : 15Here :
0.61 / 10,000 pop.State :
0.62 / 10,000 pop.
Number of convenience stores (with gas) : 32Marin County :
1.30 / 10,000 pop.California :
1.49 / 10,000 pop.
Number of full-service restaurants : 295Here :
11.95 / 10,000 pop.California :
7.42 / 10,000 pop.
Adult diabetes rate : Marin County :
7.0%California :
7.3%
Adult obesity rate : Marin County :
17.1%State :
21.3%
Low-income preschool obesity rate : Marin County :
17.1%State :
17.9%
Health and Nutrition: Healthy diet rate : Here:
50.7%California:
49.4%
Average overall health of teeth and gums : This city:
48.5%California:
48.0%
Average BMI : Novato:
28.4California:
28.1
People feeling badly about themselves : Here:
21.0%California:
20.2%
People not drinking alcohol at all : This city:
10.2%California:
11.2%
Average hours sleeping at night : Overweight people : This city:
34.1%California:
31.5%
General health condition : Average condition of hearing : More about Health and Nutrition of Novato, CA Residents
Local government employment and payroll (March 2022)
Function
Full-time employees
Monthly full-time payroll
Average yearly full-time wage
Part-time employees
Monthly part-time payroll
Police Protection - Officers
56 $699,971 $149,994 0 $0 Streets and Highways
38 $339,525 $107,218 0 $0 Financial Administration
20 $189,166 $113,500 0 $0 Housing and Community Development (Local)
19 $185,462 $117,134 2 $3,521 Police - Other
17 $148,594 $104,890 3 $7,498 Parks and Recreation
16 $115,964 $86,973 22 $21,678 Other Government Administration
10 $37,322 $44,786 0 $0 Other and Unallocable
7 $48,491 $83,127 0 $0
Totals for Government
183 $1,764,496 $115,705 27 $32,696
Novato government finances - Expenditure in 2021 (per resident):
Construction - General - Other: $3,733,000 ($71.54)
Regular Highways: $1,728,000 ($33.11)Current Operations - Police Protection: $14,105,000 ($270.29)
General - Other: $12,346,000 ($236.59)Central Staff Services: $11,577,000 ($221.85)Protective Inspection and Regulation - Other: $6,384,000 ($122.34)Regular Highways: $4,525,000 ($86.71)Parks and Recreation: $2,796,000 ($53.58)Parking Facilities: $951,000 ($18.22)Health - Other: $742,000 ($14.22)General - Interest on Debt: $3,678,000 ($70.48)
Novato government finances - Revenue in 2021 (per resident):
Charges - Other: $8,820,000 ($169.02)
Parks and Recreation: $871,000 ($16.69)Federal Intergovernmental - Other: $68,000 ($1.30)
Miscellaneous - Sale of Property: $5,668,000 ($108.62)
Fines and Forfeits: $1,056,000 ($20.24)Special Assessments: $535,000 ($10.25)General Revenue - Other: $304,000 ($5.83)Interest Earnings: $71,000 ($1.36)State Intergovernmental - Highways: $2,314,000 ($44.34)
General Local Government Support: $39,000 ($0.75)Other: $39,000 ($0.75)Tax - Property: $17,609,000 ($337.44)
General Sales and Gross Receipts: $17,065,000 ($327.02)Other License: $2,872,000 ($55.04)Other Selective Sales: $1,290,000 ($24.72)Occupation and Business License - Other: $1,216,000 ($23.30)Documentary and Stock Transfer: $568,000 ($10.88)
Novato government finances - Debt in 2021 (per resident):
Long Term Debt - Beginning Outstanding - Unspecified Public Purpose: $55,409,000 ($1061.80)
Outstanding Unspecified Public Purpose: $52,559,000 ($1007.19)Retired Unspecified Public Purpose: $2,850,000 ($54.61)
Novato government finances - Cash and Securities in 2021 (per resident):
Bond Funds - Cash and Securities: $7,733,000 ($148.19)
Other Funds - Cash and Securities: $78,352,000 ($1501.46)
Sinking Funds - Cash and Securities: $7,551,000 ($144.70)
Businesses in Novato, CA
Name Count Name Count
24 Hour Fitness 1 KFC 1 7-Eleven 2 Little Caesars Pizza 1 AT&T 3 Long John Silver's 1 Ace Hardware 1 Macy's 1 Ann Taylor 1 Marriott 1 Baskin-Robbins 1 Marshalls 1 Bath & Body Works 1 MasterBrand Cabinets 11 Best Western 1 McDonald's 2 Big O Tires 1 Men's Wearhouse 1 Blockbuster 1 Nike 6 Burger King 2 Old Navy 1 CVS 2 Payless 1 Carl\s Jr. 1 Penske 1 Chevrolet 1 Pier 1 Imports 1 Circle K 1 RadioShack 1 Costco 1 Rite Aid 1 Curves 1 Safeway 2 DHL 1 Sephora 1 Decora Cabinetry 3 Sprint Nextel 1 Eddie Bauer 1 Staples 1 FedEx 12 Starbucks 5 Ford 1 Subway 5 GNC 2 T-Mobile 2 GameStop 1 Taco Bell 2 Gymboree 1 Target 1 H&R Block 1 Toyota 1 IHOP 1 Trader Joe's 1 Jack In The Box 2 U-Haul 2 Jamba Juice 1 UPS 15 Jones New York 2 Vons 2 Justice 1 Whole Foods Market 1
Strongest AM radio stations in Novato:
KCBS (740 AM; 50 kW; SAN FRANCISCO, CA; Owner: INFINITY BROADCASTING OPERATIONS, INC.)
KTRB (860 AM; 50 kW; MODESTO, CA; Owner: PAPPAS RADIO OF CALIFORNIA, A CALIFORNIA LIMITED PARTNERSHIP)
KIQI (1010 AM; 35 kW; SAN FRANCISCO, CA; Owner: RADIO UNICA OF SAN FRANCISCO LICENSE CORP.)
KNEW (910 AM; 20 kW; OAKLAND, CA; Owner: AMFM RADIO LICENSES, L.L.C.)
KNBR (680 AM; 50 kW; SAN FRANCISCO, CA; Owner: KNBR LICO, INC.)
KTCT (1050 AM; 50 kW; SAN MATEO, CA; Owner: SUSQUEHANNA RADIO CORP.)
KFAX (1100 AM; 50 kW; SAN FRANCISCO, CA; Owner: GOLDEN GATE BROADCASTING CO, INC.)
KDYA (1190 AM; 10 kW; VALLEJO, CA; Owner: BAYBRIDGE COMMUNICATIONS, L.L.C.)
KGO (810 AM; 50 kW; SAN FRANCISCO, CA; Owner: KGO-AM RADIO, INC.)
KDIA (1640 AM; 10 kW; VALLEJO, CA; Owner: BAYBRIDGE COMMUNICATIONS, L.L.C.)
KYCY (1550 AM; 50 kW; SAN FRANCISCO, CA; Owner: INFINITY BROADCASTING OPERATIONS, INC.)
KFRC (610 AM; 5 kW; SAN FRANCISCO, CA; Owner: INFINITY BROADCASTING CORPORATION OF LOS ANGELES)
KSFO (560 AM; 5 kW; SAN FRANCISCO, CA; Owner: KGO-AM RADIO, INC.)
Strongest FM radio stations in Novato:
KSFB-FM (100.7 FM; SAN RAFAEL, CA; Owner: GOLDEN GATE BROADCASTING COMPANY, INC.)
KXFX-FM1 (101.7 FM; PETALUMA, CA; Owner: MAVERICK MEDIA OF SANTA ROSA LICENSE LLC)
KDFC-FM (102.1 FM; SAN FRANCISCO, CA; Owner: BONNEVILLE HOLDING COMPANY)
KWMR (90.5 FM; POINT REYES STATION, CA; Owner: WEST MARIN COMMUNITY RADIO, INC.)
KKSF-FM1 (103.7 FM; PLEASANTON, ETC., CA; Owner: AMFM RADIO LICENSES, L.L.C.)
KBLX-FM2 (102.9 FM; PLEASANTON, CA; Owner: ICBC BROADCAST HOLDINGS -CA, INC.)
KSOL-FM3 (98.9 FM; PLEASANTON, CA; Owner: TMS LICENSE CALIFORNIA, INC)
KFRC-FM3 (99.7 FM; WALNUT CREEK, CA; Owner: INFINITY KFRC-FM, INC.)
KZBR-FM1 (95.7 FM; WALNUT CREEK, CA; Owner: BONNEVILLE HOLDING COMPANY)
KISQ (98.1 FM; SAN FRANCISCO, CA; Owner: AMFM RADIO LICENSES, L.L.C.)
KEAR (106.9 FM; SAN FRANCISCO, CA; Owner: FAMILY STATIONS, INC.)
KISQ-FM3 (98.1 FM; CONCORD, CA; Owner: AMFM RADIO LICENSES, L.L.C.)
KOIT-FM (96.5 FM; SAN FRANCISCO, CA; Owner: BONNEVILLE HOLDING COMPANY)
KNDL (89.9 FM; ANGWIN, CA; Owner: HOWELL MOUNTAIN BROADCASTING COMPANY)
KLVR (91.9 FM; SANTA ROSA, CA; Owner: EDUCATIONAL MEDIA FOUNDATION)
KSOL-FM2 (98.9 FM; SAUSALITO, ETC., CA; Owner: TMS LICENSE CALIFORNIA, INC)
KKSF (103.7 FM; SAN FRANCISCO, CA; Owner: AMFM RADIO LICENSES, L.L.C.)
KXTS (100.9 FM; CALISTOGA, CA; Owner: SINCLAIR TELECABLE, INC.)
KFOG (104.5 FM; SAN FRANCISCO, CA; Owner: KFFG LICO, INC)
KMEL-FM1 (106.1 FM; CONCORD, CA; Owner: AMFM RADIO LICENSES, L.L.C.)
TV broadcast stations around Novato:
KQED (Channel 9; SAN FRANCISCO, CA; Owner: KQED, INC.)
KGO-TV (Channel 7; SAN FRANCISCO, CA; Owner: KGO TELEVISION, INC.)
KPIX-TV (Channel 5; SAN FRANCISCO, CA; Owner: CBS BROADCASTING INC.)
KTVU (Channel 2; OAKLAND, CA; Owner: KTVU PARTNERSHIP)
KRON-TV (Channel 4; SAN FRANCISCO, CA; Owner: YOUNG BROADCASTING OF SAN FRANCISCO, INC.)
KMTP-TV (Channel 32; SAN FRANCISCO, CA; Owner: MINORITY TELEVISION PROJECT)
KBHK-TV (Channel 44; SAN FRANCISCO, CA; Owner: VIACOM TELEVISION STATIONS GROUP OF SAN FRANCISCO INC.)
KBWB (Channel 20; SAN FRANCISCO, CA; Owner: KBWB LICENSE, INC.)
KFSF (Channel 66; VALLEJO, CA; Owner: TELEFUTURA SAN FRANCISCO LLC)
KCNS (Channel 38; SAN FRANCISCO, CA; Owner: WRAY, INC.)
KSPX (Channel 29; SACRAMENTO, CA; Owner: PAXSON SACRAMENTO LICENSE, INC.)
KOVR (Channel 13; STOCKTON, CA; Owner: SCI - SACRAMENTO LICENSEE, LLC)
KXTV (Channel 10; SACRAMENTO, CA; Owner: KXTV, INC.)
KTLN-TV (Channel 68; NOVATO, CA; Owner: CHRISTIAN COMMUNICATIONS CHICAGOLAND)
KTXL (Channel 40; SACRAMENTO, CA; Owner: CHANNEL 40, INC.)
KUVS (Channel 19; MODESTO, CA; Owner: KUVS LICENSE PARTNERSHIP, G.P.)
KQCA (Channel 58; STOCKTON, CA; Owner: KCRA HEARST-ARGYLE TELEVISION, INC.)
KVIE (Channel 6; SACRAMENTO, CA; Owner: KVIE, INC.)
KMAX-TV (Channel 31; SACRAMENTO, CA; Owner: UPN STATIONS GROUP INC.)
KCSM-TV (Channel 60; SAN MATEO, CA; Owner: SAN MATEO COUNTY COMMUNITY COLLEGE DISTRICT)
KTNC-TV (Channel 42; CONCORD, CA; Owner: KTNC LICENSE, LLC)
KRCB (Channel 22; COTATI, CA; Owner: RURAL CALIFORNIA BROADCASTING CORP.)
National Bridge Inventory (NBI) Statistics 70 Number of bridges1,158ft / 353m Total length $7,573,000 Total costs2,491,414 Total average daily traffic104,478 Total average daily truck traffic
New bridges - historical statistics
1 1910-1919 3 1920-1929 5 1930-1939 2 1940-1949 3 1950-1959 22 1960-1969 25 1970-1979 1 1980-1989 2 1990-1999 5 2000-2009 1 2010-2019
See full National Bridge Inventory statistics for Novato, CA
Home Mortgage Disclosure Act Aggregated Statistics For Year 2009(Based on 5 full and 6 partial tracts) A) FHA, FSA/RHS & VA B) Conventional C) Refinancings D) Home Improvement Loans E) Loans on Dwellings For 5+ Families F) Non-occupant Loans on G) Loans On Manufactured Number Average Value Number Average Value Number Average Value Number Average Value Number Average Value Number Average Value Number Average Value
LOANS ORIGINATED 102 $383,755 306 $369,892 1,396 $345,491 59 $232,999 3 $1,976,833 98 $272,604 3 $112,613 APPLICATIONS APPROVED, NOT ACCEPTED 12 $485,538 48 $341,335 155 $349,200 4 $198,558 0 $0 16 $265,463 4 $32,638 APPLICATIONS DENIED 16 $398,053 57 $356,065 364 $420,077 16 $186,676 0 $0 41 $294,979 5 $62,232 APPLICATIONS WITHDRAWN 14 $387,348 40 $345,132 230 $394,645 8 $220,160 0 $0 21 $271,433 2 $121,010 FILES CLOSED FOR INCOMPLETENESS 2 $421,650 11 $389,032 51 $418,070 3 $198,957 0 $0 1 $281,720 0 $0
Aggregated Statistics For Year 2008(Based on 5 full and 6 partial tracts) A) FHA, FSA/RHS & VA B) Conventional C) Refinancings D) Home Improvement Loans E) Loans on Dwellings For 5+ Families F) Non-occupant Loans on G) Loans On Manufactured Number Average Value Number Average Value Number Average Value Number Average Value Number Average Value Number Average Value Number Average Value
LOANS ORIGINATED 35 $422,949 350 $392,698 520 $374,403 41 $136,418 4 $5,869,845 97 $287,612 4 $45,170 APPLICATIONS APPROVED, NOT ACCEPTED 6 $290,098 78 $453,743 114 $378,909 7 $244,247 0 $0 18 $335,899 3 $73,357 APPLICATIONS DENIED 13 $478,503 86 $361,377 268 $426,307 26 $258,395 2 $3,617,500 44 $311,330 6 $59,313 APPLICATIONS WITHDRAWN 6 $466,200 62 $357,408 141 $389,610 5 $187,054 2 $2,475,000 22 $291,199 1 $118,960 FILES CLOSED FOR INCOMPLETENESS 2 $420,115 12 $422,632 35 $383,046 6 $136,977 0 $0 5 $382,400 0 $0
Aggregated Statistics For Year 2007(Based on 5 full and 6 partial tracts) A) FHA, FSA/RHS & VA B) Conventional C) Refinancings D) Home Improvement Loans E) Loans on Dwellings For 5+ Families F) Non-occupant Loans on G) Loans On Manufactured Number Average Value Number Average Value Number Average Value Number Average Value Number Average Value Number Average Value Number Average Value
LOANS ORIGINATED 1 $269,740 472 $439,910 909 $415,461 91 $263,759 14 $2,430,714 121 $360,215 8 $75,928 APPLICATIONS APPROVED, NOT ACCEPTED 0 $0 101 $450,578 238 $429,023 15 $270,937 1 $1,966,200 16 $420,701 4 $77,352 APPLICATIONS DENIED 0 $0 130 $429,211 517 $450,455 51 $251,064 0 $0 54 $393,338 9 $59,521 APPLICATIONS WITHDRAWN 0 $0 67 $460,886 231 $411,068 21 $211,707 0 $0 20 $532,792 1 $37,360 FILES CLOSED FOR INCOMPLETENESS 0 $0 11 $458,591 69 $492,082 5 $85,878 1 $1,000,000 8 $277,451 0 $0
Aggregated Statistics For Year 2006(Based on 5 full and 6 partial tracts) B) Conventional C) Refinancings D) Home Improvement Loans E) Loans on Dwellings For 5+ Families F) Non-occupant Loans on G) Loans On Manufactured Number Average Value Number Average Value Number Average Value Number Average Value Number Average Value Number Average Value
LOANS ORIGINATED 925 $428,880 1,247 $424,242 161 $317,203 3 $649,333 164 $400,246 11 $66,593 APPLICATIONS APPROVED, NOT ACCEPTED 168 $421,997 242 $404,263 27 $318,680 0 $0 25 $408,206 4 $40,772 APPLICATIONS DENIED 235 $427,443 458 $423,692 60 $232,839 0 $0 44 $403,351 12 $86,447 APPLICATIONS WITHDRAWN 100 $479,701 311 $450,958 26 $203,673 0 $0 30 $356,527 2 $100,440 FILES CLOSED FOR INCOMPLETENESS 29 $507,415 88 $399,366 5 $216,228 0 $0 10 $382,333 0 $0
Aggregated Statistics For Year 2005(Based on 5 full and 6 partial tracts) B) Conventional C) Refinancings D) Home Improvement Loans E) Loans on Dwellings For 5+ Families F) Non-occupant Loans on G) Loans On Manufactured Number Average Value Number Average Value Number Average Value Number Average Value Number Average Value Number Average Value
LOANS ORIGINATED 1,340 $443,165 1,650 $413,812 184 $322,420 8 $2,285,588 209 $363,057 12 $80,741 APPLICATIONS APPROVED, NOT ACCEPTED 192 $510,858 194 $431,448 19 $290,923 0 $0 21 $362,531 5 $84,040 APPLICATIONS DENIED 288 $442,181 474 $439,919 68 $261,256 0 $0 43 $415,810 10 $142,491 APPLICATIONS WITHDRAWN 197 $493,657 376 $381,081 44 $298,954 0 $0 30 $391,241 0 $0 FILES CLOSED FOR INCOMPLETENESS 53 $508,695 92 $443,570 8 $254,141 1 $900,000 4 $523,285 0 $0
Aggregated Statistics For Year 2004(Based on 5 full and 6 partial tracts) B) Conventional C) Refinancings D) Home Improvement Loans E) Loans on Dwellings For 5+ Families F) Non-occupant Loans on G) Loans On Manufactured Number Average Value Number Average Value Number Average Value Number Average Value Number Average Value Number Average Value
LOANS ORIGINATED 1,310 $389,086 1,856 $351,619 157 $278,806 8 $3,011,481 234 $281,751 22 $63,236 APPLICATIONS APPROVED, NOT ACCEPTED 164 $385,343 256 $341,382 15 $146,055 0 $0 28 $347,552 8 $79,849 APPLICATIONS DENIED 241 $409,419 395 $402,756 52 $233,103 0 $0 43 $386,575 6 $67,958 APPLICATIONS WITHDRAWN 153 $425,238 340 $365,818 35 $302,843 3 $1,191,000 23 $342,393 1 $82,580 FILES CLOSED FOR INCOMPLETENESS 36 $464,065 130 $332,787 6 $220,938 0 $0 7 $258,571 1 $82,580
Aggregated Statistics For Year 2003(Based on 5 full and 6 partial tracts) A) FHA, FSA/RHS & VA B) Conventional C) Refinancings D) Home Improvement Loans E) Loans on Dwellings For 5+ Families F) Non-occupant Loans on Number Average Value Number Average Value Number Average Value Number Average Value Number Average Value Number Average Value
LOANS ORIGINATED 4 $125,000 1,093 $348,274 4,342 $288,828 51 $93,027 7 $1,770,991 362 $242,022 APPLICATIONS APPROVED, NOT ACCEPTED 2 $46,835 111 $346,654 461 $296,771 13 $64,688 0 $0 41 $215,670 APPLICATIONS DENIED 0 $0 169 $318,878 547 $307,553 27 $51,446 1 $925,000 46 $235,561 APPLICATIONS WITHDRAWN 0 $0 120 $390,637 590 $278,979 7 $114,163 0 $0 37 $231,825 FILES CLOSED FOR INCOMPLETENESS 0 $0 25 $359,943 90 $329,168 2 $83,870 1 $500,000 9 $220,256
Aggregated Statistics For Year 2002(Based on 5 full and 6 partial tracts) A) FHA, FSA/RHS & VA B) Conventional C) Refinancings D) Home Improvement Loans E) Loans on Dwellings For 5+ Families F) Non-occupant Loans on Number Average Value Number Average Value Number Average Value Number Average Value Number Average Value Number Average Value
LOANS ORIGINATED 3 $50,060 807 $320,257 2,981 $295,056 49 $87,176 6 $1,336,302 225 $234,713 APPLICATIONS APPROVED, NOT ACCEPTED 1 $75,000 103 $304,211 387 $299,756 8 $57,590 0 $0 31 $241,289 APPLICATIONS DENIED 1 $260,000 96 $329,269 334 $305,749 19 $61,655 0 $0 23 $233,153 APPLICATIONS WITHDRAWN 0 $0 85 $327,578 400 $285,403 9 $31,237 0 $0 20 $244,754 FILES CLOSED FOR INCOMPLETENESS 0 $0 20 $378,636 124 $323,423 1 $16,010 0 $0 6 $207,158
Aggregated Statistics For Year 2001(Based on 5 full and 6 partial tracts) A) FHA, FSA/RHS & VA B) Conventional C) Refinancings D) Home Improvement Loans E) Loans on Dwellings For 5+ Families F) Non-occupant Loans on Number Average Value Number Average Value Number Average Value Number Average Value Number Average Value Number Average Value
LOANS ORIGINATED 5 $240,852 725 $283,893 2,395 $272,516 110 $65,928 3 $3,175,467 178 $216,026 APPLICATIONS APPROVED, NOT ACCEPTED 0 $0 102 $337,412 281 $269,348 22 $69,058 0 $0 30 $256,666 APPLICATIONS DENIED 0 $0 94 $257,540 353 $282,039 40 $49,256 1 $20,670 24 $313,714 APPLICATIONS WITHDRAWN 0 $0 65 $321,132 311 $247,900 21 $55,587 0 $0 22 $223,458 FILES CLOSED FOR INCOMPLETENESS 0 $0 31 $370,608 103 $290,070 1 $128,280 0 $0 11 $228,198
Aggregated Statistics For Year 2000(Based on 5 full and 6 partial tracts) A) FHA, FSA/RHS & VA B) Conventional C) Refinancings D) Home Improvement Loans E) Loans on Dwellings For 5+ Families F) Non-occupant Loans on Number Average Value Number Average Value Number Average Value Number Average Value Number Average Value Number Average Value
LOANS ORIGINATED 6 $198,718 979 $270,693 611 $212,278 113 $45,451 6 $5,278,218 133 $220,040 APPLICATIONS APPROVED, NOT ACCEPTED 0 $0 131 $274,028 90 $200,845 29 $35,046 0 $0 24 $222,001 APPLICATIONS DENIED 0 $0 152 $245,311 180 $226,195 34 $48,682 1 $413,340 30 $178,530 APPLICATIONS WITHDRAWN 0 $0 114 $261,925 115 $191,730 18 $52,799 1 $10,112,820 18 $208,033 FILES CLOSED FOR INCOMPLETENESS 0 $0 33 $312,744 35 $230,791 2 $77,630 1 $7,715,680 3 $186,243
Aggregated Statistics For Year 1999(Based on 2 full and 10 partial tracts) A) FHA, FSA/RHS & VA B) Conventional C) Refinancings D) Home Improvement Loans E) Loans on Dwellings For 5+ Families F) Non-occupant Loans on Number Average Value Number Average Value Number Average Value Number Average Value Number Average Value Number Average Value
LOANS ORIGINATED 16 $171,497 1,100 $229,376 1,013 $203,508 113 $36,639 7 $1,272,280 142 $186,761 APPLICATIONS APPROVED, NOT ACCEPTED 0 $0 136 $236,325 148 $207,738 20 $38,649 1 $750,000 15 $163,651 APPLICATIONS DENIED 2 $146,820 153 $206,737 253 $191,095 22 $70,202 0 $0 32 $178,566 APPLICATIONS WITHDRAWN 3 $127,067 191 $246,309 213 $176,578 4 $45,350 1 $518,130 23 $185,890 FILES CLOSED FOR INCOMPLETENESS 0 $0 35 $267,143 60 $207,343 1 $50,750 2 $403,390 8 $149,866
Detailed mortgage data for all 10 tracts in Novato, CA
Private Mortgage Insurance Companies Aggregated Statistics For Year 2009(Based on 5 full and 6 partial tracts) A) Conventional B) Refinancings Number Average Value Number Average Value
LOANS ORIGINATED 30 $298,320 4 $307,022 APPLICATIONS APPROVED, NOT ACCEPTED 13 $315,447 1 $434,000 APPLICATIONS DENIED 4 $307,568 2 $450,895 APPLICATIONS WITHDRAWN 4 $343,102 1 $113,670 FILES CLOSED FOR INCOMPLETENESS 0 $0 0 $0
Aggregated Statistics For Year 2008(Based on 5 full and 4 partial tracts) A) Conventional B) Refinancings Number Average Value Number Average Value
LOANS ORIGINATED 46 $376,701 10 $418,379 APPLICATIONS APPROVED, NOT ACCEPTED 18 $366,356 7 $425,869 APPLICATIONS DENIED 6 $486,470 3 $313,333 APPLICATIONS WITHDRAWN 2 $273,645 1 $1,062,570 FILES CLOSED FOR INCOMPLETENESS 1 $413,000 0 $0
Aggregated Statistics For Year 2007(Based on 5 full and 4 partial tracts) A) Conventional B) Refinancings C) Non-occupant Loans on Number Average Value Number Average Value Number Average Value
LOANS ORIGINATED 17 $460,380 7 $502,446 1 $412,000 APPLICATIONS APPROVED, NOT ACCEPTED 3 $276,130 2 $285,695 0 $0 APPLICATIONS DENIED 0 $0 8 $783,665 1 $736,000 APPLICATIONS WITHDRAWN 10 $218,627 1 $622,330 0 $0 FILES CLOSED FOR INCOMPLETENESS 0 $0 0 $0 0 $0
Aggregated Statistics For Year 2006(Based on 3 full and 1 partial tracts) B) Refinancings Number Average Value
LOANS ORIGINATED 7 $491,451 APPLICATIONS APPROVED, NOT ACCEPTED 0 $0 APPLICATIONS DENIED 1 $665,000 APPLICATIONS WITHDRAWN 0 $0 FILES CLOSED FOR INCOMPLETENESS 0 $0
Aggregated Statistics For Year 2005(Based on 5 full and 3 partial tracts) A) Conventional B) Refinancings Number Average Value Number Average Value
LOANS ORIGINATED 4 $365,350 6 $353,917 APPLICATIONS APPROVED, NOT ACCEPTED 3 $235,873 4 $320,972 APPLICATIONS DENIED 0 $0 0 $0 APPLICATIONS WITHDRAWN 1 $513,100 0 $0 FILES CLOSED FOR INCOMPLETENESS 0 $0 0 $0
Aggregated Statistics For Year 2004(Based on 4 full and 5 partial tracts) A) Conventional B) Refinancings C) Non-occupant Loans on Number Average Value Number Average Value Number Average Value
LOANS ORIGINATED 5 $279,186 5 $450,710 1 $400,110 APPLICATIONS APPROVED, NOT ACCEPTED 1 $293,690 5 $250,658 0 $0 APPLICATIONS DENIED 2 $647,000 1 $276,000 1 $626,000 APPLICATIONS WITHDRAWN 0 $0 0 $0 0 $0 FILES CLOSED FOR INCOMPLETENESS 0 $0 0 $0 0 $0
Aggregated Statistics For Year 2003(Based on 4 full and 4 partial tracts) A) Conventional B) Refinancings C) Non-occupant Loans on Number Average Value Number Average Value Number Average Value
LOANS ORIGINATED 21 $388,268 10 $271,583 1 $219,760 APPLICATIONS APPROVED, NOT ACCEPTED 3 $356,000 4 $375,015 0 $0 APPLICATIONS DENIED 0 $0 1 $370,400 0 $0 APPLICATIONS WITHDRAWN 1 $288,000 2 $336,470 0 $0 FILES CLOSED FOR INCOMPLETENESS 0 $0 0 $0 0 $0
Aggregated Statistics For Year 2002(Based on 5 full and 6 partial tracts) A) Conventional B) Refinancings C) Non-occupant Loans on Number Average Value Number Average Value Number Average Value
LOANS ORIGINATED 32 $331,426 12 $303,622 1 $388,490 APPLICATIONS APPROVED, NOT ACCEPTED 7 $344,404 7 $436,264 0 $0 APPLICATIONS DENIED 0 $0 0 $0 0 $0 APPLICATIONS WITHDRAWN 2 $169,450 3 $252,783 2 $169,450 FILES CLOSED FOR INCOMPLETENESS 0 $0 0 $0 0 $0
Aggregated Statistics For Year 2001(Based on 4 full and 6 partial tracts) A) Conventional B) Refinancings C) Non-occupant Loans on Number Average Value Number Average Value Number Average Value
LOANS ORIGINATED 40 $303,931 9 $296,566 1 $226,000 APPLICATIONS APPROVED, NOT ACCEPTED 13 $242,528 4 $225,155 5 $115,000 APPLICATIONS DENIED 1 $384,000 1 $512,650 0 $0 APPLICATIONS WITHDRAWN 0 $0 0 $0 0 $0 FILES CLOSED FOR INCOMPLETENESS 1 $557,420 0 $0 0 $0
Aggregated Statistics For Year 2000(Based on 5 full and 6 partial tracts) A) Conventional B) Refinancings C) Non-occupant Loans on Number Average Value Number Average Value Number Average Value
LOANS ORIGINATED 73 $258,598 15 $237,279 1 $320,520 APPLICATIONS APPROVED, NOT ACCEPTED 14 $279,179 3 $236,850 0 $0 APPLICATIONS DENIED 4 $300,810 1 $312,000 0 $0 APPLICATIONS WITHDRAWN 3 $374,527 1 $348,940 1 $420,830 FILES CLOSED FOR INCOMPLETENESS 1 $261,000 0 $0 0 $0
Aggregated Statistics For Year 1999(Based on 2 full and 10 partial tracts) A) Conventional B) Refinancings C) Non-occupant Loans on Number Average Value Number Average Value Number Average Value
LOANS ORIGINATED 99 $257,771 24 $207,685 4 $236,052 APPLICATIONS APPROVED, NOT ACCEPTED 12 $230,691 7 $220,149 1 $120,000 APPLICATIONS DENIED 4 $267,938 1 $213,120 0 $0 APPLICATIONS WITHDRAWN 5 $350,372 1 $141,100 0 $0 FILES CLOSED FOR INCOMPLETENESS 2 $148,935 2 $169,895 0 $0
Fire-safe hotels and motels in Novato, California:
Novato Days Inn, 8141 Redwood Blvd, Novato, California 94945 Phone: (415) 897-7111, Fax: (415) 892-1186
Inn Marin, 250 Entrada Dr, Novato, California 94949 Phone: (415) 883-5952, Fax: (415) 883-5058
Skylark Motel, 275 Alameda Del Prado, Novato, California 94949 Phone: (415) 883-2406, Fax: (415) 382-3765
Americas Best Value Inn, 7600 Redwood Blvd, Novato, California 94945 Phone: (415) 892-7500, Fax: (415) 898-0828
All 4 fire-safe hotels and motels in Novato, California
Most common first names in Novato, CA among deceased individuals Name Count Lived (average)
John 337 75.6 years Robert 261 71.9 years William 249 76.1 years Mary 248 80.7 years James 182 71.9 years Margaret 172 79.9 years Helen 151 82.9 years Joseph 142 77.8 years George 133 75.0 years Dorothy 128 79.9 years
Most common last names in Novato, CA among deceased individuals Last name Count Lived (average)
Smith 94 76.5 years Johnson 84 76.9 years Miller 61 77.6 years Brown 47 73.1 years Jones 42 74.6 years Williams 41 78.5 years Martin 33 76.9 years Anderson 31 78.9 years Hall 30 71.9 years Clark 29 78.5 years
Novato compared to California state average:
Unemployed percentage significantly below state average. Median age significantly above state average. Length of stay since moving in significantly above state average. Percentage of population with a bachelor's degree or higher above state average.
#16 on the list of "Top 101 cities with largest percentage of females in occupations: law enforcement workers including supervisors (population 50,000+)"
#20 on the list of "Top 101 cities with largest percentage of females in occupations: community and social service occupations (population 50,000+)"
#34 on the list of "Top 101 cities with the lowest number of murders per 100,000 residents (population 50,000+)"
#34 on the list of "Top 101 cities with largest percentage of females in industries: other services, except public administration (population 50,000+)"
#38 on the list of "Top 101 cities with the highest maximum monthly sunshine amount (population 50,000+)"
#46 on the list of "Top 101 cities with the most people taking a ferryboat to work (population 5,000+)"
#47 on the list of "Top 101 cities with the largest differences between morning and afternoon humidity (population 50,000+)"
#47 on the list of "Top 101 cities with the largest humidity differences during a year (population 50,000+)"
#50 on the list of "Top 101 cities with the highest percentage of workers working at home, population 50,000+"
#56 on the list of "Top 101 cities with the largest sunshine amount differences during a year (population 50,000+)"
#61 on the list of "Top 101 cities with the least people below the poverty level (population 50,000+)"
#64 on the list of "Top 101 cities with the lowest number of thefts per 100,000 residents (population 50,000+)"
#69 on the list of "Top 100 cities with highest median house value (pop. 50,000+)"
#72 on the list of "Top 101 cities with the largest percentage of likely lesbian couples (counted as self-reported female-female unmarried-partner households) (population 50,000+)"
#72 on the list of "Top 100 cities with oldest residents (pop. 50,000+)"
#76 on the list of "Top 101 cities with largest percentage of females in occupations: management occupations (population 50,000+)"
#83 on the list of "Top 101 cities with largest percentage of males in occupations: management occupations (population 50,000+)"
#84 on the list of "Top 101 cities with the lowest city-data.com crime index (population 50,000+)"
#86 on the list of "Top 100 safest cities (lowest city-data.com crime index) (pop. 50,000+)"
#87 on the list of "Top 101 cities with the lowest number of rapes per 100,000 residents (population 50,000+)"
#13 on the list of "Top 101 counties with the largest number of people without health insurance coverage in 2000 (pop. 50,000+)"
#17 on the list of "Top 101 counties with the highest carbon monoxide air pollution readings in 2012 (ppm)"
#17 on the list of "Top 101 counties with the lowest Ozone (1-hour) air pollution readings in 2012 (ppm)"
#30 on the list of "Top 101 counties with highest percentage of residents voting for Obama (Democrat) in the 2012 Presidential Election (pop. 50,000+)"
#43 on the list of "Top 101 counties with the lowest number of births per 1000 residents 2007-2013"
Top Patent Applicants
Julie Chabot (30)
Emil D. Kakkis (21)
James J. Harrison (20)
Andrew Waite (19)
Victor Nguyen (17)
Dale E. Bredesen (16)
Harry V. Lehmann (16)
James Blaisdell (16)
Don Tran (15)
Don H. Tran (15)
Total of 976 patent applications in 2008-2024.
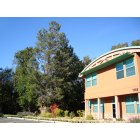
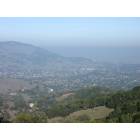
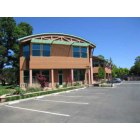
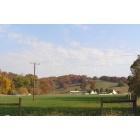
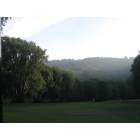
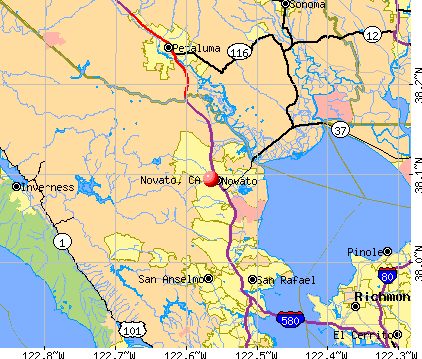


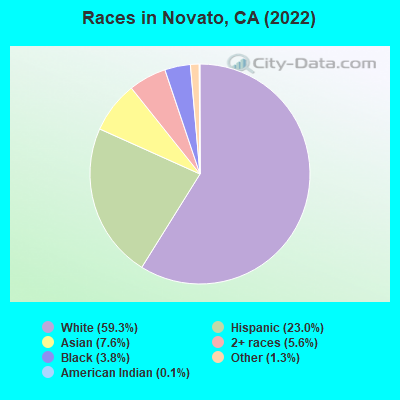
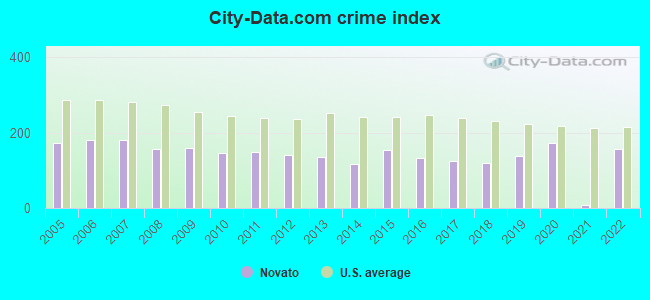
 Recent articles from our blog. Our writers, many of them Ph.D. graduates or candidates, create easy-to-read articles on a wide variety of topics.

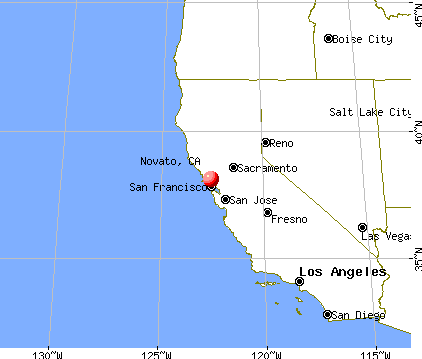
 , pop. 54,506).
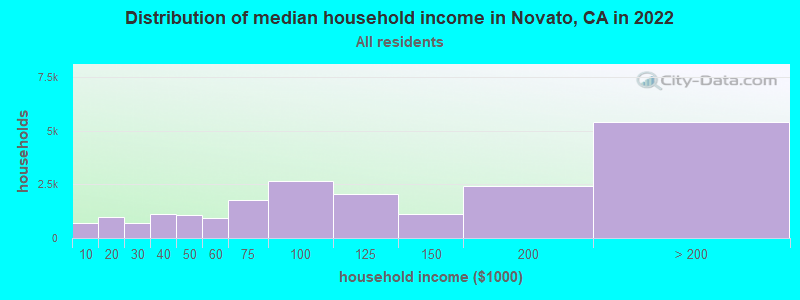
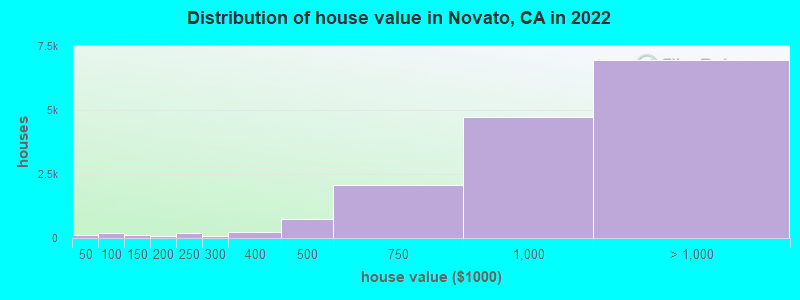

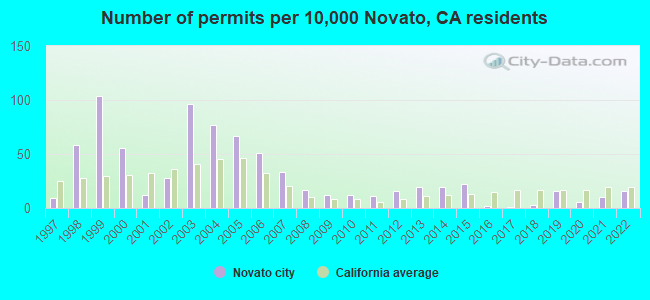
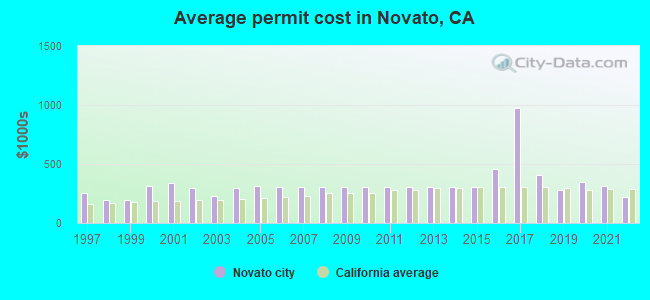
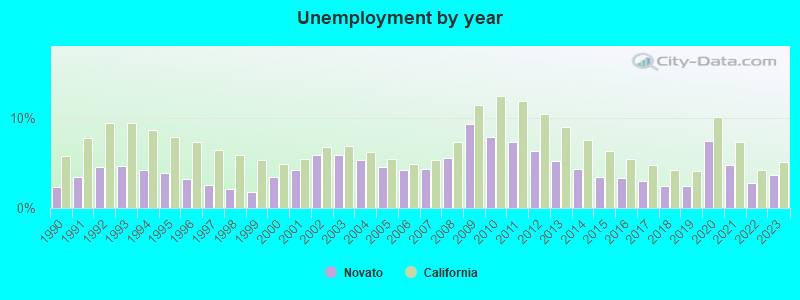
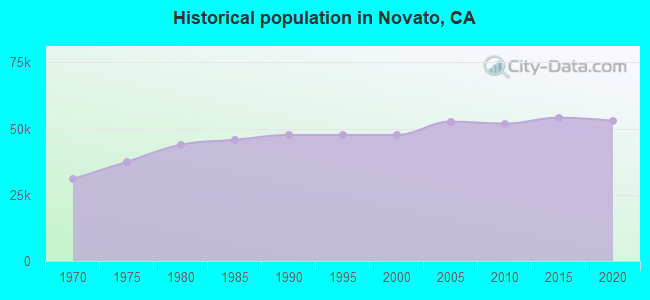
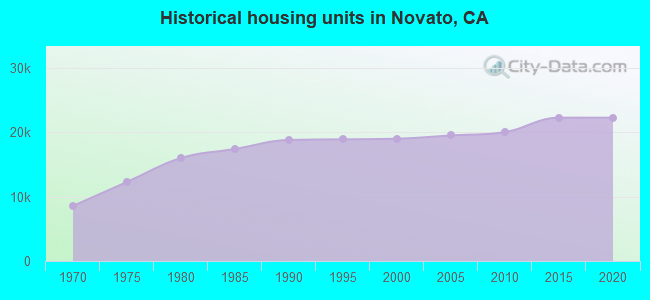
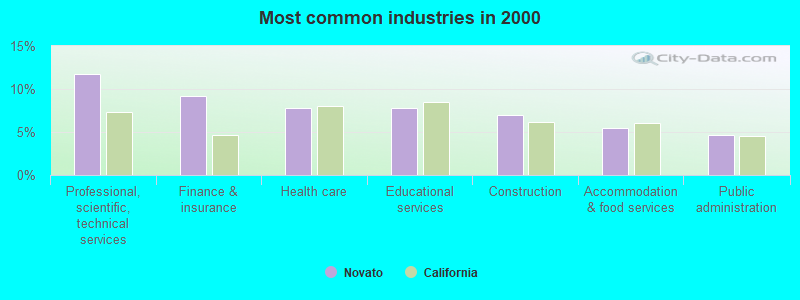
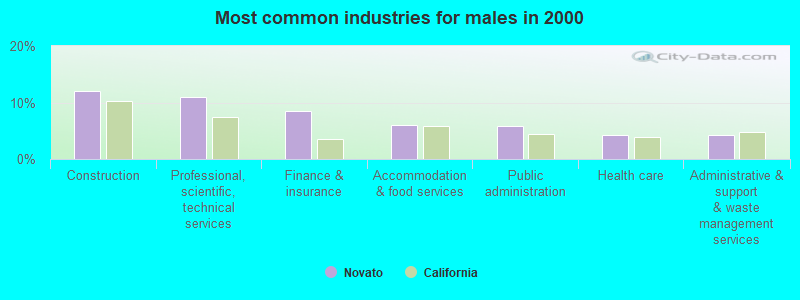
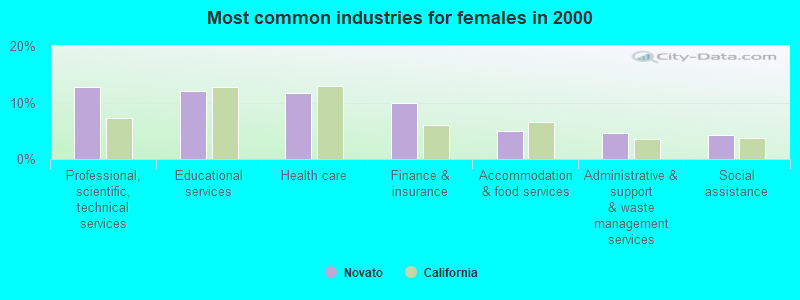
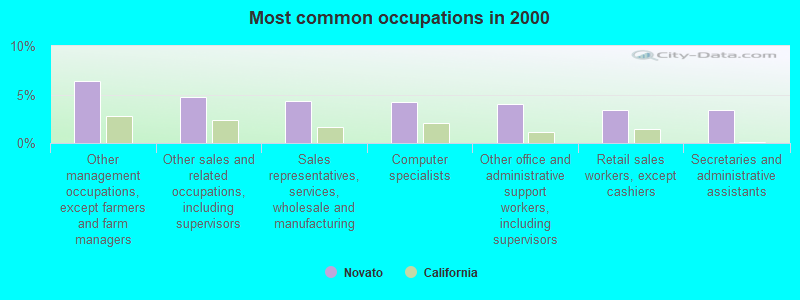
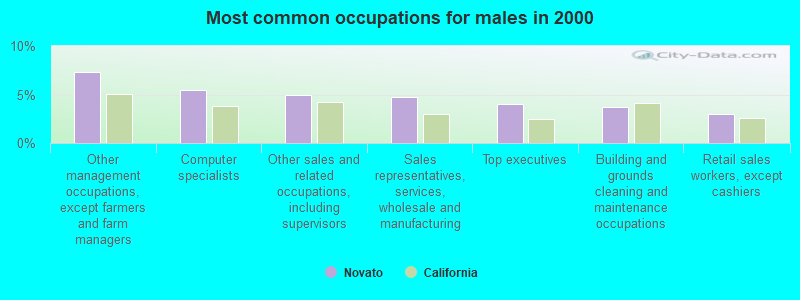
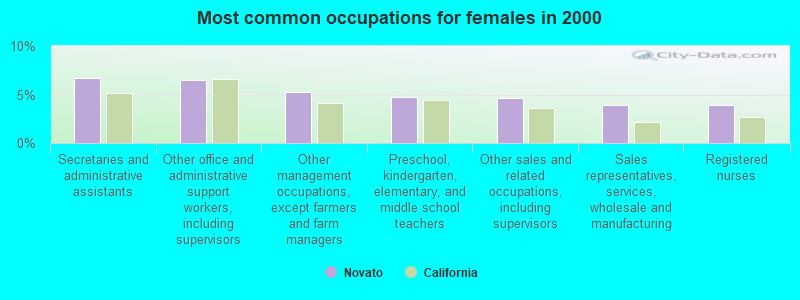

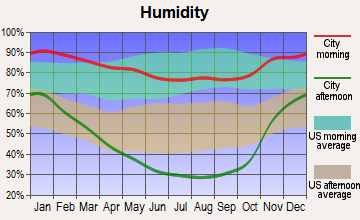
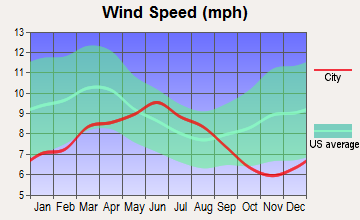
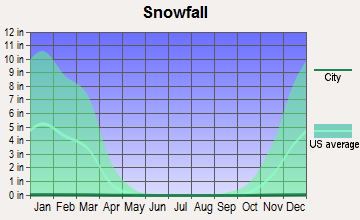
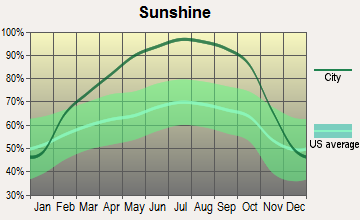
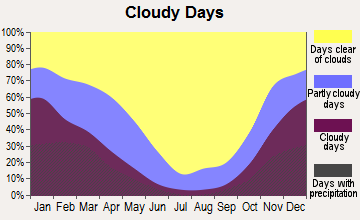

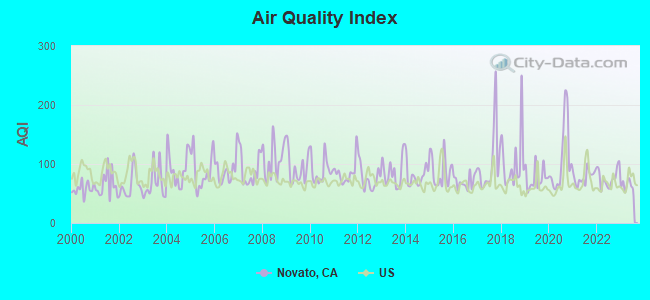
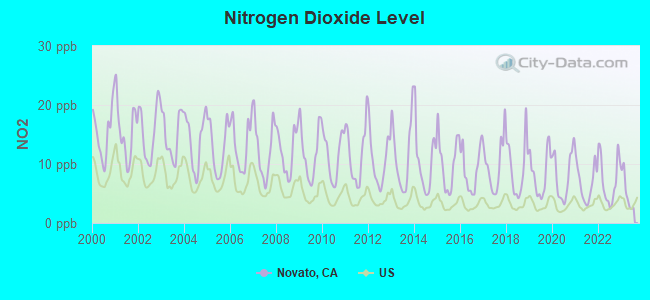
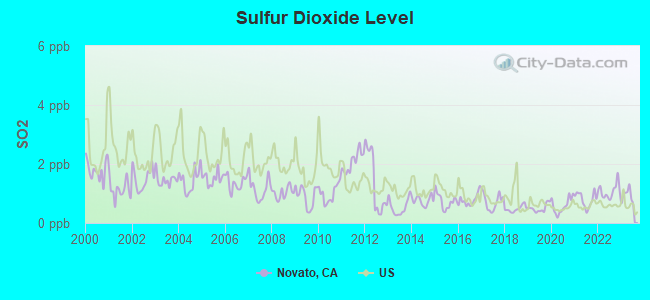
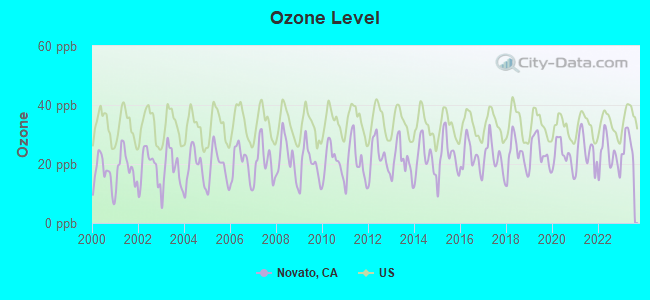
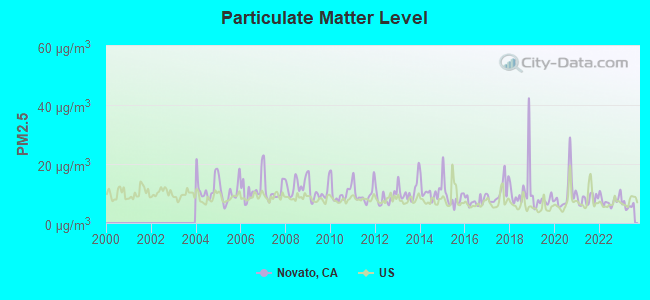
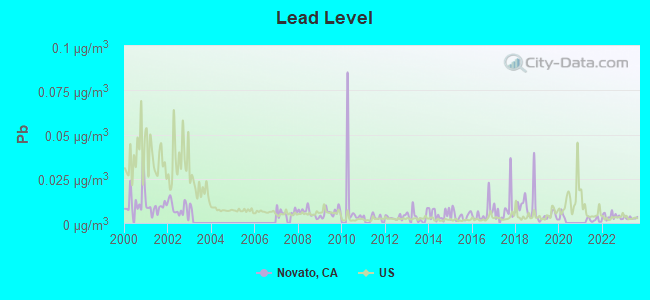

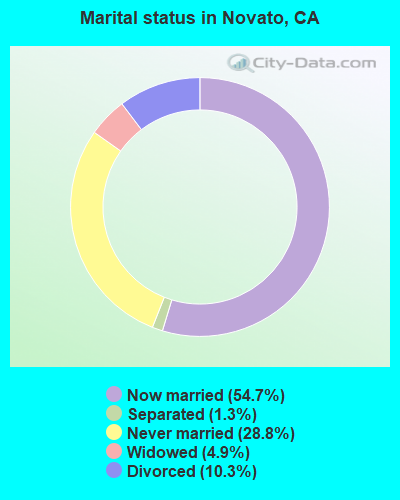
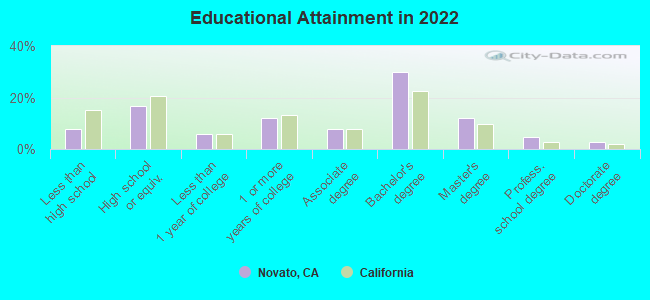
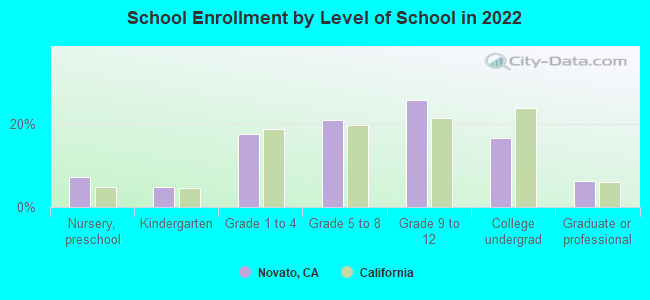
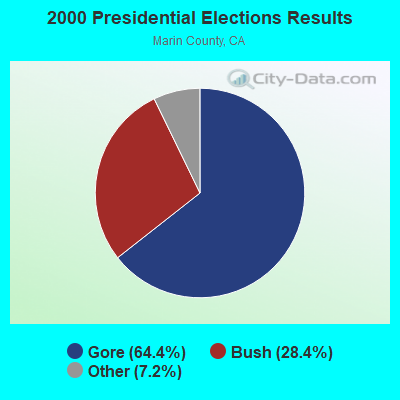
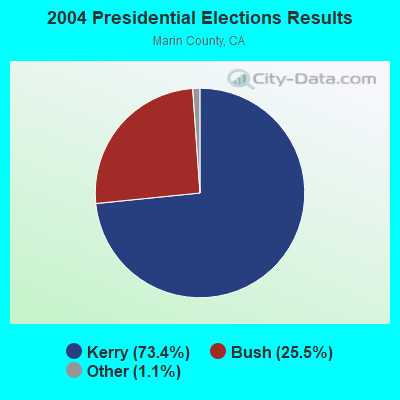
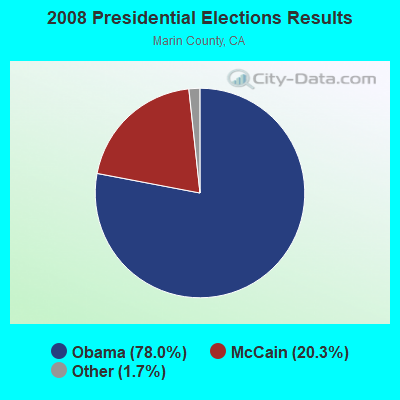
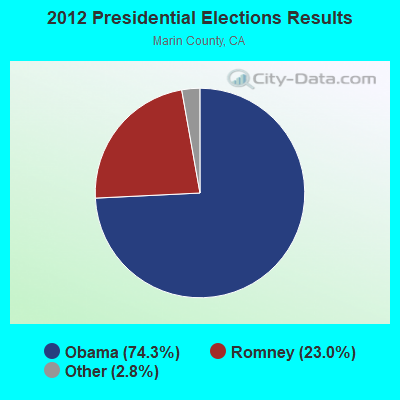
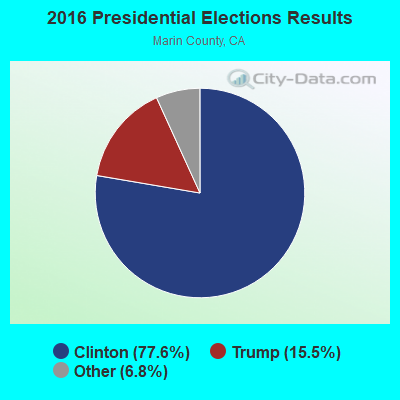
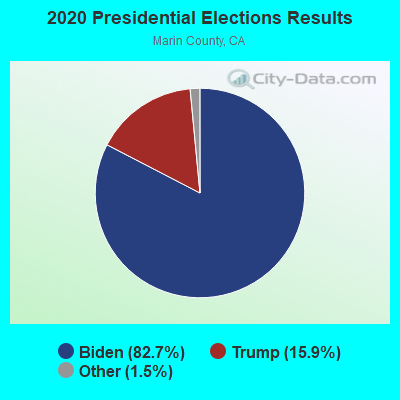
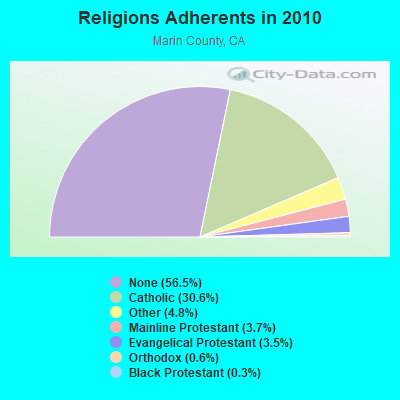
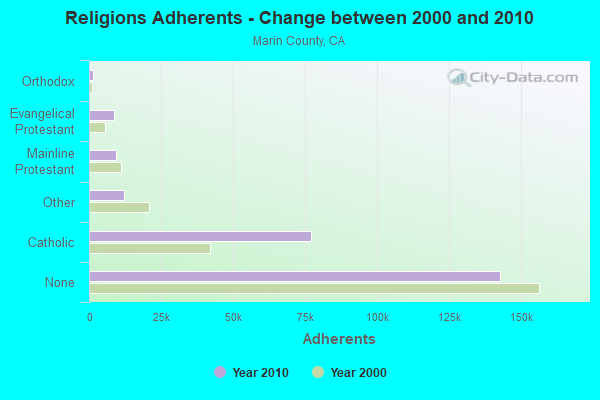
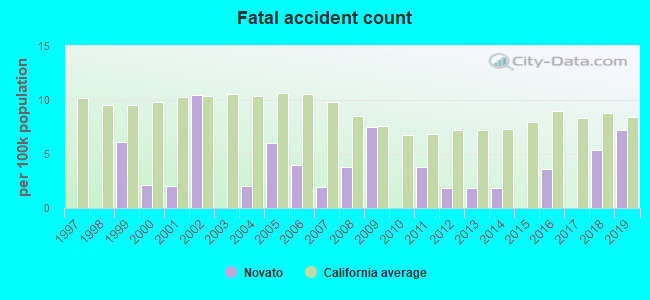
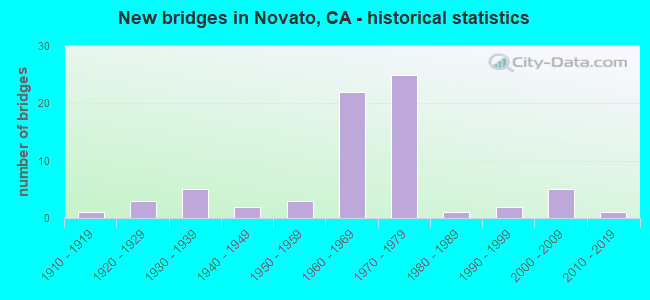
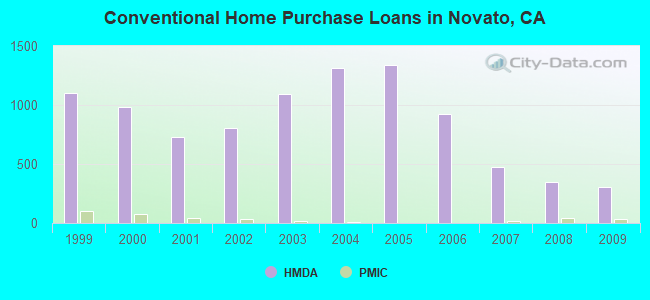
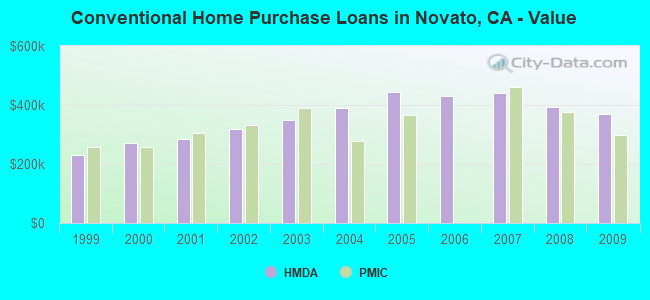
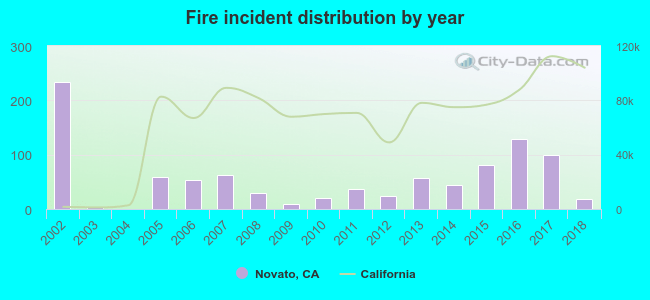 Based on the data from the years 2002 - 2018 the average number of fires per year is 57. The highest number of fire incidents - 234 took place in 2002, and the least - 0 in 2004. The data has a dropping trend.
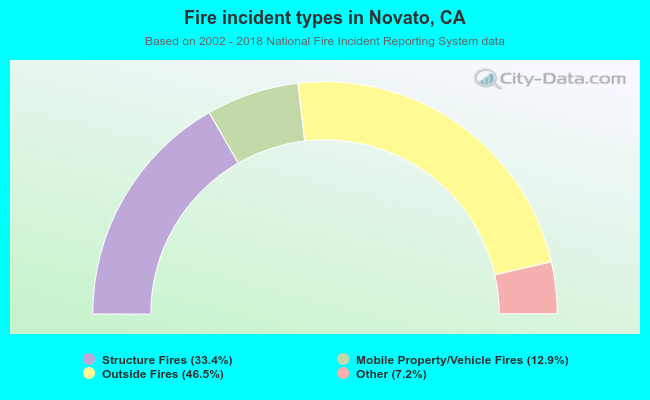 When looking into fire subcategories, the most incidents belonged to: Outside Fires (46.5%), and Structure Fires (33.4%).