San Anselmo, California Submit your own pictures of this town and show them to the world
OSM Map
General Map
Google Map
MSN Map
OSM Map
General Map
Google Map
MSN Map
OSM Map
General Map
Google Map
MSN Map
OSM Map
General Map
Google Map
MSN Map
Please wait while loading the map...
Population in 2022: 12,569 (100% urban, 0% rural). Population change since 2000: +1.5%Males: 6,276 Females: 6,293
March 2022 cost of living index in San Anselmo: 136.6 (high, U.S. average is 100) Percentage of residents living in poverty in 2022: 4.3%for White Non-Hispanic residents , 5.9% for Black residents , 2.9% for Hispanic or Latino residents , 100.0% for Native Hawaiian and other Pacific Islander residents , 0.6% for other race residents , 3.2% for two or more races residents )
Profiles of local businesses
Business Search - 14 Million verified businesses
Data:
Median household income ($)
Median household income (% change since 2000)
Household income diversity
Ratio of average income to average house value (%)
Ratio of average income to average rent
Median household income ($) - White
Median household income ($) - Black or African American
Median household income ($) - Asian
Median household income ($) - Hispanic or Latino
Median household income ($) - American Indian and Alaska Native
Median household income ($) - Multirace
Median household income ($) - Other Race
Median household income for houses/condos with a mortgage ($)
Median household income for apartments without a mortgage ($)
Races - White alone (%)
Races - White alone (% change since 2000)
Races - Black alone (%)
Races - Black alone (% change since 2000)
Races - American Indian alone (%)
Races - American Indian alone (% change since 2000)
Races - Asian alone (%)
Races - Asian alone (% change since 2000)
Races - Hispanic (%)
Races - Hispanic (% change since 2000)
Races - Native Hawaiian and Other Pacific Islander alone (%)
Races - Native Hawaiian and Other Pacific Islander alone (% change since 2000)
Races - Two or more races (%)
Races - Two or more races (% change since 2000)
Races - Other race alone (%)
Races - Other race alone (% change since 2000)
Racial diversity
Unemployment (%)
Unemployment (% change since 2000)
Unemployment (%) - White
Unemployment (%) - Black or African American
Unemployment (%) - Asian
Unemployment (%) - Hispanic or Latino
Unemployment (%) - American Indian and Alaska Native
Unemployment (%) - Multirace
Unemployment (%) - Other Race
Population density (people per square mile)
Population - Males (%)
Population - Females (%)
Population - Males (%) - White
Population - Males (%) - Black or African American
Population - Males (%) - Asian
Population - Males (%) - Hispanic or Latino
Population - Males (%) - American Indian and Alaska Native
Population - Males (%) - Multirace
Population - Males (%) - Other Race
Population - Females (%) - White
Population - Females (%) - Black or African American
Population - Females (%) - Asian
Population - Females (%) - Hispanic or Latino
Population - Females (%) - American Indian and Alaska Native
Population - Females (%) - Multirace
Population - Females (%) - Other Race
Coronavirus confirmed cases (Apr 27, 2024)
Deaths caused by coronavirus (Apr 27, 2024)
Coronavirus confirmed cases (per 100k population) (Apr 27, 2024)
Deaths caused by coronavirus (per 100k population) (Apr 27, 2024)
Daily increase in number of cases (Apr 27, 2024)
Weekly increase in number of cases (Apr 27, 2024)
Cases doubled (in days) (Apr 27, 2024)
Hospitalized patients (Apr 18, 2022)
Negative test results (Apr 18, 2022)
Total test results (Apr 18, 2022)
COVID Vaccine doses distributed (per 100k population) (Sep 19, 2023)
COVID Vaccine doses administered (per 100k population) (Sep 19, 2023)
COVID Vaccine doses distributed (Sep 19, 2023)
COVID Vaccine doses administered (Sep 19, 2023)
Likely homosexual households (%)
Likely homosexual households (% change since 2000)
Likely homosexual households - Lesbian couples (%)
Likely homosexual households - Lesbian couples (% change since 2000)
Likely homosexual households - Gay men (%)
Likely homosexual households - Gay men (% change since 2000)
Cost of living index
Median gross rent ($)
Median contract rent ($)
Median monthly housing costs ($)
Median house or condo value ($)
Median house or condo value ($ change since 2000)
Mean house or condo value by units in structure - 1, detached ($)
Mean house or condo value by units in structure - 1, attached ($)
Mean house or condo value by units in structure - 2 ($)
Mean house or condo value by units in structure by units in structure - 3 or 4 ($)
Mean house or condo value by units in structure - 5 or more ($)
Mean house or condo value by units in structure - Boat, RV, van, etc. ($)
Mean house or condo value by units in structure - Mobile home ($)
Median house or condo value ($) - White
Median house or condo value ($) - Black or African American
Median house or condo value ($) - Asian
Median house or condo value ($) - Hispanic or Latino
Median house or condo value ($) - American Indian and Alaska Native
Median house or condo value ($) - Multirace
Median house or condo value ($) - Other Race
Median resident age
Resident age diversity
Median resident age - Males
Median resident age - Females
Median resident age - White
Median resident age - Black or African American
Median resident age - Asian
Median resident age - Hispanic or Latino
Median resident age - American Indian and Alaska Native
Median resident age - Multirace
Median resident age - Other Race
Median resident age - Males - White
Median resident age - Males - Black or African American
Median resident age - Males - Asian
Median resident age - Males - Hispanic or Latino
Median resident age - Males - American Indian and Alaska Native
Median resident age - Males - Multirace
Median resident age - Males - Other Race
Median resident age - Females - White
Median resident age - Females - Black or African American
Median resident age - Females - Asian
Median resident age - Females - Hispanic or Latino
Median resident age - Females - American Indian and Alaska Native
Median resident age - Females - Multirace
Median resident age - Females - Other Race
Commute - mean travel time to work (minutes)
Travel time to work - Less than 5 minutes (%)
Travel time to work - Less than 5 minutes (% change since 2000)
Travel time to work - 5 to 9 minutes (%)
Travel time to work - 5 to 9 minutes (% change since 2000)
Travel time to work - 10 to 19 minutes (%)
Travel time to work - 10 to 19 minutes (% change since 2000)
Travel time to work - 20 to 29 minutes (%)
Travel time to work - 20 to 29 minutes (% change since 2000)
Travel time to work - 30 to 39 minutes (%)
Travel time to work - 30 to 39 minutes (% change since 2000)
Travel time to work - 40 to 59 minutes (%)
Travel time to work - 40 to 59 minutes (% change since 2000)
Travel time to work - 60 to 89 minutes (%)
Travel time to work - 60 to 89 minutes (% change since 2000)
Travel time to work - 90 or more minutes (%)
Travel time to work - 90 or more minutes (% change since 2000)
Marital status - Never married (%)
Marital status - Now married (%)
Marital status - Separated (%)
Marital status - Widowed (%)
Marital status - Divorced (%)
Median family income ($)
Median family income (% change since 2000)
Median non-family income ($)
Median non-family income (% change since 2000)
Median per capita income ($)
Median per capita income (% change since 2000)
Median family income ($) - White
Median family income ($) - Black or African American
Median family income ($) - Asian
Median family income ($) - Hispanic or Latino
Median family income ($) - American Indian and Alaska Native
Median family income ($) - Multirace
Median family income ($) - Other Race
Median year house/condo built
Median year apartment built
Year house built - Built 2005 or later (%)
Year house built - Built 2000 to 2004 (%)
Year house built - Built 1990 to 1999 (%)
Year house built - Built 1980 to 1989 (%)
Year house built - Built 1970 to 1979 (%)
Year house built - Built 1960 to 1969 (%)
Year house built - Built 1950 to 1959 (%)
Year house built - Built 1940 to 1949 (%)
Year house built - Built 1939 or earlier (%)
Average household size
Household density (households per square mile)
Average household size - White
Average household size - Black or African American
Average household size - Asian
Average household size - Hispanic or Latino
Average household size - American Indian and Alaska Native
Average household size - Multirace
Average household size - Other Race
Occupied housing units (%)
Vacant housing units (%)
Owner occupied housing units (%)
Renter occupied housing units (%)
Vacancy status - For rent (%)
Vacancy status - For sale only (%)
Vacancy status - Rented or sold, not occupied (%)
Vacancy status - For seasonal, recreational, or occasional use (%)
Vacancy status - For migrant workers (%)
Vacancy status - Other vacant (%)
Residents with income below the poverty level (%)
Residents with income below 50% of the poverty level (%)
Children below poverty level (%)
Poor families by family type - Married-couple family (%)
Poor families by family type - Male, no wife present (%)
Poor families by family type - Female, no husband present (%)
Poverty status for native-born residents (%)
Poverty status for foreign-born residents (%)
Poverty among high school graduates not in families (%)
Poverty among people who did not graduate high school not in families (%)
Residents with income below the poverty level (%) - White
Residents with income below the poverty level (%) - Black or African American
Residents with income below the poverty level (%) - Asian
Residents with income below the poverty level (%) - Hispanic or Latino
Residents with income below the poverty level (%) - American Indian and Alaska Native
Residents with income below the poverty level (%) - Multirace
Residents with income below the poverty level (%) - Other Race
Air pollution - Air Quality Index (AQI)
Air pollution - CO
Air pollution - NO2
Air pollution - SO2
Air pollution - Ozone
Air pollution - PM10
Air pollution - PM25
Air pollution - Pb
Crime - Murders per 100,000 population
Crime - Rapes per 100,000 population
Crime - Robberies per 100,000 population
Crime - Assaults per 100,000 population
Crime - Burglaries per 100,000 population
Crime - Thefts per 100,000 population
Crime - Auto thefts per 100,000 population
Crime - Arson per 100,000 population
Crime - City-data.com crime index
Crime - Violent crime index
Crime - Property crime index
Crime - Murders per 100,000 population (5 year average)
Crime - Rapes per 100,000 population (5 year average)
Crime - Robberies per 100,000 population (5 year average)
Crime - Assaults per 100,000 population (5 year average)
Crime - Burglaries per 100,000 population (5 year average)
Crime - Thefts per 100,000 population (5 year average)
Crime - Auto thefts per 100,000 population (5 year average)
Crime - Arson per 100,000 population (5 year average)
Crime - City-data.com crime index (5 year average)
Crime - Violent crime index (5 year average)
Crime - Property crime index (5 year average)
1996 Presidential Elections Results (%) - Democratic Party (Clinton)
1996 Presidential Elections Results (%) - Republican Party (Dole)
1996 Presidential Elections Results (%) - Other
2000 Presidential Elections Results (%) - Democratic Party (Gore)
2000 Presidential Elections Results (%) - Republican Party (Bush)
2000 Presidential Elections Results (%) - Other
2004 Presidential Elections Results (%) - Democratic Party (Kerry)
2004 Presidential Elections Results (%) - Republican Party (Bush)
2004 Presidential Elections Results (%) - Other
2008 Presidential Elections Results (%) - Democratic Party (Obama)
2008 Presidential Elections Results (%) - Republican Party (McCain)
2008 Presidential Elections Results (%) - Other
2012 Presidential Elections Results (%) - Democratic Party (Obama)
2012 Presidential Elections Results (%) - Republican Party (Romney)
2012 Presidential Elections Results (%) - Other
2016 Presidential Elections Results (%) - Democratic Party (Clinton)
2016 Presidential Elections Results (%) - Republican Party (Trump)
2016 Presidential Elections Results (%) - Other
2020 Presidential Elections Results (%) - Democratic Party (Biden)
2020 Presidential Elections Results (%) - Republican Party (Trump)
2020 Presidential Elections Results (%) - Other
Ancestries Reported - Arab (%)
Ancestries Reported - Czech (%)
Ancestries Reported - Danish (%)
Ancestries Reported - Dutch (%)
Ancestries Reported - English (%)
Ancestries Reported - French (%)
Ancestries Reported - French Canadian (%)
Ancestries Reported - German (%)
Ancestries Reported - Greek (%)
Ancestries Reported - Hungarian (%)
Ancestries Reported - Irish (%)
Ancestries Reported - Italian (%)
Ancestries Reported - Lithuanian (%)
Ancestries Reported - Norwegian (%)
Ancestries Reported - Polish (%)
Ancestries Reported - Portuguese (%)
Ancestries Reported - Russian (%)
Ancestries Reported - Scotch-Irish (%)
Ancestries Reported - Scottish (%)
Ancestries Reported - Slovak (%)
Ancestries Reported - Subsaharan African (%)
Ancestries Reported - Swedish (%)
Ancestries Reported - Swiss (%)
Ancestries Reported - Ukrainian (%)
Ancestries Reported - United States (%)
Ancestries Reported - Welsh (%)
Ancestries Reported - West Indian (%)
Ancestries Reported - Other (%)
Educational Attainment - No schooling completed (%)
Educational Attainment - Less than high school (%)
Educational Attainment - High school or equivalent (%)
Educational Attainment - Less than 1 year of college (%)
Educational Attainment - 1 or more years of college (%)
Educational Attainment - Associate degree (%)
Educational Attainment - Bachelor's degree (%)
Educational Attainment - Master's degree (%)
Educational Attainment - Professional school degree (%)
Educational Attainment - Doctorate degree (%)
School Enrollment - Nursery, preschool (%)
School Enrollment - Kindergarten (%)
School Enrollment - Grade 1 to 4 (%)
School Enrollment - Grade 5 to 8 (%)
School Enrollment - Grade 9 to 12 (%)
School Enrollment - College undergrad (%)
School Enrollment - Graduate or professional (%)
School Enrollment - Not enrolled in school (%)
School enrollment - Public schools (%)
School enrollment - Private schools (%)
School enrollment - Not enrolled (%)
Median number of rooms in houses and condos
Median number of rooms in apartments
Housing units lacking complete plumbing facilities (%)
Housing units lacking complete kitchen facilities (%)
Density of houses
Urban houses (%)
Rural houses (%)
Households with people 60 years and over (%)
Households with people 65 years and over (%)
Households with people 75 years and over (%)
Households with one or more nonrelatives (%)
Households with no nonrelatives (%)
Population in households (%)
Family households (%)
Nonfamily households (%)
Population in families (%)
Family households with own children (%)
Median number of bedrooms in owner occupied houses
Mean number of bedrooms in owner occupied houses
Median number of bedrooms in renter occupied houses
Mean number of bedrooms in renter occupied houses
Median number of vehichles in owner occupied houses
Mean number of vehichles in owner occupied houses
Median number of vehichles in renter occupied houses
Mean number of vehichles in renter occupied houses
Mortgage status - with mortgage (%)
Mortgage status - with second mortgage (%)
Mortgage status - with home equity loan (%)
Mortgage status - with both second mortgage and home equity loan (%)
Mortgage status - without a mortgage (%)
Average family size
Average family size - White
Average family size - Black or African American
Average family size - Asian
Average family size - Hispanic or Latino
Average family size - American Indian and Alaska Native
Average family size - Multirace
Average family size - Other Race
Geographical mobility - Same house 1 year ago (%)
Geographical mobility - Moved within same county (%)
Geographical mobility - Moved from different county within same state (%)
Geographical mobility - Moved from different state (%)
Geographical mobility - Moved from abroad (%)
Place of birth - Born in state of residence (%)
Place of birth - Born in other state (%)
Place of birth - Native, outside of US (%)
Place of birth - Foreign born (%)
Housing units in structures - 1, detached (%)
Housing units in structures - 1, attached (%)
Housing units in structures - 2 (%)
Housing units in structures - 3 or 4 (%)
Housing units in structures - 5 to 9 (%)
Housing units in structures - 10 to 19 (%)
Housing units in structures - 20 to 49 (%)
Housing units in structures - 50 or more (%)
Housing units in structures - Mobile home (%)
Housing units in structures - Boat, RV, van, etc. (%)
House/condo owner moved in on average (years ago)
Renter moved in on average (years ago)
Year householder moved into unit - Moved in 1999 to March 2000 (%)
Year householder moved into unit - Moved in 1995 to 1998 (%)
Year householder moved into unit - Moved in 1990 to 1994 (%)
Year householder moved into unit - Moved in 1980 to 1989 (%)
Year householder moved into unit - Moved in 1970 to 1979 (%)
Year householder moved into unit - Moved in 1969 or earlier (%)
Means of transportation to work - Drove car alone (%)
Means of transportation to work - Carpooled (%)
Means of transportation to work - Public transportation (%)
Means of transportation to work - Bus or trolley bus (%)
Means of transportation to work - Streetcar or trolley car (%)
Means of transportation to work - Subway or elevated (%)
Means of transportation to work - Railroad (%)
Means of transportation to work - Ferryboat (%)
Means of transportation to work - Taxicab (%)
Means of transportation to work - Motorcycle (%)
Means of transportation to work - Bicycle (%)
Means of transportation to work - Walked (%)
Means of transportation to work - Other means (%)
Working at home (%)
Industry diversity
Most Common Industries - Agriculture, forestry, fishing and hunting, and mining (%)
Most Common Industries - Agriculture, forestry, fishing and hunting (%)
Most Common Industries - Mining, quarrying, and oil and gas extraction (%)
Most Common Industries - Construction (%)
Most Common Industries - Manufacturing (%)
Most Common Industries - Wholesale trade (%)
Most Common Industries - Retail trade (%)
Most Common Industries - Transportation and warehousing, and utilities (%)
Most Common Industries - Transportation and warehousing (%)
Most Common Industries - Utilities (%)
Most Common Industries - Information (%)
Most Common Industries - Finance and insurance, and real estate and rental and leasing (%)
Most Common Industries - Finance and insurance (%)
Most Common Industries - Real estate and rental and leasing (%)
Most Common Industries - Professional, scientific, and management, and administrative and waste management services (%)
Most Common Industries - Professional, scientific, and technical services (%)
Most Common Industries - Management of companies and enterprises (%)
Most Common Industries - Administrative and support and waste management services (%)
Most Common Industries - Educational services, and health care and social assistance (%)
Most Common Industries - Educational services (%)
Most Common Industries - Health care and social assistance (%)
Most Common Industries - Arts, entertainment, and recreation, and accommodation and food services (%)
Most Common Industries - Arts, entertainment, and recreation (%)
Most Common Industries - Accommodation and food services (%)
Most Common Industries - Other services, except public administration (%)
Most Common Industries - Public administration (%)
Occupation diversity
Most Common Occupations - Management, business, science, and arts occupations (%)
Most Common Occupations - Management, business, and financial occupations (%)
Most Common Occupations - Management occupations (%)
Most Common Occupations - Business and financial operations occupations (%)
Most Common Occupations - Computer, engineering, and science occupations (%)
Most Common Occupations - Computer and mathematical occupations (%)
Most Common Occupations - Architecture and engineering occupations (%)
Most Common Occupations - Life, physical, and social science occupations (%)
Most Common Occupations - Education, legal, community service, arts, and media occupations (%)
Most Common Occupations - Community and social service occupations (%)
Most Common Occupations - Legal occupations (%)
Most Common Occupations - Education, training, and library occupations (%)
Most Common Occupations - Arts, design, entertainment, sports, and media occupations (%)
Most Common Occupations - Healthcare practitioners and technical occupations (%)
Most Common Occupations - Health diagnosing and treating practitioners and other technical occupations (%)
Most Common Occupations - Health technologists and technicians (%)
Most Common Occupations - Service occupations (%)
Most Common Occupations - Healthcare support occupations (%)
Most Common Occupations - Protective service occupations (%)
Most Common Occupations - Fire fighting and prevention, and other protective service workers including supervisors (%)
Most Common Occupations - Law enforcement workers including supervisors (%)
Most Common Occupations - Food preparation and serving related occupations (%)
Most Common Occupations - Building and grounds cleaning and maintenance occupations (%)
Most Common Occupations - Personal care and service occupations (%)
Most Common Occupations - Sales and office occupations (%)
Most Common Occupations - Sales and related occupations (%)
Most Common Occupations - Office and administrative support occupations (%)
Most Common Occupations - Natural resources, construction, and maintenance occupations (%)
Most Common Occupations - Farming, fishing, and forestry occupations (%)
Most Common Occupations - Construction and extraction occupations (%)
Most Common Occupations - Installation, maintenance, and repair occupations (%)
Most Common Occupations - Production, transportation, and material moving occupations (%)
Most Common Occupations - Production occupations (%)
Most Common Occupations - Transportation occupations (%)
Most Common Occupations - Material moving occupations (%)
People in Group quarters - Institutionalized population (%)
People in Group quarters - Correctional institutions (%)
People in Group quarters - Federal prisons and detention centers (%)
People in Group quarters - Halfway houses (%)
People in Group quarters - Local jails and other confinement facilities (including police lockups) (%)
People in Group quarters - Military disciplinary barracks (%)
People in Group quarters - State prisons (%)
People in Group quarters - Other types of correctional institutions (%)
People in Group quarters - Nursing homes (%)
People in Group quarters - Hospitals/wards, hospices, and schools for the handicapped (%)
People in Group quarters - Hospitals/wards and hospices for chronically ill (%)
People in Group quarters - Hospices or homes for chronically ill (%)
People in Group quarters - Military hospitals or wards for chronically ill (%)
People in Group quarters - Other hospitals or wards for chronically ill (%)
People in Group quarters - Hospitals or wards for drug/alcohol abuse (%)
People in Group quarters - Mental (Psychiatric) hospitals or wards (%)
People in Group quarters - Schools, hospitals, or wards for the mentally retarded (%)
People in Group quarters - Schools, hospitals, or wards for the physically handicapped (%)
People in Group quarters - Institutions for the deaf (%)
People in Group quarters - Institutions for the blind (%)
People in Group quarters - Orthopedic wards and institutions for the physically handicapped (%)
People in Group quarters - Wards in general hospitals for patients who have no usual home elsewhere (%)
People in Group quarters - Wards in military hospitals for patients who have no usual home elsewhere (%)
People in Group quarters - Juvenile institutions (%)
People in Group quarters - Long-term care (%)
People in Group quarters - Homes for abused, dependent, and neglected children (%)
People in Group quarters - Residential treatment centers for emotionally disturbed children (%)
People in Group quarters - Training schools for juvenile delinquents (%)
People in Group quarters - Short-term care, detention or diagnostic centers for delinquent children (%)
People in Group quarters - Type of juvenile institution unknown (%)
People in Group quarters - Noninstitutionalized population (%)
People in Group quarters - College dormitories (includes college quarters off campus) (%)
People in Group quarters - Military quarters (%)
People in Group quarters - On base (%)
People in Group quarters - Barracks, unaccompanied personnel housing (UPH), (Enlisted/Officer), ;and similar group living quarters for military personnel (%)
People in Group quarters - Transient quarters for temporary residents (%)
People in Group quarters - Military ships (%)
People in Group quarters - Group homes (%)
People in Group quarters - Homes or halfway houses for drug/alcohol abuse (%)
People in Group quarters - Homes for the mentally ill (%)
People in Group quarters - Homes for the mentally retarded (%)
People in Group quarters - Homes for the physically handicapped (%)
People in Group quarters - Other group homes (%)
People in Group quarters - Religious group quarters (%)
People in Group quarters - Dormitories (%)
People in Group quarters - Agriculture workers' dormitories on farms (%)
People in Group quarters - Job Corps and vocational training facilities (%)
People in Group quarters - Other workers' dormitories (%)
People in Group quarters - Crews of maritime vessels (%)
People in Group quarters - Other nonhousehold living situations (%)
People in Group quarters - Other noninstitutional group quarters (%)
Residents speaking English at home (%)
Residents speaking English at home - Born in the United States (%)
Residents speaking English at home - Native, born elsewhere (%)
Residents speaking English at home - Foreign born (%)
Residents speaking Spanish at home (%)
Residents speaking Spanish at home - Born in the United States (%)
Residents speaking Spanish at home - Native, born elsewhere (%)
Residents speaking Spanish at home - Foreign born (%)
Residents speaking other language at home (%)
Residents speaking other language at home - Born in the United States (%)
Residents speaking other language at home - Native, born elsewhere (%)
Residents speaking other language at home - Foreign born (%)
Class of Workers - Employee of private company (%)
Class of Workers - Self-employed in own incorporated business (%)
Class of Workers - Private not-for-profit wage and salary workers (%)
Class of Workers - Local government workers (%)
Class of Workers - State government workers (%)
Class of Workers - Federal government workers (%)
Class of Workers - Self-employed workers in own not incorporated business and Unpaid family workers (%)
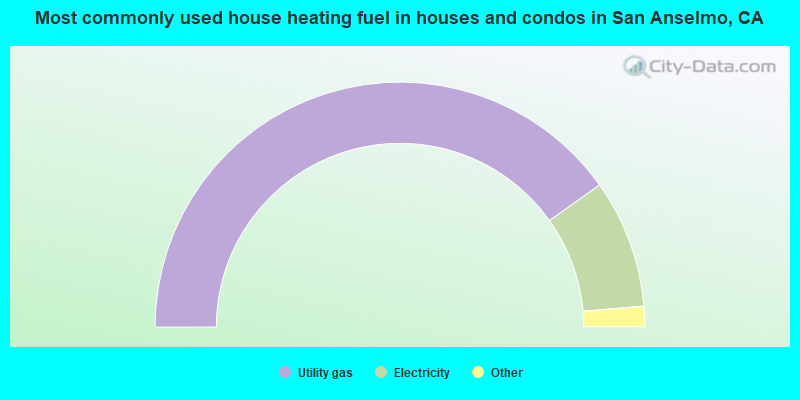
House heating fuel used in houses and condos - Utility gas (%)
House heating fuel used in houses and condos - Bottled, tank, or LP gas (%)
House heating fuel used in houses and condos - Electricity (%)
House heating fuel used in houses and condos - Fuel oil, kerosene, etc. (%)
House heating fuel used in houses and condos - Coal or coke (%)
House heating fuel used in houses and condos - Wood (%)
House heating fuel used in houses and condos - Solar energy (%)
House heating fuel used in houses and condos - Other fuel (%)
House heating fuel used in houses and condos - No fuel used (%)
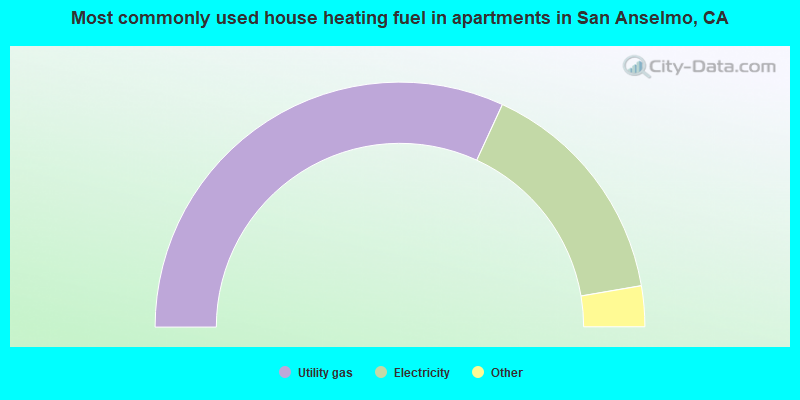
House heating fuel used in apartments - Utility gas (%)
House heating fuel used in apartments - Bottled, tank, or LP gas (%)
House heating fuel used in apartments - Electricity (%)
House heating fuel used in apartments - Fuel oil, kerosene, etc. (%)
House heating fuel used in apartments - Coal or coke (%)
House heating fuel used in apartments - Wood (%)
House heating fuel used in apartments - Solar energy (%)
House heating fuel used in apartments - Other fuel (%)
House heating fuel used in apartments - No fuel used (%)
Armed forces status - In Armed Forces (%)
Armed forces status - Civilian (%)
Armed forces status - Civilian - Veteran (%)
Armed forces status - Civilian - Nonveteran (%)
Fatal accidents locations in years 2005-2021
Fatal accidents locations in 2005
Fatal accidents locations in 2006
Fatal accidents locations in 2007
Fatal accidents locations in 2008
Fatal accidents locations in 2009
Fatal accidents locations in 2010
Fatal accidents locations in 2011
Fatal accidents locations in 2012
Fatal accidents locations in 2013
Fatal accidents locations in 2014
Fatal accidents locations in 2015
Fatal accidents locations in 2016
Fatal accidents locations in 2017
Fatal accidents locations in 2018
Fatal accidents locations in 2019
Fatal accidents locations in 2020
Fatal accidents locations in 2021
Alcohol use - People drinking some alcohol every month (%)
Alcohol use - People not drinking at all (%)
Alcohol use - Average days/month drinking alcohol
Alcohol use - Average drinks/week
Alcohol use - Average days/year people drink much
Audiometry - Average condition of hearing (%)
Audiometry - People that can hear a whisper from across a quiet room (%)
Audiometry - People that can hear normal voice from across a quiet room (%)
Audiometry - Ears ringing, roaring, buzzing (%)
Audiometry - Had a job exposure to loud noise (%)
Audiometry - Had off-work exposure to loud noise (%)
Blood Pressure & Cholesterol - Has high blood pressure (%)
Blood Pressure & Cholesterol - Checking blood pressure at home (%)
Blood Pressure & Cholesterol - Frequently checking blood cholesterol (%)
Blood Pressure & Cholesterol - Has high cholesterol level (%)
Consumer Behavior - Money monthly spent on food at supermarket/grocery store
Consumer Behavior - Money monthly spent on food at other stores
Consumer Behavior - Money monthly spent on eating out
Consumer Behavior - Money monthly spent on carryout/delivered foods
Consumer Behavior - Income spent on food at supermarket/grocery store (%)
Consumer Behavior - Income spent on food at other stores (%)
Consumer Behavior - Income spent on eating out (%)
Consumer Behavior - Income spent on carryout/delivered foods (%)
Current Health Status - General health condition (%)
Current Health Status - Blood donors (%)
Current Health Status - Has blood ever tested for HIV virus (%)
Current Health Status - Left-handed people (%)
Dermatology - People using sunscreen (%)
Diabetes - Diabetics (%)
Diabetes - Had a blood test for high blood sugar (%)
Diabetes - People taking insulin (%)
Diet Behavior & Nutrition - Diet health (%)
Diet Behavior & Nutrition - Milk product consumption (# of products/month)
Diet Behavior & Nutrition - Meals not home prepared (#/week)
Diet Behavior & Nutrition - Meals from fast food or pizza place (#/week)
Diet Behavior & Nutrition - Ready-to-eat foods (#/month)
Diet Behavior & Nutrition - Frozen meals/pizza (#/month)
Drug Use - People that ever used marijuana or hashish (%)
Drug Use - Ever used hard drugs (%)
Drug Use - Ever used any form of cocaine (%)
Drug Use - Ever used heroin (%)
Drug Use - Ever used methamphetamine (%)
Health Insurance - People covered by health insurance (%)
Kidney Conditions-Urology - Avg. # of times urinating at night
Medical Conditions - People with asthma (%)
Medical Conditions - People with anemia (%)
Medical Conditions - People with psoriasis (%)
Medical Conditions - People with overweight (%)
Medical Conditions - Elderly people having difficulties in thinking or remembering (%)
Medical Conditions - People who ever received blood transfusion (%)
Medical Conditions - People having trouble seeing even with glass/contacts (%)
Medical Conditions - People with arthritis (%)
Medical Conditions - People with gout (%)
Medical Conditions - People with congestive heart failure (%)
Medical Conditions - People with coronary heart disease (%)
Medical Conditions - People with angina pectoris (%)
Medical Conditions - People who ever had heart attack (%)
Medical Conditions - People who ever had stroke (%)
Medical Conditions - People with emphysema (%)
Medical Conditions - People with thyroid problem (%)
Medical Conditions - People with chronic bronchitis (%)
Medical Conditions - People with any liver condition (%)
Medical Conditions - People who ever had cancer or malignancy (%)
Mental Health - People who have little interest in doing things (%)
Mental Health - People feeling down, depressed, or hopeless (%)
Mental Health - People who have trouble sleeping or sleeping too much (%)
Mental Health - People feeling tired or having little energy (%)
Mental Health - People with poor appetite or overeating (%)
Mental Health - People feeling bad about themself (%)
Mental Health - People who have trouble concentrating on things (%)
Mental Health - People moving or speaking slowly or too fast (%)
Mental Health - People having thoughts they would be better off dead (%)
Oral Health - Average years since last visit a dentist
Oral Health - People embarrassed because of mouth (%)
Oral Health - People with gum disease (%)
Oral Health - General health of teeth and gums (%)
Oral Health - Average days a week using dental floss/device
Oral Health - Average days a week using mouthwash for dental problem
Oral Health - Average number of teeth
Pesticide Use - Households using pesticides to control insects (%)
Pesticide Use - Households using pesticides to kill weeds (%)
Physical Activity - People doing vigorous-intensity work activities (%)
Physical Activity - People doing moderate-intensity work activities (%)
Physical Activity - People walking or bicycling (%)
Physical Activity - People doing vigorous-intensity recreational activities (%)
Physical Activity - People doing moderate-intensity recreational activities (%)
Physical Activity - Average hours a day doing sedentary activities
Physical Activity - Average hours a day watching TV or videos
Physical Activity - Average hours a day using computer
Physical Functioning - People having limitations keeping them from working (%)
Physical Functioning - People limited in amount of work they can do (%)
Physical Functioning - People that need special equipment to walk (%)
Physical Functioning - People experiencing confusion/memory problems (%)
Physical Functioning - People requiring special healthcare equipment (%)
Prescription Medications - Average number of prescription medicines taking
Preventive Aspirin Use - Adults 40+ taking low-dose aspirin (%)
Reproductive Health - Vaginal deliveries (%)
Reproductive Health - Cesarean deliveries (%)
Reproductive Health - Deliveries resulted in a live birth (%)
Reproductive Health - Pregnancies resulted in a delivery (%)
Reproductive Health - Women breastfeeding newborns (%)
Reproductive Health - Women that had a hysterectomy (%)
Reproductive Health - Women that had both ovaries removed (%)
Reproductive Health - Women that have ever taken birth control pills (%)
Reproductive Health - Women taking birth control pills (%)
Reproductive Health - Women that have ever used Depo-Provera or injectables (%)
Reproductive Health - Women that have ever used female hormones (%)
Sexual Behavior - People 18+ that ever had sex (vaginal, anal, or oral) (%)
Sexual Behavior - Males 18+ that ever had vaginal sex with a woman (%)
Sexual Behavior - Males 18+ that ever performed oral sex on a woman (%)
Sexual Behavior - Males 18+ that ever had anal sex with a woman (%)
Sexual Behavior - Males 18+ that ever had any sex with a man (%)
Sexual Behavior - Females 18+ that ever had vaginal sex with a man (%)
Sexual Behavior - Females 18+ that ever performed oral sex on a man (%)
Sexual Behavior - Females 18+ that ever had anal sex with a man (%)
Sexual Behavior - Females 18+ that ever had any kind of sex with a woman (%)
Sexual Behavior - Average age people first had sex
Sexual Behavior - Average number of female sex partners in lifetime (males 18+)
Sexual Behavior - Average number of female vaginal sex partners in lifetime (males 18+)
Sexual Behavior - Average age people first performed oral sex on a woman (18+)
Sexual Behavior - Average number of woman performed oral sex on in lifetime (18+)
Sexual Behavior - Average number of male sex partners in lifetime (males 18+)
Sexual Behavior - Average number of male anal sex partners in lifetime (males 18+)
Sexual Behavior - Average age people first performed oral sex on a man (18+)
Sexual Behavior - Average number of male oral sex partners in lifetime (18+)
Sexual Behavior - People using protection when performing oral sex (%)
Sexual Behavior - Average number of times people have vaginal or anal sex a year
Sexual Behavior - People having sex without condom (%)
Sexual Behavior - Average number of male sex partners in lifetime (females 18+)
Sexual Behavior - Average number of male vaginal sex partners in lifetime (females 18+)
Sexual Behavior - Average number of female sex partners in lifetime (females 18+)
Sexual Behavior - Circumcised males 18+ (%)
Sleep Disorders - Average hours sleeping at night
Sleep Disorders - People that has trouble sleeping (%)
Smoking-Cigarette Use - People smoking cigarettes (%)
Taste & Smell - People 40+ having problems with smell (%)
Taste & Smell - People 40+ having problems with taste (%)
Taste & Smell - People 40+ that ever had wisdom teeth removed (%)
Taste & Smell - People 40+ that ever had tonsils teeth removed (%)
Taste & Smell - People 40+ that ever had a loss of consciousness because of a head injury (%)
Taste & Smell - People 40+ that ever had a broken nose or other serious injury to face or skull (%)
Taste & Smell - People 40+ that ever had two or more sinus infections (%)
Weight - Average height (inches)
Weight - Average weight (pounds)
Weight - Average BMI
Weight - People that are obese (%)
Weight - People that ever were obese (%)
Weight - People trying to lose weight (%)
9,729 77.6% White alone 935 7.5% Hispanic 779 6.2% Asian alone 723 5.8% Two or more races 187 1.5% Black alone 75 0.6% Other race alone 3 0.02% Native Hawaiian and Other
According to our research of California and other state lists, there were 4 registered sex offenders living in San Anselmo, California as of April 27, 2024 . The ratio of all residents to sex offenders in San Anselmo is 3,171 to 1.The ratio of registered sex offenders to all residents in this city is much lower than the state average.
Latest news from San Anselmo, CA collected exclusively by city-data.com from local newspapers, TV, and radio stations
Ancestries: Irish (8.6%), Italian (8.2%), English (7.5%), Northern European (6.3%), German (6.1%), American (6.0%).
Current Local Time:
Incorporated on 04/9/1907
Land area: 2.75 square miles.
Population density: 4,576 people per square mile (average).
962 residents are foreign born (3.3% Asia , 2.4% Europe , 1.2% Latin America ).
This town:
7.7%California:
26.5%
Median real estate property taxes paid for housing units with mortgages in 2022: $10,001 (0.6%)Median real estate property taxes paid for housing units with no mortgage in 2022: $7,667 (0.5%)
Nearest city with pop. 50,000+: Ross Valley, CA (1.7 miles
Nearest city with pop. 200,000+: West Contra Costa, CA (13.6 miles
Nearest city with pop. 1,000,000+: Los Angeles, CA
Nearest cities:
Latitude: 37.98 N, Longitude: 122.57 W
Daytime population change due to commuting: -1,926 (-15.4%)Workers who live and work in this town: 2,698 (42.0%)
Area code commonly used in this area: 415
San Anselmo tourist attractions:
Single-family new house construction building permits:
2022: 21 buildings , average cost: $166,2002021: 15 buildings , average cost: $159,6002020: 15 buildings , average cost: $322,8002019: 6 buildings , average cost: $406,2002018: 8 buildings , average cost: $684,4002017: 8 buildings , average cost: $691,9002016: 4 buildings , average cost: $661,6002015: 4 buildings , average cost: $947,7002014: 3 buildings , average cost: $655,0002013: 3 buildings , average cost: $655,0002012: 4 buildings , average cost: $612,6002011: 2 buildings , average cost: $671,5002010: 3 buildings , average cost: $572,6002009: 3 buildings , average cost: $565,0002008: 4 buildings , average cost: $651,1002007: 10 buildings , average cost: $1,153,6002006: 7 buildings , average cost: $538,2002005: 8 buildings , average cost: $445,8002004: 5 buildings , average cost: $623,0002003: 7 buildings , average cost: $573,9002002: 8 buildings , average cost: $599,0002001: 8 buildings , average cost: $372,1002000: 15 buildings , average cost: $354,6001999: 10 buildings , average cost: $443,7001998: 5 buildings , average cost: $361,5001997: 8 buildings , average cost: $169,600Unemployment in December 2023:
Population change in the 1990s: +718 (+6.2%).
Most common industries in San Anselmo, CA (%)
Both Males Females
Professional, scientific, technical services (17.9%)
Educational services (11.3%)
Health care (9.0%)
Finance & insurance (6.4%)
Construction (6.2%)
Accommodation & food services (4.4%)
Arts, entertainment, recreation (4.1%)
Professional, scientific, technical services (19.9%)
Construction (10.5%)
Educational services (7.0%)
Finance & insurance (5.5%)
Accommodation & food services (4.7%)
Health care (4.5%)
Arts, entertainment, recreation (4.3%)
Professional, scientific, technical services (15.9%)
Educational services (15.5%)
Health care (13.4%)
Finance & insurance (7.4%)
Administrative & support & waste management services (5.0%)
Accommodation & food services (4.0%)
Arts, entertainment, recreation (3.9%)
Most common occupations in San Anselmo, CA (%)
Both Males Females
Other management occupations, except farmers and farm managers (7.3%)
Other sales and related occupations, including supervisors (4.3%)
Retail sales workers, except cashiers (3.7%)
Preschool, kindergarten, elementary, and middle school teachers (3.5%)
Art and design workers (3.5%)
Sales representatives, services, wholesale and manufacturing (3.4%)
Top executives (3.3%)
Other management occupations, except farmers and farm managers (8.4%)
Other sales and related occupations, including supervisors (5.5%)
Computer specialists (4.2%)
Lawyers (4.0%)
Sales representatives, services, wholesale and manufacturing (3.9%)
Retail sales workers, except cashiers (3.8%)
Art and design workers (3.4%)
Other management occupations, except farmers and farm managers (6.2%)
Preschool, kindergarten, elementary, and middle school teachers (6.0%)
Registered nurses (4.6%)
Secretaries and administrative assistants (4.2%)
Art and design workers (3.7%)
Bookkeeping, accounting, and auditing clerks (3.7%)
Top executives (3.6%)
Earthquake activity:
San Anselmo-area historical earthquake activity is significantly above California state average. It is 7332% greater than the overall U.S. average. On 4/18/1906 at 13:12:21, a magnitude 7.9 (7.9 UK, Class: Major, Intensity: VIII - XII) earthquake occurred 23.6 miles away from the city center, causing $524,000,000 total damage On 10/18/1989 at 00:04:15, a magnitude 7.1 (6.5 MB, 7.1 MS, 6.9 MW, 7.0 ML) earthquake occurred 74.4 miles away from the city center, causing 62 deaths ( 62 shaking deaths) and 3757 injuries, causing $1,305,032,704 total damage On 1/31/1922 at 13:17:28, a magnitude 7.6 (7.6 UK) earthquake occurred 246.7 miles away from San Anselmo center On 11/4/1927 at 13:51:53, a magnitude 7.5 (7.5 UK) earthquake occurred 228.6 miles away from the city center On 7/21/1952 at 11:52:14, a magnitude 7.7 (7.7 UK) earthquake occurred 286.1 miles away from the city center, causing $50,000,000 total damage On 4/25/1992 at 18:06:04, a magnitude 7.2 (6.3 MB, 7.1 MS, 7.2 MW, 7.1 MW, Depth: 9.4 mi) earthquake occurred 182.6 miles away from the city center, causing $75,000,000 total damage Magnitude types: body-wave magnitude (MB), local magnitude (ML), surface-wave magnitude (MS), moment magnitude (MW) Natural disasters: The number of natural disasters in Marin County (22) is greater than the US average (15).Major Disasters (Presidential) Declared: 15Emergencies Declared: 2Floods: 17, Storms: 9, Mudslides: 7, Winter Storms: 7, Landslides: 6, Drought: 1, Earthquake: 1, Freeze: 1, Heavy Rain: 1, Hurricane: 1, Tornado: 1, Other: 1 (Note: some incidents may be assigned to more than one category). Hospitals and medical centers near San Anselmo: ROSS GENERAL HOSPITAL (Nursing Home, about 1 miles away; ROSS, CA)
KINDRED NURSING AND REHABILITATION-FIFTH AVENUE (Nursing Home, about 2 miles away; SAN RAFAEL, CA)
NAZARETH HOUSE (Nursing Home, about 2 miles away; SAN RAFAEL, CA)
KAISER FOUNDATION HOSPITAL (about 2 miles away; SAN RAFAEL, CA)
VILLA MARIN (Nursing Home, about 3 miles away; SAN RAFAEL, CA)
NORTHGATE DIALYSIS CENTER (Dialysis Facility, about 3 miles away; SAN RAFAEL, CA)
SUTTER VISITING NURSE ASSOCIATION (Home Health Center, about 3 miles away; SAN RAFAEL, CA)
Amtrak stations near San Anselmo: 13 miles: RICHMOND (16TH ST. & MACDONALD AVE.) Services: fully wheelchair accessible, enclosed waiting area, public restrooms, public payphones, free short-term parking, call for taxi service, public transit connection.
15 miles: SAN FRANCISCO FISHERMANS (SAN FRANCISCO, PIER 39) - Bus Station Services: fully wheelchair accessible, public payphones, full-service food facilities, paid short-term parking, paid long-term parking, call for taxi service, public transit connection.
16 miles: SAN FRANCISCO (31 THE EMBARCADERO) - Bus Station Services: ticket office, fully wheelchair accessible, enclosed waiting area, public restrooms, public payphones, full-service food facilities, paid short-term parking, call for taxi service, public transit connection.
College/University in San Anselmo: San Francisco Theological Seminary Full-time enrollment: 70; Location: 105 Seminary Road; Private, not-for-profit; Website: www.sfts.edu; Offers Doctor's degree )
Colleges/universities with over 2000 students nearest to San Anselmo:
College of Marin (about 2 miles; Kentfield, CA ; Full-time enrollment: 4,489)
Contra Costa College (about 13 miles; San Pablo, CA ; FT enrollment: 4,249)
University of San Francisco (about 16 miles; San Francisco, CA ; FT enrollment: 9,190)
Academy of Art University (about 17 miles; San Francisco, CA ; FT enrollment: 12,352)
Berkeley City College (about 18 miles; Berkeley, CA ; FT enrollment: 3,146)
University of California-Berkeley (about 19 miles; Berkeley, CA ; FT enrollment: 37,127)
San Francisco State University (about 19 miles; San Francisco, CA ; FT enrollment: 24,644)
Public high school in San Anselmo:
Private high schools in San Anselmo: SAN DOMENICO SCHOOL Students: 573, Location: 1500 BUTTERFIELD RD, Grades: PK-12)
OAK HILL SCHOOL Students: 32, Location: 300 SUNNY HILLS DR #6, Grades: 2-12)MARIN ACADEMIC CENTER/SUNNY HILLS SERVICES Students: 18, Location: 300 SUNNY HILLS DR, Grades: 2-9)
Public elementary/middle schools in San Anselmo:
Private elementary/middle school in San Anselmo: ST ANSELM SCHOOL Students: 271, Location: 40 BELLE AVE, Grades: KG-8)
See full list of schools located in San Anselmo Library in San Anselmo: SAN ANSELMO PUBLIC LIBRARY Operating income: $484,600; Location: 110 TUNSTEAD AVE.; 48,103 books ; 9,182 e-books ; 1,728 audio materials ; 2,488 video materials ; 8 other licensed databases ; 89 print serial subscriptions )
Notable locations in San Anselmo: (A) , San Anselmo Public Library (B) , Robson House (C) , San Anselmo Town Hall (D) , Ross Valley Fire Department Station 20 (E) , Ross Valley Fire Department Station 19 Headquarters (F) . Display/hide their locations on the map
Shopping Center: (1) . Display/hide its location on the map
Churches in San Anselmo include: (A) , First Baptist Church (B) , Montgomery Memorial Chapel (C) , Saint Nicholas Orthodox Church (D) . Display/hide their locations on the map
Creek: (A) . Display/hide its location on the map
Parks in San Anselmo include: (1) , Isabel Cook Recreation Center (2) , Lonsdale Station Park (3) , Oak Park (4) , Robson Park (5) , San Anselmo Memorial Park (6) , Sorich Ranch Park (7) . Display/hide their locations on the map
Hotel:
Birthplace of: Brooke Smith (basketball) - Basketball player, Kahlil Bell - Football player, Matt Dearborn - Television director, Nick Vita - College basketball player (Fordham Rams).
Marin County has a predicted average indoor radon screening level less than 2 pCi/L (pico curies per liter) - Low Potential Drinking water stations with addresses in San Anselmo that have no violations reported:
ECHO PEAK WATER ASSOCIATION (Population served: 32, Primary Water Source Type: Groundwater)
Average household size: This town:
2.3 peopleCalifornia:
2.9 people
Percentage of family households: This town:
62.0%Whole state:
68.7%
Percentage of households with unmarried partners: This town:
6.5%Whole state:
7.2%
Likely homosexual households (counted as self-reported same-sex unmarried-partner households)
Lesbian couples: 0.7% of all households Gay men: 0.5% of all households
People in group quarters in San Anselmo in 2010:
35 people in group homes intended for adults
13 people in workers' group living quarters and job corps centers
4 people in residential treatment centers for adults
People in group quarters in San Anselmo in 2000:
125 people in college dormitories (includes college quarters off campus)
49 people in other noninstitutional group quarters
48 people in other group homes
29 people in homes for the mentally retarded
3 people in other nonhousehold living situations
2 people in religious group quarters
Banks with branches in San Anselmo (2011 data):
Bank of America, National Association: San Anselmo Branch at 401 San Anselmo Avenue, branch established on 1927/02/19. Info updated 2009/11/18: Bank assets: $1,451,969.3 mil, Deposits: $1,077,176.8 mil, headquarters in Charlotte, NC, positive income , 5782 total offices , Holding Company: Bank Of America Corporation
Wells Fargo Bank, National Association: San Anselmo Branch at 3 Tunstead Avenue, branch established on 1924/02/18. Info updated 2011/04/05: Bank assets: $1,161,490.0 mil, Deposits: $905,653.0 mil, headquarters in Sioux Falls, SD, positive income , 6395 total offices , Holding Company: Wells Fargo & Company
Union Bank, National Association: San Anselmo Branch at 100 Sir Francis Drake Blvd., branch established on 2004/04/06. Info updated 2011/09/01: Bank assets: $88,967.5 mil, Deposits: $65,286.4 mil, headquarters in San Francisco, CA, positive income , Commercial Lending Specialization, 403 total offices , Holding Company: Mitsubishi Ufj Financial Group, Inc.
Westamerica Bank: San Anselmo Branch at 834 Sir Francis Drake Boulevard, branch established on 1984/04/16. Info updated 2011/06/21: Bank assets: $4,998.1 mil, Deposits: $4,253.2 mil, headquarters in San Rafael, CA, positive income , Commercial Lending Specialization, 98 total offices , Holding Company: Westamerica Bancorporation
U.S. Bank National Association: San Anselmo Branch at 305 San Anselmo Avenue, branch established on 1985/06/30. Info updated 2012/01/30: Bank assets: $330,470.8 mil, Deposits: $236,091.5 mil, headquarters in Cincinnati, OH, positive income , 3121 total offices , Holding Company: U.S. Bancorp
For population 15 years and over in San Anselmo:
Never married: 26.0%Now married: 55.0%Separated: 1.8%Widowed: 2.8%Divorced: 14.4% For population 25 years and over in San Anselmo:
High school or higher: 97.8%Bachelor's degree or higher: 70.2%Graduate or professional degree: 27.8%Unemployed: 3.6%Mean travel time to work (commute): 19.6 minutes
Education Gini index (Inequality in education) Here:
8.3California average:
15.5
Religion statistics for San Anselmo, CA (based on Marin County data)
Religion Adherents Congregations Catholic 77,114 30 Other 12,119 50 Mainline Protestant 9,458 48 Evangelical Protestant 8,817 71 Orthodox 1,525 3 Black Protestant 775 2 None 142,601 -
Source: Clifford Grammich, Kirk Hadaway, Richard Houseal, Dale E.Jones, Alexei Krindatch, Richie Stanley and Richard H.Taylor. 2012. 2010 U.S.Religion Census: Religious Congregations & Membership Study. Association of Statisticians of American Religious Bodies. Jones, Dale E., et al. 2002. Congregations and Membership in the United States 2000. Nashville, TN: Glenmary Research Center. Graphs represent county-level data
Food Environment Statistics: Number of grocery stores : 64Here :
2.59 / 10,000 pop.State :
2.14 / 10,000 pop.
Number of supercenters and club stores : 1Marin County :
0.04 / 10,000 pop.California :
0.04 / 10,000 pop.
Number of convenience stores (no gas) : 15Marin County :
0.61 / 10,000 pop.California :
0.62 / 10,000 pop.
Number of convenience stores (with gas) : 32Marin County :
1.30 / 10,000 pop.State :
1.49 / 10,000 pop.
Number of full-service restaurants : 295Here :
11.95 / 10,000 pop.California :
7.42 / 10,000 pop.
Adult diabetes rate : Marin County :
7.0%California :
7.3%
Adult obesity rate : Marin County :
17.1%California :
21.3%
Low-income preschool obesity rate : Marin County :
17.1%California :
17.9%
Health and Nutrition: Healthy diet rate : San Anselmo:
54.9%State:
49.4%
Average overall health of teeth and gums : This city:
54.5%California:
48.0%
Average BMI : San Anselmo:
28.0California:
28.1
People feeling badly about themselves : Here:
20.7%California:
20.2%
People not drinking alcohol at all : San Anselmo:
7.7%California:
11.2%
Average hours sleeping at night : Overweight people : Here:
34.3%California:
31.5%
General health condition : This city:
61.0%California:
56.4%
Average condition of hearing : San Anselmo:
80.9%California:
80.9%
More about Health and Nutrition of San Anselmo, CA Residents
Local government employment and payroll (March 2022)
Function
Full-time employees
Monthly full-time payroll
Average yearly full-time wage
Part-time employees
Monthly part-time payroll
Other and Unallocable
9 $74,037 $98,716 0 $0 Parks and Recreation
7 $50,524 $86,613 18 $19,270 Local Libraries
4 $30,112 $90,336 15 $9,754 Other Government Administration
3 $42,174 $168,696 8 $6,274 Streets and Highways
3 $18,110 $72,440 1 $2,772 Financial Administration
2 $22,372 $134,232 1 $1,988
Totals for Government
28 $237,329 $101,712 43 $40,058
San Anselmo government finances - Expenditure in 2017 (per resident):
Construction - Regular Highways: $1,549,000 ($123.24)
Current Operations - Police Protection: $4,150,000 ($330.18)
Local Fire Protection: $3,712,000 ($295.33)Protective Inspection and Regulation - Other: $2,774,000 ($220.70)Parks and Recreation: $2,080,000 ($165.49)Central Staff Services: $1,667,000 ($132.63)Financial Administration: $920,000 ($73.20)Regular Highways: $859,000 ($68.34)Libraries: $840,000 ($66.83)General - Interest on Debt: $360,000 ($28.64)
Intergovernmental to Local - Other - Police Protection: $4,144,000 ($329.70)
Other - Local Fire Protection: $3,722,000 ($296.13)Other - Health - Other: $150,000 ($11.93)Other - General - Other: $118,000 ($9.39)Other Capital Outlay - Local Fire Protection: $226,000 ($17.98)
Libraries: $87,000 ($6.92)Protective Inspection and Regulation - Other: $80,000 ($6.36)Central Staff Services: $78,000 ($6.21)Parks and Recreation: $13,000 ($1.03)
San Anselmo government finances - Revenue in 2017 (per resident):
Charges - Parks and Recreation: $1,587,000 ($126.26)
Other: $419,000 ($33.34)Parking Facilities: $61,000 ($4.85)Regular Highways: $10,000 ($0.80)Local Intergovernmental - Other: $227,000 ($18.06)
Miscellaneous - Rents: $153,000 ($12.17)
Fines and Forfeits: $103,000 ($8.19)General Revenue - Other: $32,000 ($2.55)Interest Earnings: $13,000 ($1.03)State Intergovernmental - Other: $787,000 ($62.61)
Highways: $254,000 ($20.21)General Local Government Support: $51,000 ($4.06)Tax - Property: $10,722,000 ($853.05)
Other: $3,586,000 ($285.31)General Sales and Gross Receipts: $1,842,000 ($146.55)Public Utilities Sales: $747,000 ($59.43)Other License: $526,000 ($41.85)Occupation and Business License - Other: $246,000 ($19.57)Documentary and Stock Transfer: $110,000 ($8.75)
San Anselmo government finances - Debt in 2017 (per resident):
Long Term Debt - Beginning Outstanding - Unspecified Public Purpose: $9,439,000 ($750.97)
Outstanding Unspecified Public Purpose: $8,301,000 ($660.43)Retired Unspecified Public Purpose: $1,138,000 ($90.54)
San Anselmo government finances - Cash and Securities in 2017 (per resident):
Bond Funds - Cash and Securities: $150,000 ($11.93)
Other Funds - Cash and Securities: $6,826,000 ($543.08)
Sinking Funds - Cash and Securities: $899,000 ($71.53)
Businesses in San Anselmo, CA
Name Count Name Count
CVS 1 Safeway 1 FedEx 5 Starbucks 1 Jones New York 1 UPS 3 New Balance 1 Vons 1 Nike 3 Walgreens 1
Strongest AM radio stations in San Anselmo:
KCBS (740 AM; 50 kW; SAN FRANCISCO, CA; Owner: INFINITY BROADCASTING OPERATIONS, INC.)
KTRB (860 AM; 50 kW; MODESTO, CA; Owner: PAPPAS RADIO OF CALIFORNIA, A CALIFORNIA LIMITED PARTNERSHIP)
KIQI (1010 AM; 35 kW; SAN FRANCISCO, CA; Owner: RADIO UNICA OF SAN FRANCISCO LICENSE CORP.)
KNEW (910 AM; 20 kW; OAKLAND, CA; Owner: AMFM RADIO LICENSES, L.L.C.)
KNBR (680 AM; 50 kW; SAN FRANCISCO, CA; Owner: KNBR LICO, INC.)
KTCT (1050 AM; 50 kW; SAN MATEO, CA; Owner: SUSQUEHANNA RADIO CORP.)
KFAX (1100 AM; 50 kW; SAN FRANCISCO, CA; Owner: GOLDEN GATE BROADCASTING CO, INC.)
KGO (810 AM; 50 kW; SAN FRANCISCO, CA; Owner: KGO-AM RADIO, INC.)
KYCY (1550 AM; 50 kW; SAN FRANCISCO, CA; Owner: INFINITY BROADCASTING OPERATIONS, INC.)
KFRC (610 AM; 5 kW; SAN FRANCISCO, CA; Owner: INFINITY BROADCASTING CORPORATION OF LOS ANGELES)
KDYA (1190 AM; 10 kW; VALLEJO, CA; Owner: BAYBRIDGE COMMUNICATIONS, L.L.C.)
KSFO (560 AM; 5 kW; SAN FRANCISCO, CA; Owner: KGO-AM RADIO, INC.)
KABL (960 AM; 5 kW; OAKLAND, CA; Owner: AMFM RADIO LICENSES, L.L.C.)
Strongest FM radio stations in San Anselmo:
KSFB-FM (100.7 FM; SAN RAFAEL, CA; Owner: GOLDEN GATE BROADCASTING COMPANY, INC.)
KDFC-FM (102.1 FM; SAN FRANCISCO, CA; Owner: BONNEVILLE HOLDING COMPANY)
KISQ (98.1 FM; SAN FRANCISCO, CA; Owner: AMFM RADIO LICENSES, L.L.C.)
KEAR (106.9 FM; SAN FRANCISCO, CA; Owner: FAMILY STATIONS, INC.)
KSOL-FM2 (98.9 FM; SAUSALITO, ETC., CA; Owner: TMS LICENSE CALIFORNIA, INC)
KOIT-FM (96.5 FM; SAN FRANCISCO, CA; Owner: BONNEVILLE HOLDING COMPANY)
KKSF (103.7 FM; SAN FRANCISCO, CA; Owner: AMFM RADIO LICENSES, L.L.C.)
KFOG (104.5 FM; SAN FRANCISCO, CA; Owner: KFFG LICO, INC)
KSOL (98.9 FM; SAN FRANCISCO, CA; Owner: TMS LICENSE CALIFORNIA, INC)
KKSF-FM1 (103.7 FM; PLEASANTON, ETC., CA; Owner: AMFM RADIO LICENSES, L.L.C.)
KBLX-FM2 (102.9 FM; PLEASANTON, CA; Owner: ICBC BROADCAST HOLDINGS -CA, INC.)
KSOL-FM3 (98.9 FM; PLEASANTON, CA; Owner: TMS LICENSE CALIFORNIA, INC)
KFRC-FM3 (99.7 FM; WALNUT CREEK, CA; Owner: INFINITY KFRC-FM, INC.)
KZBR-FM1 (95.7 FM; WALNUT CREEK, CA; Owner: BONNEVILLE HOLDING COMPANY)
KISQ-FM3 (98.1 FM; CONCORD, CA; Owner: AMFM RADIO LICENSES, L.L.C.)
KWMR (90.5 FM; POINT REYES STATION, CA; Owner: WEST MARIN COMMUNITY RADIO, INC.)
KMEL-FM1 (106.1 FM; CONCORD, CA; Owner: AMFM RADIO LICENSES, L.L.C.)
KYLD (94.9 FM; SAN FRANCISCO, CA; Owner: AMFM RADIO LICENSES, L.L.C.)
KMEL (106.1 FM; SAN FRANCISCO, CA; Owner: AMFM RADIO LICENSES, L.L.C.)
KZBR (95.7 FM; SAN FRANCISCO, CA; Owner: BONNEVILLE HOLDING COMPANY)
TV broadcast stations around San Anselmo:
KQED (Channel 9; SAN FRANCISCO, CA; Owner: KQED, INC.)
KGO-TV (Channel 7; SAN FRANCISCO, CA; Owner: KGO TELEVISION, INC.)
KPIX-TV (Channel 5; SAN FRANCISCO, CA; Owner: CBS BROADCASTING INC.)
KTVU (Channel 2; OAKLAND, CA; Owner: KTVU PARTNERSHIP)
KRON-TV (Channel 4; SAN FRANCISCO, CA; Owner: YOUNG BROADCASTING OF SAN FRANCISCO, INC.)
KMTP-TV (Channel 32; SAN FRANCISCO, CA; Owner: MINORITY TELEVISION PROJECT)
KBHK-TV (Channel 44; SAN FRANCISCO, CA; Owner: VIACOM TELEVISION STATIONS GROUP OF SAN FRANCISCO INC.)
KBWB (Channel 20; SAN FRANCISCO, CA; Owner: KBWB LICENSE, INC.)
KFSF (Channel 66; VALLEJO, CA; Owner: TELEFUTURA SAN FRANCISCO LLC)
KCNS (Channel 38; SAN FRANCISCO, CA; Owner: WRAY, INC.)
KCSM-TV (Channel 60; SAN MATEO, CA; Owner: SAN MATEO COUNTY COMMUNITY COLLEGE DISTRICT)
KSPX (Channel 29; SACRAMENTO, CA; Owner: PAXSON SACRAMENTO LICENSE, INC.)
KOVR (Channel 13; STOCKTON, CA; Owner: SCI - SACRAMENTO LICENSEE, LLC)
KXTV (Channel 10; SACRAMENTO, CA; Owner: KXTV, INC.)
KTXL (Channel 40; SACRAMENTO, CA; Owner: CHANNEL 40, INC.)
KUVS (Channel 19; MODESTO, CA; Owner: KUVS LICENSE PARTNERSHIP, G.P.)
KQCA (Channel 58; STOCKTON, CA; Owner: KCRA HEARST-ARGYLE TELEVISION, INC.)
KTNC-TV (Channel 42; CONCORD, CA; Owner: KTNC LICENSE, LLC)
National Bridge Inventory (NBI) Statistics 7 Number of bridges59ft / 18.4m Total length $1,954,000 Total costs62,400 Total average daily traffic2,518 Total average daily truck traffic63,763 Total future (year 2036) average daily traffic
FCC Registered Broadcast Land Mobile Towers: 8 (
See the full list of FCC Registered Broadcast Land Mobile Towers in San Anselmo, CA )
FCC Registered Microwave Towers: 1
Forbes, Forbes Hill Hepburn Heights Rd (Lat: 37.979111 Lon: -122.546833), Type: Pole, Structure height: 6.5 m, Call Sign: WBM349, Assigned Frequencies: 11698.1 MHz, 11683.1 MHz, Grant Date: 10/09/2020, Expiration Date: 10/11/2030, Registrant: County Of Marin, 3501 Civic Center Drive, Suite 304, San Rafael, CA 94903, Phone: (415) 464-7042, Fax: (415) 292-9981, Email:
FCC Registered Amateur Radio Licenses: 118 (
See the full list of FCC Registered Amateur Radio Licenses in San Anselmo )
FAA Registered Aircraft Manufacturers and Dealers: 1 (
See the full list of FAA Registered Manufacturers and Dealers in San Anselmo )
FAA Registered Aircraft: 13 (
See the full list of FAA Registered Aircraft )
Home Mortgage Disclosure Act Aggregated Statistics For Year 2009(Based on 2 full and 1 partial tracts) A) FHA, FSA/RHS & VA B) Conventional C) Refinancings D) Home Improvement Loans F) Non-occupant Loans on Number Average Value Number Average Value Number Average Value Number Average Value Number Average Value
LOANS ORIGINATED 13 $593,112 86 $656,687 510 $498,664 20 $445,960 25 $403,540 APPLICATIONS APPROVED, NOT ACCEPTED 1 $889,230 14 $710,794 54 $516,668 1 $650,580 5 $380,444 APPLICATIONS DENIED 1 $295,000 9 $1,717,870 126 $569,654 3 $283,163 15 $505,366 APPLICATIONS WITHDRAWN 2 $598,100 13 $622,415 68 $662,992 6 $308,500 6 $1,036,475 FILES CLOSED FOR INCOMPLETENESS 0 $0 2 $461,860 26 $542,549 0 $0 0 $0
Aggregated Statistics For Year 2008(Based on 2 full and 1 partial tracts) A) FHA, FSA/RHS & VA B) Conventional C) Refinancings D) Home Improvement Loans E) Loans on Dwellings For 5+ Families F) Non-occupant Loans on Number Average Value Number Average Value Number Average Value Number Average Value Number Average Value Number Average Value
LOANS ORIGINATED 4 $563,192 74 $754,001 171 $600,489 15 $302,783 2 $720,000 14 $384,234 APPLICATIONS APPROVED, NOT ACCEPTED 0 $0 28 $798,642 33 $532,209 2 $149,745 1 $510,000 2 $288,460 APPLICATIONS DENIED 1 $521,000 18 $739,667 61 $765,618 7 $608,340 2 $1,562,000 6 $619,350 APPLICATIONS WITHDRAWN 0 $0 18 $679,576 30 $521,004 4 $186,715 0 $0 2 $352,500 FILES CLOSED FOR INCOMPLETENESS 0 $0 3 $778,333 12 $686,868 2 $267,350 0 $0 0 $0
Aggregated Statistics For Year 2007(Based on 2 full and 1 partial tracts) B) Conventional C) Refinancings D) Home Improvement Loans E) Loans on Dwellings For 5+ Families F) Non-occupant Loans on Number Average Value Number Average Value Number Average Value Number Average Value Number Average Value
LOANS ORIGINATED 137 $813,869 257 $688,688 31 $543,776 7 $801,334 32 $528,623 APPLICATIONS APPROVED, NOT ACCEPTED 38 $981,135 45 $637,409 7 $439,699 0 $0 6 $651,145 APPLICATIONS DENIED 24 $729,992 87 $771,332 10 $396,354 1 $1,426,940 11 $413,855 APPLICATIONS WITHDRAWN 9 $980,258 40 $628,598 2 $302,795 0 $0 5 $359,086 FILES CLOSED FOR INCOMPLETENESS 3 $660,140 17 $425,119 2 $670,310 0 $0 0 $0
Aggregated Statistics For Year 2006(Based on 2 full and 1 partial tracts) B) Conventional C) Refinancings D) Home Improvement Loans E) Loans on Dwellings For 5+ Families F) Non-occupant Loans on Number Average Value Number Average Value Number Average Value Number Average Value Number Average Value
LOANS ORIGINATED 159 $679,815 303 $650,277 34 $528,476 5 $1,356,000 38 $705,991 APPLICATIONS APPROVED, NOT ACCEPTED 36 $725,729 47 $692,700 4 $456,250 0 $0 8 $732,250 APPLICATIONS DENIED 38 $856,698 67 $786,037 4 $426,615 0 $0 9 $637,743 APPLICATIONS WITHDRAWN 18 $1,143,819 54 $601,985 3 $234,917 0 $0 4 $1,668,302 FILES CLOSED FOR INCOMPLETENESS 4 $844,992 14 $520,940 2 $350,000 0 $0 1 $676,970
Aggregated Statistics For Year 2005(Based on 2 full and 1 partial tracts) B) Conventional C) Refinancings D) Home Improvement Loans E) Loans on Dwellings For 5+ Families F) Non-occupant Loans on Number Average Value Number Average Value Number Average Value Number Average Value Number Average Value
LOANS ORIGINATED 175 $670,420 402 $584,904 36 $501,853 5 $959,000 45 $522,366 APPLICATIONS APPROVED, NOT ACCEPTED 22 $836,911 50 $510,434 3 $417,670 0 $0 7 $567,429 APPLICATIONS DENIED 34 $577,238 66 $601,785 8 $141,952 1 $700,000 9 $527,140 APPLICATIONS WITHDRAWN 24 $669,401 65 $539,432 10 $327,206 1 $700,000 7 $553,296 FILES CLOSED FOR INCOMPLETENESS 6 $628,660 9 $546,203 2 $558,630 0 $0 0 $0
Aggregated Statistics For Year 2004(Based on 2 full and 1 partial tracts) B) Conventional C) Refinancings D) Home Improvement Loans E) Loans on Dwellings For 5+ Families F) Non-occupant Loans on Number Average Value Number Average Value Number Average Value Number Average Value Number Average Value
LOANS ORIGINATED 180 $565,868 487 $499,562 29 $394,337 4 $627,250 45 $367,011 APPLICATIONS APPROVED, NOT ACCEPTED 30 $421,575 59 $457,707 5 $216,332 0 $0 6 $436,983 APPLICATIONS DENIED 22 $505,159 88 $605,759 12 $179,208 1 $650,000 11 $317,897 APPLICATIONS WITHDRAWN 14 $566,284 68 $529,805 8 $364,085 1 $845,000 7 $603,797 FILES CLOSED FOR INCOMPLETENESS 3 $547,743 20 $426,284 1 $414,000 0 $0 1 $227,760
Aggregated Statistics For Year 2003(Based on 2 full and 1 partial tracts) B) Conventional C) Refinancings D) Home Improvement Loans E) Loans on Dwellings For 5+ Families F) Non-occupant Loans on Number Average Value Number Average Value Number Average Value Number Average Value Number Average Value
LOANS ORIGINATED 204 $496,034 1,222 $393,156 10 $124,436 8 $1,108,125 69 $318,555 APPLICATIONS APPROVED, NOT ACCEPTED 16 $481,407 146 $426,783 3 $129,723 0 $0 7 $225,551 APPLICATIONS DENIED 23 $480,863 165 $444,038 4 $51,110 0 $0 15 $321,255 APPLICATIONS WITHDRAWN 25 $433,046 121 $404,443 1 $180,000 0 $0 7 $359,897 FILES CLOSED FOR INCOMPLETENESS 3 $629,557 21 $406,938 0 $0 0 $0 2 $265,760
Aggregated Statistics For Year 2002(Based on 2 full and 1 partial tracts) A) FHA, FSA/RHS & VA B) Conventional C) Refinancings D) Home Improvement Loans E) Loans on Dwellings For 5+ Families F) Non-occupant Loans on Number Average Value Number Average Value Number Average Value Number Average Value Number Average Value Number Average Value
LOANS ORIGINATED 2 $73,405 152 $483,828 928 $396,361 13 $156,962 5 $589,220 46 $299,638 APPLICATIONS APPROVED, NOT ACCEPTED 1 $57,410 27 $461,699 148 $366,654 3 $234,540 1 $1,200,000 13 $281,402 APPLICATIONS DENIED 1 $188,000 15 $314,245 77 $377,648 5 $53,582 2 $250,000 3 $332,050 APPLICATIONS WITHDRAWN 0 $0 18 $491,727 82 $428,133 1 $33,850 1 $634,000 2 $479,165 FILES CLOSED FOR INCOMPLETENESS 0 $0 5 $456,390 36 $407,121 0 $0 0 $0 3 $253,850
Aggregated Statistics For Year 2001(Based on 2 full and 1 partial tracts) B) Conventional C) Refinancings D) Home Improvement Loans E) Loans on Dwellings For 5+ Families F) Non-occupant Loans on Number Average Value Number Average Value Number Average Value Number Average Value Number Average Value
LOANS ORIGINATED 148 $429,367 567 $404,542 56 $71,736 5 $729,400 37 $322,138 APPLICATIONS APPROVED, NOT ACCEPTED 23 $429,813 90 $391,817 8 $95,864 0 $0 3 $284,403 APPLICATIONS DENIED 18 $402,303 86 $449,794 10 $76,619 0 $0 6 $338,107 APPLICATIONS WITHDRAWN 11 $368,477 79 $384,280 9 $103,759 1 $700,000 1 $338,430 FILES CLOSED FOR INCOMPLETENESS 3 $429,037 25 $379,092 1 $41,430 0 $0 3 $287,680
Aggregated Statistics For Year 2000(Based on 2 full and 1 partial tracts) B) Conventional C) Refinancings D) Home Improvement Loans E) Loans on Dwellings For 5+ Families F) Non-occupant Loans on Number Average Value Number Average Value Number Average Value Number Average Value Number Average Value
LOANS ORIGINATED 145 $438,679 156 $320,151 41 $82,320 2 $455,000 20 $316,564 APPLICATIONS APPROVED, NOT ACCEPTED 16 $403,249 25 $490,837 6 $82,088 0 $0 1 $474,580 APPLICATIONS DENIED 19 $347,776 46 $497,519 12 $84,468 1 $825,000 3 $277,597 APPLICATIONS WITHDRAWN 14 $437,622 32 $206,508 6 $50,755 0 $0 2 $471,070 FILES CLOSED FOR INCOMPLETENESS 2 $434,795 7 $384,156 1 $104,060 1 $825,000 1 $117,800
Aggregated Statistics For Year 1999(Based on 1 full and 2 partial tracts) B) Conventional C) Refinancings D) Home Improvement Loans E) Loans on Dwellings For 5+ Families F) Non-occupant Loans on Number Average Value Number Average Value Number Average Value Number Average Value Number Average Value
LOANS ORIGINATED 181 $343,816 319 $303,309 34 $45,147 3 $1,105,447 22 $188,478 APPLICATIONS APPROVED, NOT ACCEPTED 20 $364,711 36 $318,650 3 $123,587 0 $0 2 $298,930 APPLICATIONS DENIED 25 $337,706 56 $353,592 13 $51,088 0 $0 5 $186,120 APPLICATIONS WITHDRAWN 28 $342,279 43 $266,077 4 $83,108 0 $0 0 $0 FILES CLOSED FOR INCOMPLETENESS 3 $180,397 11 $223,546 2 $144,315 0 $0 0 $0
Detailed HMDA statistics for the following Tracts:
1150.00
, 1160.00 , 1170.00
Private Mortgage Insurance Companies Aggregated Statistics For Year 2009(Based on 1 full and 1 partial tracts) A) Conventional B) Refinancings Number Average Value Number Average Value
LOANS ORIGINATED 2 $396,375 1 $769,150 APPLICATIONS APPROVED, NOT ACCEPTED 1 $548,000 0 $0 APPLICATIONS DENIED 0 $0 0 $0 APPLICATIONS WITHDRAWN 0 $0 0 $0 FILES CLOSED FOR INCOMPLETENESS 1 $385,620 0 $0
Aggregated Statistics For Year 2008(Based on 1 partial tract) A) Conventional Number Average Value
LOANS ORIGINATED 1 $334,170 APPLICATIONS APPROVED, NOT ACCEPTED 0 $0 APPLICATIONS DENIED 0 $0 APPLICATIONS WITHDRAWN 0 $0 FILES CLOSED FOR INCOMPLETENESS 0 $0
Aggregated Statistics For Year 2007(Based on 1 full and 1 partial tracts) A) Conventional B) Refinancings Number Average Value Number Average Value
LOANS ORIGINATED 2 $330,690 1 $846,000 APPLICATIONS APPROVED, NOT ACCEPTED 1 $450,000 2 $748,000 APPLICATIONS DENIED 0 $0 0 $0 APPLICATIONS WITHDRAWN 0 $0 0 $0 FILES CLOSED FOR INCOMPLETENESS 0 $0 0 $0
Aggregated Statistics For Year 2006(Based on 1 full tract) B) Refinancings Number Average Value
LOANS ORIGINATED 0 $0 APPLICATIONS APPROVED, NOT ACCEPTED 0 $0 APPLICATIONS DENIED 0 $0 APPLICATIONS WITHDRAWN 1 $846,000 FILES CLOSED FOR INCOMPLETENESS 0 $0
Aggregated Statistics For Year 2005(Based on 2 full tracts) A) Conventional B) Refinancings Number Average Value Number Average Value
LOANS ORIGINATED 1 $392,000 1 $360,000 APPLICATIONS APPROVED, NOT ACCEPTED 0 $0 0 $0 APPLICATIONS DENIED 0 $0 0 $0 APPLICATIONS WITHDRAWN 0 $0 0 $0 FILES CLOSED FOR INCOMPLETENESS 0 $0 0 $0
Aggregated Statistics For Year 2004(Based on 1 full tract) B) Refinancings Number Average Value
LOANS ORIGINATED 1 $577,000 APPLICATIONS APPROVED, NOT ACCEPTED 0 $0 APPLICATIONS DENIED 0 $0 APPLICATIONS WITHDRAWN 0 $0 FILES CLOSED FOR INCOMPLETENESS 0 $0
Aggregated Statistics For Year 2003(Based on 2 full tracts) A) Conventional B) Refinancings C) Non-occupant Loans on Number Average Value Number Average Value Number Average Value
LOANS ORIGINATED 1 $428,000 1 $399,000 1 $428,000 APPLICATIONS APPROVED, NOT ACCEPTED 0 $0 0 $0 0 $0 APPLICATIONS DENIED 0 $0 1 $368,000 1 $368,000 APPLICATIONS WITHDRAWN 1 $584,000 0 $0 0 $0 FILES CLOSED FOR INCOMPLETENESS 0 $0 0 $0 0 $0
Aggregated Statistics For Year 2002(Based on 2 full and 1 partial tracts) A) Conventional B) Refinancings Number Average Value Number Average Value
LOANS ORIGINATED 2 $360,125 1 $558,000 APPLICATIONS APPROVED, NOT ACCEPTED 0 $0 0 $0 APPLICATIONS DENIED 0 $0 0 $0 APPLICATIONS WITHDRAWN 0 $0 0 $0 FILES CLOSED FOR INCOMPLETENESS 0 $0 0 $0
Aggregated Statistics For Year 2001(Based on 2 full and 1 partial tracts) A) Conventional B) Refinancings C) Non-occupant Loans on Number Average Value Number Average Value Number Average Value
LOANS ORIGINATED 4 $325,888 1 $443,910 1 $352,000 APPLICATIONS APPROVED, NOT ACCEPTED 0 $0 0 $0 0 $0 APPLICATIONS DENIED 2 $291,000 0 $0 0 $0 APPLICATIONS WITHDRAWN 0 $0 0 $0 0 $0 FILES CLOSED FOR INCOMPLETENESS 0 $0 0 $0 0 $0
Aggregated Statistics For Year 2000(Based on 2 full and 1 partial tracts) A) Conventional B) Refinancings C) Non-occupant Loans on Number Average Value Number Average Value Number Average Value
LOANS ORIGINATED 8 $356,236 1 $169,790 1 $348,000 APPLICATIONS APPROVED, NOT ACCEPTED 2 $385,000 0 $0 0 $0 APPLICATIONS DENIED 1 $347,030 0 $0 0 $0 APPLICATIONS WITHDRAWN 0 $0 0 $0 0 $0 FILES CLOSED FOR INCOMPLETENESS 0 $0 0 $0 0 $0
Aggregated Statistics For Year 1999(Based on 1 full and 2 partial tracts) A) Conventional B) Refinancings Number Average Value Number Average Value
LOANS ORIGINATED 10 $289,674 1 $259,940 APPLICATIONS APPROVED, NOT ACCEPTED 1 $292,570 0 $0 APPLICATIONS DENIED 0 $0 0 $0 APPLICATIONS WITHDRAWN 0 $0 0 $0 FILES CLOSED FOR INCOMPLETENESS 0 $0 0 $0
Detailed PMIC statistics for the following Tracts:
1150.00
, 1160.00 , 1170.00
Most common first names in San Anselmo, CA among deceased individuals Name Count Lived (average)
John 101 76.2 years Mary 94 80.8 years William 92 77.9 years James 61 70.0 years Robert 60 73.3 years Dorothy 57 79.2 years Charles 57 76.3 years George 56 78.1 years Joseph 46 78.3 years Frank 45 78.4 years
Most common last names in San Anselmo, CA among deceased individuals Last name Count Lived (average)
Smith 39 79.0 years Johnson 24 80.0 years Brown 18 80.1 years Anderson 17 78.0 years Jones 15 82.3 years Williams 14 81.2 years Thompson 13 85.8 years Scott 13 76.1 years Taylor 11 82.7 years White 11 79.4 years
San Anselmo compared to California state average:
Median household income above state average. Median house value significantly above state average. Unemployed percentage significantly below state average. Black race population percentage significantly below state average. Hispanic race population percentage significantly below state average. Median age significantly above state average. Foreign-born population percentage significantly below state average. Length of stay since moving in significantly above state average. House age above state average. Percentage of population with a bachelor's degree or higher significantly above state average. San Anselmo on our top lists :
#21 on the list of "Top 101 cities with the most people taking a ferryboat to work (population 5,000+)"
#45 on the list of "Top 101 cities with the highest percentage of workers working at home, population 5,000+"
#87 on the list of "Top 101 cities with the largest city-data.com crime index decrease from 2011 to 2012 (population 5,000+)"
#38 (94960) on the list of "Top 101 zip codes with the largest percentage of taxpayers reporting profit/loss from business in 2012 (pop 5,000+)"
#13 on the list of "Top 101 counties with the largest number of people without health insurance coverage in 2000 (pop. 50,000+)"
#17 on the list of "Top 101 counties with the highest carbon monoxide air pollution readings in 2012 (ppm)"
#17 on the list of "Top 101 counties with the lowest Ozone (1-hour) air pollution readings in 2012 (ppm)"
#30 on the list of "Top 101 counties with highest percentage of residents voting for Obama (Democrat) in the 2012 Presidential Election (pop. 50,000+)"
#43 on the list of "Top 101 counties with the lowest number of births per 1000 residents 2007-2013"
Top Patent Applicants
Lawrence J. Gerrans (36)
David De Andrade (19)
Dale T. Roberts (12)
Tim Lynch (12)
Jeffry Kimo Curtis (10)
Kevin Weller (10)
Theodore M. Bender (10)
John Anderson (9)
Graham Hawkes (8)
Evan Thrush (8)
Total of 443 patent applications in 2008-2024.
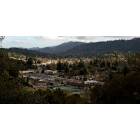
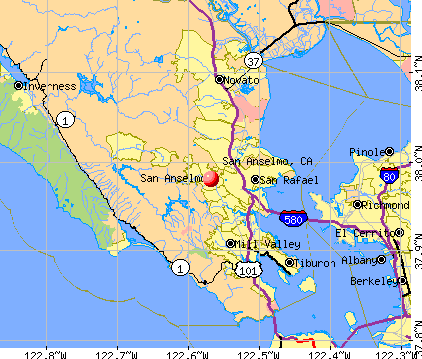


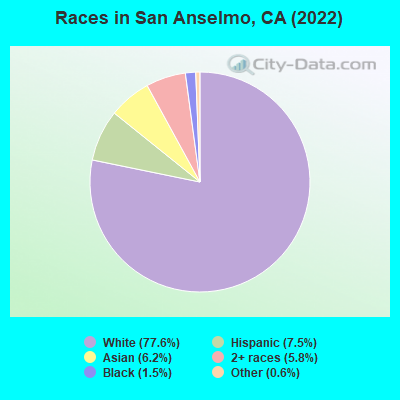
 Recent articles from our blog. Our writers, many of them Ph.D. graduates or candidates, create easy-to-read articles on a wide variety of topics.

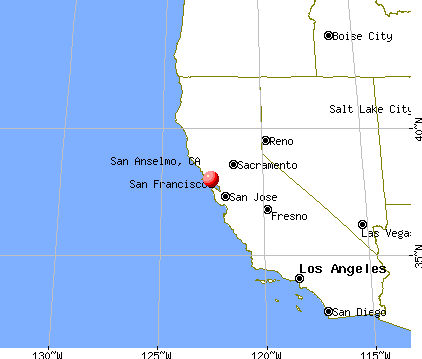
 , pop. 59,662).
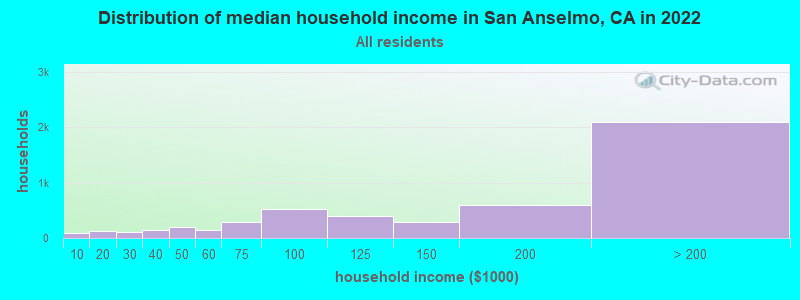
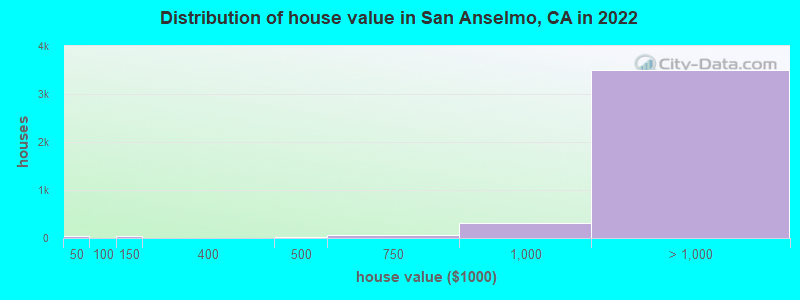
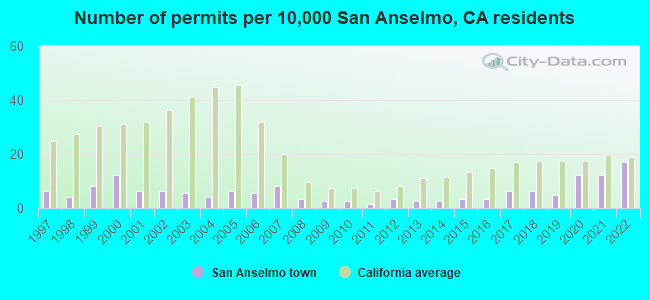
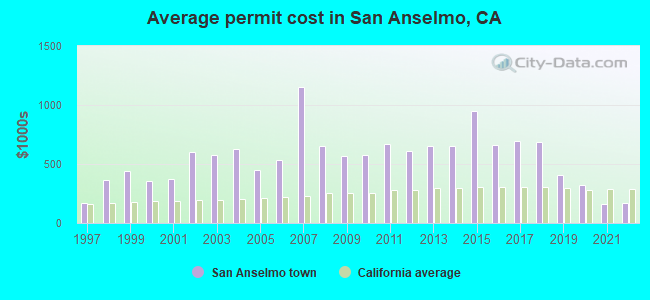
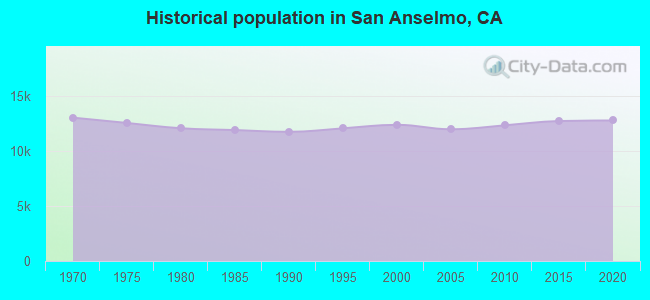
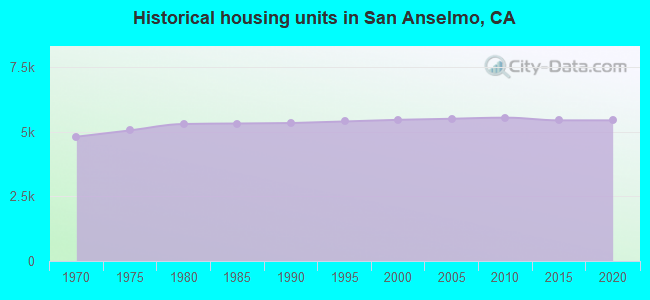
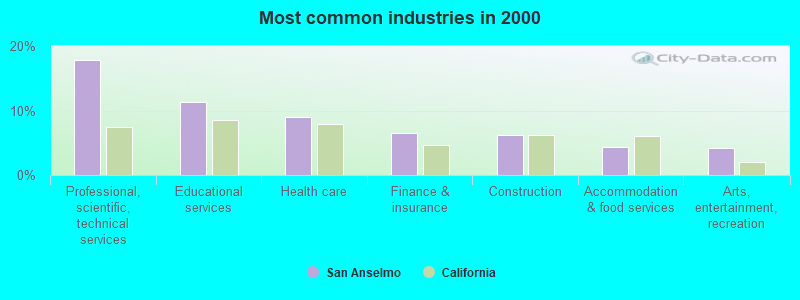
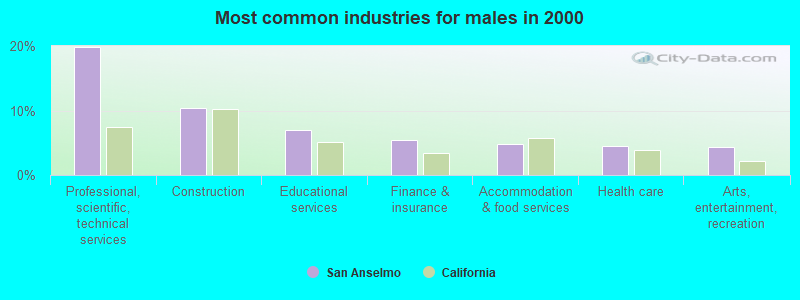
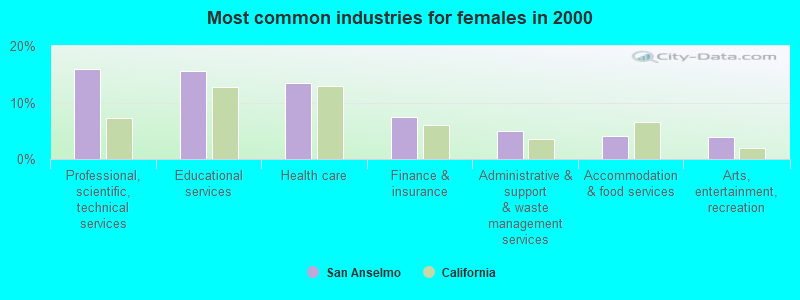
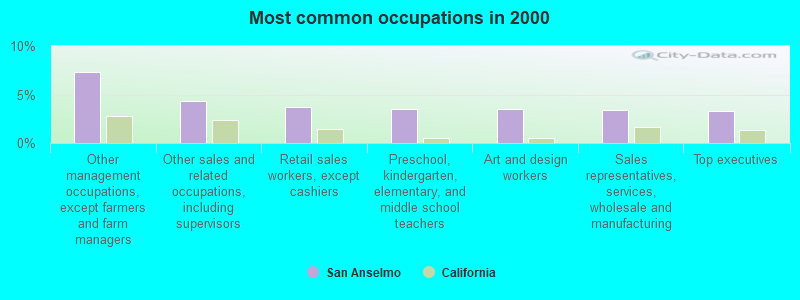
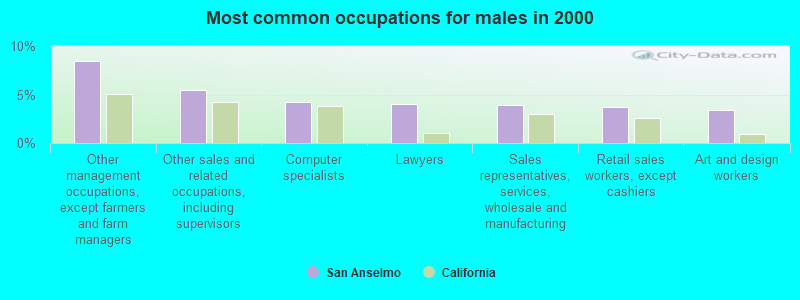
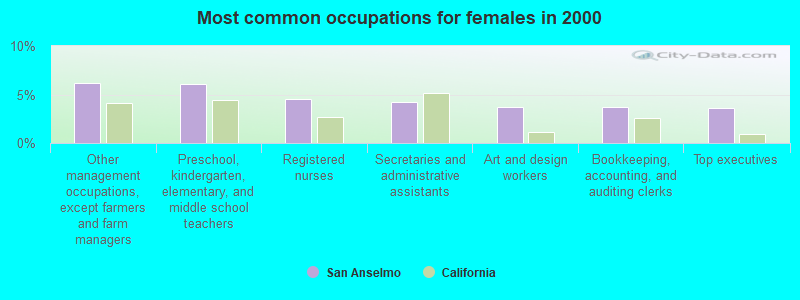
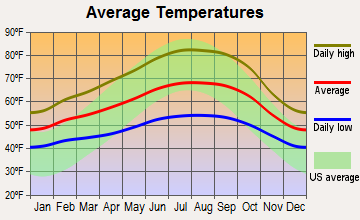
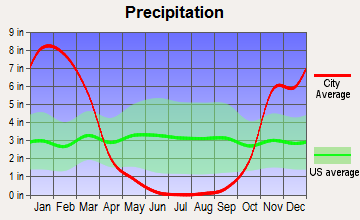
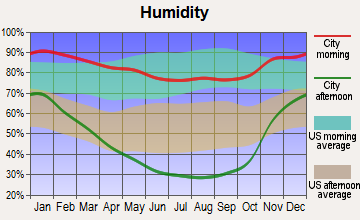
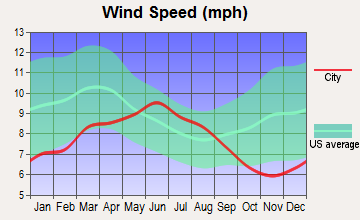
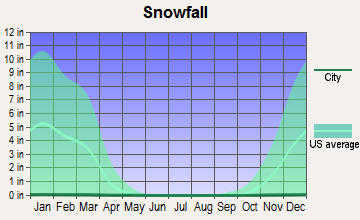
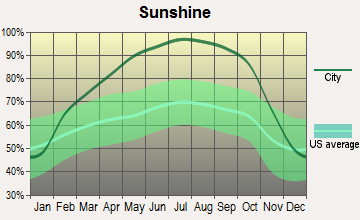
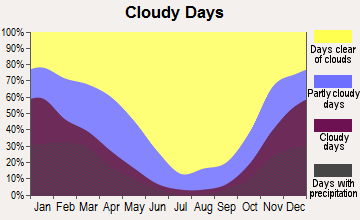


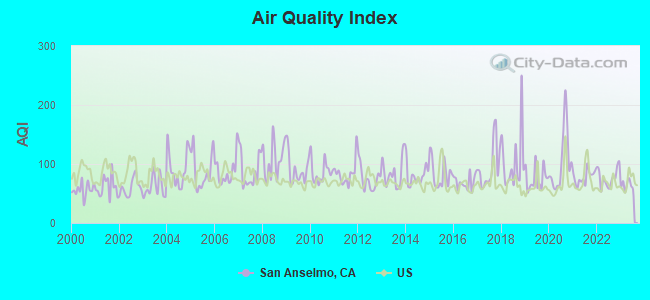
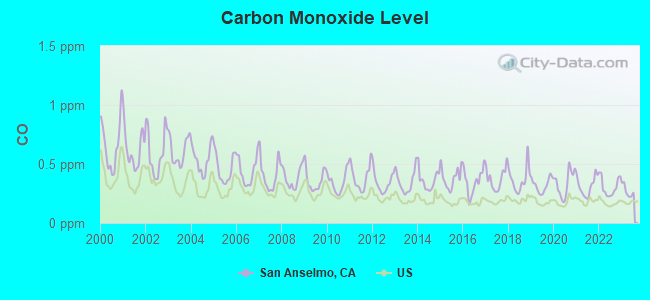
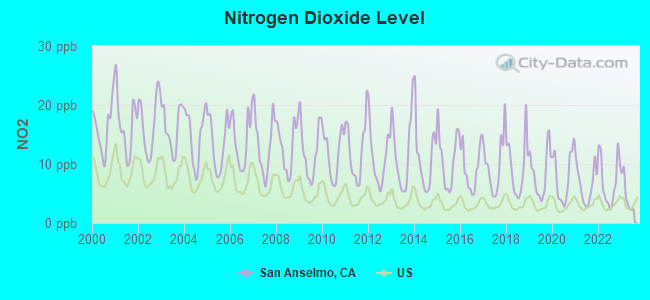
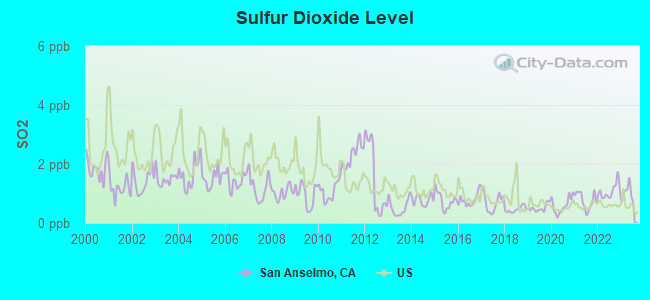
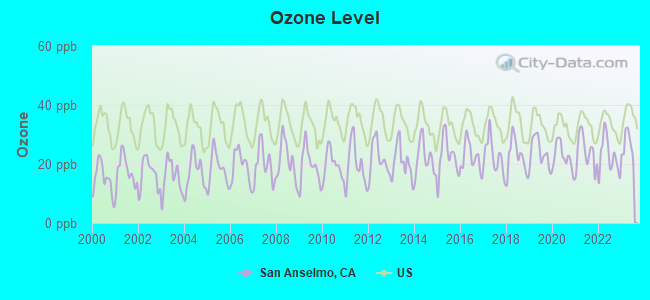
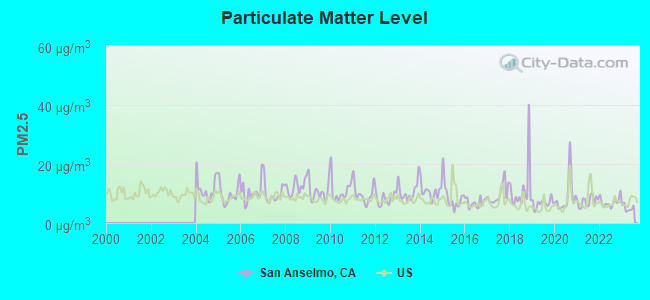
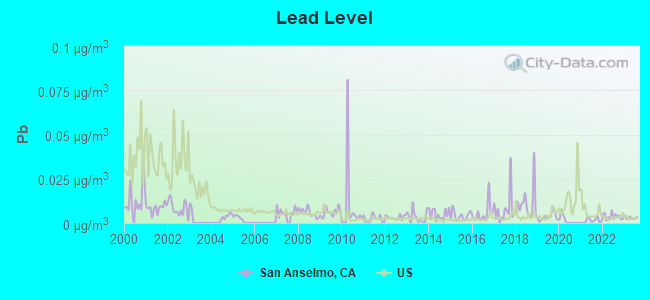
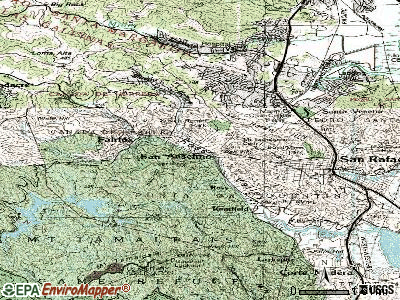
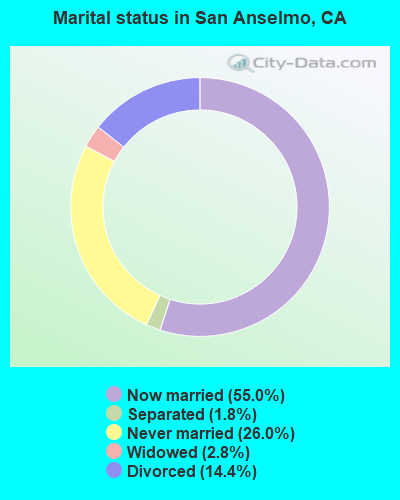
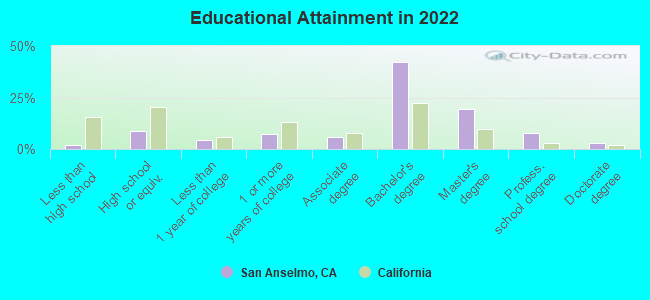
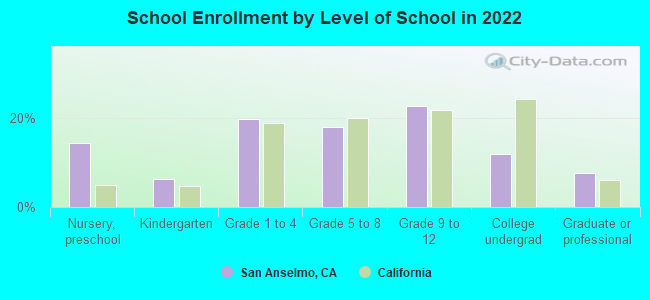
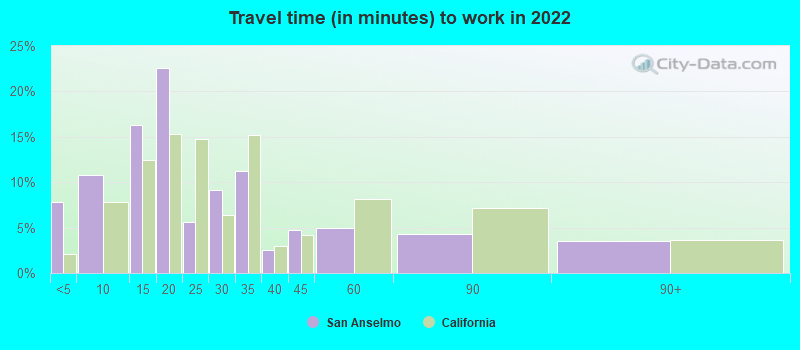
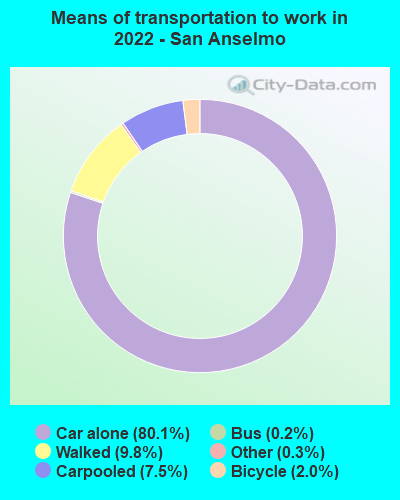
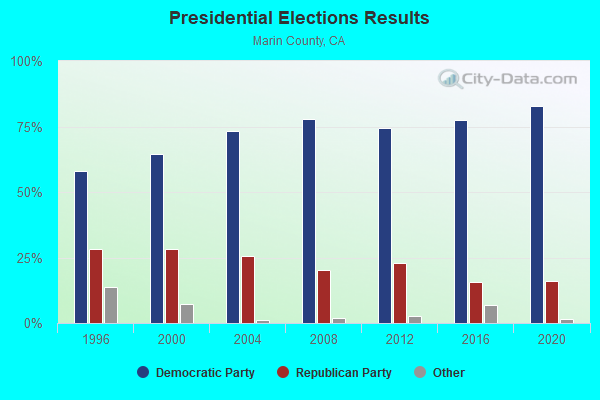
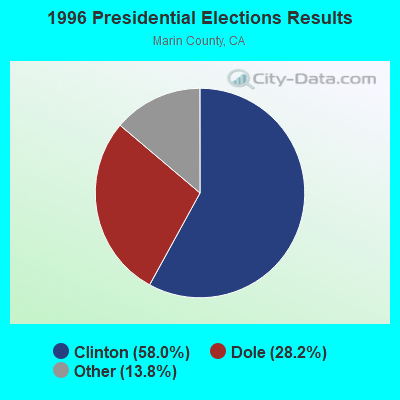
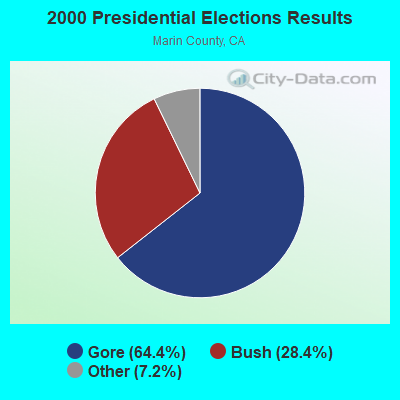
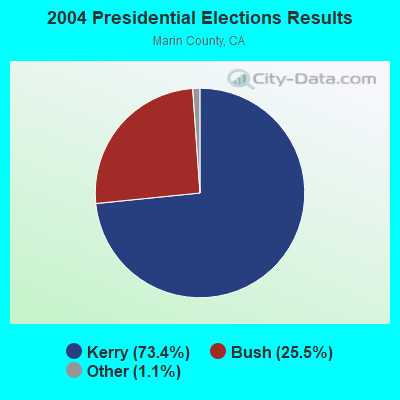
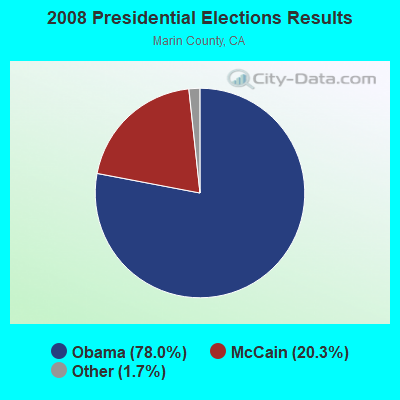
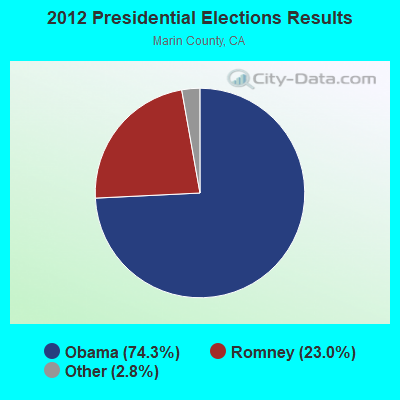
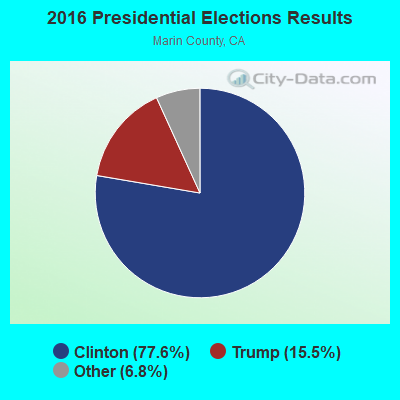
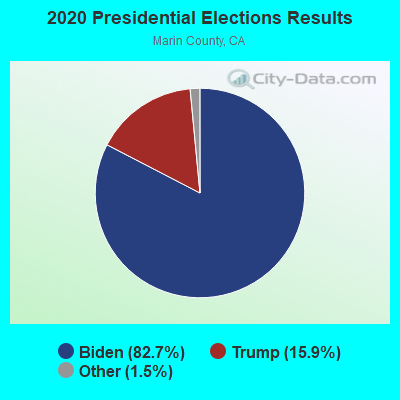
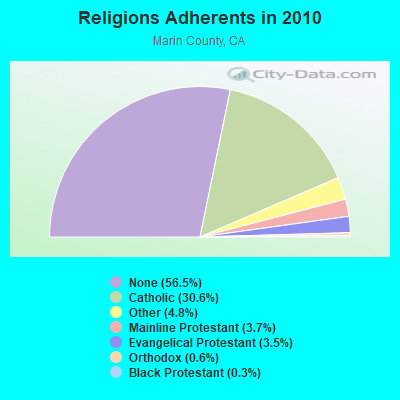
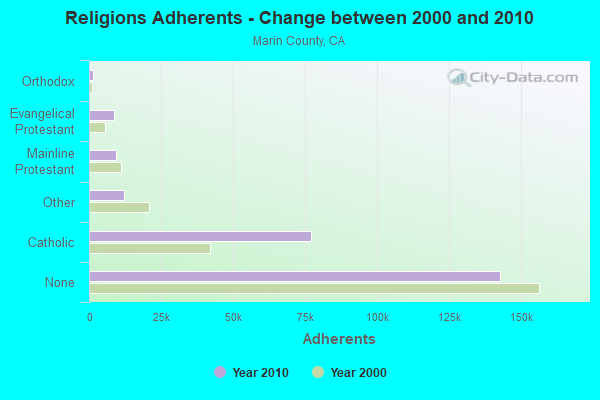
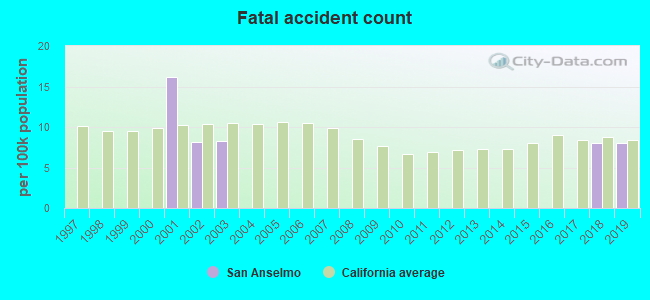
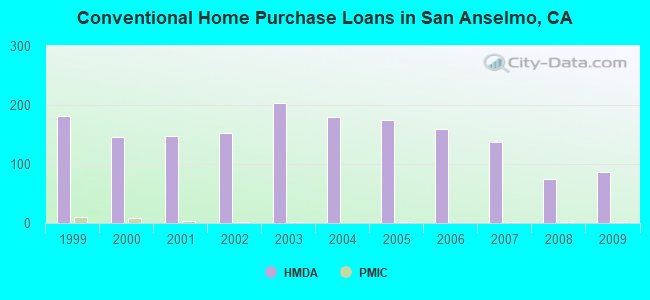
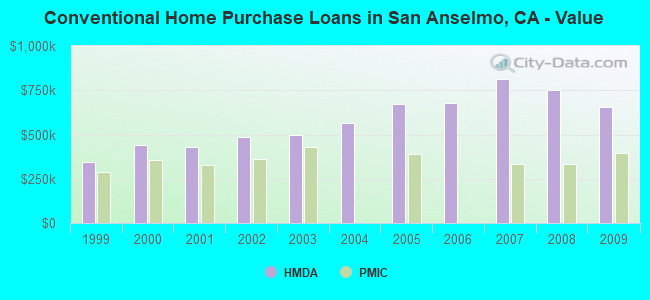
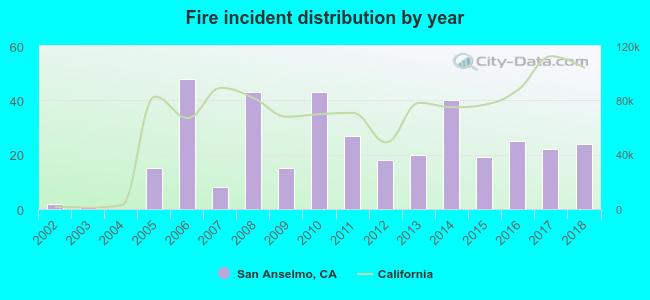 According to the data from the years 2002 - 2018 the average number of fires per year is 22. The highest number of fires - 48 took place in 2006, and the least - 0 in 2004. The data has an increasing trend.
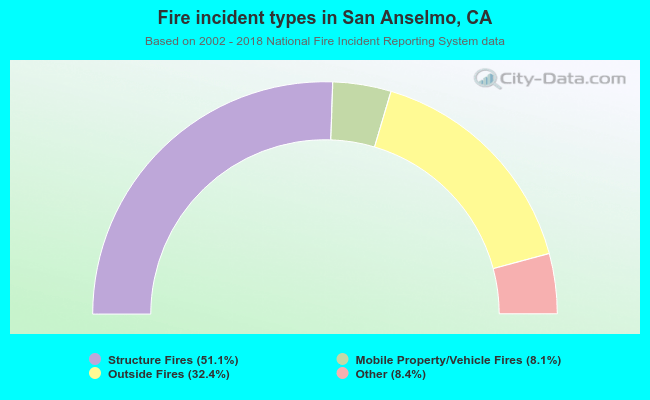 When looking into fire subcategories, the most incidents belonged to: Structure Fires (51.1%), and Outside Fires (32.4%).