Oakland, California
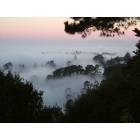
Oakland: Fog from the Oakland Hills

Oakland: Photo of Bay Bridge from Treasure Island
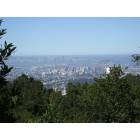
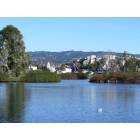
Oakland: Looking Across the bay from the Oakland Hills
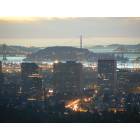
Oakland: The City of Oakland at Sunset
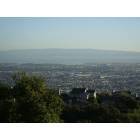
Oakland: Looking Across the Bay from the Oakland Hills
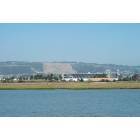
Oakland: View of the Colesium and Oakland hills from Doolittle Drive
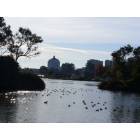
Oakland: Lake Merritt
Oakland: Lake Merritt
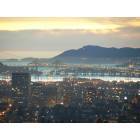
Oakland: Oakland at Sunset
Oakland: Oakland, Alameda, San Francisco, and the Golden Gateway
Oakland: Lake Merritt
- see
30
more - add
your
Submit your own pictures of this city and show them to the world
- OSM Map
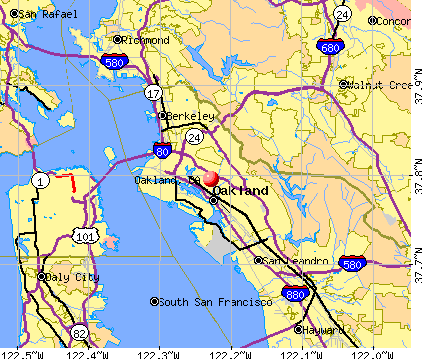
- General Map
- Google Map
- MSN Map
Population change since 2000: +7.8%
 |
| Males: 217,879 | |
| Females: 212,674 |
| Median resident age: | 38.7 years |
| California median age: | 37.9 years |
Zip codes: 94601, 94602, 94603, 94605, 94606, 94607, 94610, 94611, 94612, 94613, 94619, 94621.
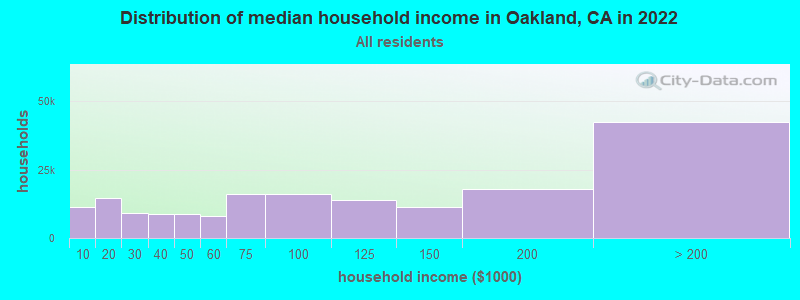
Oakland Zip Code Map| Oakland: | $93,146 |
| CA: | $91,551 |
Estimated per capita income in 2022: $62,020 (it was $21,936 in 2000)
Oakland city income, earnings, and wages data
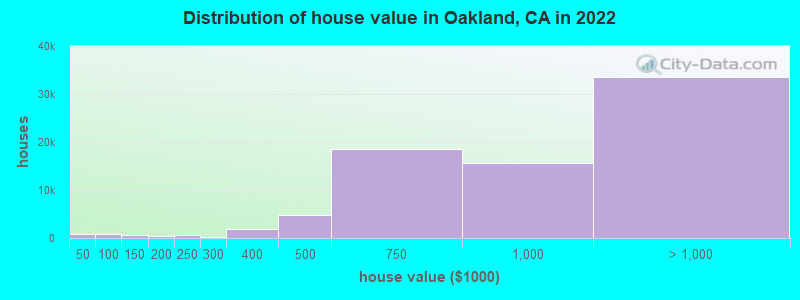
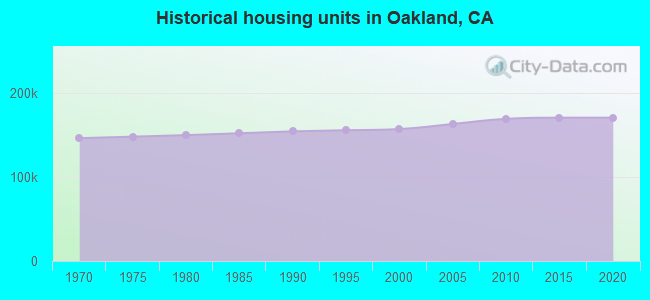
Estimated median house or condo value in 2022: $913,600 (it was $227,300 in 2000)
| Oakland: | $913,600 |
| CA: | $715,900 |
Mean prices in 2022: all housing units: over $1,000,000; detached houses: over $1,000,000; townhouses or other attached units: $974,059; in 2-unit structures: over $1,000,000; in 3-to-4-unit structures: $741,928; in 5-or-more-unit structures: $664,008; mobile homes: $348,312; occupied boats, rvs, vans, etc.: $836,678
Median gross rent in 2022: $1,838.
(6.8% for White Non-Hispanic residents, 24.8% for Black residents, 14.0% for Hispanic or Latino residents, 13.4% for American Indian residents, 18.0% for Native Hawaiian and other Pacific Islander residents, 15.8% for other race residents, 7.9% for two or more races residents)
Detailed information about poverty and poor residents in Oakland, CA


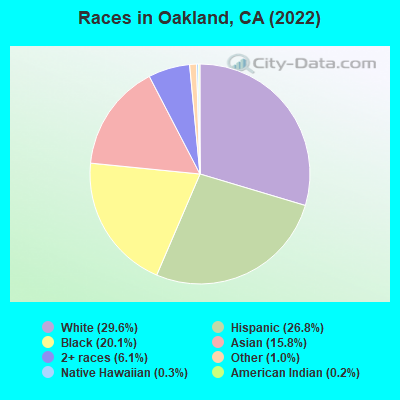
- 127,64329.6%White alone
- 115,51426.8%Hispanic
- 86,68220.1%Black alone
- 67,86215.8%Asian alone
- 26,2826.1%Two or more races
- 4,2941.0%Other race alone
- 1,2470.3%Native Hawaiian and Other
Pacific Islander alone - 1,0070.2%American Indian alone
According to our research of California and other state lists, there were 920 registered sex offenders living in Oakland, California as of April 27, 2024.
The ratio of all residents to sex offenders in Oakland is 457 to 1.
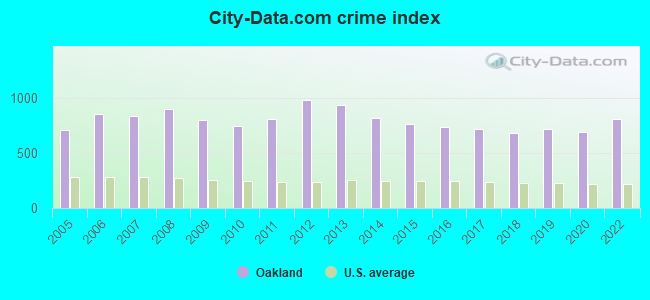
The City-Data.com crime index weighs serious crimes and violent crimes more heavily. Higher means more crime, U.S. average is 246.1. It adjusts for the number of visitors and daily workers commuting into cities.
- means the value is about the same as the state average.- means the value is bigger than the state average.
- means the value is much bigger than the state average.
Crime rate in Oakland detailed stats: murders, rapes, robberies, assaults, burglaries, thefts, arson
Full-time law enforcement employees in 2021, including police officers: 987 (682 officers - 579 male; 103 female).
| Officers per 1,000 residents here: | 1.59 |
| California average: | 2.30 |
 Recent articles from our blog. Our writers, many of them Ph.D. graduates or candidates, create easy-to-read articles on a wide variety of topics.

 | Kaiser Permanente Tells Employees to Not Go Outside for Lunch at Oakland Headquarters (65 replies) |
| Is it weird some life long Bay Areans never set foot in Oakland? (107 replies) |
| Commute from SF to Oakland? (41 replies) |
| Oakland seems like it has a lot of Potential (61 replies) |
| General rent costs in Oakland area (16 replies) |
| Sizzling housing: Deep East Oakland lures Bay Area homebuyers (60 replies) |
Latest news from Oakland, CA collected exclusively by city-data.com from local newspapers, TV, and radio stations
Ancestries: European (2.5%), Irish (1.9%), Ethiopian (1.7%), German (1.6%), American (1.6%), English (1.5%).
Current Local Time: PST time zone
Elevation: 42 feet
Land area: 56.1 square miles.
Population density: 7,681 people per square mile (high).
116,356 residents are foreign born (11.2% Latin America, 10.7% Asia).
| This city: | 27.1% |
| California: | 26.5% |
Median real estate property taxes paid for housing units with mortgages in 2022: $9,498 (1.0%)
Median real estate property taxes paid for housing units with no mortgage in 2022: $5,332 (0.7%)
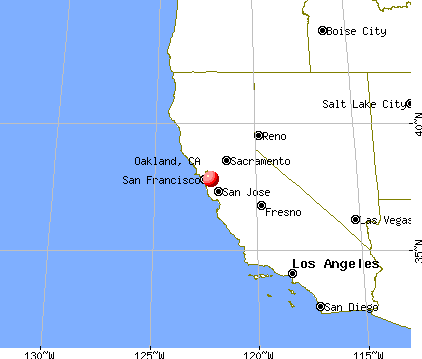
Nearest city with pop. 1,000,000+: Los Angeles, CA  (335.1 miles , pop. 3,694,820).
Nearest cities:
), Latitude: 37.80 N, Longitude: 122.23 W
Daytime population change due to commuting: -12,259 (-2.8%)
Workers who live and work in this city: 125,869 (54.8%)
Area code commonly used in this area: 925

Detailed articles:
- Oakland: Introduction
- Oakland Basic Facts
- Oakland: Communications
- Oakland: Convention Facilities
- Oakland: Economy
- Oakland: Education and Research
- Oakland: Geography and Climate
- Oakland: Health Care
- Oakland: History
- Oakland: Municipal Government
- Oakland: Population Profile
- Oakland: Recreation
- Oakland: Transportation
Oakland tourist attractions:
- Camron-Stanford House
- California College of the Arts
- Chabot Space and Science Center
- East Bay Regional Park District
- Embarcadero Bay Bicycle Trail
- Fairyland
- Fortune Cookie Factory
- French Trail Connector
- Lakeside Park and Garden Center
- Lake Merritt
- Lafayette Square Park
- McAfee Coliseum
- Mazzariello Labyrinth: Sibley Volcanic Regional Preserve
- Jack London Stadium 9
- Jack London Square
- Jack London's Cabin
- Oakland Convention Center
- Oakland History Room
- Oakland Museum
- Preservation Park
- Old Oakland
- Open Studios
- The Potomac
- Tilden Nature Area
- Yoshi's
- USS Potomac
- Rotary Nature Center and Waterfowl Refuge
- Marriott Oakland City Center
- The Oakland-Alameda County Coliseum - Oakland, California - home to the NFL's Oakland Raiders and MLB's Oakland Athletics
- Oakland Museum of California, Oakland, CA
- Oakland Zoo - Oakland, California - medium-sized zoo with around 660 individual animals
- Oakland-Alameda County Coliseum in Oakland, California
- Oracle Arena, Oakland, California
Oakland, California accommodation & food services, waste management - Economy and Business Data
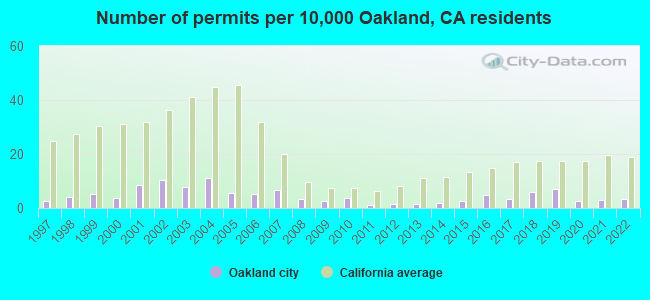
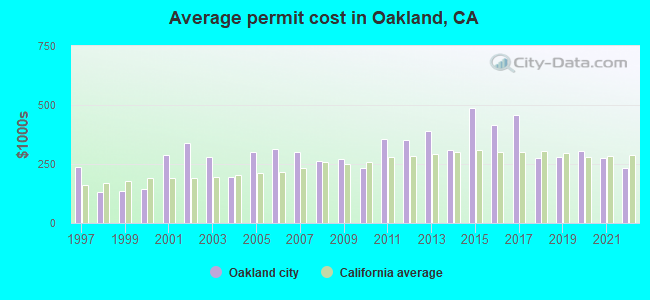
Single-family new house construction building permits:
- 2022: 126 buildings, average cost: $235,400
- 2021: 114 buildings, average cost: $277,300
- 2020: 98 buildings, average cost: $303,500
- 2019: 282 buildings, average cost: $280,300
- 2018: 230 buildings, average cost: $273,700
- 2017: 132 buildings, average cost: $457,500
- 2016: 190 buildings, average cost: $413,800
- 2015: 109 buildings, average cost: $487,100
- 2014: 81 buildings, average cost: $309,200
- 2013: 52 buildings, average cost: $387,600
- 2012: 54 buildings, average cost: $351,300
- 2011: 41 buildings, average cost: $357,400
- 2010: 144 buildings, average cost: $233,400
- 2009: 105 buildings, average cost: $271,700
- 2008: 127 buildings, average cost: $263,700
- 2007: 265 buildings, average cost: $300,500
- 2006: 213 buildings, average cost: $314,800
- 2005: 217 buildings, average cost: $301,800
- 2004: 440 buildings, average cost: $192,500
- 2003: 304 buildings, average cost: $280,500
- 2002: 420 buildings, average cost: $341,400
- 2001: 346 buildings, average cost: $289,600
- 2000: 148 buildings, average cost: $144,800
- 1999: 203 buildings, average cost: $135,500
- 1998: 158 buildings, average cost: $132,100
- 1997: 98 buildings, average cost: $238,500
| Here: | 5.1% |
| California: | 5.1% |
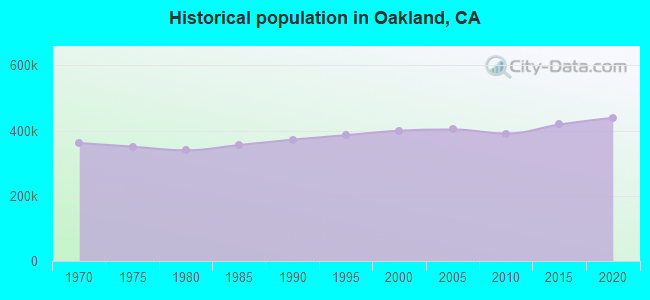
Population change in the 1990s: +925 (+0.2%).
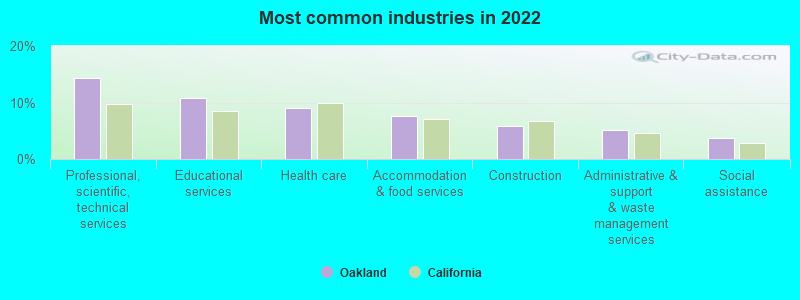
- Professional, scientific, technical services (14.3%)
- Educational services (10.7%)
- Health care (9.0%)
- Accommodation & food services (7.6%)
- Construction (5.8%)
- Administrative & support & waste management services (5.2%)
- Social assistance (3.7%)
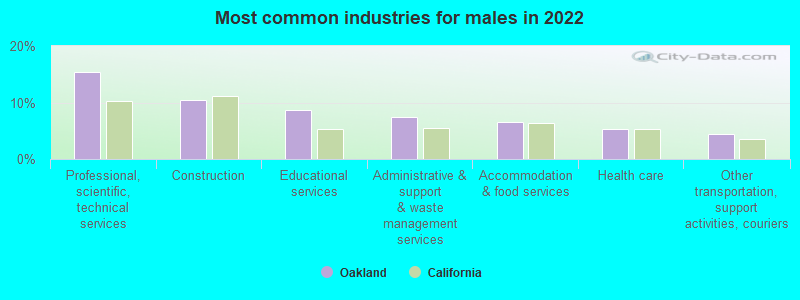
- Professional, scientific, technical services (15.3%)
- Construction (10.4%)
- Educational services (8.6%)
- Administrative & support & waste management services (7.4%)
- Accommodation & food services (6.5%)
- Health care (5.3%)
- Other transportation, support activities, couriers (4.5%)
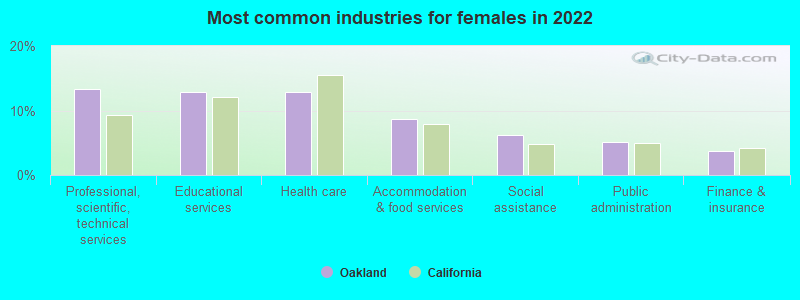
- Professional, scientific, technical services (13.3%)
- Educational services (12.9%)
- Health care (12.8%)
- Accommodation & food services (8.7%)
- Social assistance (6.3%)
- Public administration (5.0%)
- Finance & insurance (3.8%)
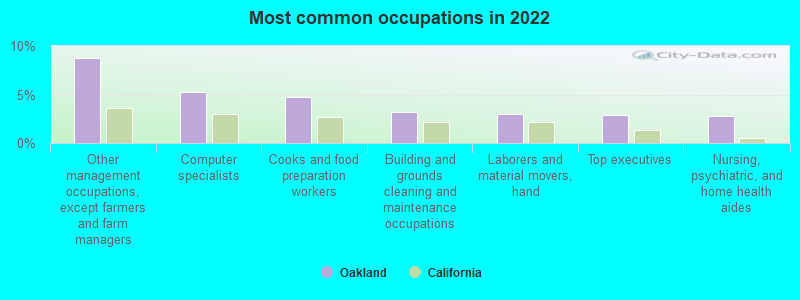
- Other management occupations, except farmers and farm managers (8.8%)
- Computer specialists (5.2%)
- Cooks and food preparation workers (4.7%)
- Building and grounds cleaning and maintenance occupations (3.2%)
- Laborers and material movers, hand (3.0%)
- Top executives (2.9%)
- Nursing, psychiatric, and home health aides (2.8%)
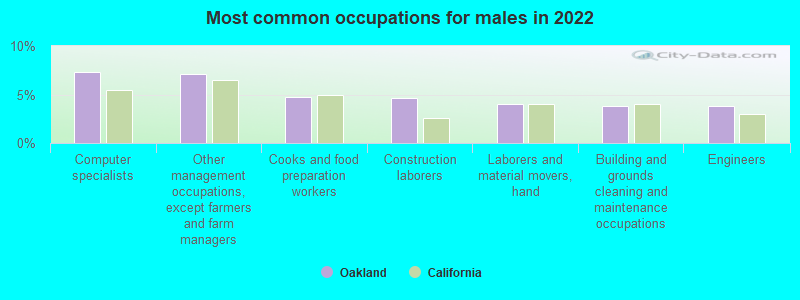
- Computer specialists (7.3%)
- Other management occupations, except farmers and farm managers (7.1%)
- Cooks and food preparation workers (4.7%)
- Construction laborers (4.6%)
- Laborers and material movers, hand (4.0%)
- Building and grounds cleaning and maintenance occupations (3.8%)
- Engineers (3.8%)
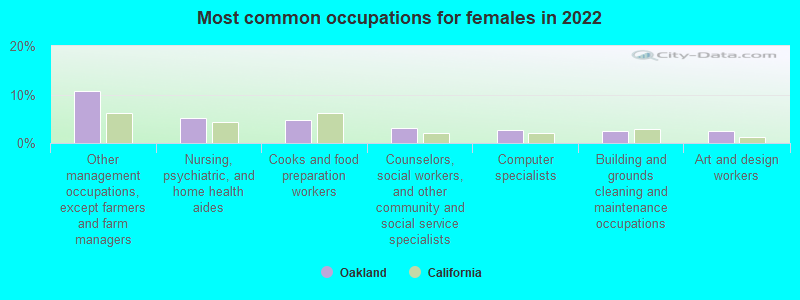
- Other management occupations, except farmers and farm managers (10.7%)
- Nursing, psychiatric, and home health aides (5.2%)
- Cooks and food preparation workers (4.7%)
- Counselors, social workers, and other community and social service specialists (3.2%)
- Computer specialists (2.8%)
- Building and grounds cleaning and maintenance occupations (2.5%)
- Art and design workers (2.5%)
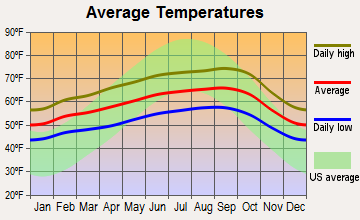
Average climate in Oakland, California
Based on data reported by over 4,000 weather stations


|
|


(lower is better)
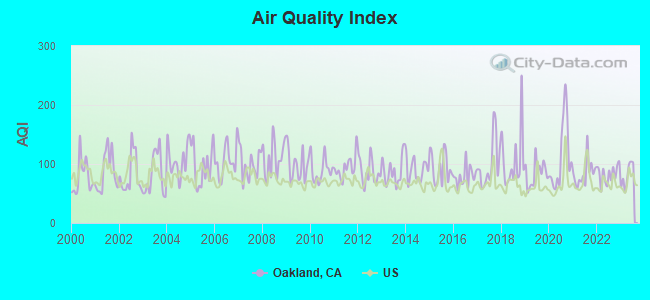
Air Quality Index (AQI) level in 2023 was 81.2. This is about average.
| City: | 81.2 |
| U.S.: | 72.6 |
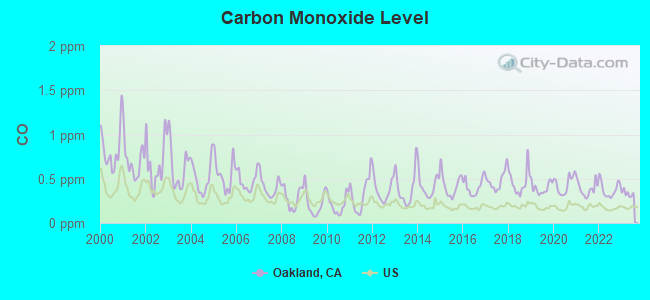
Carbon Monoxide (CO) [ppm] level in 2023 was 0.334. This is worse than average. Closest monitor was 1.9 miles away from the city center.
| City: | 0.334 |
| U.S.: | 0.251 |
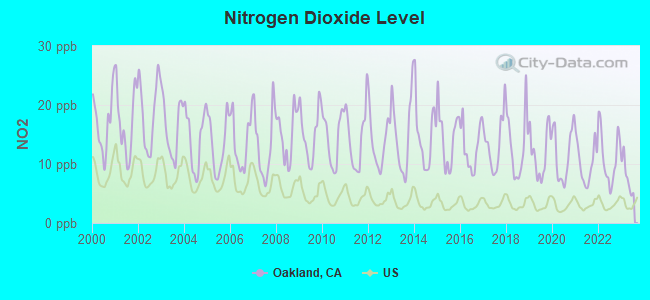
Nitrogen Dioxide (NO2) [ppb] level in 2023 was 7.86. This is significantly worse than average. Closest monitor was 1.9 miles away from the city center.
| City: | 7.86 |
| U.S.: | 5.11 |
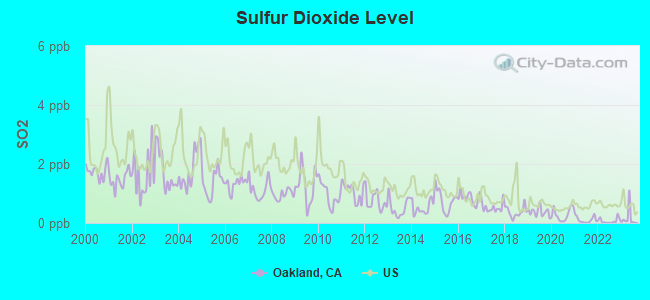
Sulfur Dioxide (SO2) [ppb] level in 2023 was 0.202. This is significantly better than average. Closest monitor was 2.4 miles away from the city center.
| City: | 0.202 |
| U.S.: | 1.515 |
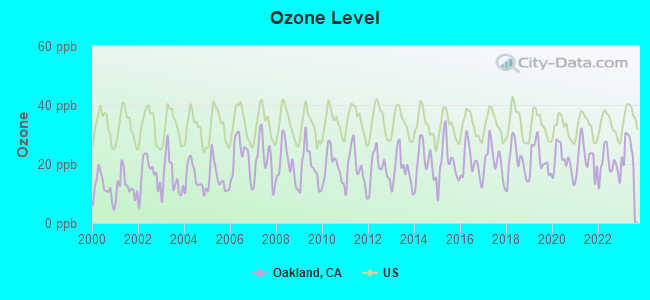
Ozone [ppb] level in 2023 was 25.2. This is better than average. Closest monitor was 2.1 miles away from the city center.
| City: | 25.2 |
| U.S.: | 33.3 |
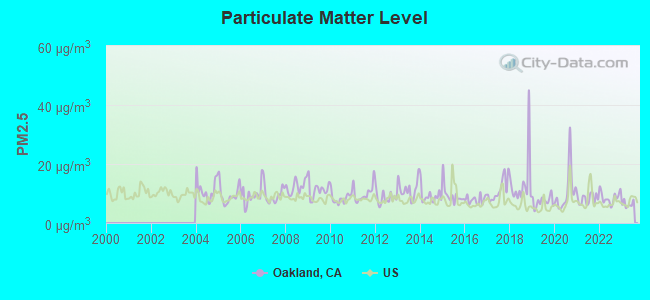
Particulate Matter (PM2.5) [µg/m3] level in 2023 was 6.41. This is better than average. Closest monitor was 1.9 miles away from the city center.
| City: | 6.41 |
| U.S.: | 8.11 |
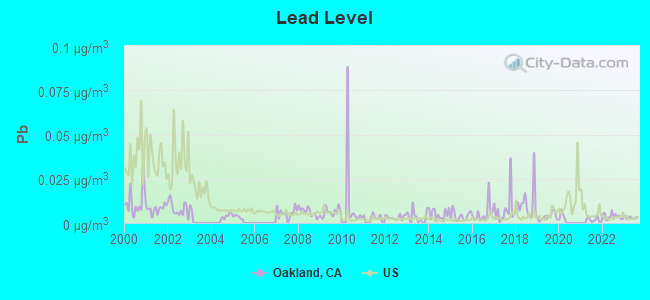
Lead (Pb) [µg/m3] level in 2023 was 0.00290. This is significantly better than average. Closest monitor was 2.7 miles away from the city center.
| City: | 0.00290 |
| U.S.: | 0.00931 |
Earthquake activity:
Oakland-area historical earthquake activity is significantly above California state average. It is 7548% greater than the overall U.S. average.On 4/18/1906 at 13:12:21, a magnitude 7.9 (7.9 UK, Class: Major, Intensity: VIII - XII) earthquake occurred 44.4 miles away from Oakland center, causing $524,000,000 total damage
On 10/18/1989 at 00:04:15, a magnitude 7.1 (6.5 MB, 7.1 MS, 6.9 MW, 7.0 ML) earthquake occurred 53.7 miles away from the city center, causing 62 deaths (62 shaking deaths) and 3757 injuries, causing $1,305,032,704 total damage
On 11/4/1927 at 13:51:53, a magnitude 7.5 (7.5 UK) earthquake occurred 210.1 miles away from Oakland center
On 7/21/1952 at 11:52:14, a magnitude 7.7 (7.7 UK) earthquake occurred 263.9 miles away from the city center, causing $50,000,000 total damage
On 1/31/1922 at 13:17:28, a magnitude 7.6 (7.6 UK) earthquake occurred 268.4 miles away from the city center
On 4/25/1992 at 18:06:04, a magnitude 7.2 (6.3 MB, 7.1 MS, 7.2 MW, 7.1 MW, Depth: 9.4 mi) earthquake occurred 202.4 miles away from Oakland center, causing $75,000,000 total damage
Magnitude types: body-wave magnitude (MB), local magnitude (ML), surface-wave magnitude (MS), moment magnitude (MW)
Natural disasters:
The number of natural disasters in Alameda County (20) is greater than the US average (15).Major Disasters (Presidential) Declared: 14
Emergencies Declared: 2
Causes of natural disasters: Floods: 13, Storms: 7, Mudslides: 6, Winter Storms: 6, Landslides: 4, Fires: 2, Drought: 1, Earthquake: 1, Freeze: 1, Hurricane: 1, Tornado: 1, Other: 1 (Note: some incidents may be assigned to more than one category).
Main business address for: VERSATA INC (SERVICES-PREPACKAGED SOFTWARE), ZHONE TECHNOLOGIES INC (TELEPHONE & TELEGRAPH APPARATUS), DREYERS GRAND ICE CREAM HOLDINGS INC (ICE CREAM & FROZEN DESSERTS), CROWLEY MARITIME CORP (WATER TRANSPORTATION), DESIGN WITHIN REACH INC (WHOLESALE-FURNITURE & HOME FURNISHINGS), GOLDEN WEST FINANCIAL CORP /DE/ (SAVINGS INSTITUTION, FEDERALLY CHARTERED), COST PLUS INC/CA/ (RETAIL-HOME FURNITURE, FURNISHINGS & EQUIPMENT STORES), CLOROX CO /DE/ (SPECIALTY CLEANING, POLISHING AND SANITATION PREPARATIONS) and 2 other public companies.
Hospitals in Oakland:
- ALAMEDA COUNTY MEDICAL CENTER (Government - Hospital District or Authority, provides emergency services, 1411 E 31ST ST)
- ALTA BATES SUMMIT MEDICAL CENTER (Voluntary non-profit - Private, 350 HAWTHORNE AVENUE)
- EVERETT A GLADMAN MEM HOSP (2633 E 27TH ST)
- KAISER FOUNDATION HOSPITAL HOSPICE - OAKLAND (235 WEST MACARTHUR BOULEVARD)
- KAISER FOUNDATION HOSPITAL OAKLAND/RICHMOND (Voluntary non-profit - Other, provides emergency services, 280 W MACARTHUR BLVD)
- OAKLAND HOSPITAL (2648 E 14TH ST)
- PATHWAYS HOME HEALTH AND HOSPICE (7901 OAKPORT STREET, SUITE 3500)
- PROVIDENCE HOSPITAL (3012 SUMMIT ST)
- VNA COMPLETE HOSPICE, INC (5232 CLAREMONT AVE)
Nursing Homes in Oakland:
- ALPHA CONVALESCENT HOSPITAL (3550 FOOTHILL BLVD)
- BELLAKEN SKILLED NURSING CTR (2780 26TH AVENUE)
- ELDER CIRCLE/GOOD HOPE (1935 SEMINARY AVE)
- FRUITVALE HEALTH CARE CENTER (3020 EAST 15TH STREET)
- HIGHVIEW CONVALESCENT HOSPITAL (1301 EAST 31ST)
- LAKESHORE CONVALESCENT HOSP (1901 - 3RD AVENUE)
- MERCY RETIREMENT AND CARE CENTER (3431 FOOTHILL BLVD.)
- OAKLAND HEALTHCARE AND WELLNESS CENTER (3030 WEBSTER ST.)
- SALEM CARE CENTER (2361 EAST 29TH STREET)
- THE REHABILITATION CENTER OF OAKLAND (210 40TH STREET WAY)
Dialysis Facilities in Oakland:
- ALAMEDA COUNTY DIALYSIS CENTER (10700 MACARTHUR BLVD STE 14A)
- OAKLAND DIALYSIS CENTER (5354 CLAREMONT AVENUE)
- OAKLAND PERITONEAL DIALYSIS CENTER (5352 CLAREMONT AVE)
- RAI - EAST BAY - OAKLAND (2628 INTERNATIONAL BLVD, STE 100)
- RAI BANCROFT (6955 FOOTHILL BLVD. STE 220)
- RAI OAKLAND HOME PROGRAM 1 (2710 TELEGRAPH AVENUE #205)
- RAI PERALTA (2757 TELEGRAPH AVENUE)
- RAI PIEDMONT (2710 TELEGRAPH AVENUE SUITE #100)
Home Health Centers in Oakland:
- ASIAN AMERICAN HOME CARE, INC (704 BROADWAY, SUITE 202)
- ASIAN NETWORK PACIFIC HOME CARE, INC (212 9TH STREET, SUITE 205)
- E M HEALTH SERVICES (3640 GRAND AVENUE SUITE 210)
- HEALTH SERVICE SOLUTIONS (333 HEGENBERGER RD STE 401)
- HOME HEALTH SYSTEMS (1900 EMBARCADERO SUITE 401)
- KAISER FOUNDATION HOSPITAL HOME HEALTH - OAKLAND (4501 BROADWAY)
Airports and heliports located in Oakland:
- Metropolitan Oakland International Airport (OAK) (Runways: 4, Commercial Ops: 110,952, Air Taxi Ops: 16,369, Itinerant Ops: 43,094, Local Ops: 31,368, Military Ops: 534)
- Children's Hospital Oakland Heliport (7CL1)
Colleges/Universities in Oakland:
- Laney College (Full-time enrollment: 5,668; Location: 900 Fallon Sreet; Public; Website: www.laney.edu/wp/)
- Merritt College (Full-time enrollment: 2,842; Location: 12500 Campus Dr; Public; Website: www.merritt.edu)
- Samuel Merritt University (Full-time enrollment: 1,699; Location: 3100 Telegraph Avenue; Private, not-for-profit; Website: www.samuelmerritt.edu; Offers Doctor's degree)
- Mills College (Full-time enrollment: 1,564; Location: 5000 MacArthur Blvd; Private, not-for-profit; Website: www.mills.edu; Offers Doctor's degree)
- Holy Names University (Full-time enrollment: 1,167; Location: 3500 Mountain Blvd; Private, not-for-profit; Website: www.hnu.edu; Offers Master's degree)
- SUM Bible College and Theological Seminary (Full-time enrollment: 412; Location: 735 - 105th Ave; Private, not-for-profit; Website: www.sum.edu; Offers Master's degree)
- Lincoln University (Full-time enrollment: 282; Location: 401 15th Street; Private, not-for-profit; Website: www.lincolnuca.edu; Offers Doctor's degree)
- International College of Cosmetology (Full-time enrollment: 157; Location: 3701 International Boulevard; Private, for-profit; Website: www.internationalcosmetology.edu)
- The English Center (Full-time enrollment: 155; Location: 66 Franklin Street, Suite 220; Private, not-for-profit; Website: www.englishcenter.edu)
- Academy of Chinese Culture and Health Sciences (Full-time enrollment: 141; Location: 1601 Clay St; Private, not-for-profit; Website: www.acchs.edu; Offers Master's degree)
- ITT Technical Institute-Oakland (Full-time enrollment: 138; Location: 7901 Oakport Street; Private, for-profit; Website: www.itt-tech.edu/npc)
- Moler Barber College (Full-time enrollment: 93; Location: 3815 Telegraph Ave; Private, for-profit; Website: moler.org/Home_Page.html)
- Peralta Community College System Office (Location: 333 E Eighth St; Public; Website: www.peralta.edu)
- University of California-System Administration Central Office (Location: 1111 Franklin St; Public; Website: www.ucop.edu; Offers Doctor's degree)
Other colleges/universities with over 2000 students near Oakland:
- College of Alameda (about 3 miles; Alameda, CA; Full-time enrollment: 3,071)
- University of California-Berkeley (about 6 miles; Berkeley, CA; FT enrollment: 37,127)
- Berkeley City College (about 6 miles; Berkeley, CA; FT enrollment: 3,146)
- Saint Mary's College of California (about 8 miles; Moraga, CA; FT enrollment: 4,200)
- Academy of Art University (about 10 miles; San Francisco, CA; FT enrollment: 12,352)
- University of San Francisco (about 13 miles; San Francisco, CA; FT enrollment: 9,190)
- Chabot College (about 13 miles; Hayward, CA; FT enrollment: 7,610)
Biggest public high schools in Oakland:
- SKYLINE HIGH (Students: 1,362, Location: 12250 SKYLINE BLVD., Grades: 9-12)
- OAKLAND HIGH (Students: 1,187, Location: 1023 MACARTHUR BLVD., Grades: 9-12)
- OAKLAND TECHNICAL HIGH (Students: 1,128, Location: 4351 BRD.WAY, Grades: 9-12)
- ASPIRE LIONEL WILSON COLLEGE PREPARATORY ACADEMY (Students: 439, Location: 400 105TH AVE., Grades: 6-12, Charter school)
- OAKLAND MILITARY INSTITUTE, COLLEGE PREPARATORY AC (Students: 431, Location: 3877 LUSK ST., Grades: 6-12, Charter school)
- OAKLAND SCHOOL FOR THE ARTS (Students: 342, Location: 530 18TH ST., Grades: 6-12, Charter school)
- COLISEUM COLLEGE PREP ACADEMY (Students: 245, Location: 1390 66TH AVE., Grades: 6-12)
- BAY AREA TECHNOLOGY (Students: 175, Location: 8251 FONTAINE ST., Grades: 6-12, Charter school)
- LIFE ACADEMY (Students: 170, Location: 2101 35TH AVE., Grades: 6-12)
- ARISE HIGH (Students: 155, Location: 3301 E. 12TH ST., STE. 205, Grades: 9-12, Charter school)
Biggest private high schools in Oakland:
- BISHOP O DOWD HIGH SCHOOL (Students: 1,141, Location: 9500 STEARNS AVE, Grades: 9-12)
- HEAD ROYCE SCHOOL (Students: 830, Location: 4315 LINCOLN AVE, Grades: KG-12)
- BENTLEY SCHOOL (Students: 645, Location: 1 HILLER DR, Grades: KG-12)
- THE COLLEGE PREPARATORY SCHOOL (Students: 364, Location: 6100 BROADWAY, Grades: 9-12)
- HOLY NAMES HIGH SCHOOL (Students: 166, Location: 4660 HARBORD DR, Grades: 9-12, Girls only)
- ST ELIZABETH HIGH SCHOOL (Students: 165, Location: 1530 34TH AVE, Grades: 9-12)
- PATTEN ACADEMY OF CHRISTIAN EDUCATION (Students: 128, Location: 2433 COOLIDGE AVE, Grades: KG-12)
- SPECTRUM CENTER (Students: 77, Location: 6325 CAMDEN ST, Grades: UG-12)
- BAYHILL HIGH SCHOOL (Students: 73, Location: 521 BODEN WAY, Grades: 9-12)
- AGNES MEMORIAL CHRISTIAN ACADEMY (Students: 40, Location: 2372 INTERNATIONAL BLVD, Grades: PK-12)
Biggest public elementary/middle schools in Oakland:
- MONTERA MIDDLE (Students: 848, Location: 5555 ASCOT DR., Grades: 6-8)
- EDNA BREWER MIDDLE (Students: 713, Location: 3748 13TH AVE., Grades: 6-8)
- BRET HARTE MIDDLE (Students: 671, Location: 3700 COOLIDGE AVE., Grades: 6-8)
- ROOSEVELT MIDDLE (Students: 639, Location: 1926 19TH AVE., Grades: 6-8)
- WESTLAKE MIDDLE (Students: 559, Location: 2629 HARRISON ST., Grades: 6-8)
- FRICK MIDDLE (Students: 437, Location: 2845 64TH AVE., Grades: 6-8)
- CLAREMONT MIDDLE (Students: 376, Location: 5750 COLLEGE AVE., Grades: 6-8)
- UNITED FOR SUCCESS ACADEMY (Students: 352, Location: 2101 35TH AVE., Grades: 6-8)
- FRUITVALE ELEMENTARY (Students: 351, Location: 3200 BOSTON AVE., Grades: KG-5)
- LIGHTHOUSE COMMUNITY CHARTER (Students: 336, Location: 444 HEGENBERGER ST., Grades: KG-8, Charter school)
Biggest private elementary/middle schools in Oakland:
- ST PAULS EPISCOPAL SCHOOL (Students: 357, Location: 116 MONTECITO AVE, Grades: KG-8)
- REDWOOD DAY SCHOOL (Students: 351, Location: 3245 SHEFFIELD AVE, Grades: KG-8)
- ST ELIZABETH ELEMENTARY SCHOOL (Students: 345, Location: 1516 33RD AVE, Grades: PK-8)
- PARK DAY SCHOOL (Students: 298, Location: 360 42ND ST, Grades: KG-8)
- ST THERESA ELEMENTARY SCHOOL (Students: 282, Location: 4850 CLAREWOOD DR, Grades: KG-8)
- BEACON DAY SCHOOL (Students: 247, Location: 2101 LIVINGSTON ST, Grades: PK-8)
- SCHOOL OF SAINT LEO THE GREAT (Students: 232, Location: 4238 HOWE ST, Grades: PK-8)
- ESCUELA BILINGUE INTERNACIONAL (Students: 228, Location: 410 ALCATRAZ AVE, Grades: PK-5)
- ST MARTIN DE PORRES SCHOOL (Students: 202, Location: 675 41ST ST, Grades: KG-8)
- ST ANTHONY CATHOLIC SCHOOL (Students: 199, Location: 1500 E 15TH ST, Grades: KG-8)
Library in Oakland:
User-submitted facts and corrections:
- Please amend the information in Biggest Colleges/Universities in Oakland to reflect the following change: Holy Names University and the website is www.hnu.edu. Thank you!
- Birthplace of: Jeff Hanneman - musician (guitarist in Slayer, born Jan 31, 1964)
Points of interest:
Notable locations in Oakland: Chabot Observatory (A), Airport Marina (B), Oakland Executive Center (C), Berkeley Tennis Club (D), Claremont Country Club (E), USS Potomac (F), Grove Street Pier (G), Bay Bridge Terminal (H), Matson Terminal (I), Pier 4 (J), Pier 5 (K), Transbay Container Terminal (L), Yusen Terminal (M), Fruitvale Station (N), MacArthur Maze (O), East Bay Wastewater Treatment Plant (P), Broadway Wharf (Q), Sixteenth Street Station (R), Sea-Land Terminal (S), San Francisco-Oakland Terminal (T). Display/hide their locations on the map
Shopping Centers: Rockridge Shopping Center (1), Lincoln Square Shopping Center (2), Foothill Square Shopping Center (3), McArthur-Broadway Shopping Center (4), Verns Shopping Center (5), Eastmont Mall Shopping Center (6). Display/hide their locations on the map
Main business address in Oakland include: VERSATA INC (A), ZHONE TECHNOLOGIES INC (B), DREYERS GRAND ICE CREAM HOLDINGS INC (C), CROWLEY MARITIME CORP (D), DESIGN WITHIN REACH INC (E), GOLDEN WEST FINANCIAL CORP /DE/ (F), COST PLUS INC/CA/ (G), CLOROX CO /DE/ (H). Display/hide their locations on the map
Churches in Oakland include: Golden Gate Primitive Baptist Church (A), Grace Community Methodist Church (B), Greater Emmanuel Church of God in Christ (C), Havenscourt Colonial Church (D), Hillside Presbyterian Church (E), Kingdom Hall of Jehovahs Witnesses (F), Laurel Methodist Church (G), Mills Terrace Christian Church (H), New Apostolic Church (I). Display/hide their locations on the map
Cemeteries: Evergreen Cemetery (1), Home of Peace Cemetery (2), Evergreen Mausoleum (3), Mountain View Cemetery (4), Saint Marys Cemetery (5). Display/hide their locations on the map
Lakes, reservoirs, and swamps: Lake Merritt (A), Tyson Lake (B), Lake Temescal (C), Seneca Reservoir (D), Reservoir Number One (E), Reservoir Number Two (F), Dingee Reservoir (G), Thirtyninth Avenue Reservoir (H). Display/hide their locations on the map
Streams, rivers, and creeks: Claremont Creek (A), Country Club Branch (B), Glen Echo Creek (C), Lion Creek (D), Temescal Creek (E), Shephard Creek (F), Sausal Creek (G), San Leandro Creek (H), Rifle Range Branch (I). Display/hide their locations on the map
Parks in Oakland include: Arroyo Viejo Recreation Center (1), Montclair Playground (2), Mosswood Park (3), Fremont Municipal Pool (4), Live Oak Memorial Pool (5), North Oakland Recreation Center (6), Piedmont Recreation Center (7), Temescal Pool (8), Frank Youell Athletic Field (9). Display/hide their locations on the map
Beach: Sandy Beach (A). Display/hide its location on the map
Tourist attractions: Alameda County Historical Society (Museums; 672 11th Street) (1), Camron-Stanford House (Museums; 1418 Lakeside Drive) (2), Everything Fishie (Aquariums; 3600 Grand Ave) (3), Chabot Space & Science Center (Cultural Attractions- Events- & Facilities; 10000 Skyline Boulevard) (4), Casa Cuba Resource Center (Cultural Attractions- Events- & Facilities; 6501 Telegraph Avenue) (5), Ebony Museum Of Art (Art Museums; 1034 14th St) (6), Chabot Space and Science Center (Cultural Attractions- Events- & Facilities; 10000 Skyline Blvd) (7), Cohen Bray House (Cultural Attractions- Events- & Facilities; 1440 29th Avenue) (8), International Partners (Ski & Helicopter Tours; 395 Palm Avenue Apt E) (9). Display/hide their approximate locations on the map
Hotels: Best Western Inn At The Square (233 Broadway) (1), Best Western Airport Inn & Suites (170 Hegenberger Loop) (2), Avondale Hotel (540 28th Street) (3), Alta Vista (441 Merritt Avenue) (4), Budget Inn (55 Macarthur Boulevard) (5), Broadway Motel (4140 Broadway) (6). Display/hide their approximate locations on the map
Courts: Alameda County Offices - Superior Court Of California County Of Ala (1225 Fallon) (1), BARONS Bailbond (2816 73rd Avenue) (2), United States Government - Courts- District Court- Magistrate Judge Br (1301 Clay) (3), Alameda County Offices - Superior Court of California County of Alameda- Juvenile C (400 Broadway) (4), Alameda County Offices - Superior Court of California County of Alameda- Pretrial Services Divi (600 Washington Street) (5), Alameda County Offices - Superior Court of California County of Alameda- Wiley W Manuel Courth (600 Washington Street) (6), Alameda County Offices - Wiley W Manuel Courthouse- Court Services-Marshal's Of (661 Washington Street) (7), Coolidge Court Inc (3850 Coolidge Avenue Apt 300) (8), United States Government - Courts- District Court- Judge Wilken (1301 Clay) (9). Display/hide their approximate locations on the map
Birthplace of: Lillian Moller Gilbreth - Educator, Maurice Jones-Drew - College football player, Michael Franti - Anti-war activist, Alan Mulally - President and CEO of Ford Motor Company, John Carl Warnecke - Architect, Jay Bybee - Judge, Kamala Harris - Lawyer, Gary Payton - Basketball player, Edwin Meese - (born 1931), politician, Chauncey Bailey - Journalist.
Drinking water stations with addresses in Oakland and their reported violations in the past:
OAKLAND FEATHER RIVER CAMP (Population served: 300, Groundwater):Past health violations:Past monitoring violations:
- MCL, Acute (TCR) - In JUL-2006, Contaminant: Coliform. Follow-up actions: St Violation/Reminder Notice (2 times from JUL-28-2006 to AUG-21-2006)
- MCL, Acute (TCR) - In JUN-2006, Contaminant: Coliform. Follow-up actions: St Violation/Reminder Notice (JUL-28-2006)
- One routine major monitoring violation
Drinking water stations with addresses in Oakland that have no violations reported:
- EBRPD - DEL VALLE REGIONAL PARK (Population served: 10,000, Primary Water Source Type: Surface water)
- ALAMEDA POINT (Population served: 750, Primary Water Source Type: Purch surface water)
- EBRPD ALHAMBRA (Population served: 70, Primary Water Source Type: Groundwater)
- NORTHERN CALIFORNIA VIPASSANA CENTER (Population served: 66, Primary Water Source Type: Groundwater)
- EBRPD ROUND VALLEY WATER SYSTEM (Population served: 65, Primary Water Source Type: Groundwater)
- TWO RIVERS RV PARK (Population served: 50, Primary Water Source Type: Groundwater)
- EBRPD LITTLE HILLS (Population served: 50, Primary Water Source Type: Groundwater)
- EBRPD BLACK DIAMOND MINES (Population served: 45, Primary Water Source Type: Groundwater)
- EBRPD - SUNOL REGIONAL WILDERNESS (Population served: 35, Primary Water Source Type: Groundwater)
- EBRPD - REDWOOD SPRING REGIONAL PARK (Population served: 35, Primary Water Source Type: Groundwater)
| This city: | 2.5 people |
| California: | 2.9 people |
| This city: | 54.4% |
| Whole state: | 68.7% |
| This city: | 9.6% |
| Whole state: | 7.2% |
Likely homosexual households (counted as self-reported same-sex unmarried-partner households)
- Lesbian couples: 1.3% of all households
- Gay men: 0.9% of all households
People in group quarters in Oakland in 2010:
- 2,212 people in other noninstitutional facilities
- 1,365 people in college/university student housing
- 1,349 people in nursing facilities/skilled-nursing facilities
- 809 people in emergency and transitional shelters (with sleeping facilities) for people experiencing homelessness
- 801 people in local jails and other municipal confinement facilities
- 474 people in residential treatment centers for adults
- 400 people in workers' group living quarters and job corps centers
- 379 people in group homes intended for adults
- 122 people in correctional residential facilities
- 77 people in residential treatment centers for juveniles (non-correctional)
- 49 people in group homes for juveniles (non-correctional)
- 42 people in correctional facilities intended for juveniles
- 36 people in maritime/merchant vessels
- 23 people in mental (psychiatric) hospitals and psychiatric units in other hospitals
People in group quarters in Oakland in 2000:
- 2,247 people in other noninstitutional group quarters
- 1,475 people in nursing homes
- 865 people in local jails and other confinement facilities (including police lockups)
- 532 people in college dormitories (includes college quarters off campus)
- 491 people in homes or halfway houses for drug/alcohol abuse
- 440 people in other group homes
- 200 people in religious group quarters
- 190 people in mental (psychiatric) hospitals or wards
- 114 people in halfway houses
- 109 people in homes for the mentally retarded
- 106 people in homes for the mentally ill
- 75 people in other nonhousehold living situations
- 71 people in homes for abused, dependent, and neglected children
- 63 people in residential treatment centers for emotionally disturbed children
- 50 people in crews of maritime vessels
- 39 people in unknown juvenile institutions
- 27 people in orthopedic wards and institutions for the physically handicapped
- 26 people in hospitals or wards for drug/alcohol abuse
- 21 people in homes for the physically handicapped
- 19 people in hospitals/wards and hospices for chronically ill
- 12 people in hospices or homes for chronically ill
- 10 people in job corps and vocational training facilities
- 7 people in other hospitals or wards for chronically ill
- 3 people in wards in general hospitals for patients who have no usual home elsewhere
- 2 people in short-term care, detention or diagnostic centers for delinquent children
Banks with most branches in Oakland (2011 data):
- Bank of America, National Association: 13 branches. Info updated 2009/11/18: Bank assets: $1,451,969.3 mil, Deposits: $1,077,176.8 mil, headquarters in Charlotte, NC, positive income, 5782 total offices, Holding Company: Bank Of America Corporation
- Wells Fargo Bank, National Association: 10 branches. Info updated 2011/04/05: Bank assets: $1,161,490.0 mil, Deposits: $905,653.0 mil, headquarters in Sioux Falls, SD, positive income, 6395 total offices, Holding Company: Wells Fargo & Company
- JPMorgan Chase Bank, National Association: 8 branches. Info updated 2011/11/10: Bank assets: $1,811,678.0 mil, Deposits: $1,190,738.0 mil, headquarters in Columbus, OH, positive income, International Specialization, 5577 total offices, Holding Company: Jpmorgan Chase & Co.
- Citibank, National Association: 8 branches. Info updated 2012/01/10: Bank assets: $1,288,658.0 mil, Deposits: $882,541.0 mil, headquarters in Sioux Falls, SD, positive income, International Specialization, 1048 total offices, Holding Company: Citigroup Inc.
- Bank of the West: Fruitvale Station Branch, Oakland Main Branch, Temescal Branch, Montclair Branch, Lakeshore Branch, Medical Center Hill Branch. Info updated 2009/11/16: Bank assets: $62,408.3 mil, Deposits: $43,995.2 mil, headquarters in San Francisco, CA, positive income, 647 total offices, Holding Company: Bnp Paribas
- BBCN Bank: Oakland Chinatown Branch, Oakland Branch, Oakland Main Branch. Info updated 2011/12/12: Bank assets: $5,170.7 mil, Deposits: $3,989.4 mil, headquarters in Los Angeles, CA, positive income, Commercial Lending Specialization, 49 total offices, Holding Company: Bbcn Bancorp, Inc.
- U.S. Bank National Association: Kaiser Center Branch at 344 - 20th Street, branch established on 2004/07/26; Montclair Branch at 1998 Mountain Boulevard, branch established on 1887/01/01. Info updated 2012/01/30: Bank assets: $330,470.8 mil, Deposits: $236,091.5 mil, headquarters in Cincinnati, OH, positive income, 3121 total offices, Holding Company: U.S. Bancorp
- Gateway Bank, F.S.B.: Oakland Hq at 2201 Broadway Street, Suite #404, branch established on 2008/07/01; 360 Eighth Street Branch at 360 Eighth Street, branch established on 1979/01/01. Info updated 2011/07/21: Bank assets: $266.8 mil, Deposits: $252.4 mil, headquarters in San Francisco, CA, negative income in the last year, Mortgage Lending Specialization, 3 total offices
- East West Bank: Oakland Webster Branch at 900 Webster Street, branch established on 1977/02/26; Oakland Branch at 367 8th Street, branch established on 1974/04/19. Info updated 2010/06/14: Bank assets: $21,962.4 mil, Deposits: $17,501.8 mil, headquarters in Pasadena, CA, positive income, Commercial Lending Specialization, 131 total offices, Holding Company: East West Bancorp, Inc.
- 20 other banks with 22 local branches
For population 15 years and over in Oakland:
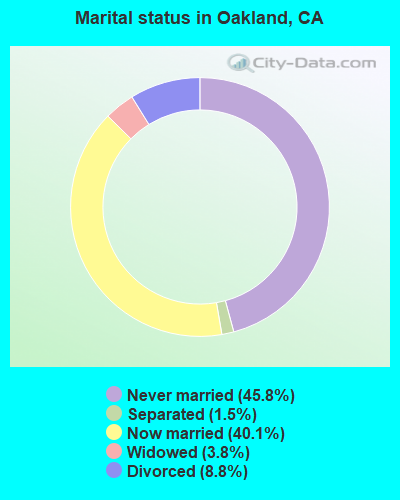
- Never married: 45.8%
- Now married: 40.1%
- Separated: 1.5%
- Widowed: 3.8%
- Divorced: 8.8%
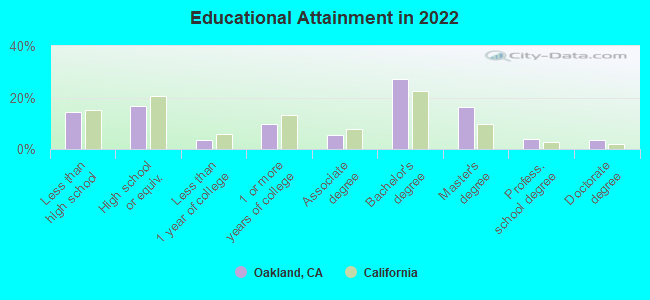
For population 25 years and over in Oakland:
- High school or higher: 85.8%
- Bachelor's degree or higher: 50.7%
- Graduate or professional degree: 23.6%
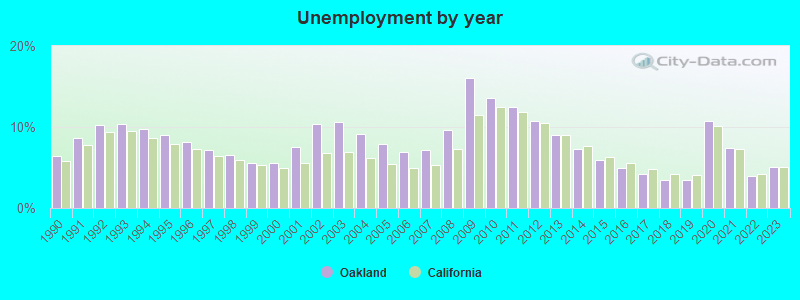
- Unemployed: 3.7%
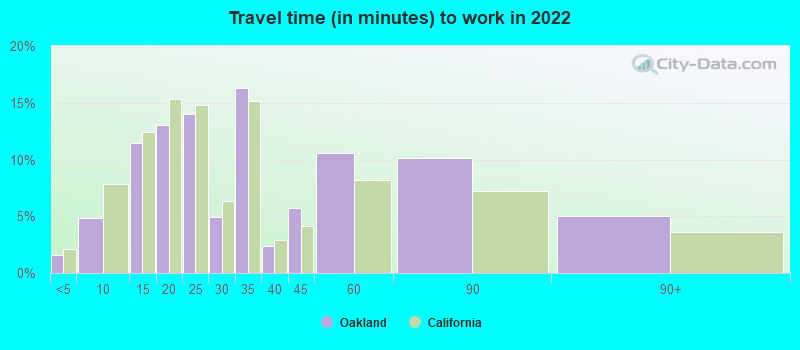
- Mean travel time to work (commute): 20.5 minutes
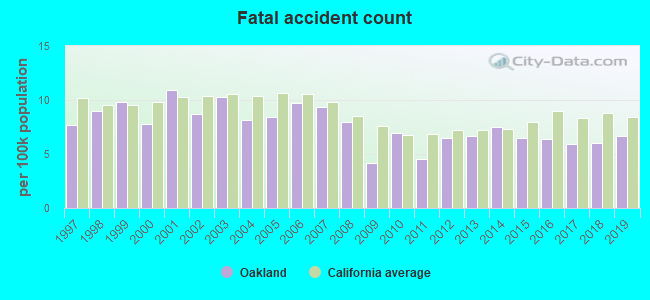
| Here: | 16.3 |
| California average: | 15.5 |
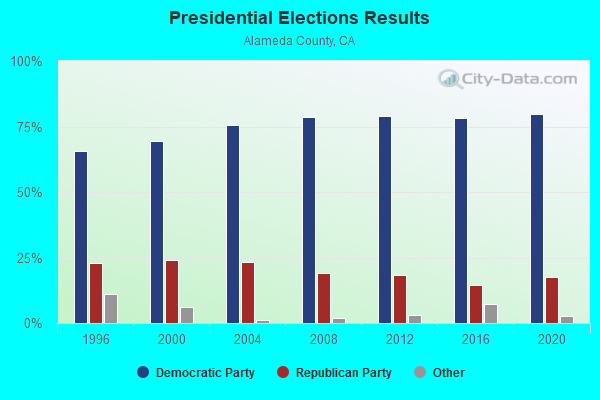
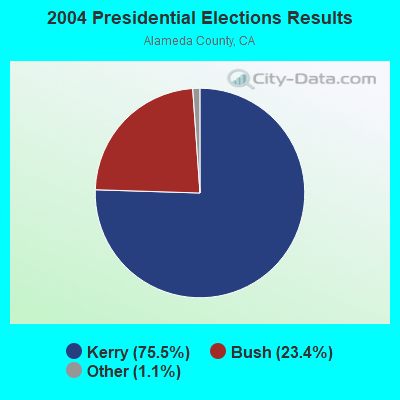
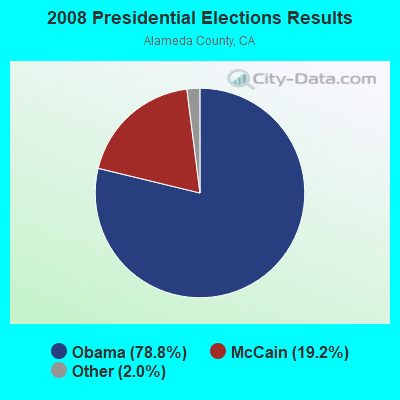

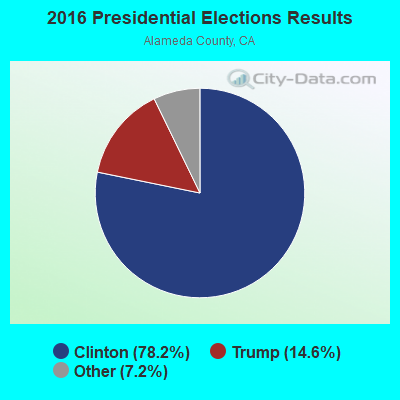
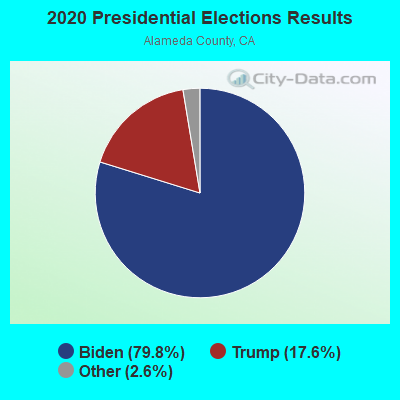
Graphs represent county-level data. Detailed 2008 Election Results
Neighborhoods in Oakland:
(Oakland, California Neighborhood Map)- Acorn Industrial neighborhood
- Adams Point neighborhood
- Allendale neighborhood
- Arroyo Viejo neighborhood
- Bartlett neighborhood
- Bella Vista neighborhood
- Broadway Auto Row neighborhood
- Brookfield Village neighborhood
- Bushrod neighborhood
- Caballo Hills neighborhood
- Castlemont neighborhood
- Chabot Park neighborhood
- Chinatown neighborhood
- City Center neighborhood
- Civic Center neighborhood
- Cleveland Heights neighborhood
- Clinton neighborhood
- Coliseum neighborhood
- Coliseum Industrial neighborhood
- Columbia Gardens neighborhood
- Cox neighborhood
- Crestmont neighborhood
- Crocker Highland neighborhood
- Dimond neighborhood
- Downtown neighborhood
- Durant Manor neighborhood
- East Peralta neighborhood
- Eastmont neighborhood
- Eastmont Hills neighborhood
- Elmhurst Park neighborhood
- Fairfax neighborhood
- Fairfax Business (Wentworth) neighborhood
- Fairview Park neighborhood
- Fitchburg neighborhood
- Foothill Square neighborhood
- Forestland neighborhood
- Fremont neighborhood
- Frick neighborhood
- Fruitvale Station neighborhood
- Glen Highlands neighborhood
- Glenview neighborhood
- Gold Coast neighborhood
- Golf Links neighborhood
- Grand Lake neighborhood
- Hacienda (Peralta Hacienda) neighborhood
- Harrington neighborhood
- Harrison Street neighborhood
- Havensourt (Bancroft Business) neighborhood
- Hawthorne neighborhood
- Hegenberger neighborhood
- Highland neighborhood
- Highland Park (Lynn) neighborhood
- Highland Terrace neighborhood
- Hiller Highlands neighborhood
- Ironworks District neighborhood
- Iveywood neighborhood
- Ivy Hill neighborhood
- Jack London Square neighborhood
- Jefferson neighborhood
- Lake Merritt District neighborhood
- Lakeshore neighborhood
- Lakewide neighborhood
- Laney (Peralta/Laney) neighborhood
- Las Palmas neighborhood
- Laurel neighborhood
- Leona Heights neighborhood
- Lincoln Highlands neighborhood
- Lockwood Tevis neighborhood
- Loft District neighborhood
- MacArthur Maze (The Maze) neighborhood
- Maxwell Park neighborhood
- Mcclymonds neighborhood
- Meadow Brook (Reservoir Hill) neighborhood
- Melrose neighborhood
- Merritt neighborhood
- Merriwood neighborhood
- Mills College neighborhood
- Millsmont neighborhood
- Montclair neighborhood
- Montclair Business neighborhood
- Mosswood neighborhood
- North Kennedy Tract neighborhood
- North Stonehurst neighborhood
- Northgate neighborhood
- Oak Center neighborhood
- Oak Tree neighborhood
- Oakmore neighborhood
- Old City neighborhood
- Old Oakland neighborhood
- Patten neighborhood
- Piedmont Avenue neighborhood
- Piedmont Pines neighborhood
- Pill Hill neighborhood
- Prescott neighborhood
- Produce and Waterfront neighborhood
- Ralph Bunche neighborhood
- Rancho San Antonio neighborhood
- Redwood Heights neighborhood
- Rockridge neighborhood
- San Pablo Gateway neighborhood
- Sausal Creek neighborhood
- School neighborhood
- Seminary neighborhood
- Sequoyah neighborhood
- Shafter neighborhood
- Sheffield Village neighborhood
- Shepherd Canyon neighborhood
- Skyline - Hillcrest Estates neighborhood
- Sobrante Park neighborhood
- South Kennedy Tract neighborhood
- South Prescott neighborhood
- South Stonehurst neighborhood
- St. Elizabeth neighborhood
- Temescal neighborhood
- Toler Heights neighborhood
- Trestle Glen neighborhood
- Tuxedo neighborhood
- Upper Dimond neighborhood
- Upper Laurel neighborhood
- Upper Peralta Creek neighborhood
- Upper Rockridge neighborhood
- Uptown neighborhood
- Waterfront Warehouse District neighborhood
- Waverly neighborhood
- Webster neighborhood
- West Oakland neighborhood
- Woodland neighborhood
- Woodminster neighborhood
Religion statistics for Oakland, CA (based on Alameda County data)
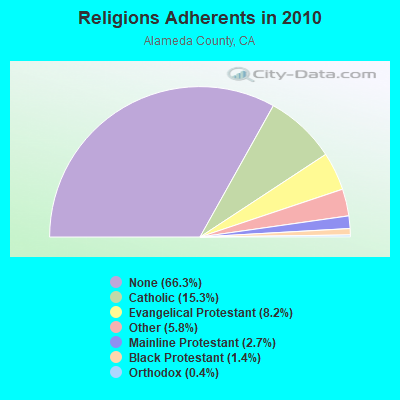
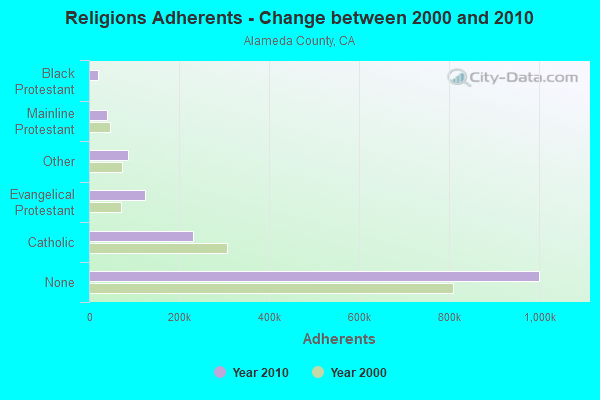
| Religion | Adherents | Congregations |
|---|---|---|
| Catholic | 231,500 | 53 |
| Evangelical Protestant | 123,422 | 538 |
| Other | 87,110 | 227 |
| Mainline Protestant | 40,185 | 181 |
| Black Protestant | 20,716 | 76 |
| Orthodox | 6,640 | 16 |
| None | 1,000,698 | - |
Food Environment Statistics:
| This county: | 2.50 / 10,000 pop. |
| California: | 2.14 / 10,000 pop. |
| Alameda County: | 0.03 / 10,000 pop. |
| State: | 0.04 / 10,000 pop. |
| Alameda County: | 0.67 / 10,000 pop. |
| California: | 0.62 / 10,000 pop. |
| Here: | 1.60 / 10,000 pop. |
| California: | 1.49 / 10,000 pop. |
| Alameda County: | 8.94 / 10,000 pop. |
| California: | 7.42 / 10,000 pop. |
| Alameda County: | 6.9% |
| California: | 7.3% |
| Alameda County: | 19.3% |
| State: | 21.3% |
| Alameda County: | 16.6% |
| California: | 17.9% |
Health and Nutrition:
| Oakland: | 50.4% |
| California: | 49.4% |
| This city: | 49.7% |
| California: | 48.0% |
| Oakland: | 28.1 |
| California: | 28.1 |
| Oakland: | 17.5% |
| California: | 20.2% |
| Oakland: | 12.3% |
| California: | 11.2% |
| Oakland: | 6.7 |
| California: | 6.8 |
| Oakland: | 30.8% |
| State: | 31.5% |
| This city: | 57.5% |
| State: | 56.4% |
| This city: | 83.0% |
| California: | 80.9% |
More about Health and Nutrition of Oakland, CA Residents
| Local government employment and payroll (March 2022) | |||||
| Function | Full-time employees | Monthly full-time payroll | Average yearly full-time wage | Part-time employees | Monthly part-time payroll |
|---|---|---|---|---|---|
| Police Protection - Officers | 724 | $11,548,315 | $191,409 | 0 | $0 |
| Firefighters | 404 | $8,344,903 | $247,868 | 0 | $0 |
| Other and Unallocable | 336 | $4,036,521 | $144,161 | 4 | $16,742 |
| Police - Other | 332 | $3,251,513 | $117,525 | 10 | $28,040 |
| Streets and Highways | 311 | $2,849,992 | $109,968 | 68 | $255,312 |
| Airports | 235 | $2,693,479 | $137,539 | 0 | $0 |
| Transit | 220 | $2,119,745 | $115,622 | 69 | $216,562 |
| Financial Administration | 191 | $2,173,786 | $136,573 | 4 | $18,728 |
| Other Government Administration | 153 | $1,677,326 | $131,555 | 10 | $48,938 |
| Local Libraries | 145 | $1,081,749 | $89,524 | 186 | $577,472 |
| Health | 128 | $944,543 | $88,551 | 21 | $82,064 |
| Fire - Other | 94 | $878,257 | $112,118 | 9 | $4,331 |
| Judicial and Legal | 92 | $1,127,235 | $147,031 | 2 | $7,088 |
| Sewerage | 84 | $837,700 | $119,671 | 1 | $325 |
| Parks and Recreation | 76 | $600,689 | $94,846 | 265 | $711,596 |
| Solid Waste Management | 66 | $659,514 | $119,912 | 0 | $0 |
| Water Transport and Terminals | 65 | $869,477 | $160,519 | 0 | $0 |
| Housing and Community Development (Local) | 54 | $528,313 | $117,403 | 0 | $0 |
| Welfare | 32 | $297,640 | $111,615 | 30 | $93,151 |
| Totals for Government | 3,742 | $46,520,697 | $149,184 | 679 | $2,060,348 |
Oakland government finances - Expenditure in 2021 (per resident):
- Construction - Housing and Community Development: $72,395,000 ($168.14)
Air Transportation: $24,205,000 ($56.22)
Police Protection: $1,056,000 ($2.45)
Health - Other: $840,000 ($1.95)
Parks and Recreation: $279,000 ($0.65)
- Current Operations - Police Protection: $319,354,000 ($741.73)
Central Staff Services: $222,494,000 ($516.76)
Local Fire Protection: $164,492,000 ($382.05)
Housing and Community Development: $135,525,000 ($314.77)
Air Transportation: $133,839,000 ($310.85)
Health - Other: $117,460,000 ($272.81)
Regular Highways: $77,043,000 ($178.94)
Sea and Inland Port Facilities: $73,647,000 ($171.05)
Protective Inspection and Regulation - Other: $65,935,000 ($153.14)
Financial Administration: $50,870,000 ($118.15)
Sewerage: $45,908,000 ($106.63)
Libraries: $37,712,000 ($87.59)
Parks and Recreation: $37,467,000 ($87.02)
Judicial and Legal Services: $15,365,000 ($35.69)
Parking Facilities: $7,418,000 ($17.23)
General - Other: $6,858,000 ($15.93)
- General - Interest on Debt: $154,605,000 ($359.08)
- Other Capital Outlay - General - Other: $60,858,000 ($141.35)
Public Welfare - Other: $1,120,000 ($2.60)
Oakland government finances - Revenue in 2021 (per resident):
- Charges - Sea and Inland Port Facilities: $188,109,000 ($436.90)
Air Transportation: $163,018,000 ($378.62)
Other: $112,218,000 ($260.64)
Sewerage: $69,113,000 ($160.52)
Housing and Community Development: $29,017,000 ($67.39)
Parking Facilities: $12,211,000 ($28.36)
Parks and Recreation: $3,709,000 ($8.61)
- Federal Intergovernmental - Other: $115,628,000 ($268.56)
Air Transportation: $30,916,000 ($71.81)
Housing and Community Development: $12,303,000 ($28.57)
- Local Intergovernmental - Other: $2,627,000 ($6.10)
- Miscellaneous - General Revenue - Other: $193,262,000 ($448.87)
Fines and Forfeits: $17,847,000 ($41.45)
Rents: $6,406,000 ($14.88)
Special Assessments: $1,273,000 ($2.96)
Donations From Private Sources: $118,000 ($0.27)
- State Intergovernmental - Other: $122,507,000 ($284.53)
Highways: $17,322,000 ($40.23)
Public Welfare: $3,256,000 ($7.56)
General Local Government Support: $1,819,000 ($4.22)
- Tax - Property: $435,532,000 ($1011.56)
Documentary and Stock Transfer: $113,359,000 ($263.29)
Occupation and Business License - Other: $104,232,000 ($242.09)
General Sales and Gross Receipts: $85,115,000 ($197.69)
Other: $83,906,000 ($194.88)
Public Utilities Sales: $71,703,000 ($166.54)
Other License: $31,257,000 ($72.60)
Other Selective Sales: $25,087,000 ($58.27)
Oakland government finances - Debt in 2021 (per resident):
- Long Term Debt - Beginning Outstanding - Unspecified Public Purpose: $1,918,975,000 ($4457.00)
Outstanding Unspecified Public Purpose: $1,618,028,000 ($3758.02)
Retired Unspecified Public Purpose: $806,643,000 ($1873.50)
Issue, Unspecified Public Purpose: $505,696,000 ($1174.53)
Beginning Outstanding - Public Debt for Private Purpose: $12,625,000 ($29.32)
Outstanding Nonguaranteed - Industrial Revenue: $12,625,000 ($29.32)
Oakland government finances - Cash and Securities in 2021 (per resident):
- Bond Funds - Cash and Securities: $384,722,000 ($893.55)
- Other Funds - Cash and Securities: $1,499,819,000 ($3483.47)
- Sinking Funds - Cash and Securities: $86,511,000 ($200.93)
6.77% of this county's 2021 resident taxpayers lived in other counties in 2020 ($121,106 average adjusted gross income)
| Here: | 6.77% |
| California average: | 5.19% |
0.01% of residents moved from foreign countries ($76 average AGI)
Alameda County: 0.01% California average: 0.03%
Top counties from which taxpayers relocated into this county between 2020 and 2021:
| from Santa Clara County, CA | |
| from San Francisco County, CA | |
| from Contra Costa County, CA |
8.96% of this county's 2020 resident taxpayers moved to other counties in 2021 ($131,786 average adjusted gross income)
| Here: | 8.96% |
| California average: | 6.14% |
0.01% of residents moved to foreign countries ($103 average AGI)
Alameda County: 0.01% California average: 0.02%
Top counties to which taxpayers relocated from this county between 2020 and 2021:
| to Contra Costa County, CA | |
| to Santa Clara County, CA | |
| to San Francisco County, CA |
| Businesses in Oakland, CA | ||||
| Name | Count | Name | Count | |
|---|---|---|---|---|
| 24 Hour Fitness | 3 | La Quinta | 1 | |
| 7-Eleven | 8 | Lane Furniture | 1 | |
| 99 Cents Only Stores | 1 | Little Caesars Pizza | 2 | |
| AT&T | 2 | Marriott | 3 | |
| Ace Hardware | 3 | MasterBrand Cabinets | 9 | |
| Audi | 1 | Mazda | 1 | |
| AutoZone | 4 | McDonald's | 12 | |
| Bed Bath & Beyond | 1 | Men's Wearhouse | 1 | |
| Ben & Jerry's | 2 | Motel 6 | 2 | |
| Best Western | 1 | New Balance | 5 | |
| Big O Tires | 3 | Nike | 12 | |
| Blockbuster | 2 | Nissan | 1 | |
| Budget Car Rental | 1 | Office Depot | 1 | |
| Burger King | 8 | Panda Express | 2 | |
| CVS | 7 | Papa John's Pizza | 1 | |
| Carl\s Jr. | 1 | Payless | 5 | |
| Chevrolet | 1 | Penske | 1 | |
| Church's Chicken | 4 | Pizza Hut | 2 | |
| Comfort Inn | 1 | Popeyes | 3 | |
| Curves | 2 | Quality | 1 | |
| DHL | 4 | Quiznos | 4 | |
| Days Hotel | 1 | RadioShack | 4 | |
| Dennys | 1 | Rite Aid | 2 | |
| Domino's Pizza | 4 | SAS Shoes | 1 | |
| DressBarn | 1 | Safeway | 7 | |
| Econo Lodge | 1 | Sears | 1 | |
| El Pollo Loco | 1 | Sprint Nextel | 1 | |
| Extended Stay America | 1 | Starbucks | 17 | |
| FedEx | 54 | Subaru | 1 | |
| Firestone Complete Auto Care | 2 | Subway | 23 | |
| Foot Locker | 2 | T-Mobile | 9 | |
| Ford | 1 | Taco Bell | 5 | |
| GNC | 3 | The Room Place | 1 | |
| GameStop | 3 | Toyota | 2 | |
| Gap | 1 | Trader Joe's | 2 | |
| Goodwill | 3 | True Value | 1 | |
| H&R Block | 7 | U-Haul | 10 | |
| Hilton | 3 | UPS | 51 | |
| Holiday Inn | 2 | Vans | 2 | |
| Home Depot | 1 | Verizon Wireless | 1 | |
| Honda | 1 | Volkswagen | 1 | |
| Hyatt | 2 | Vons | 7 | |
| Jack In The Box | 4 | Walgreens | 8 | |
| Jamba Juice | 3 | Walmart | 1 | |
| Jones New York | 1 | Wendy's | 3 | |
| KFC | 8 | Whole Foods Market | 1 | |
| Kroger | 5 | YMCA | 4 | |
Strongest AM radio stations in Oakland:
- KTRB (860 AM; 50 kW; MODESTO, CA; Owner: PAPPAS RADIO OF CALIFORNIA, A CALIFORNIA LIMITED PARTNERSHIP)
- KIQI (1010 AM; 35 kW; SAN FRANCISCO, CA; Owner: RADIO UNICA OF SAN FRANCISCO LICENSE CORP.)
- KMZT (1510 AM; 8 kW; SAN RAFAEL, CA; Owner: MOUNT WILSON FM BROADCASTERS, INC.)
- KTCT (1050 AM; 50 kW; SAN MATEO, CA; Owner: SUSQUEHANNA RADIO CORP.)
- KFAX (1100 AM; 50 kW; SAN FRANCISCO, CA; Owner: GOLDEN GATE BROADCASTING CO, INC.)
- KNEW (910 AM; 20 kW; OAKLAND, CA; Owner: AMFM RADIO LICENSES, L.L.C.)
- KFRC (610 AM; 5 kW; SAN FRANCISCO, CA; Owner: INFINITY BROADCASTING CORPORATION OF LOS ANGELES)
- KNBR (680 AM; 50 kW; SAN FRANCISCO, CA; Owner: KNBR LICO, INC.)
- KABL (960 AM; 5 kW; OAKLAND, CA; Owner: AMFM RADIO LICENSES, L.L.C.)
- KGO (810 AM; 50 kW; SAN FRANCISCO, CA; Owner: KGO-AM RADIO, INC.)
- KMKY (1310 AM; 5 kW; OAKLAND, CA; Owner: KGO-AM RADIO, INC.)
- KSFO (560 AM; 5 kW; SAN FRANCISCO, CA; Owner: KGO-AM RADIO, INC.)
- KYCY (1550 AM; 50 kW; SAN FRANCISCO, CA; Owner: INFINITY BROADCASTING OPERATIONS, INC.)
Strongest FM radio stations in Oakland:
- KLLC (97.3 FM; SAN FRANCISCO, CA; Owner: INFINITY BROADCASTING OPERATIONS, INC.)
- KALX (90.7 FM; BERKELEY, CA; Owner: UNIVERSITY OF CALIFORNIA)
- KKSF-FM1 (103.7 FM; PLEASANTON, ETC., CA; Owner: AMFM RADIO LICENSES, L.L.C.)
- KFRC-FM3 (99.7 FM; WALNUT CREEK, CA; Owner: INFINITY KFRC-FM, INC.)
- KZBR-FM1 (95.7 FM; WALNUT CREEK, CA; Owner: BONNEVILLE HOLDING COMPANY)
- KBLX-FM2 (102.9 FM; PLEASANTON, CA; Owner: ICBC BROADCAST HOLDINGS -CA, INC.)
- KSOL-FM3 (98.9 FM; PLEASANTON, CA; Owner: TMS LICENSE CALIFORNIA, INC)
- KISQ-FM3 (98.1 FM; CONCORD, CA; Owner: AMFM RADIO LICENSES, L.L.C.)
- KOIT-FM (96.5 FM; SAN FRANCISCO, CA; Owner: BONNEVILLE HOLDING COMPANY)
- KMEL-FM1 (106.1 FM; CONCORD, CA; Owner: AMFM RADIO LICENSES, L.L.C.)
- KKSF (103.7 FM; SAN FRANCISCO, CA; Owner: AMFM RADIO LICENSES, L.L.C.)
- KFOG (104.5 FM; SAN FRANCISCO, CA; Owner: KFFG LICO, INC)
- KFJO (92.1 FM; WALNUT CREEK, CA; Owner: CHASE RADIO PROPERTIES, L.L.C.)
- KSOL (98.9 FM; SAN FRANCISCO, CA; Owner: TMS LICENSE CALIFORNIA, INC)
- KYLD (94.9 FM; SAN FRANCISCO, CA; Owner: AMFM RADIO LICENSES, L.L.C.)
- KDFC-FM1 (102.1 FM; LAFAYETTE, CA; Owner: BONNEVILLE HOLDING COMPANY)
- KOIT-FM2 (96.5 FM; MARTINEZ, ETC., CA; Owner: BONNEVILLE HOLDING CO. C/O KOIT(FM))
- KFRC-FM (99.7 FM; SAN FRANCISCO, CA; Owner: INFINITY KFRC-FM, INC.)
- KBLX-FM (102.9 FM; BERKELEY, CA; Owner: ICBC BROADCAST HOLDINGS - CA, INC.)
- KZBR (95.7 FM; SAN FRANCISCO, CA; Owner: BONNEVILLE HOLDING COMPANY)
TV broadcast stations around Oakland:
- KQED (Channel 9; SAN FRANCISCO, CA; Owner: KQED, INC.)
- KGO-TV (Channel 7; SAN FRANCISCO, CA; Owner: KGO TELEVISION, INC.)
- KPIX-TV (Channel 5; SAN FRANCISCO, CA; Owner: CBS BROADCASTING INC.)
- KTVU (Channel 2; OAKLAND, CA; Owner: KTVU PARTNERSHIP)
- KRON-TV (Channel 4; SAN FRANCISCO, CA; Owner: YOUNG BROADCASTING OF SAN FRANCISCO, INC.)
- KMTP-TV (Channel 32; SAN FRANCISCO, CA; Owner: MINORITY TELEVISION PROJECT)
- KBHK-TV (Channel 44; SAN FRANCISCO, CA; Owner: VIACOM TELEVISION STATIONS GROUP OF SAN FRANCISCO INC.)
- KBWB (Channel 20; SAN FRANCISCO, CA; Owner: KBWB LICENSE, INC.)
- KFSF (Channel 66; VALLEJO, CA; Owner: TELEFUTURA SAN FRANCISCO LLC)
- KCNS (Channel 38; SAN FRANCISCO, CA; Owner: WRAY, INC.)
- KCSM-TV (Channel 60; SAN MATEO, CA; Owner: SAN MATEO COUNTY COMMUNITY COLLEGE DISTRICT)
- KOVR (Channel 13; STOCKTON, CA; Owner: SCI - SACRAMENTO LICENSEE, LLC)
- KXTV (Channel 10; SACRAMENTO, CA; Owner: KXTV, INC.)
- KSPX (Channel 29; SACRAMENTO, CA; Owner: PAXSON SACRAMENTO LICENSE, INC.)
- KCRA-TV (Channel 3; SACRAMENTO, CA; Owner: KCRA HEARST-ARGYLE TELEVISION, INC.)
- KTXL (Channel 40; SACRAMENTO, CA; Owner: CHANNEL 40, INC.)
- KUVS (Channel 19; MODESTO, CA; Owner: KUVS LICENSE PARTNERSHIP, G.P.)
- KQCA (Channel 58; STOCKTON, CA; Owner: KCRA HEARST-ARGYLE TELEVISION, INC.)
- KVIE (Channel 6; SACRAMENTO, CA; Owner: KVIE, INC.)
- KMAX-TV (Channel 31; SACRAMENTO, CA; Owner: UPN STATIONS GROUP INC.)
- KTNC-TV (Channel 42; CONCORD, CA; Owner: KTNC LICENSE, LLC)
- KBIT-CA (Channel 28; SAN FRANCISCO, ETC., CA; Owner: POLAR BROADCASTING, INC.)
- KTSF (Channel 26; SAN FRANCISCO, CA; Owner: LINCOLN BROADCASTING COMPANY, A CALIFORNIA LP)
- KICU-TV (Channel 36; SAN JOSE, CA; Owner: KTVU PARTNERSHIP)
- KTEH (Channel 54; SAN JOSE, CA; Owner: KTEH FOUNDATION)
Medal of Honor Recipients
Medal of Honor Recipient born in Oakland: David C. Waybur.
- National Bridge Inventory (NBI) Statistics
- 538Number of bridges
- 12,913ft / 3,936mTotal length
- $103,067,000Total costs
- 27,471,529Total average daily traffic
- 982,540Total average daily truck traffic
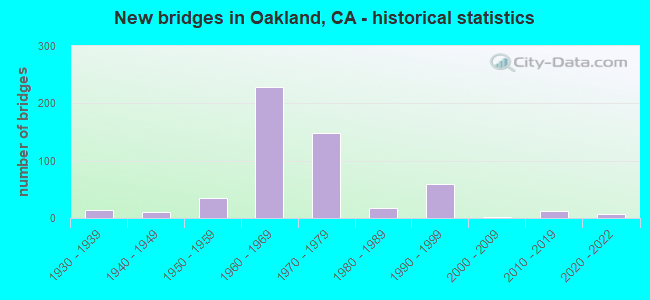
- New bridges - historical statistics
- 11900-1909
- 11910-1919
- 21920-1929
- 141930-1939
- 101940-1949
- 351950-1959
- 2281960-1969
- 1491970-1979
- 181980-1989
- 601990-1999
- 12000-2009
- 122010-2019
- 72020-2022
FCC Registered Commercial Land Mobile Towers: 8 (See the full list of FCC Registered Commercial Land Mobile Towers in Oakland, CA)
FCC Registered Private Land Mobile Towers: 38 (See the full list of FCC Registered Private Land Mobile Towers)
FCC Registered Broadcast Land Mobile Towers: 274 (See the full list of FCC Registered Broadcast Land Mobile Towers)
FCC Registered Microwave Towers: 417 (See the full list of FCC Registered Microwave Towers in this town)
FCC Registered Paging Towers: 43 (See the full list of FCC Registered Paging Towers)
FCC Registered Maritime Coast & Aviation Ground Towers: 53 (See the full list of FCC Registered Maritime Coast & Aviation Ground Towers)
FCC Registered Amateur Radio Licenses: 1,436 (See the full list of FCC Registered Amateur Radio Licenses in Oakland)
FAA Registered Aircraft Manufacturers and Dealers: 2 (See the full list of FAA Registered Manufacturers and Dealers in Oakland)
FAA Registered Aircraft: 154 (See the full list of FAA Registered Aircraft)
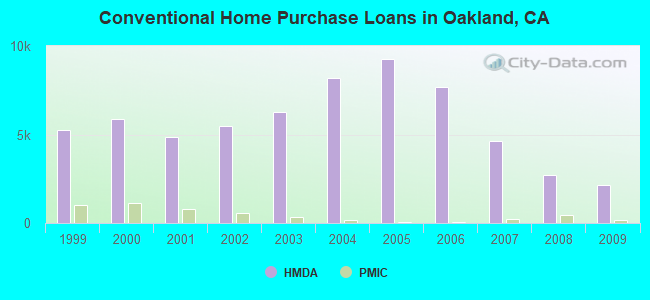
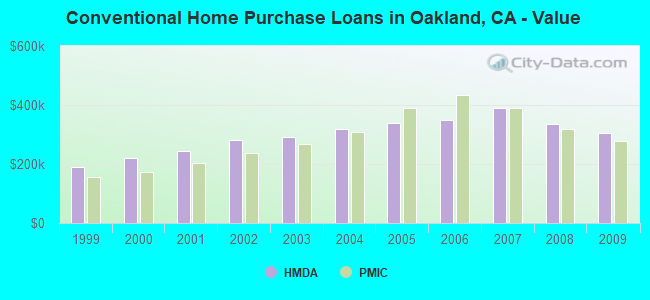
| Home Mortgage Disclosure Act Aggregated Statistics For Year 2009 (Based on 108 full tracts) | ||||||||||||||
| A) FHA, FSA/RHS & VA Home Purchase Loans | B) Conventional Home Purchase Loans | C) Refinancings | D) Home Improvement Loans | E) Loans on Dwellings For 5+ Families | F) Non-occupant Loans on < 5 Family Dwellings (A B C & D) | G) Loans On Manufactured Home Dwelling (A B C & D) | ||||||||
|---|---|---|---|---|---|---|---|---|---|---|---|---|---|---|
| Number | Average Value | Number | Average Value | Number | Average Value | Number | Average Value | Number | Average Value | Number | Average Value | Number | Average Value | |
| LOANS ORIGINATED | 946 | $274,092 | 2,154 | $304,504 | 6,479 | $367,649 | 270 | $253,889 | 52 | $2,025,173 | 740 | $218,756 | 4 | $187,750 |
| APPLICATIONS APPROVED, NOT ACCEPTED | 107 | $267,616 | 328 | $293,116 | 843 | $375,848 | 36 | $148,781 | 6 | $636,500 | 139 | $221,016 | 1 | $131,000 |
| APPLICATIONS DENIED | 280 | $245,480 | 700 | $234,814 | 2,662 | $352,446 | 174 | $162,748 | 34 | $618,912 | 477 | $215,631 | 5 | $163,800 |
| APPLICATIONS WITHDRAWN | 205 | $248,626 | 409 | $256,017 | 1,273 | $350,486 | 92 | $230,938 | 13 | $3,458,846 | 190 | $211,812 | 0 | $0 |
| FILES CLOSED FOR INCOMPLETENESS | 51 | $257,797 | 103 | $250,592 | 467 | $339,189 | 39 | $213,359 | 1 | $1,400,000 | 59 | $232,180 | 1 | $16,000 |
Detailed mortgage data for all 108 tracts in Oakland, CA
| Private Mortgage Insurance Companies Aggregated Statistics For Year 2009 (Based on 90 full tracts) | ||||||
| A) Conventional Home Purchase Loans | B) Refinancings | C) Non-occupant Loans on < 5 Family Dwellings (A & B) | ||||
|---|---|---|---|---|---|---|
| Number | Average Value | Number | Average Value | Number | Average Value | |
| LOANS ORIGINATED | 193 | $277,940 | 27 | $408,370 | 0 | $0 |
| APPLICATIONS APPROVED, NOT ACCEPTED | 104 | $279,214 | 24 | $392,917 | 0 | $0 |
| APPLICATIONS DENIED | 49 | $259,203 | 9 | $431,444 | 1 | $68,000 |
| APPLICATIONS WITHDRAWN | 20 | $264,750 | 4 | $225,000 | 0 | $0 |
| FILES CLOSED FOR INCOMPLETENESS | 9 | $321,416 | 2 | $642,500 | 0 | $0 |
2005 - 2018 National Fire Incident Reporting System (NFIRS) incidents
- Fire incident types reported to NFIRS in Oakland, CA
- 4,85040.0%Outside Fires
- 3,60529.8%Structure Fires
- 3,25326.9%Mobile Property/Vehicle Fires
- 4053.3%Other
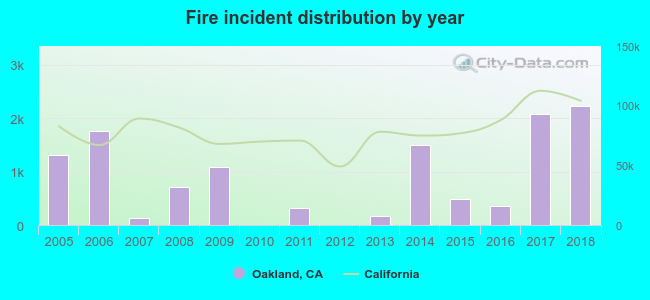 According to the data from the years 2005 - 2018 the average number of fire incidents per year is 865. The highest number of fire incidents - 2,233 took place in 2018, and the least - 2 in 2012. The data has a rising trend.
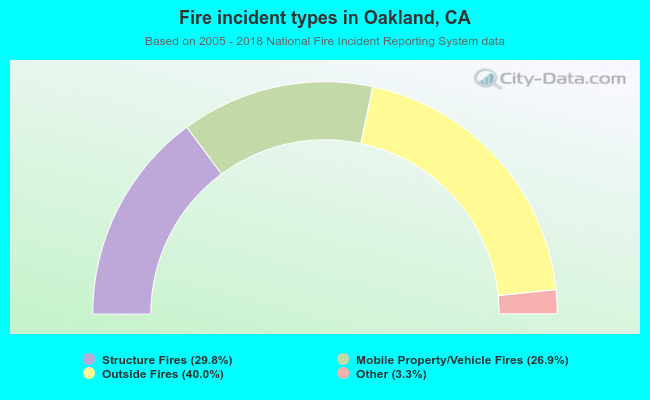 When looking into fire subcategories, the most incidents belonged to: Outside Fires (40.0%), and Structure Fires (29.8%).
Fire-safe hotels and motels in Oakland, California:
- Washington Inn, 495 10TH St, Oakland, California 94607 , Phone: (510) 452-1776, Fax: (510) 452-4436
- La Quinta Inn Oakland, 8465 Enterprise Way, Oakland, California 94621 , Phone: (510) 632-8900, Fax: (510) 632-4713
- Quality Inn, 8471 Enterprise Way, Oakland, California 94621 , Phone: (510) 562-4888, Fax: (510) 562-2077
- Executive Inn & Suites Embarcadero Cove, 1755 Embarcadero, Oakland, California 94606 , Phone: (510) 536-6633, Fax: (510) 536-6006
- Clarion Hotel Oakland Airport, 500 Hegenberger Rd, Oakland, California 94621 , Phone: (510) 562-5311, Fax: (510) 636-1539
- Oakland Marriott City CTR, 1001 Broadway, Oakland, California 94607 , Phone: (510) 451-4000, Fax: (510) 446-6491
- Red Lion Hotel Oakland International Airport, 150 Hegenberger Rd, Oakland, California 94621 , Phone: (510) 635-5300, Fax: (510) 635-9661
- Waterfront Plaza Hotel, 10 Washington St, Oakland, California 94607 , Phone: (510) 836-3800, Fax: (510) 832-6228
- 15 other hotels and motels
| Most common first names in Oakland, CA among deceased individuals | ||
| Name | Count | Lived (average) |
|---|---|---|
| John | 2,510 | 74.1 years |
| Mary | 2,127 | 79.9 years |
| William | 1,918 | 74.6 years |
| James | 1,714 | 70.7 years |
| Robert | 1,469 | 70.5 years |
| George | 1,350 | 75.7 years |
| Charles | 1,217 | 71.9 years |
| Joseph | 1,092 | 75.1 years |
| Frank | 989 | 76.1 years |
| Helen | 978 | 79.5 years |
| Most common last names in Oakland, CA among deceased individuals | ||
| Last name | Count | Lived (average) |
|---|---|---|
| Johnson | 1,165 | 73.3 years |
| Smith | 1,155 | 74.0 years |
| Williams | 1,154 | 73.6 years |
| Jones | 771 | 72.4 years |
| Brown | 719 | 73.9 years |
| Jackson | 593 | 71.6 years |
| Davis | 567 | 71.8 years |
| Lee | 557 | 76.3 years |
| Thomas | 490 | 72.8 years |
| Anderson | 453 | 75.7 years |
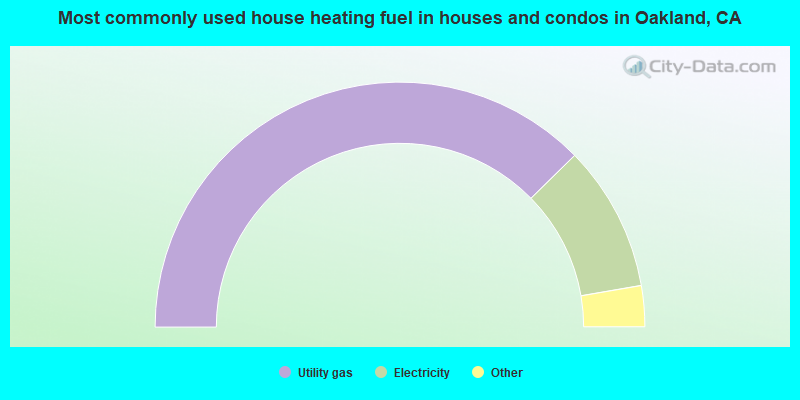
- 75.3%Utility gas
- 19.3%Electricity
- 2.3%No fuel used
- 1.6%Solar energy
- 1.1%Bottled, tank, or LP gas
- 0.2%Fuel oil, kerosene, etc.
- 0.2%Wood
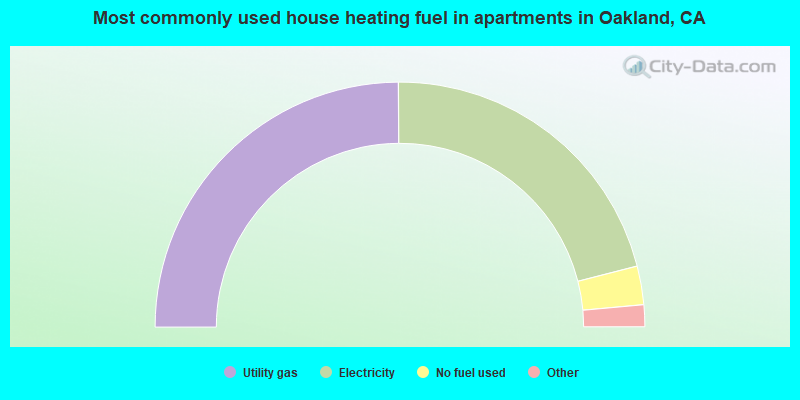
- 49.8%Utility gas
- 42.2%Electricity
- 5.1%No fuel used
- 1.8%Bottled, tank, or LP gas
- 0.5%Other fuel
- 0.3%Solar energy
- 0.2%Fuel oil, kerosene, etc.
Oakland compared to California state average:
- Unemployed percentage significantly below state average.
- Black race population percentage significantly above state average.
- Median age above state average.
- House age above state average.
- Percentage of population with a bachelor's degree or higher above state average.
Oakland, CA compared to other similar cities:
Oakland on our top lists:
- #1 on the list of "Top 101 cities with the highest number of robberies per 100,000 residents, excludes tourist destinations and others with a lot of outsiders visiting based on city industries data (population 50,000+)"
- #2 on the list of "Top 101 cities with the largest percentage of likely lesbian couples (counted as self-reported female-female unmarried-partner households) (population 50,000+)"
- #3 on the list of "Top 101 cities with the highest number of auto thefts per 100,000 residents, excludes tourist destinations and others with a lot of outsiders visiting based on city industries data (population 50,000+)"
- #3 on the list of "Top 101 cities with the highest city-data.com crime index, excludes tourist destinations and others with a lot of outsiders visiting based on city industries data (population 50,000+)"
- #4 on the list of "Top 100 least-safe cities (highest city-data.com crime index) (pop. 50,000+)"
- #5 on the list of "Top 101 cities with the largest percentage of likely homosexual households (counted as self-reported same-sex unmarried-partner households) (population 50,000+)"
- #5 on the list of "Top 101 cities with the largest city-data.com crime index per police officer (population 50,000+)"
- #5 on the list of "Top 100 most racially diverse cities (pop. 50,000+)"
- #13 on the list of "Top 101 cities with the largest city-data.com crime index increase from 2011 to 2012 (population 50,000+)"
- #14 on the list of "Top 101 cities with the highest number of murders per 100,000 residents, excludes tourist destinations and others with a lot of outsiders visiting based on city industries data (population 50,000+)"
- #14 on the list of "Top 101 cities with the largest percentage of likely gay men couples (counted as self-reported male-male unmarried-partner households) (population 50,000+)"
- #15 on the list of "Top 101 cities with the largest city-data.com crime index increase from 2002 to 2012 (population 50,000+)"
- #24 on the list of "Top 101 cities with the highest number of assaults per 100,000 residents, excludes tourist destinations and others with a lot of outsiders visiting based on city industries data (population 50,000+)"
- #26 on the list of "Top 101 cities with the most people taking subway or elevated to work (population 5,000+)"
- #31 on the list of "Top 101 cities with largest percentage of females in occupations: legal occupations (population 50,000+)"
- #36 on the list of "Top 101 cities with the largest humidity differences during a year (population 50,000+)"
- #36 on the list of "Top 101 cities with the largest differences between morning and afternoon humidity (population 50,000+)"
- #42 on the list of "Top 100 cities with highest ratio of median house value to median household income (pop. 50,000+)"
- #42 on the list of "Top 101 cities with the most mentions on city-data.com forum"
- #43 on the list of "Top 101 cities with the highest maximum monthly sunshine amount (population 50,000+)"
- #40 (94621) on the list of "Top 101 zip codes with the largest percentage of Arab first ancestries"
- #52 (94612) on the list of "Top 101 zip codes with the most offices of lawyers in 2005"
- #60 (94607) on the list of "Top 101 zip codes with the most full service restaurants in 2005"
- #11 on the list of "Top 101 counties with the lowest Ozone (1-hour) air pollution readings in 2012 (ppm)"
- #17 on the list of "Top 101 counties with highest percentage of residents voting for Obama (Democrat) in the 2012 Presidential Election (pop. 50,000+)"
- #18 on the list of "Top 101 counties with the most Other congregations"
- #21 on the list of "Top 101 counties with the highest surface withdrawal of fresh water for public supply (pop. 50,000+)"
- #22 on the list of "Top 101 counties with the highest percentage of residents that exercised in the past month"

|
|
Total of 9400 patent applications in 2008-2024.