Estimated zip code population in 2022: 32,134 Zip code population in 2010: 29,287 Zip code population in 2000: 29,963
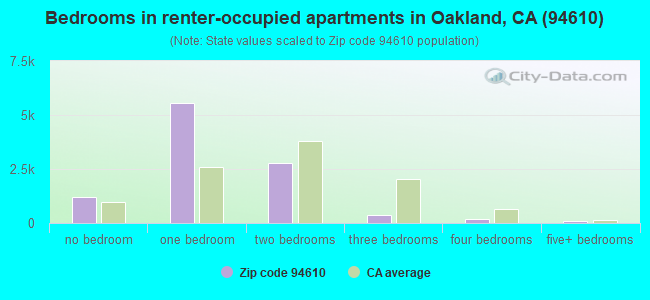
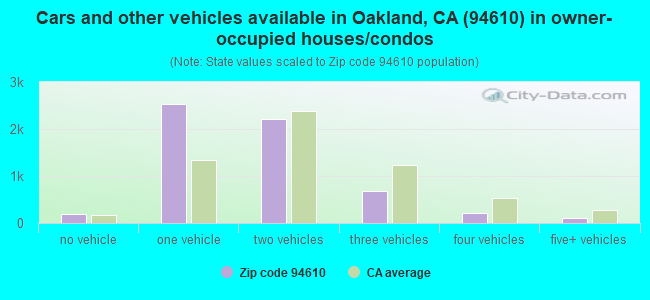
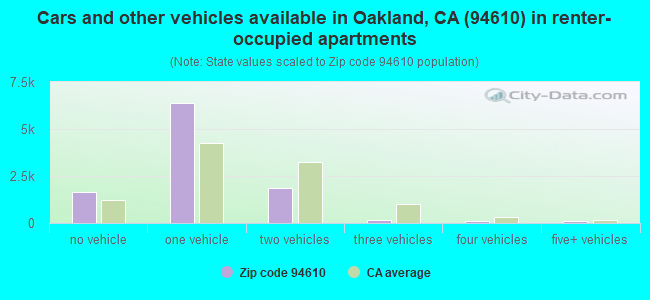
Houses and condos: 17,770 Renter-occupied apartments: 10,197
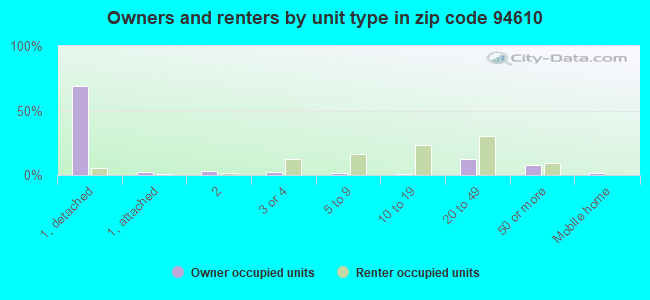
% of renters here:
63%
State:
44%
March 2022 cost of living index in zip code 94610: 122.9 (high, U.S. average is 100)
Land area: 2.2 sq. mi. Water area: 0.2 sq. mi.
Population density: 14,720 people per square mile
(very high).
OSM Map
General Map
Google Map
MSN Map
OSM Map
General Map
Google Map
MSN Map
OSM Map
General Map
Google Map
MSN Map
OSM Map
General Map
Google Map
MSN Map
Please wait while loading the map...
Real estate property taxes paid for housing units in 2022:
This zip code:
0.7% ($9,755)
California:
0.7% ($4,831)
Median real estate property taxes paid for housing units with mortgages in 2022: $10,330 (0.7%) Median real estate property taxes paid for housing units with no mortgage in 2022: $7,562 (0.6%)
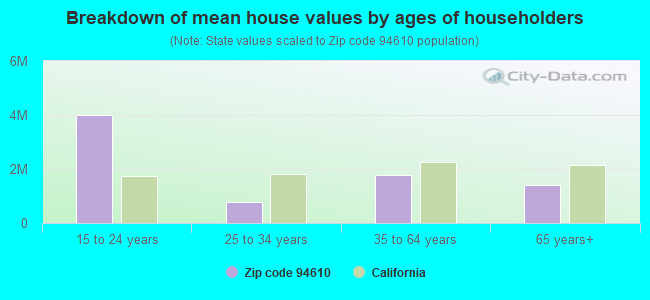
Estimated median house/condo value in 2022: $1,466,547
94610:
$1,466,547
California:
$715,900
According to our research of California and other state lists, there were 30 registered sex offenders living in 94610 zip code as of April 27, 2024. The ratio of all residents to sex offenders in zip code 94610 is 1,065 to 1. The ratio of registered sex offenders to all residents in this zip code is lower than the state average.
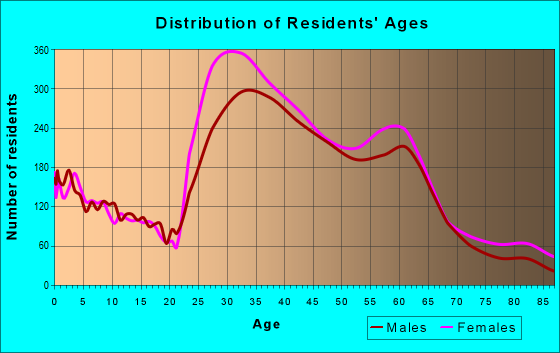
Median resident age:
This zip code:
39.4 years
California median age:
37.9 years
Average household size:
This zip code:
2.0 people
California:
2.8 people
Averages for the 2020 tax year for zip code 94610, filed in 2021:
Average Adjusted Gross Income (AGI) in 2020: $159,252 (Individual Income Tax Returns)
Here:
$159,252
State:
$95,910
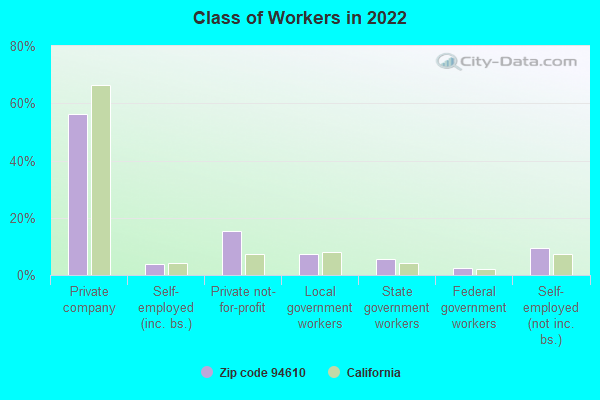
Salary/wage: $135,716 (reported on 78.9% of returns)
Here:
$135,716
State:
$77,331
(% of AGI for various income ranges: 1109.3% for AGIs below $25k, 3946.3% for AGIs $25k-50k, 7549.6% for AGIs $50k-75k, 11351.6% for AGIs $75k-100k, 20298.8% for AGIs $100k-200k, 146434.3% for AGIs over 200k)
Taxable interest for individuals: $2,343 (reported on 47.7% of returns)
This zip code:
$2,343
California:
$2,294
(% of AGI for various income ranges: 34.9% for AGIs below $25k, 40.4% for AGIs $25k-50k, 42.5% for AGIs $50k-75k, 74.0% for AGIs $75k-100k, 168.6% for AGIs $100k-200k, 1741.5% for AGIs over 200k)
Ordinary dividends: $11,339 (reported on 40.0% of returns)
Here:
$11,339
State:
$10,949
(% of AGI for various income ranges: 105.1% for AGIs below $25k, 138.7% for AGIs $25k-50k, 166.1% for AGIs $50k-75k, 280.4% for AGIs $75k-100k, 784.2% for AGIs $100k-200k, 6987.2% for AGIs over 200k)
Net capital gain/loss in AGI: +$49,066 (reported on 37.7% of returns)
Here:
+$49,066
State:
+$49,306
(% of AGI for various income ranges: 63.9% for AGIs below $25k, 114.6% for AGIs $25k-50k, 127.8% for AGIs $50k-75k, 314.5% for AGIs $75k-100k, 1055.2% for AGIs $100k-200k, 38255.5% for AGIs over 200k)
Profit/loss from business: +$25,735 (reported on 22.2% of returns)
Here:
+$25,735
State:
+$15,671
(% of AGI for various income ranges: 288.7% for AGIs below $25k, 514.0% for AGIs $25k-50k, 388.7% for AGIs $50k-75k, 580.2% for AGIs $75k-100k, 1040.2% for AGIs $100k-200k, 6874.9% for AGIs over 200k)
Taxable individual retirement arrangement distribution: $27,122 (reported on 9.4% of returns)
94610:
$27,122
California:
$23,505
(% of AGI for various income ranges: 84.5% for AGIs below $25k, 115.9% for AGIs $25k-50k, 212.6% for AGIs $50k-75k, 281.6% for AGIs $75k-100k, 692.6% for AGIs $100k-200k, 2692.4% for AGIs over 200k)
Self-employed (Keogh) retirement plans: $32,800 (reported on 3.1% of returns)
94610:
$32,800
California:
$30,163
(% of AGI for various income ranges: 18.4% for AGIs $25k-50k, 24.0% for AGIs $50k-75k, 48.8% for AGIs $75k-100k, 146.7% for AGIs $100k-200k, 1736.7% for AGIs over 200k)
Total itemized deductions: $42,043 (reported on 21.5% of returns)
Here:
$42,043
State:
$39,517
(% of AGI for various income ranges: 195.7% for AGIs below $25k, 233.4% for AGIs $25k-50k, 372.5% for AGIs $50k-75k, 717.0% for AGIs $75k-100k, 1757.8% for AGIs $100k-200k, 13208.5% for AGIs over 200k)
Charity contributions: $15,591 (reported on 18.5% of returns)
Here:
$15,591
State:
$12,598
(% of AGI for various income ranges: 10.7% for AGIs below $25k, 16.7% for AGIs $25k-50k, 40.1% for AGIs $50k-75k, 127.5% for AGIs $75k-100k, 306.5% for AGIs $100k-200k, 5428.4% for AGIs over 200k)
Taxes paid: $9,154 (reported on 21.5% of returns)
94610:
$9,154
State:
$8,807
(% of AGI for various income ranges: 42.8% for AGIs below $25k, 46.6% for AGIs $25k-50k, 104.3% for AGIs $50k-75k, 213.7% for AGIs $75k-100k, 527.4% for AGIs $100k-200k, 2378.1% for AGIs over 200k)
Earned income credit: $1,299 (reported on 5.6% of returns)
Here:
$1,299
State:
$2,074
(% of AGI for various income ranges: 49.2% for AGIs below $25k, 26.3% for AGIs $25k-50k)
Percentage of individuals using paid preparers for their 2020 taxes: 91.7%
Here:
92%
State:
92%
(% for various income ranges: 87.6% for AGIs below $25k, 90.4% for AGIs $25k-50k, 92.0% for AGIs $50k-75k, 92.7% for AGIs $75k-100k, 92.5% for AGIs $100k-200k, 95.1% for AGIs over 200k)
Averages for the 2012 tax year for zip code 94610, filed in 2013:
Average Adjusted Gross Income (AGI) in 2012: $104,686 (Individual Income Tax Returns)
Here:
$104,686
State:
$72,726
Salary/wage: $83,943 (reported on 81.2% of returns)
Here:
$83,943
State:
$59,079
(% of AGI for various income ranges: 66.5% for AGIs below $25k, 79.5% for AGIs $25k-50k, 80.5% for AGIs $50k-75k, 77.9% for AGIs $75k-100k, 73.5% for AGIs $100k-200k, 54.1% for AGIs over 200k)
Taxable interest for individuals: $1,715 (reported on 43.7% of returns)
This zip code:
$1,715
California:
$2,146
(% of AGI for various income ranges: 1.3% for AGIs below $25k, 0.7% for AGIs $25k-50k, 0.6% for AGIs $50k-75k, 0.7% for AGIs $75k-100k, 0.7% for AGIs $100k-200k, 0.7% for AGIs over 200k)
Ordinary dividends: $10,994 (reported on 31.0% of returns)
Here:
$10,994
State:
$9,308
(% of AGI for various income ranges: 3.7% for AGIs below $25k, 1.7% for AGIs $25k-50k, 1.8% for AGIs $50k-75k, 2.1% for AGIs $75k-100k, 2.8% for AGIs $100k-200k, 4.2% for AGIs over 200k)
Net capital gain/loss in AGI: +$21,542 (reported on 26.8% of returns)
Here:
+$21,542
State:
+$30,460
(% of AGI for various income ranges: 0.4% for AGIs below $25k, 0.4% for AGIs $25k-50k, 0.6% for AGIs $50k-75k, 0.9% for AGIs $75k-100k, 2.1% for AGIs $100k-200k, 9.7% for AGIs over 200k)
Profit/loss from business: +$23,951 (reported on 22.7% of returns)
Here:
+$23,951
State:
+$17,064
(% of AGI for various income ranges: 16.5% for AGIs below $25k, 7.4% for AGIs $25k-50k, 4.9% for AGIs $50k-75k, 4.6% for AGIs $75k-100k, 5.9% for AGIs $100k-200k, 4.1% for AGIs over 200k)
Taxable individual retirement arrangement distribution: $20,770 (reported on 9.1% of returns)
94610:
$20,770
California:
$19,557
(% of AGI for various income ranges: 3.2% for AGIs below $25k, 1.6% for AGIs $25k-50k, 1.9% for AGIs $50k-75k, 2.3% for AGIs $75k-100k, 2.8% for AGIs $100k-200k, 1.3% for AGIs over 200k)
Self-employment retirement plans: $23,298 (reported on 3.3% of returns)
94610:
$23,298
California:
$24,530
(% of AGI for various income ranges: 0.3% for AGIs $25k-50k, 0.2% for AGIs $50k-75k, 0.4% for AGIs $75k-100k, 0.7% for AGIs $100k-200k, 1.0% for AGIs over 200k)
Total itemized deductions: $37,982 (19% of AGI, reported on 40.0% of returns)
Here:
$37,982
State:
$34,004
Here:
18.8% of AGI
State:
22.7% of AGI
(% of AGI for various income ranges: 14.5% for AGIs below $25k, 8.6% for AGIs $25k-50k, 9.4% for AGIs $50k-75k, 13.6% for AGIs $75k-100k, 18.6% for AGIs $100k-200k, 15.1% for AGIs over 200k)
Charity contributions: $4,989 (reported on 32.9% of returns)
Here:
$4,989
State:
$4,659
(% of AGI for various income ranges: 0.8% for AGIs below $25k, 0.8% for AGIs $25k-50k, 1.1% for AGIs $50k-75k, 1.3% for AGIs $75k-100k, 1.8% for AGIs $100k-200k, 1.8% for AGIs over 200k)
Taxes paid: $19,680 (reported on 39.9% of returns)
94610:
$19,680
State:
$14,448
(% of AGI for various income ranges: 2.7% for AGIs below $25k, 2.0% for AGIs $25k-50k, 3.1% for AGIs $50k-75k, 5.9% for AGIs $75k-100k, 8.6% for AGIs $100k-200k, 9.4% for AGIs over 200k)
Earned income credit: $1,232 (reported on 8.9% of returns)
Here:
$1,232
State:
$2,286
(% of AGI for various income ranges: 2.9% for AGIs below $25k, 0.2% for AGIs $25k-50k)
Percentage of individuals using paid preparers for their 2012 taxes: 45.9%
Here:
46%
State:
64%
(% for various income ranges: 41.3% for AGIs below $25k, 38.9% for AGIs $25k-50k, 40.3% for AGIs $50k-75k, 47.3% for AGIs $75k-100k, 56.2% for AGIs $100k-200k, 69.0% for AGIs over 200k)
Averages for the 2004 tax year for zip code 94610, filed in 2005:
Average Adjusted Gross Income (AGI) in 2004: $74,081 (Individual Income Tax Returns)
Here:
$74,081
State:
$58,600
Salary/wage: $63,686 (reported on 81.2% of returns)
Here:
$63,686
State:
$49,455
(% of AGI for various income ranges: 679.8% for AGIs below $10k, 70.6% for AGIs $10k-25k, 83.0% for AGIs $25k-50k, 81.8% for AGIs $50k-75k, 79.1% for AGIs $75k-100k, 61.3% for AGIs over 100k)
Taxable interest for individuals: $2,270 (reported on 52.4% of returns)
This zip code:
$2,270
California:
$2,365
(% of AGI for various income ranges: 62.1% for AGIs below $10k, 3.1% for AGIs $10k-25k, 1.4% for AGIs $25k-50k, 1.2% for AGIs $50k-75k, 1.6% for AGIs $75k-100k, 1.5% for AGIs over 100k)
Taxable dividends: $5,255 (reported on 35.5% of returns)
Here:
$5,255
State:
$4,746
(% of AGI for various income ranges: 79.3% for AGIs below $10k, 3.0% for AGIs $10k-25k, 1.7% for AGIs $25k-50k, 1.7% for AGIs $50k-75k, 2.1% for AGIs $75k-100k, 2.8% for AGIs over 100k)
Net capital gain/loss: +$19,693 (reported on 30.0% of returns)
Here:
+$19,693
State:
+$23,418
(% of AGI for various income ranges: -13.0% for AGIs below $10k, 1.3% for AGIs $10k-25k, 0.5% for AGIs $25k-50k, 0.8% for AGIs $50k-75k, 1.6% for AGIs $75k-100k, 12.9% for AGIs over 100k)
Profit/loss from business: +$22,178 (reported on 21.1% of returns)
Here:
+$22,178
State:
+$16,826
(% of AGI for various income ranges: 89.6% for AGIs below $10k, 10.7% for AGIs $10k-25k, 5.8% for AGIs $25k-50k, 4.3% for AGIs $50k-75k, 4.9% for AGIs $75k-100k, 6.7% for AGIs over 100k)
IRA payment deduction: $2,923 (reported on 3.5% of returns)
94610:
$2,923
California:
$3,192
(% of AGI for various income ranges: 4.1% for AGIs below $10k, 0.4% for AGIs $10k-25k, 0.3% for AGIs $25k-50k, 0.2% for AGIs $50k-75k, 0.2% for AGIs $75k-100k, 0.1% for AGIs over 100k)
Self-employed pension: $19,338 (reported on 3.9% of returns)
Here:
$19,338
California:
$17,688
(% of AGI for various income ranges: 0.4% for AGIs $10k-25k, 0.3% for AGIs $25k-50k, 0.4% for AGIs $50k-75k, 0.5% for AGIs $75k-100k, 1.4% for AGIs over 100k)
Total itemized deductions: $29,278 (21% of AGI, reported on 41.0% of returns)
Here:
$29,278
State:
$28,113
Here:
21.4% of AGI
State:
25.3% of AGI
(% of AGI for various income ranges: 161.3% for AGIs below $10k, 13.7% for AGIs $10k-25k, 10.5% for AGIs $25k-50k, 14.8% for AGIs $50k-75k, 19.3% for AGIs $75k-100k, 17.3% for AGIs over 100k)
Charity contributions deductions: $4,089 (3% of AGI, reported on 36.1% of returns)
Here:
$4,089
State:
$3,923
Here:
2.8% of AGI
State:
3.3% of AGI
(% of AGI for various income ranges: 6.2% for AGIs below $10k, 1.2% for AGIs $10k-25k, 1.3% for AGIs $25k-50k, 1.7% for AGIs $50k-75k, 2.2% for AGIs $75k-100k, 2.2% for AGIs over 100k)
Total tax: $14,280 (reported on 86.3% of returns)
94610:
$14,280
State:
$10,761
(% of AGI for various income ranges: 34.7% for AGIs below $10k, 6.0% for AGIs $10k-25k, 9.9% for AGIs $25k-50k, 12.7% for AGIs $50k-75k, 13.3% for AGIs $75k-100k, 20.3% for AGIs over 100k)
Earned income credit: $1,070 (reported on 7.4% of returns)
Here:
$1,070
State:
$1,763
Percentage of individuals using paid preparers for their 2004 taxes: 50.6%
Here:
51%
State:
66%
(% for various income ranges: 49.2% for AGIs below $10k, 49.2% for AGIs $10k-25k, 43.3% for AGIs $25k-50k, 47.4% for AGIs $50k-75k, 54.2% for AGIs $75k-100k, 66.1% for AGIs over 100k)
Likely homosexual households (counted as self-reported same-sex unmarried-partner households)
Lesbian couples: 0.8% of all households
Gay men: 0.6% of all households
Household received Food Stamps/SNAP in the past 12 months: 601 Household did not receive Food Stamps/SNAP in the past 12 months: 15,194
Women who had a birth in the past 12 months: 239 (173 now married, 66 unmarried) Women who did not have a birth in the past 12 months: 9,220 (3,059 now married, 6,185 unmarried)
Housing units in zip code 94610 with a mortgage: 4,105 (565 second mortgage, 542 both second mortgage and home equity loan) Houses without a mortgage: 35
Median monthly owner costs for units with a mortgage: $3,876 Median monthly owner costs for units without a mortgage: $1,219
Residents with income below the poverty level in 2022:
This zip code:
8.1%
Whole state:
12.2%
Residents with income below 50% of the poverty level in 2022:
This zip code:
4.1%
Whole state:
6.2%
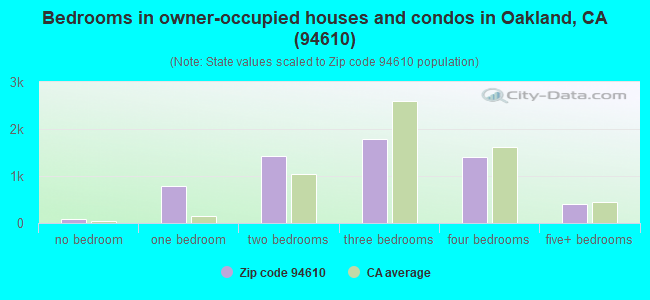
Median number of rooms in houses and condos:
Here:
6.3
State:
6.0
Median number of rooms in apartments:
Here:
3.2
State:
3.9
Notable locations in this zip code not listed on our city pages
Notable locations in zip code 94610: Lakeview Branch Oakland Public Library (A), Veterans Memorial Building (B), Oakland Fire Department Station 10 (C). Display/hide their locations on the map
Churches in zip code 94610 include: Grand Avenue Alliance Church (A), Lake Shore Baptist Church (B), Our Lady of Lourdes Roman Catholic Church (C), Saint Margarets Roman Catholic Church (D), Saint Stephens Methodist Church (E), Saint Vartans Armenian Apostolic Church (F), Temple Beth Jacob (G), Trinity Evangelical Lutheran Church (H), Grand Avenue Seventh Day Adventist Church (I). Display/hide their locations on the map
Parks in zip code 94610 include: Live Oak Memorial Pool (1), Municipal Rose Garden (2), Davie Stadium (3), Lake Merritt Park (4), Mandana Plaza (5), Lakeside Park (6). Display/hide their locations on the map
Tourist attraction (not listed on the city page) : Autumn Moon Cafe (3909 Grand Avenue).
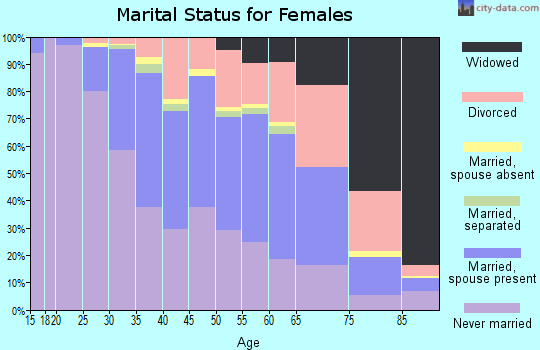
3,269 married couples with children.
943 single-parent households (239 men, 704 women).
76.5% of residents of 94610 zip code speak English at home.
6.5% of residents speak Spanish at home (91% very well, 5% well, 4% not well).
4.2% of residents speak other Indo-European language at home (89% very well, 10% well, 1% not well).
8.8% of residents speak Asian or Pacific Island language at home (57% very well, 29% well, 9% not well, 5% not at all).
3.8% of residents speak other language at home (80% very well, 20% well, 1% not well).
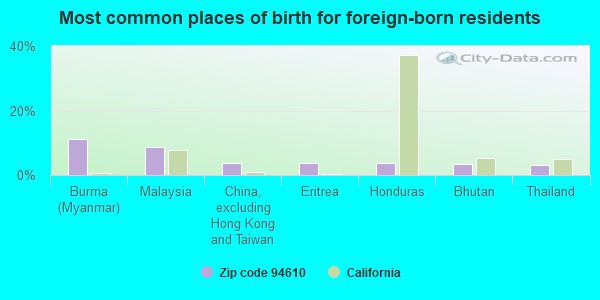
Foreign born population: 5,524 (17.2%) (68.5% of them are naturalized citizens)
Facilities with environmental interests located in this zip code:
EQUILON ENTERPRISES (29 WILDWOOD in PIEDMONT, CA) . Federal Facility
STATE MASTER (California - Hazardous Waste Tracking) - HAZARDOU WASTE PROGRAM Small Quantity Generators, between 100 kg and 1000 kg of hazardous waste/month (Resource Conservation and Recovery Act (tracking hazardous waste)) - notification Organizations: EQUILON ENTERPRISES, LLC (CONTACT/OWNER)
Alternative names: SHELL OIL CO
MARYS CLEANERS (3425 LAKESHORE AVE in OAKLAND, CA)
STATE MASTER (California - Hazardous Waste Tracking) - HAZARDOU WASTE PROGRAM CRITERIA AND HAZARDOUS AIR POLLUTANT INVENTORY (Inventory of air pollution sources) Small Quantity Generators, between 100 kg and 1000 kg of hazardous waste/month (Resource Conservation and Recovery Act (tracking hazardous waste)) Business SIC classification: DRYCLEANING PLANTS, EXCEPT RUG CLEANING
NORGE VILLAGE (3908 GRAND AVENUE in OAKLAND, CA)
STATE MASTER (California - Hazardous Waste Tracking) - HAZARDOU WASTE PROGRAM CRITERIA AND HAZARDOUS AIR POLLUTANT INVENTORY (Inventory of air pollution sources) Small Quantity Generators, between 100 kg and 1000 kg of hazardous waste/month (Resource Conservation and Recovery Act (tracking hazardous waste)) Business SIC classification: DRYCLEANING PLANTS, EXCEPT RUG CLEANING
CHEVRON STATION 90121 (3026 LAKESHORE AVE in OAKLAND, CA)
STATE MASTER (California - Hazardous Waste Tracking) - HAZARDOU WASTE PROGRAM Small Quantity Generators, between 100 kg and 1000 kg of hazardous waste/month (Resource Conservation and Recovery Act (tracking hazardous waste)) - notification Organizations: CHEVRON PRODUCTS CO (CONTACT/OWNER)
LAKEVIEW ELEMENTARY (746 GRAND AVE. in OAKLAND, CA)
(National Center for Education Statistics) - STATE ID-6001986 Organizations: OAKLAND UNIFIED (SCHOOL DISTRICT)
CHEVRON SERV STA #0121 (LAKESHORE & MCARTHUR in OAKLAND, CA)
(Resource Conservation and Recovery Act (tracking hazardous waste)) Organizations: CHEVRON USA INC (CONTACT/OWNER)
CARSONS MARTINIZING (3250 GRAND AVENUE in OAKLAND, CA)
CRITERIA AND HAZARDOUS AIR POLLUTANT INVENTORY (Inventory of air pollution sources) Small Quantity Generators, between 100 kg and 1000 kg of hazardous waste/month (Resource Conservation and Recovery Act (tracking hazardous waste)) - notification Business SIC classification: DRYCLEANING PLANTS, EXCEPT RUG CLEANING Organizations: GRANT L CARSON (CONTACT/OWNER)
FEDERAL BLDG CO E BAY RENAISSANCE (3630 PARK BLVD in OAKLAND, CA)
Small Quantity Generators, between 100 kg and 1000 kg of hazardous waste/month (Resource Conservation and Recovery Act (tracking hazardous waste)) - notification Organizations: HAYDEN LARRY (CONTACT/OWNER)
HERITAGE CLEANERS (384 GRAND AVE in OAKLAND, CA)
Small Quantity Generators, between 100 kg and 1000 kg of hazardous waste/month (Resource Conservation and Recovery Act (tracking hazardous waste)) - notification Organizations: CHOI DAI (CONTACT/OWNER)
ANDY'S ONE HR MARTINIZING (600 GRAND AVE #100 in OAKLAND, CA)
Small Quantity Generators, between 100 kg and 1000 kg of hazardous waste/month (Resource Conservation and Recovery Act (tracking hazardous waste))
J & D PAINTING (441 MERRITT AVE, in OAKLAND, CA)
COMPLIANCE ACTIVITY (Tracking inspections of insecticide, fungicide, and rodenticide, and toxic substances)
GRAND VIEW APARTMENTS (750 WARFIELD AVE. in PIEDMONT, CA)
COMPLIANCE ACTIVITY (Tracking inspections of insecticide, fungicide, and rodenticide, and toxic substances)
J & D PAINTING (4431 MERRITT AVE. in OAKLAND, CA)
COMPLIANCE ACTIVITY (Tracking inspections of insecticide, fungicide, and rodenticide, and toxic substances)
Housing units lacking complete plumbing facilities: 0.8% Housing units lacking complete kitchen facilities: 0.8%
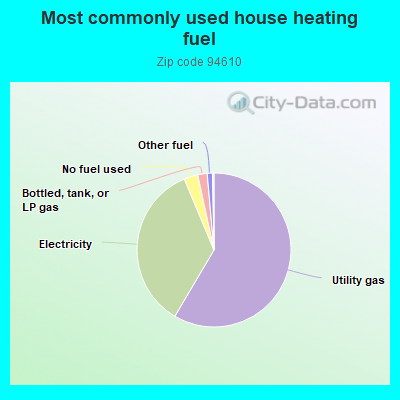
58.5%Utility gas
35.2%Electricity
2.9%No fuel used
2.0%Bottled, tank, or LP gas
1.1%Other fuel
Population in 1990: 29,637. Population change in the 1990s: +326 (+1.1%).
Place of birth for U.S.-born residents:
This state: 15,999
Northeast: 3,166
Midwest: 2,865
South: 2,336
West: 1,405
50% of the 94610 zip code residents lived in the same house 5 years ago. Out of people who lived in different houses, 48% lived in this county. Out of people who lived in different counties, 50% lived in California.
86% of the 94610 zip code residents lived in the same house 1 year ago. Out of people who lived in different houses, 46% moved from this county. Out of people who lived in different houses, 40% moved from different county within same state. Out of people who lived in different houses, 9% moved from different state. Out of people who lived in different houses, 4% moved from abroad.
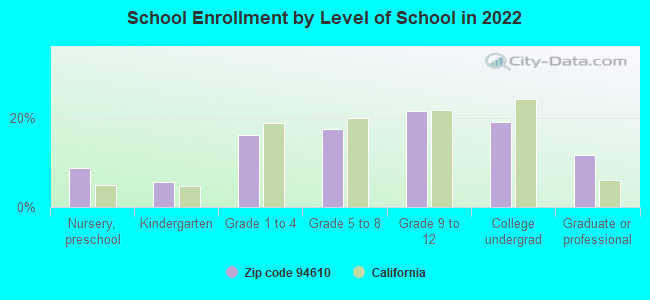
Private vs. public school enrollment:
Students in private schools in grades 1 to 8 (elementary and middle school): 336
Here:
18.8%
California:
10.5%
Students in private schools in grades 9 to 12 (high school): 227
Here:
19.9%
California:
8.5%
Students in private undergraduate colleges: 132
Here:
13.3%
California:
15.9%
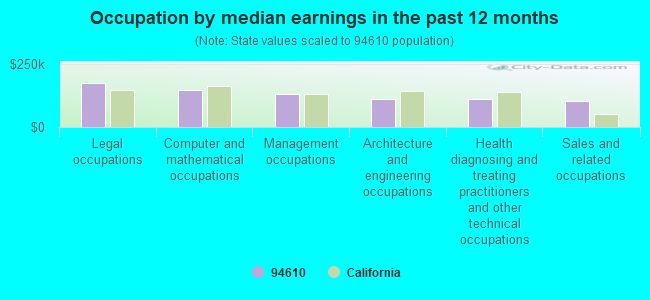
Occupation by median earnings in the past 12 months ($)
175,491Legal occupations
145,787Computer and mathematical occupations
130,117Management occupations
113,392Architecture and engineering occupations
112,520Health diagnosing and treating practitioners and other technical occupations
104,437Sales and related occupations
Companies with federal contracts located in this zip code:
FOX GROUP INC, THE (331 MAGNOLIA AVE in PIEDMONT, CA; small business) : $569,756 in 5 contractsfrom 2002 to 2005
Contracts for Other Defense -- Applied Research and Exploratory Development (R&D), Other Defense -- Operational Systems Development (R&D) by Navy Signed by year:2000: $0; 2001: $0; 2002: $70,000; 2003: $0; 2004: $296,189; 2005: $203,567; 2006: $0.
Biggest contracts:
$275,000 with Navy for Other Defense -- Applied Research and Exploratory Development (R&D). Signed on 2004-08-20. Completion date: 2005-12-19.
$203,567, same as above.Signed on 2005-04-21. Completion date: 2005-12-19.
$70,000 with Navy for Other Defense -- Operational Systems Development (R&D). Signed on 2002-07-25. Completion date: 2003-01-31.
$21,190 with Navy for Other Defense -- Applied Research and Exploratory Development (R&D). Signed on 2004-09-29. Completion date: 2005-12-19.
NATURAL STRATEGIES LLC (1050 WARFIELD AVE in OAKLAND, CA; small business)
$50,000 with Army for Other Environmental Services, Studies, and Analytical Support. Signed on 2002-08-15. Completion date: 2003-09-30.
KOURJANSKI, MIKHAIL (619 MONTCLAIR AVE in OAKLAND, CA; small business)
$46,324 with Army for Defense Tank - Automotive -- Advanced Development (R&D). Signed on 2002-12-17. Completion date: 2003-06-12.
Top industries in this zip code by the number of employees in 2005:
Other Services (except Public Administration): Religious Organizations (100-249 employees: 1 establishment, 20-49 employees: 4 establishments, 10-19 employees: 1 establishment, 5-9 employees: 3 establishments, 1-4 employees: 7 establishments)
Health Care and Social Assistance: Services for the Elderly and Persons with Disabilities (100-249: 1, 50-99: 1, 1-4: 1)
2005 - 2018 National Fire Incident Reporting System (NFIRS) incidents
According to the data from the years 2005 - 2018 the average number of fire incidents per year is 42. The highest number of reported fire incidents - 127 took place in 2018, and the least - 0 in 2010. The data has an increasing trend.
When looking into fire subcategories, the most reports belonged to: Outside Fires (40.8%), and Structure Fires (35.3%).
Fire incident types reported to NFIRS in Zip Code 94610


 Nearest zip codes: 94606, 94612, 94609, 94618, 94602, 94601.


 . Federal Facility

 According to the data from the years 2005 - 2018 the average number of fire incidents per year is 42. The highest number of reported fire incidents - 127 took place in 2018, and the least - 0 in 2010. The data has an increasing trend.
 When looking into fire subcategories, the most reports belonged to: Outside Fires (40.8%), and Structure Fires (35.3%).