Estimated zip code population in 2022: 38,139 Zip code population in 2010: 36,672 Zip code population in 2000: 41,872
Houses and condos: 17,621 Renter-occupied apartments: 12,794
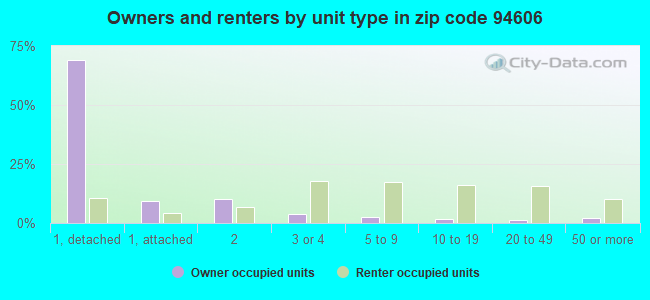
% of renters here:
80%
State:
44%
March 2022 cost of living index in zip code 94606: 121.0 (high, U.S. average is 100)
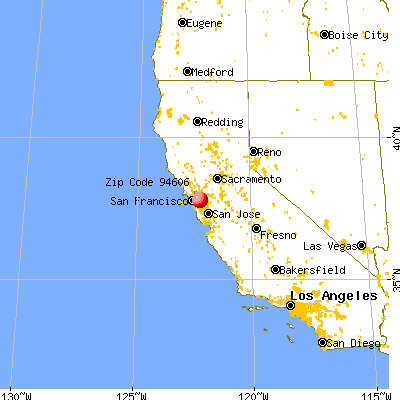
Land area: 2.3 sq. mi. Water area: 0.2 sq. mi.
Population density: 16,682 people per square mile
(very high).
OSM Map
General Map
Google Map
MSN Map
OSM Map
General Map
Google Map
MSN Map
OSM Map
General Map
Google Map
MSN Map
OSM Map
General Map
Google Map
MSN Map
Please wait while loading the map...
Real estate property taxes paid for housing units in 2022:
This zip code:
0.7% ($5,492)
California:
0.7% ($4,831)
Median real estate property taxes paid for housing units with mortgages in 2022: $6,518 (0.8%) Median real estate property taxes paid for housing units with no mortgage in 2022: $4,325 (0.6%)
Estimated median house/condo value in 2022: $770,301
94606:
$770,301
California:
$715,900
According to our research of California and other state lists, there were 61 registered sex offenders living in 94606 zip code as of April 27, 2024. The ratio of all residents to sex offenders in zip code 94606 is 630 to 1. The ratio of registered sex offenders to all residents in this zip code is near the state average.
Median resident age:
This zip code:
38.4 years
California median age:
37.9 years
Average household size:
This zip code:
2.4 people
California:
2.8 people
Averages for the 2020 tax year for zip code 94606, filed in 2021:
Average Adjusted Gross Income (AGI) in 2020: $59,961 (Individual Income Tax Returns)
Here:
$59,961
State:
$95,910
Salary/wage: $56,032 (reported on 84.7% of returns)
Here:
$56,032
State:
$77,331
(% of AGI for various income ranges: 1196.7% for AGIs below $25k, 4176.3% for AGIs $25k-50k, 7958.8% for AGIs $50k-75k, 11804.7% for AGIs $75k-100k, 21618.5% for AGIs $100k-200k, 125176.9% for AGIs over 200k)
Taxable interest for individuals: $713 (reported on 22.7% of returns)
This zip code:
$713
California:
$2,294
(% of AGI for various income ranges: 9.2% for AGIs below $25k, 15.7% for AGIs $25k-50k, 20.5% for AGIs $50k-75k, 31.5% for AGIs $75k-100k, 70.5% for AGIs $100k-200k, 459.2% for AGIs over 200k)
Ordinary dividends: $3,061 (reported on 13.6% of returns)
Here:
$3,061
State:
$10,949
(% of AGI for various income ranges: 12.8% for AGIs below $25k, 14.1% for AGIs $25k-50k, 42.7% for AGIs $50k-75k, 61.6% for AGIs $75k-100k, 213.0% for AGIs $100k-200k, 2229.2% for AGIs over 200k)
Net capital gain/loss in AGI: +$19,599 (reported on 14.3% of returns)
Here:
+$19,599
State:
+$49,306
(% of AGI for various income ranges: 3.6% for AGIs below $25k, 31.7% for AGIs $25k-50k, 45.6% for AGIs $50k-75k, 142.7% for AGIs $75k-100k, 464.0% for AGIs $100k-200k, 33098.5% for AGIs over 200k)
Profit/loss from business: +$10,941 (reported on 20.4% of returns)
Here:
+$10,941
State:
+$15,671
(% of AGI for various income ranges: 220.1% for AGIs below $25k, 281.2% for AGIs $25k-50k, 301.8% for AGIs $50k-75k, 397.8% for AGIs $75k-100k, 665.8% for AGIs $100k-200k, 4493.1% for AGIs over 200k)
Taxable individual retirement arrangement distribution: $15,118 (reported on 2.7% of returns)
94606:
$15,118
California:
$23,505
(% of AGI for various income ranges: 23.1% for AGIs below $25k, 25.5% for AGIs $25k-50k, 44.6% for AGIs $50k-75k, 95.9% for AGIs $75k-100k, 182.3% for AGIs $100k-200k, 1468.5% for AGIs over 200k)
Self-employed (Keogh) retirement plans: $17,000 (reported on 0.5% of returns)
94606:
$17,000
California:
$30,163
(% of AGI for various income ranges: 23.6% for AGIs $50k-75k, 55.4% for AGIs $100k-200k, 456.2% for AGIs over 200k)
Total itemized deductions: $27,408 (reported on 6.2% of returns)
Here:
$27,408
State:
$39,517
(% of AGI for various income ranges: 49.7% for AGIs below $25k, 78.8% for AGIs $25k-50k, 180.8% for AGIs $50k-75k, 345.3% for AGIs $75k-100k, 963.3% for AGIs $100k-200k, 6776.9% for AGIs over 200k)
Charity contributions: $6,186 (reported on 4.5% of returns)
Here:
$6,186
State:
$12,598
(% of AGI for various income ranges: 2.6% for AGIs below $25k, 9.9% for AGIs $25k-50k, 22.5% for AGIs $50k-75k, 56.5% for AGIs $75k-100k, 146.7% for AGIs $100k-200k, 1613.8% for AGIs over 200k)
Taxes paid: $8,678 (reported on 6.1% of returns)
94606:
$8,678
State:
$8,807
(% of AGI for various income ranges: 10.6% for AGIs below $25k, 22.7% for AGIs $25k-50k, 49.8% for AGIs $50k-75k, 126.8% for AGIs $75k-100k, 360.4% for AGIs $100k-200k, 1802.3% for AGIs over 200k)
Earned income credit: $1,890 (reported on 18.7% of returns)
Here:
$1,890
State:
$2,074
(% of AGI for various income ranges: 112.5% for AGIs below $25k, 72.8% for AGIs $25k-50k, 0.6% for AGIs $50k-75k)
Percentage of individuals using paid preparers for their 2020 taxes: 91.3%
Here:
91%
State:
92%
(% for various income ranges: 89.4% for AGIs below $25k, 91.6% for AGIs $25k-50k, 92.2% for AGIs $50k-75k, 92.3% for AGIs $75k-100k, 93.9% for AGIs $100k-200k, 93.5% for AGIs over 200k)
Averages for the 2012 tax year for zip code 94606, filed in 2013:
Average Adjusted Gross Income (AGI) in 2012: $37,188 (Individual Income Tax Returns)
Here:
$37,188
State:
$72,726
Salary/wage: $35,869 (reported on 85.9% of returns)
Here:
$35,869
State:
$59,079
(% of AGI for various income ranges: 77.2% for AGIs below $25k, 88.0% for AGIs $25k-50k, 89.2% for AGIs $50k-75k, 83.5% for AGIs $75k-100k, 80.7% for AGIs $100k-200k, 63.1% for AGIs over 200k)
Taxable interest for individuals: $574 (reported on 20.4% of returns)
This zip code:
$574
California:
$2,146
(% of AGI for various income ranges: 0.4% for AGIs below $25k, 0.2% for AGIs $25k-50k, 0.4% for AGIs $50k-75k, 0.4% for AGIs $75k-100k, 0.3% for AGIs $100k-200k, 0.3% for AGIs over 200k)
Ordinary dividends: $3,146 (reported on 9.1% of returns)
Here:
$3,146
State:
$9,308
(% of AGI for various income ranges: 0.6% for AGIs below $25k, 0.5% for AGIs $25k-50k, 0.6% for AGIs $50k-75k, 0.9% for AGIs $75k-100k, 1.4% for AGIs $100k-200k, 0.9% for AGIs over 200k)
Net capital gain/loss in AGI: +$2,389 (reported on 7.0% of returns)
Here:
+$2,389
State:
+$30,460
(% of AGI for various income ranges: 0.4% for AGIs $50k-75k, 0.3% for AGIs $75k-100k, 0.8% for AGIs $100k-200k, 2.9% for AGIs over 200k)
Profit/loss from business: +$11,733 (reported on 18.8% of returns)
Here:
+$11,733
State:
+$17,064
(% of AGI for various income ranges: 13.1% for AGIs below $25k, 4.8% for AGIs $25k-50k, 2.4% for AGIs $50k-75k, 4.6% for AGIs $75k-100k, 5.1% for AGIs $100k-200k, 7.4% for AGIs over 200k)
Taxable individual retirement arrangement distribution: $16,382 (reported on 2.9% of returns)
94606:
$16,382
California:
$19,557
(% of AGI for various income ranges: 0.8% for AGIs below $25k, 0.6% for AGIs $25k-50k, 0.8% for AGIs $50k-75k, 1.8% for AGIs $75k-100k, 2.3% for AGIs $100k-200k, 3.5% for AGIs over 200k)
Self-employment retirement plans: $13,143 (reported on 0.4% of returns)
94606:
$13,143
California:
$24,530
(% of AGI for various income ranges: 0.2% for AGIs $50k-75k, 0.6% for AGIs $100k-200k)
Total itemized deductions: $20,173 (23% of AGI, reported on 15.1% of returns)
Here:
$20,173
State:
$34,004
Here:
23.3% of AGI
State:
22.7% of AGI
(% of AGI for various income ranges: 5.0% for AGIs below $25k, 4.7% for AGIs $25k-50k, 7.0% for AGIs $50k-75k, 11.1% for AGIs $75k-100k, 13.9% for AGIs $100k-200k, 14.9% for AGIs over 200k)
Charity contributions: $2,482 (reported on 10.2% of returns)
Here:
$2,482
State:
$4,659
(% of AGI for various income ranges: 0.2% for AGIs below $25k, 0.4% for AGIs $25k-50k, 0.7% for AGIs $50k-75k, 1.0% for AGIs $75k-100k, 1.3% for AGIs $100k-200k, 1.1% for AGIs over 200k)
Taxes paid: $7,928 (reported on 15.1% of returns)
94606:
$7,928
State:
$14,448
(% of AGI for various income ranges: 0.9% for AGIs below $25k, 1.1% for AGIs $25k-50k, 2.3% for AGIs $50k-75k, 4.8% for AGIs $75k-100k, 6.7% for AGIs $100k-200k, 8.6% for AGIs over 200k)
Earned income credit: $2,038 (reported on 26.8% of returns)
Here:
$2,038
State:
$2,286
(% of AGI for various income ranges: 7.3% for AGIs below $25k, 0.9% for AGIs $25k-50k)
Percentage of individuals using paid preparers for their 2012 taxes: 49.9%
Here:
50%
State:
64%
(% for various income ranges: 51.0% for AGIs below $25k, 48.9% for AGIs $25k-50k, 48.0% for AGIs $50k-75k, 45.7% for AGIs $75k-100k, 51.9% for AGIs $100k-200k, 64.3% for AGIs over 200k)
Averages for the 2004 tax year for zip code 94606, filed in 2005:
Average Adjusted Gross Income (AGI) in 2004: $30,815 (Individual Income Tax Returns)
Here:
$30,815
State:
$58,600
Salary/wage: $29,958 (reported on 87.1% of returns)
Here:
$29,958
State:
$49,455
(% of AGI for various income ranges: 100.8% for AGIs below $10k, 82.9% for AGIs $10k-25k, 90.7% for AGIs $25k-50k, 88.3% for AGIs $50k-75k, 85.3% for AGIs $75k-100k, 64.2% for AGIs over 100k)
Taxable interest for individuals: $1,035 (reported on 29.8% of returns)
This zip code:
$1,035
California:
$2,365
(% of AGI for various income ranges: 2.3% for AGIs below $10k, 0.9% for AGIs $10k-25k, 0.6% for AGIs $25k-50k, 1.0% for AGIs $50k-75k, 0.8% for AGIs $75k-100k, 1.9% for AGIs over 100k)
Taxable dividends: $2,089 (reported on 10.6% of returns)
Here:
$2,089
State:
$4,746
(% of AGI for various income ranges: 1.4% for AGIs below $10k, 0.5% for AGIs $10k-25k, 0.4% for AGIs $25k-50k, 0.8% for AGIs $50k-75k, 0.6% for AGIs $75k-100k, 1.6% for AGIs over 100k)
Net capital gain/loss: +$6,227 (reported on 9.7% of returns)
Here:
+$6,227
State:
+$23,418
(% of AGI for various income ranges: -1.0% for AGIs below $10k, -0.0% for AGIs $10k-25k, 0.2% for AGIs $25k-50k, 0.4% for AGIs $50k-75k, 0.8% for AGIs $75k-100k, 12.0% for AGIs over 100k)
Profit/loss from business: +$10,471 (reported on 15.8% of returns)
Here:
+$10,471
State:
+$16,826
(% of AGI for various income ranges: 14.1% for AGIs below $10k, 8.7% for AGIs $10k-25k, 3.8% for AGIs $25k-50k, 3.3% for AGIs $50k-75k, 3.8% for AGIs $75k-100k, 7.4% for AGIs over 100k)
IRA payment deduction: $2,987 (reported on 2.6% of returns)
94606:
$2,987
California:
$3,192
(% of AGI for various income ranges: 0.3% for AGIs below $10k, 0.3% for AGIs $10k-25k, 0.4% for AGIs $25k-50k, 0.2% for AGIs $50k-75k, 0.1% for AGIs $75k-100k, 0.1% for AGIs over 100k)
Self-employed pension: $11,191 (reported on 0.6% of returns)
Here:
$11,191
California:
$17,688
(% of AGI for various income ranges: 0.1% for AGIs $10k-25k, 0.1% for AGIs $25k-50k, 0.1% for AGIs $50k-75k, 0.2% for AGIs $75k-100k, 0.9% for AGIs over 100k)
Total itemized deductions: $18,470 (28% of AGI, reported on 16.1% of returns)
Here:
$18,470
State:
$28,113
Here:
28.2% of AGI
State:
25.3% of AGI
(% of AGI for various income ranges: 8.0% for AGIs below $10k, 4.8% for AGIs $10k-25k, 6.7% for AGIs $25k-50k, 11.3% for AGIs $50k-75k, 13.9% for AGIs $75k-100k, 17.4% for AGIs over 100k)
Charity contributions deductions: $2,443 (4% of AGI, reported on 12.5% of returns)
Here:
$2,443
State:
$3,923
Here:
3.5% of AGI
State:
3.3% of AGI
(% of AGI for various income ranges: 0.4% for AGIs below $10k, 0.4% for AGIs $10k-25k, 0.8% for AGIs $25k-50k, 1.2% for AGIs $50k-75k, 1.4% for AGIs $75k-100k, 1.7% for AGIs over 100k)
Total tax: $4,247 (reported on 69.7% of returns)
94606:
$4,247
State:
$10,761
(% of AGI for various income ranges: 4.0% for AGIs below $10k, 4.3% for AGIs $10k-25k, 7.7% for AGIs $25k-50k, 11.3% for AGIs $50k-75k, 13.0% for AGIs $75k-100k, 16.8% for AGIs over 100k)
Earned income credit: $1,705 (reported on 24.4% of returns)
Here:
$1,705
State:
$1,763
Percentage of individuals using paid preparers for their 2004 taxes: 59.7%
Here:
60%
State:
66%
(% for various income ranges: 62.3% for AGIs below $10k, 63.0% for AGIs $10k-25k, 56.9% for AGIs $25k-50k, 54.8% for AGIs $50k-75k, 53.6% for AGIs $75k-100k, 59.0% for AGIs over 100k)
Likely homosexual households (counted as self-reported same-sex unmarried-partner households)
Lesbian couples: 0.7% of all households
Gay men: 0.6% of all households
Household received Food Stamps/SNAP in the past 12 months: 3,125 Household did not receive Food Stamps/SNAP in the past 12 months: 13,074
Women who had a birth in the past 12 months: 442 (184 now married, 261 unmarried) Women who did not have a birth in the past 12 months: 10,183 (3,028 now married, 7,196 unmarried)
Housing units in zip code 94606 with a mortgage: 1,800 (77 second mortgage, 68 both second mortgage and home equity loan) Houses without a mortgage: 95
Median monthly owner costs for units with a mortgage: $2,692 Median monthly owner costs for units without a mortgage: $794
Residents with income below the poverty level in 2022:
This zip code:
16.8%
Whole state:
12.2%
Residents with income below 50% of the poverty level in 2022:
This zip code:
8.6%
Whole state:
6.2%
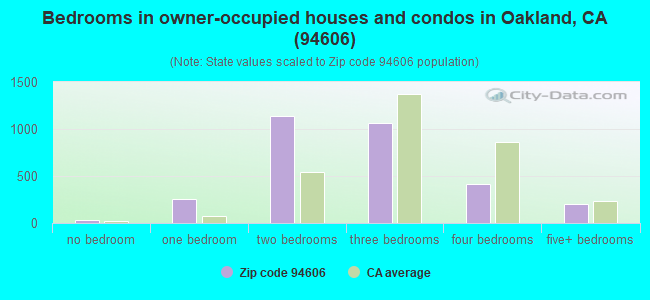
Median number of rooms in houses and condos:
Here:
5.3
State:
6.0
Median number of rooms in apartments:
Here:
3.4
State:
3.9
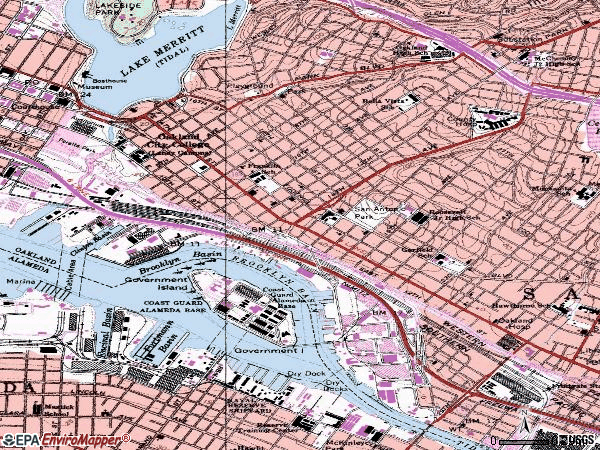
Notable locations in this zip code not listed on our city pages
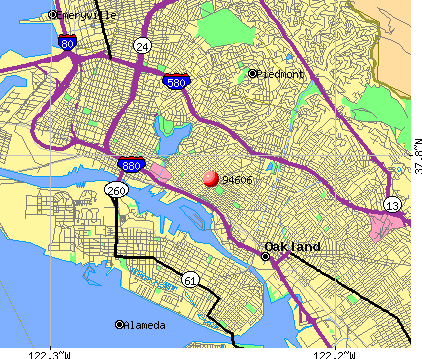
Notable locations in zip code 94606: Ninth Avenue Terminal (A), Oakland Schools Administration Building (B), Oakland Fire Department Station 4 (C), Salem Lutheran Home (D). Display/hide their locations on the map
Churches in zip code 94606 include: Kingdom Hall of Jehovahs Witnesses (A), Lakeside Unity Temple (B), Mission Covenant Church (C), Bible Fellowship Baptist Church (D), Ebenezer Church of God in Christ (E), First Assembly of God Church (F), First Church of the Nazarene (G), First Trinity Lutheran Church (H), Foothill Boulevard Baptist Church (I). Display/hide their locations on the map
Parks in zip code 94606 include: San Antonio Park (1), Athol Plaza (2), Bella Vista Recreation Area (3), Clinton Square (4), Garfield Municipal Playground (5), Manzanita Recreation Center (6), Morgan Plaza (7), Park Boulevard Plaza (8), Smith Park (9). Display/hide their locations on the map
3,120 married couples with children.
2,104 single-parent households (638 men, 1,466 women).
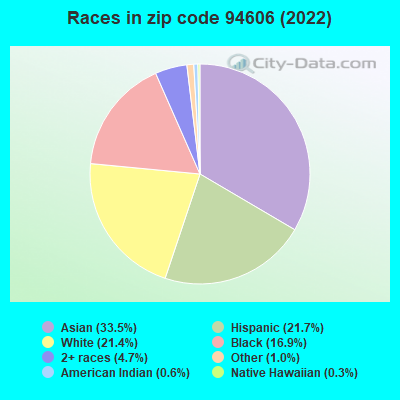
47.8% of residents of 94606 zip code speak English at home.
16.6% of residents speak Spanish at home (66% very well, 15% well, 11% not well, 9% not at all).
3.3% of residents speak other Indo-European language at home (70% very well, 16% well, 12% not well, 2% not at all).
27.6% of residents speak Asian or Pacific Island language at home (39% very well, 18% well, 29% not well, 14% not at all).
4.3% of residents speak other language at home (59% very well, 17% well, 17% not well, 6% not at all).
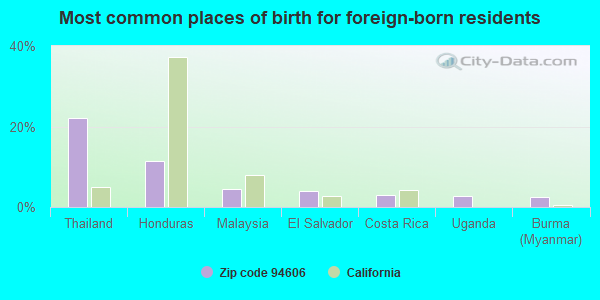
Foreign born population: 15,041 (39.4%) (60.0% of them are naturalized citizens)
Major facilities with environmental interests located in this zip code:
MOALS BODY SHOP INCORPORATED (937 EAST 2TH STREET in OAKLAND, CA)
STATE MASTER (California - Hazardous Waste Tracking) - HAZARDOU WASTE PROGRAM CRITERIA AND HAZARDOUS AIR POLLUTANT INVENTORY (Inventory of air pollution sources) Small Quantity Generators, between 100 kg and 1000 kg of hazardous waste/month (Resource Conservation and Recovery Act (tracking hazardous waste)) - notification Business SIC classification: TOP, BODY, AND UPHOLSTERY REPAIR SHOPS AND PAINT SHOPS Business NAICS classification: AUTOMOTIVE BODY, PAINT, AND INTERIOR REPAIR AND MAINTENANCE. Organizations: STEVE MOAL (CONTACT/OWNER)
EXCELSWELD CO OF OAKLAND (1231 16 AVE in OAKLAND, CA)
STATE MASTER (California - Hazardous Waste Tracking) - HAZARDOU WASTE PROGRAM Small Quantity Generators, between 100 kg and 1000 kg of hazardous waste/month (Resource Conservation and Recovery Act (tracking hazardous waste)) - notification Organizations: J.W. SILVEILA (CONTACT/OWNER)
Alternative names: EXCELSWELD CORPORATION
KRAGEN AUTO PARTS #4004 (1800 PARK BLVD in OAKLAND, CA)
Conditionally Exempt Small Quantity Generators, less than 100 kg/month of hazardous waste (Resource Conservation and Recovery Act (tracking hazardous waste)) - notification STATE MASTER (California - Used Oil Recycling System ) - USED OIL RECYCLING Organizations: MELVIN H SCHWARTZ (CONTACT/OWNER)
Alternative names: GRAND AUTO, INC
CHEVRON STATION NO 208029 (9755 EDES AVE in OAKLAND, CA)
STATE MASTER (California - Hazardous Waste Tracking) - HAZARDOU WASTE PROGRAM Small Quantity Generators, between 100 kg and 1000 kg of hazardous waste/month (Resource Conservation and Recovery Act (tracking hazardous waste)) - notification Organizations: CHEVRON PRODUCTS CO (CONTACT/OWNER)
CHEVRON STATION NO 201919 (2142 E 12TH ST in OAKLAND, CA)
STATE MASTER (California - Hazardous Waste Tracking) - HAZARDOU WASTE PROGRAM Small Quantity Generators, between 100 kg and 1000 kg of hazardous waste/month (Resource Conservation and Recovery Act (tracking hazardous waste)) - notification Organizations: CHEVRON PRODUCTS CO (CONTACT/OWNER)
CENVEO (1021 COTTON ST in OAKLAND, CA) . Federal Facility
STATE MASTER (California - Hazardous Waste Tracking) - HAZARDOU WASTE PROGRAM Small Quantity Generators, between 100 kg and 1000 kg of hazardous waste/month (Resource Conservation and Recovery Act (tracking hazardous waste)) - notification Organizations: MAIL WELL (CONTACT/OWNER)
Alternative names: WISCO ENVELOPE CO
EQUILON ENTERPRISES (2101 PARK BLVD/NEWTON in OAKLAND, CA) . Federal Facility
STATE MASTER (California - Hazardous Waste Tracking) - HAZARDOU WASTE PROGRAM Small Quantity Generators, between 100 kg and 1000 kg of hazardous waste/month (Resource Conservation and Recovery Act (tracking hazardous waste)) - notification Organizations: EQUILON ENTERPRISES, LLC (CONTACT/OWNER)
Alternative names: SHELL OIL CO
GENETROL BIOTHERAPEUTICS (2220 LIVINGSTON ST STE 201 in OAKLAND, CA)
STATE MASTER (California - Hazardous Waste Tracking) - HAZARDOU WASTE PROGRAM Small Quantity Generators, between 100 kg and 1000 kg of hazardous waste/month (Resource Conservation and Recovery Act (tracking hazardous waste)) - notification Organizations: DONALD L JONES PROPERTIES (CONTACT/OWNER)
GARFIELD ELEMENTARY (1640 22ND AVE. in OAKLAND, CA)
(National Center for Education Statistics) - STATE ID-6001846 Organizations: OAKLAND UNIFIED (SCHOOL DISTRICT)
INTERNATIONAL COMMUNITY (2825 INTERNATIONAL BLVD. in OAKLAND, CA)
(National Center for Education Statistics) - STATE ID-6118616 Organizations: OAKLAND UNIFIED (SCHOOL DISTRICT)
LIFE ACADEMY (2111 INTERNATIONAL BLVD. in OAKLAND, CA)
(National Center for Education Statistics) - STATE ID-0130575 Organizations: OAKLAND UNIFIED (SCHOOL DISTRICT)
FRANKLIN ELEMENTARY (915 FOOTHILL BLVD. in OAKLAND, CA)
(National Center for Education Statistics) - STATE ID-6001820 Organizations: OAKLAND UNIFIED (SCHOOL DISTRICT)
LA ESCUELITA ELEMENTARY (1100 THIRD AVE. in OAKLAND, CA)
(National Center for Education Statistics) - STATE ID-6096523 Organizations: OAKLAND UNIFIED (SCHOOL DISTRICT)
Housing units lacking complete plumbing facilities: 1.2% Housing units lacking complete kitchen facilities: 1.9%
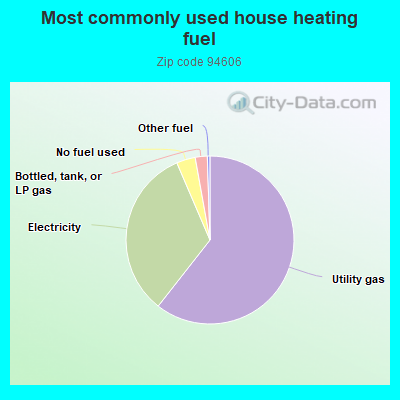
60.1%Utility gas
32.7%Electricity
3.6%No fuel used
2.3%Bottled, tank, or LP gas
0.5%Other fuel
Population in 1990: 38,555. Population change in the 1990s: +3,317 (+8.6%).
Place of birth for U.S.-born residents:
This state: 16,184
Northeast: 1,648
Midwest: 1,431
South: 2,045
West: 1,150
53% of the 94606 zip code residents lived in the same house 5 years ago. Out of people who lived in different houses, 63% lived in this county. Out of people who lived in different counties, 50% lived in California.
88% of the 94606 zip code residents lived in the same house 1 year ago. Out of people who lived in different houses, 59% moved from this county. Out of people who lived in different houses, 28% moved from different county within same state. Out of people who lived in different houses, 9% moved from different state. Out of people who lived in different houses, 3% moved from abroad.
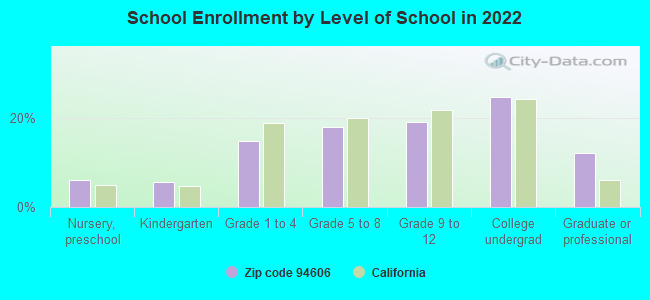
Private vs. public school enrollment:
Students in private schools in grades 1 to 8 (elementary and middle school): 331
Here:
13.4%
California:
10.5%
Students in private schools in grades 9 to 12 (high school): 107
Here:
7.4%
California:
8.5%
Students in private undergraduate colleges: 188
Here:
10.1%
California:
15.9%
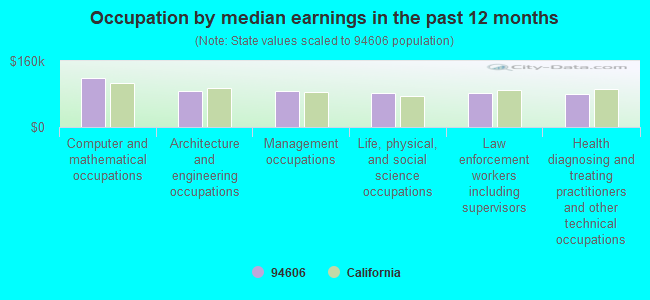
Occupation by median earnings in the past 12 months ($)
119,128Computer and mathematical occupations
88,122Architecture and engineering occupations
86,896Management occupations
83,256Life, physical, and social science occupations
82,029Law enforcement workers including supervisors
79,448Health diagnosing and treating practitioners and other technical occupations
Companies with federal contracts located in this zip code (OAKLAND, CA):
AMERICAN MUTUAL PROTECTIVE BUR (1060 E 11TH STREET; small business) : $5,382,586 in 24 contractsfrom 2001 to 2005
Contracts for Guard Services by Air Force Signed by year:2000: $0; 2001: $2,709,681; 2002: $1,446,686; 2003: $1,414,900; 2004: -$183,886; 2005: -$4,795; 2006: $0.
Biggest contracts:
$1,297,292 with Air Force for Guard Services. Signed on 2001-01-30. Completion date: 2001-09-30.
$962,524, same as above.Signed on 2001-11-02. Completion date: 2002-09-30.
$896,847, same as above.Signed on 2003-10-02. Completion date: 2004-09-30.
$868,721, same as above.Signed on 2002-10-25. Completion date: 2003-09-30.
AMERICAN MUTUAL DETECTIVE BUR (1060 E. 11TH ST.; small business) : $800,190 in 2 contractsin 1999
$556,391 with Air Force for Guard Services. Signed on 1999-10-29. Completion date: 1999-12-31.
$243,799, same as above.Signed on 1999-12-22. Completion date: 2000-02-29.
EARTHGRAINS BAKING COMPANIES, (955 KENNEDY ST) : $582,340 in 6 contractsfrom 2002 to 2005
Contracts for Food Items For Resale, Bakery and Cereal Products by Defense Commissary Agency, Defense Logistics Agency Signed by year:2000: $0; 2001: $0; 2002: $0; 2003: $0; 2004: $194,572; 2005: $387,768; 2006: $0.
Biggest contracts:
$230,280 with Defense Commissary Agency for Food Items For Resale. Signed on 2005-04-01. Completion date: 2005-08-31.
$194,572, same as above.Signed on 2004-10-01. Completion date: 2005-02-28.
$91,866, same as above.Signed on 2005-01-01. Completion date: 2005-03-31.
$65,622, same as above.Signed on 2005-09-01. Completion date: 2005-09-30.
BAYTRONICS CORPORATION (2228 LIVINGSTON STREET; small business) 1000 employees, $0 revenue. : $279,542 in 12 contractsfrom 2000 to 2002
Contracts for Non-nuclear Ship Repair (West) Ship repair (including overhauls and conversions) performed on. non-nuclear propelled and nonpropelled ships west of the 108th meridian by Navy Signed by year:2000: $165,374; 2001: $10,487; 2002: $103,681; 2003: $0; 2004: $0; 2005: $0; 2006: $0.
Biggest contracts:
$103,878 with Navy for Non-nuclear Ship Repair (West) Ship repair (including overhauls and conversions) performed on. non-nuclear propelled and nonpropelled ships west of the 108th meridian. Signed on 2000-11-30. Completion date: 2001-01-01.
$59,721, same as above.Signed on 2000-10-11. Completion date: 2000-10-16.
$28,209, same as above.Signed on 2002-02-20. Completion date: 2002-02-22.
$26,856, same as above.Signed on 2002-03-15. Completion date: 2002-04-30.
BRIDGEPOINT HOLDINGS, INC (1001 22ND AVE # 300; small business) : $257,592 in 10 contractsfrom 2003 to 2006
Contracts for Miscellaneous Items, Communications Security Equipment and Components, ADP Support Equipment, Other ADP and Telecommunications Services (includes data storage on tapes, compact disks, etc.) by Army, Federal Technology Service Signed by year:2000: $0; 2001: $0; 2002: $0; 2003: $159,617; 2004: $31,180; 2005: $50,295; 2006: $16,500.
Biggest contracts:
$53,869 with Army for Miscellaneous Items. Taking place in NC. Signed on 2003-09-10. Completion date: 2003-09-01.
$36,990 with Army for Communications Security Equipment and Components. Signed on 2003-08-27. Completion date: 2003-09-30.
$36,219 with Federal Technology Service for ADP Support Equipment. Taking place in VA. Signed on 2003-11-19. Completion date: 2003-12-19.
$34,545 with Army for Communications Security Equipment and Components. Taking place in VA. Signed on 2005-09-30. Completion date: 2005-11-04.
CONCEPT MARINE ASSOCIATES, INC (1853 EMBARCADERO; small business) : $143,291 in 2 contractsfrom 2000 to 2002
$103,326 with Army for Construction of Structures and Facilities -- Other Airfield Structures. Taking place in AZ. Signed on 2002-01-28. Completion date: 2002-10-28.
$39,965 with U.S. Army Corps of Engineers - civil program financing only for Architect - Engineer Services (including landscaping, interior layout, and designing). Signed on 2000-07-27. Completion date: 2000-10-22.
NORTH AMERICAN FENCE CO & SUPP (511 23RD AVE; small business)
$129,042 with Army for Construction of Structures and Facilities -- Other Non-Building Facilities. Signed on 2006-01-30. Completion date: 2006-06-30.
BROCHIER & ASSOCIATES, ARCHITE (2036 LIVINGSTON ST STE 2; small business) : -$13,714 in 6 contractsin 2000
Contracts for Other Architect and Engineering Services by Navy Signed by year:2000: -$13,714; 2001: $0; 2002: $0; 2003: $0; 2004: $0; 2005: $0; 2006: $0.
Biggest contracts:
$0 with Navy for Other Architect and Engineering Services. Signed on 2000-05-02. Completion date: 1993-04-05.
$0, same as above.Signed on 2000-05-02. Completion date: 1993-07-12.
$0, same as above.Signed on 2000-05-02. Completion date: 1994-02-27.
-$1,953, same as above.Signed on 2000-05-02. Completion date: 1994-02-27.
Top industries in this zip code by the number of employees in 2005:
2005 - 2018 National Fire Incident Reporting System (NFIRS) incidents
According to the data from the years 2005 - 2018 the average number of fire incidents per year is 62. The highest number of reported fire incidents - 150 took place in 2017, and the least - 0 in 2012. The data has an increasing trend.
When looking into fire subcategories, the most reports belonged to: Structure Fires (43.4%), and Outside Fires (35.4%).
Fire incident types reported to NFIRS in Zip Code 94606


 Nearest zip codes: 94610, 94612, 94601, 94501, 94602, 94609.


 According to the data from the years 2005 - 2018 the average number of fire incidents per year is 62. The highest number of reported fire incidents - 150 took place in 2017, and the least - 0 in 2012. The data has an increasing trend.
 When looking into fire subcategories, the most reports belonged to: Structure Fires (43.4%), and Outside Fires (35.4%).