Estimated zip code population in 2022: 30,845 Zip code population in 2010: 28,329 Zip code population in 2000: 28,880
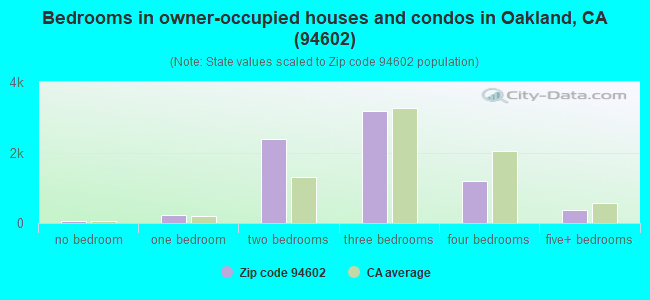
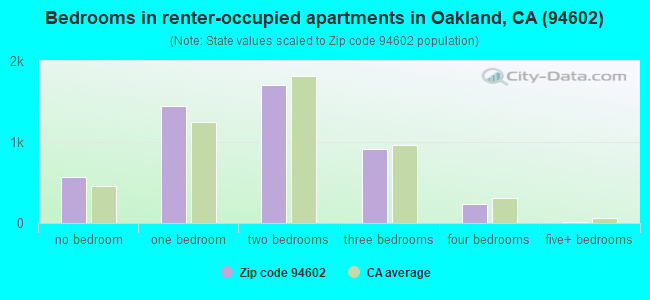
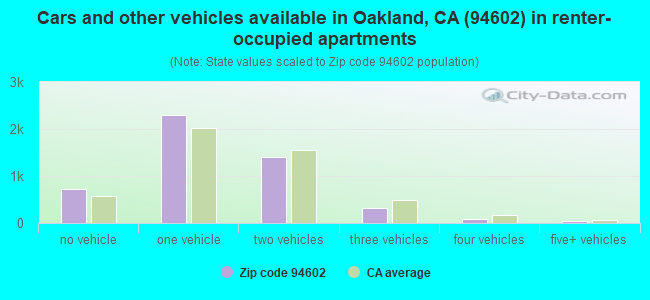
Houses and condos: 13,007 Renter-occupied apartments: 4,862
% of renters here:
39%
State:
44%
March 2022 cost of living index in zip code 94602: 119.2 (more than average, U.S. average is 100)
Land area: 3.3 sq. mi. Water area: 0.0 sq. mi.
Population density: 9,337 people per square mile
(high).
OSM Map
General Map
Google Map
MSN Map
OSM Map
General Map
Google Map
MSN Map
OSM Map
General Map
Google Map
MSN Map
OSM Map
General Map
Google Map
MSN Map
Please wait while loading the map...
Real estate property taxes paid for housing units in 2022:
This zip code:
0.7% ($8,491)
California:
0.7% ($4,831)
Median real estate property taxes paid for housing units with mortgages in 2022: $10,227 (0.8%) Median real estate property taxes paid for housing units with no mortgage in 2022: $5,713 (0.6%)
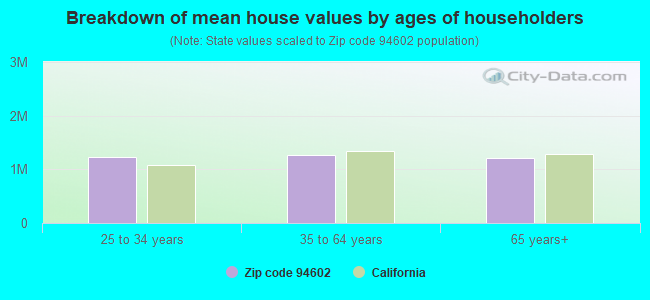
Estimated median house/condo value in 2022: $1,152,520
94602:
$1,152,520
California:
$715,900
According to our research of California and other state lists, there were 23 registered sex offenders living in 94602 zip code as of May 08, 2024. The ratio of all residents to sex offenders in zip code 94602 is 1,307 to 1. The ratio of registered sex offenders to all residents in this zip code is lower than the state average.
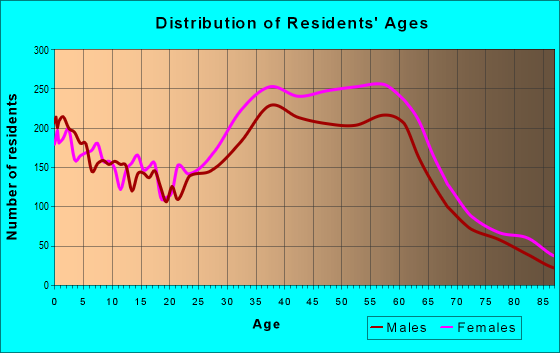
Median resident age:
This zip code:
43.4 years
California median age:
37.9 years
Average household size:
This zip code:
2.5 people
California:
2.8 people
Averages for the 2020 tax year for zip code 94602, filed in 2021:
Average Adjusted Gross Income (AGI) in 2020: $119,549 (Individual Income Tax Returns)
Here:
$119,549
State:
$95,910
Salary/wage: $108,763 (reported on 78.8% of returns)
Here:
$108,763
State:
$77,331
(% of AGI for various income ranges: 1160.7% for AGIs below $25k, 4063.5% for AGIs $25k-50k, 7784.9% for AGIs $50k-75k, 11128.8% for AGIs $75k-100k, 20695.2% for AGIs $100k-200k, 108894.1% for AGIs over 200k)
Taxable interest for individuals: $1,494 (reported on 44.5% of returns)
This zip code:
$1,494
California:
$2,294
(% of AGI for various income ranges: 26.1% for AGIs below $25k, 29.9% for AGIs $25k-50k, 82.1% for AGIs $50k-75k, 113.6% for AGIs $75k-100k, 177.6% for AGIs $100k-200k, 688.9% for AGIs over 200k)
Ordinary dividends: $6,911 (reported on 33.3% of returns)
Here:
$6,911
State:
$10,949
(% of AGI for various income ranges: 62.3% for AGIs below $25k, 77.9% for AGIs $25k-50k, 170.1% for AGIs $50k-75k, 244.9% for AGIs $75k-100k, 667.6% for AGIs $100k-200k, 2819.8% for AGIs over 200k)
Net capital gain/loss in AGI: +$29,545 (reported on 31.0% of returns)
Here:
+$29,545
State:
+$49,306
(% of AGI for various income ranges: 34.1% for AGIs below $25k, 77.6% for AGIs $25k-50k, 161.3% for AGIs $50k-75k, 302.8% for AGIs $75k-100k, 967.6% for AGIs $100k-200k, 17762.6% for AGIs over 200k)
Profit/loss from business: +$22,347 (reported on 22.5% of returns)
Here:
+$22,347
State:
+$15,671
(% of AGI for various income ranges: 234.4% for AGIs below $25k, 354.3% for AGIs $25k-50k, 499.8% for AGIs $50k-75k, 455.9% for AGIs $75k-100k, 1512.3% for AGIs $100k-200k, 5135.3% for AGIs over 200k)
Taxable individual retirement arrangement distribution: $22,899 (reported on 8.9% of returns)
94602:
$22,899
California:
$23,505
(% of AGI for various income ranges: 54.1% for AGIs below $25k, 99.1% for AGIs $25k-50k, 230.1% for AGIs $50k-75k, 413.5% for AGIs $75k-100k, 843.2% for AGIs $100k-200k, 1525.9% for AGIs over 200k)
Self-employed (Keogh) retirement plans: $24,400 (reported on 2.6% of returns)
94602:
$24,400
California:
$30,163
(% of AGI for various income ranges: 18.9% for AGIs $25k-50k, 31.5% for AGIs $50k-75k, 38.5% for AGIs $75k-100k, 160.2% for AGIs $100k-200k, 949.8% for AGIs over 200k)
Total itemized deductions: $33,707 (reported on 23.4% of returns)
Here:
$33,707
State:
$39,517
(% of AGI for various income ranges: 150.5% for AGIs below $25k, 270.8% for AGIs $25k-50k, 717.9% for AGIs $50k-75k, 1073.2% for AGIs $75k-100k, 2388.1% for AGIs $100k-200k, 9062.3% for AGIs over 200k)
Charity contributions: $6,941 (reported on 19.1% of returns)
Here:
$6,941
State:
$12,598
(% of AGI for various income ranges: 9.8% for AGIs below $25k, 25.6% for AGIs $25k-50k, 86.5% for AGIs $50k-75k, 136.8% for AGIs $75k-100k, 288.7% for AGIs $100k-200k, 1977.3% for AGIs over 200k)
Taxes paid: $9,207 (reported on 23.3% of returns)
94602:
$9,207
State:
$8,807
(% of AGI for various income ranges: 35.8% for AGIs below $25k, 72.4% for AGIs $25k-50k, 174.4% for AGIs $50k-75k, 347.3% for AGIs $75k-100k, 735.8% for AGIs $100k-200k, 2278.8% for AGIs over 200k)
Earned income credit: $1,731 (reported on 9.1% of returns)
Here:
$1,731
State:
$2,074
(% of AGI for various income ranges: 80.3% for AGIs below $25k, 47.5% for AGIs $25k-50k)
Percentage of individuals using paid preparers for their 2020 taxes: 90.5%
Here:
91%
State:
92%
(% for various income ranges: 88.2% for AGIs below $25k, 89.1% for AGIs $25k-50k, 90.0% for AGIs $50k-75k, 89.4% for AGIs $75k-100k, 92.1% for AGIs $100k-200k, 94.6% for AGIs over 200k)
Averages for the 2012 tax year for zip code 94602, filed in 2013:
Average Adjusted Gross Income (AGI) in 2012: $77,511 (Individual Income Tax Returns)
Here:
$77,511
State:
$72,726
Salary/wage: $71,478 (reported on 80.3% of returns)
Here:
$71,478
State:
$59,079
(% of AGI for various income ranges: 67.9% for AGIs below $25k, 75.8% for AGIs $25k-50k, 75.8% for AGIs $50k-75k, 73.1% for AGIs $75k-100k, 76.7% for AGIs $100k-200k, 71.3% for AGIs over 200k)
Taxable interest for individuals: $1,525 (reported on 43.8% of returns)
This zip code:
$1,525
California:
$2,146
(% of AGI for various income ranges: 1.3% for AGIs below $25k, 0.8% for AGIs $25k-50k, 0.9% for AGIs $50k-75k, 0.9% for AGIs $75k-100k, 0.7% for AGIs $100k-200k, 0.9% for AGIs over 200k)
Ordinary dividends: $5,775 (reported on 29.0% of returns)
Here:
$5,775
State:
$9,308
(% of AGI for various income ranges: 2.3% for AGIs below $25k, 1.9% for AGIs $25k-50k, 1.8% for AGIs $50k-75k, 1.6% for AGIs $75k-100k, 2.0% for AGIs $100k-200k, 2.7% for AGIs over 200k)
Net capital gain/loss in AGI: +$11,262 (reported on 24.7% of returns)
Here:
+$11,262
State:
+$30,460
(% of AGI for various income ranges: 0.3% for AGIs $25k-50k, 0.6% for AGIs $50k-75k, 0.7% for AGIs $75k-100k, 1.2% for AGIs $100k-200k, 9.7% for AGIs over 200k)
Profit/loss from business: +$21,626 (reported on 23.6% of returns)
Here:
+$21,626
State:
+$17,064
(% of AGI for various income ranges: 16.6% for AGIs below $25k, 7.9% for AGIs $25k-50k, 6.5% for AGIs $50k-75k, 6.4% for AGIs $75k-100k, 6.3% for AGIs $100k-200k, 5.0% for AGIs over 200k)
Taxable individual retirement arrangement distribution: $16,527 (reported on 9.4% of returns)
94602:
$16,527
California:
$19,557
(% of AGI for various income ranges: 2.6% for AGIs below $25k, 2.1% for AGIs $25k-50k, 1.9% for AGIs $50k-75k, 2.8% for AGIs $75k-100k, 2.1% for AGIs $100k-200k, 1.5% for AGIs over 200k)
Self-employment retirement plans: $19,541 (reported on 2.6% of returns)
94602:
$19,541
California:
$24,530
(% of AGI for various income ranges: 0.3% for AGIs $25k-50k, 0.4% for AGIs $50k-75k, 0.5% for AGIs $75k-100k, 0.7% for AGIs $100k-200k, 1.0% for AGIs over 200k)
Total itemized deductions: $30,202 (23% of AGI, reported on 43.7% of returns)
Here:
$30,202
State:
$34,004
Here:
22.7% of AGI
State:
22.7% of AGI
(% of AGI for various income ranges: 15.8% for AGIs below $25k, 11.4% for AGIs $25k-50k, 14.4% for AGIs $50k-75k, 20.2% for AGIs $75k-100k, 19.7% for AGIs $100k-200k, 16.2% for AGIs over 200k)
Charity contributions: $2,880 (reported on 36.1% of returns)
Here:
$2,880
State:
$4,659
(% of AGI for various income ranges: 0.7% for AGIs below $25k, 1.0% for AGIs $25k-50k, 1.2% for AGIs $50k-75k, 1.4% for AGIs $75k-100k, 1.5% for AGIs $100k-200k, 1.4% for AGIs over 200k)
Taxes paid: $13,663 (reported on 43.6% of returns)
94602:
$13,663
State:
$14,448
(% of AGI for various income ranges: 3.1% for AGIs below $25k, 2.9% for AGIs $25k-50k, 4.7% for AGIs $50k-75k, 8.4% for AGIs $75k-100k, 9.1% for AGIs $100k-200k, 9.4% for AGIs over 200k)
Earned income credit: $1,927 (reported on 13.7% of returns)
Here:
$1,927
State:
$2,286
(% of AGI for various income ranges: 5.6% for AGIs below $25k, 0.7% for AGIs $25k-50k)
Percentage of individuals using paid preparers for their 2012 taxes: 53.3%
Here:
53%
State:
64%
(% for various income ranges: 49.6% for AGIs below $25k, 51.0% for AGIs $25k-50k, 53.3% for AGIs $50k-75k, 56.3% for AGIs $75k-100k, 57.1% for AGIs $100k-200k, 62.5% for AGIs over 200k)
Averages for the 2004 tax year for zip code 94602, filed in 2005:
Average Adjusted Gross Income (AGI) in 2004: $60,433 (Individual Income Tax Returns)
Here:
$60,433
State:
$58,600
Salary/wage: $56,005 (reported on 82.1% of returns)
Here:
$56,005
State:
$49,455
(% of AGI for various income ranges: 168.7% for AGIs below $10k, 71.6% for AGIs $10k-25k, 81.5% for AGIs $25k-50k, 80.1% for AGIs $50k-75k, 77.2% for AGIs $75k-100k, 72.4% for AGIs over 100k)
Taxable interest for individuals: $1,546 (reported on 53.8% of returns)
This zip code:
$1,546
California:
$2,365
(% of AGI for various income ranges: 14.6% for AGIs below $10k, 2.5% for AGIs $10k-25k, 1.4% for AGIs $25k-50k, 1.4% for AGIs $50k-75k, 1.6% for AGIs $75k-100k, 1.0% for AGIs over 100k)
Taxable dividends: $3,050 (reported on 32.9% of returns)
Here:
$3,050
State:
$4,746
(% of AGI for various income ranges: 10.8% for AGIs below $10k, 2.2% for AGIs $10k-25k, 1.5% for AGIs $25k-50k, 1.7% for AGIs $50k-75k, 1.9% for AGIs $75k-100k, 1.5% for AGIs over 100k)
Net capital gain/loss: +$10,915 (reported on 27.4% of returns)
Here:
+$10,915
State:
+$23,418
(% of AGI for various income ranges: -2.3% for AGIs below $10k, 0.4% for AGIs $10k-25k, 0.3% for AGIs $25k-50k, 1.0% for AGIs $50k-75k, 1.7% for AGIs $75k-100k, 9.0% for AGIs over 100k)
Profit/loss from business: +$19,211 (reported on 21.9% of returns)
Here:
+$19,211
State:
+$16,826
(% of AGI for various income ranges: 15.5% for AGIs below $10k, 12.0% for AGIs $10k-25k, 6.9% for AGIs $25k-50k, 6.0% for AGIs $50k-75k, 7.9% for AGIs $75k-100k, 6.4% for AGIs over 100k)
IRA payment deduction: $3,206 (reported on 4.1% of returns)
94602:
$3,206
California:
$3,192
(% of AGI for various income ranges: 1.1% for AGIs below $10k, 0.6% for AGIs $10k-25k, 0.5% for AGIs $25k-50k, 0.2% for AGIs $50k-75k, 0.2% for AGIs $75k-100k, 0.1% for AGIs over 100k)
Self-employed pension: $13,210 (reported on 3.6% of returns)
Here:
$13,210
California:
$17,688
(% of AGI for various income ranges: 0.4% for AGIs $10k-25k, 0.4% for AGIs $25k-50k, 0.5% for AGIs $50k-75k, 0.9% for AGIs $75k-100k, 1.0% for AGIs over 100k)
Total itemized deductions: $25,447 (25% of AGI, reported on 43.5% of returns)
Here:
$25,447
State:
$28,113
Here:
24.9% of AGI
State:
25.3% of AGI
(% of AGI for various income ranges: 38.9% for AGIs below $10k, 15.1% for AGIs $10k-25k, 13.8% for AGIs $25k-50k, 18.2% for AGIs $50k-75k, 21.4% for AGIs $75k-100k, 19.1% for AGIs over 100k)
Charity contributions deductions: $2,702 (3% of AGI, reported on 38.1% of returns)
Here:
$2,702
State:
$3,923
Here:
2.5% of AGI
State:
3.3% of AGI
(% of AGI for various income ranges: 1.3% for AGIs below $10k, 1.0% for AGIs $10k-25k, 1.4% for AGIs $25k-50k, 1.6% for AGIs $50k-75k, 1.9% for AGIs $75k-100k, 1.9% for AGIs over 100k)
Total tax: $10,141 (reported on 81.7% of returns)
94602:
$10,141
State:
$10,761
(% of AGI for various income ranges: 8.7% for AGIs below $10k, 5.2% for AGIs $10k-25k, 8.2% for AGIs $25k-50k, 11.1% for AGIs $50k-75k, 12.1% for AGIs $75k-100k, 17.6% for AGIs over 100k)
Earned income credit: $1,535 (reported on 11.9% of returns)
Here:
$1,535
State:
$1,763
Percentage of individuals using paid preparers for their 2004 taxes: 58.9%
Here:
59%
State:
66%
(% for various income ranges: 56.0% for AGIs below $10k, 60.8% for AGIs $10k-25k, 56.6% for AGIs $25k-50k, 58.1% for AGIs $50k-75k, 59.3% for AGIs $75k-100k, 63.3% for AGIs over 100k)
Likely homosexual households (counted as self-reported same-sex unmarried-partner households)
Lesbian couples: 0.7% of all households
Gay men: 0.8% of all households
Household received Food Stamps/SNAP in the past 12 months: 1,415 Household did not receive Food Stamps/SNAP in the past 12 months: 10,859
Women who had a birth in the past 12 months: 352 (292 now married, 59 unmarried) Women who did not have a birth in the past 12 months: 6,938 (2,906 now married, 4,025 unmarried)
Housing units in zip code 94602 with a mortgage: 5,307 (622 second mortgage, 22 home equity loan, 513 both second mortgage and home equity loan) Houses without a mortgage: 157
Median monthly owner costs for units with a mortgage: $3,876 Median monthly owner costs for units without a mortgage: $908
Residents with income below the poverty level in 2022:
This zip code:
7.5%
Whole state:
12.2%
Residents with income below 50% of the poverty level in 2022:
This zip code:
3.4%
Whole state:
6.2%
Median number of rooms in houses and condos:
Here:
6.1
State:
6.0
Median number of rooms in apartments:
Here:
3.9
State:
3.9
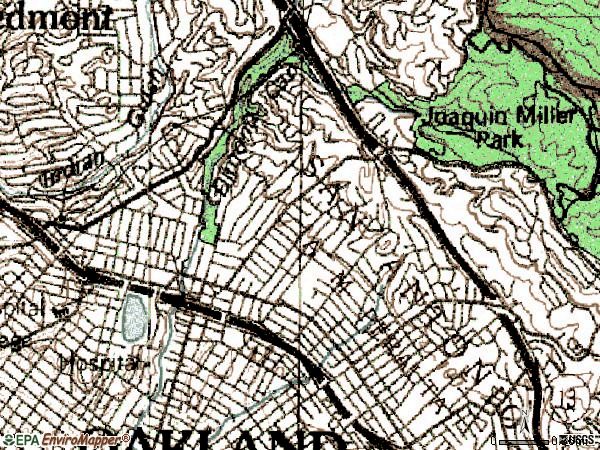
Notable locations in this zip code not listed on our city pages
Notable locations in zip code 94602: Dimond Branch Oakland Public Library (A), Fred Finch Childrens Home (B), Oakland Fire Department Station 25 (C), Woodminster Amphitheatre (D), The Abbey (E), Oakland Fire Department Station 16 (F), Altenheim (G). Display/hide their locations on the map
Churches in zip code 94602 include: Park Boulevard Presbyterian Church (A), Saint Jarlaths Roman Catholic Church (B), Saint Pauls Lutheran Church (C), Bethany Congregational Church (D), Bethel Assembly of God Church (E), Brookshire Baptist Church (F), Calvary Chapel (G), Calvary Gospel Church (H), Church of Christ (I). Display/hide their locations on the map
Parks in zip code 94602 include: Terrace Ave Playground (1), Central Reservoir Recreation Area (2), W D Wood Park (3), Dimond Canyon Park (4). Display/hide their locations on the map
Tourist attraction (not listed on the city page) : A Friend in Town (2626 Nicol Avenue).
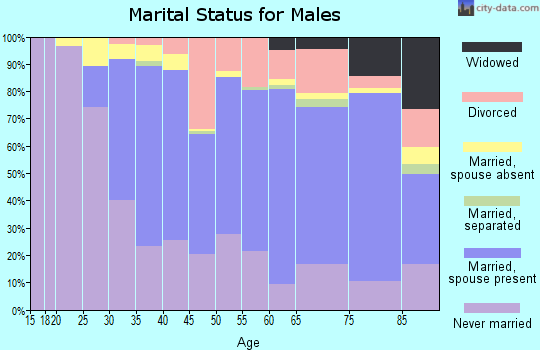
3,900 married couples with children.
1,064 single-parent households (275 men, 789 women).
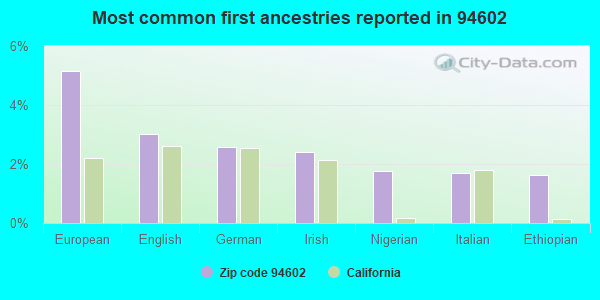
68.2% of residents of 94602 zip code speak English at home.
11.8% of residents speak Spanish at home (74% very well, 11% well, 10% not well, 5% not at all).
3.3% of residents speak other Indo-European language at home (80% very well, 17% well, 3% not well).
13.3% of residents speak Asian or Pacific Island language at home (46% very well, 21% well, 22% not well, 10% not at all).
3.3% of residents speak other language at home (75% very well, 12% well, 14% not well).
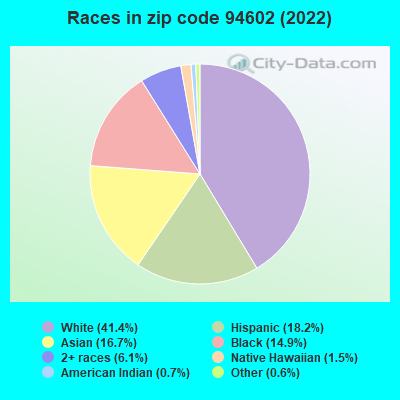
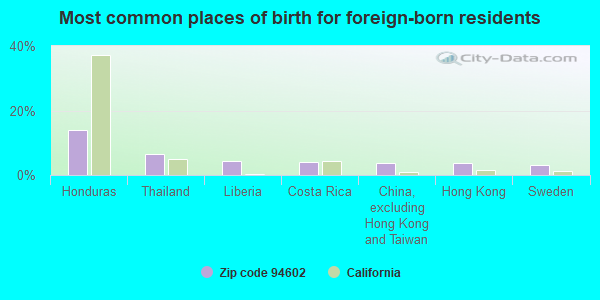
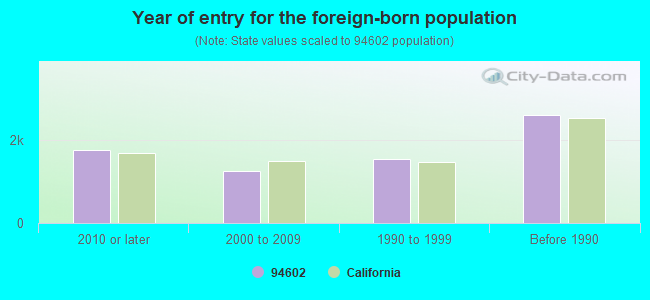
Foreign born population: 6,605 (21.4%) (63.1% of them are naturalized citizens)
Facilities with environmental interests located in this zip code:
HI HAT CLEANERS (2996 MACARTHUR BLVD in OAKLAND, CA)
STATE MASTER (California - Hazardous Waste Tracking) - HAZARDOU WASTE PROGRAM Small Quantity Generators, between 100 kg and 1000 kg of hazardous waste/month (Resource Conservation and Recovery Act (tracking hazardous waste)) - notification Organizations: BROOK BOB (CONTACT/OWNER)
EQUILON ENTERPRISES (7915 E 14TH/79TH AVE in OAKLAND, CA) . Federal Facility
STATE MASTER (California - Hazardous Waste Tracking) - HAZARDOU WASTE PROGRAM Small Quantity Generators, between 100 kg and 1000 kg of hazardous waste/month (Resource Conservation and Recovery Act (tracking hazardous waste)) - notification Organizations: EQUILON ENTERPRISES, LLC (CONTACT/OWNER)
Alternative names: SHELL OIL CO
HART BRET MIDDLE SCHOOL (3700 COOLIDGE AVE in OAKLAND, CA)
STATE MASTER (California - Hazardous Waste Tracking) - HAZARDOU WASTE PROGRAM Small Quantity Generators, between 100 kg and 1000 kg of hazardous waste/month (Resource Conservation and Recovery Act (tracking hazardous waste)) - notification Organizations: OAKLAND UNIFIED SCHOOL DIST (CONTACT/OWNER)
Alternative names: HARTE (BRET) MIDDLE
CHEVRON STATION NO 93415 (4500 PARK BLVD in OAKLAND, CA)
STATE MASTER (California - Hazardous Waste Tracking) - HAZARDOU WASTE PROGRAM Small Quantity Generators, between 100 kg and 1000 kg of hazardous waste/month (Resource Conservation and Recovery Act (tracking hazardous waste)) - notification Organizations: CHEVRON PRODUCTS CO (CONTACT/OWNER)
FRUITVALE ELEMENTARY (3200 BOSTON AVE. in OAKLAND, CA)
(National Center for Education Statistics) - STATE ID-6001838 Organizations: OAKLAND UNIFIED (SCHOOL DISTRICT)
GLENVIEW ELEMENTARY (4215 LA CRESTA AVE. in OAKLAND, CA)
(National Center for Education Statistics) - STATE ID-6001853 Organizations: OAKLAND UNIFIED (SCHOOL DISTRICT)
MAURICE J OBRIEN TRUCKING (3028 JORDAN RD in OAKLAND, CA)
TRANSPORTER (Resource Conservation and Recovery Act (tracking hazardous waste)) Small Quantity Generators, between 100 kg and 1000 kg of hazardous waste/month (Resource Conservation and Recovery Act (tracking hazardous waste)) Organizations: PATRICK OBRIEN (CONTACT/OWNER)
Alternative names: PATRICK OBRIEN TRUCKING
CHEVRON 210208 (6006 INTERNATIONAL BLVD in OAKLAND, CA)
HAZARDOUS WASTE BIENNIAL REPORTER (Resource Conservation and Recovery Act (tracking hazardous waste)) Large Quantity Generators, more that 1000 kg of hazardous waste/month (Resource Conservation and Recovery Act (tracking hazardous waste))
ALPINE CLEANERS (3800 PARK BOULEVARD in OAKLAND, CA)
CRITERIA AND HAZARDOUS AIR POLLUTANT INVENTORY (Inventory of air pollution sources) Small Quantity Generators, between 100 kg and 1000 kg of hazardous waste/month (Resource Conservation and Recovery Act (tracking hazardous waste)) - notification Business SIC classification: DRYCLEANING PLANTS, EXCEPT RUG CLEANING
FRIENDLY CAB INC (4849 E 12TH STREET in OAKLAND, CA)
CRITERIA AND HAZARDOUS AIR POLLUTANT INVENTORY (Inventory of air pollution sources) Business SIC classification: TOP, BODY, AND UPHOLSTERY REPAIR SHOPS AND PAINT SHOPS
HIGHLAND GENERAL HOSPITAL (1411 E 31ST STREET in OAKLAND, CA)
CRITERIA AND HAZARDOUS AIR POLLUTANT INVENTORY (Inventory of air pollution sources) Business SIC classification: GENERAL MEDICAL AND SURGICAL HOSPITALS
HOLIDAY CLEANERS (1431 LEIMERT BLVD in OAKLAND, CA)
CRITERIA AND HAZARDOUS AIR POLLUTANT INVENTORY (Inventory of air pollution sources) Business SIC classification: DRYCLEANING PLANTS, EXCEPT RUG CLEANING
LINCOLN CHILD CENTER (4368 LINCOLN AVE in OAKLAND, CA)
COMPLIANCE ACTIVITY (Tracking inspections of insecticide, fungicide, and rodenticide, and toxic substances)
Housing units lacking complete plumbing facilities: 1.3% Housing units lacking complete kitchen facilities: 0.8%
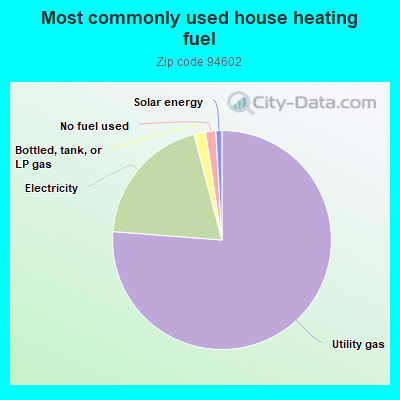
76.0%Utility gas
19.6%Electricity
1.7%Bottled, tank, or LP gas
1.5%No fuel used
0.9%Solar energy
Population in 1990: 28,629. Population change in the 1990s: +251 (+0.9%).
Place of birth for U.S.-born residents:
This state: 16,364
Northeast: 2,107
Midwest: 2,061
South: 1,989
West: 1,083
58% of the 94602 zip code residents lived in the same house 5 years ago. Out of people who lived in different houses, 63% lived in this county. Out of people who lived in different counties, 50% lived in California.
91% of the 94602 zip code residents lived in the same house 1 year ago. Out of people who lived in different houses, 58% moved from this county. Out of people who lived in different houses, 28% moved from different county within same state. Out of people who lived in different houses, 10% moved from different state. Out of people who lived in different houses, 5% moved from abroad.
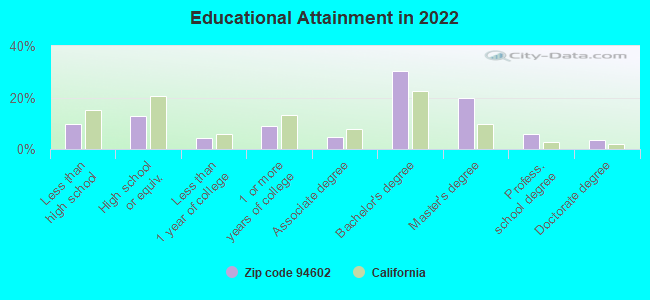
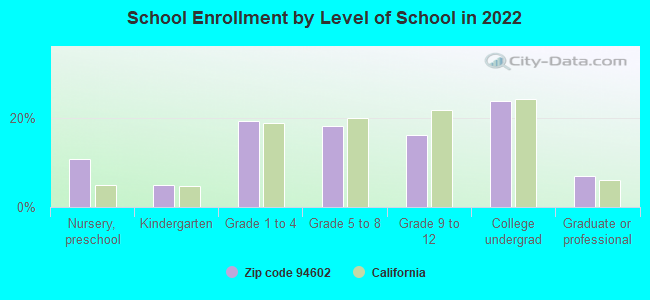
Private vs. public school enrollment:
Students in private schools in grades 1 to 8 (elementary and middle school): 595
Here:
25.1%
California:
10.5%
Students in private schools in grades 9 to 12 (high school): 260
Here:
25.7%
California:
8.5%
Students in private undergraduate colleges: 299
Here:
20.2%
California:
15.9%
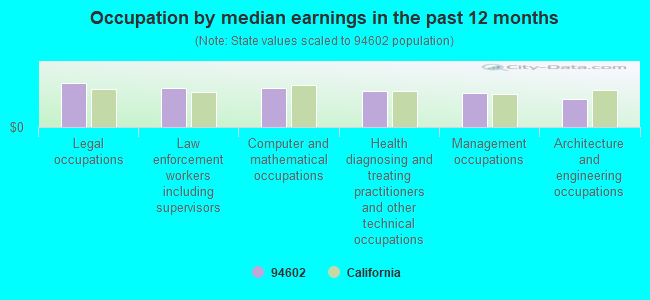
Occupation by median earnings in the past 12 months ($)
166,527Legal occupations
148,558Law enforcement workers including supervisors
147,689Computer and mathematical occupations
136,895Health diagnosing and treating practitioners and other technical occupations
127,849Management occupations
107,437Architecture and engineering occupations
Companies with federal contracts located in this zip code:
FIRST BUILDING MAINTENANCE (2103 MACARTHUR BLVD in OAKLAND, CA; small business) : $7,080 in 3 contractsfrom 2003 to 2005
$2,520 with Army for Landscaping/Groundskeeping Services. Signed on 2005-09-01. Completion date: 2006-08-31.
$2,400, same as above.Signed on 2004-08-19. Completion date: 2005-08-31.
$2,160 with Army for Miscellaneous Maintenance and Repair Shop Specialized Equipment. Signed on 2003-04-24. Completion date: 2004-04-30.
Top industries in this zip code by the number of employees in 2005:
Health Care and Social Assistance: General Medical and Surgical Hospitals (over 1000 employees: 1 establishment)
Health Care and Social Assistance: Residential Mental Health and Substance Abuse Facilities (250-499: 1, 5-9: 1)
2005 - 2018 National Fire Incident Reporting System (NFIRS) incidents
According to the data from the years 2005 - 2018 the average number of fire incidents per year is 23. The highest number of reported fire incidents - 70 took place in 2005, and the least - 0 in 2010. The data has a decreasing trend.
When looking into fire subcategories, the most reports belonged to: Outside Fires (34.8%), and Structure Fires (32.0%).
Fire incident types reported to NFIRS in Zip Code 94602


 Nearest zip codes: 94611, 94601, 94613, 94610, 94606, 94618.


 According to the data from the years 2005 - 2018 the average number of fire incidents per year is 23. The highest number of reported fire incidents - 70 took place in 2005, and the least - 0 in 2010. The data has a decreasing trend.
 When looking into fire subcategories, the most reports belonged to: Outside Fires (34.8%), and Structure Fires (32.0%).