Estimated zip code population in 2022: 39,449 Zip code population in 2010: 36,565 Zip code population in 2000: 36,508
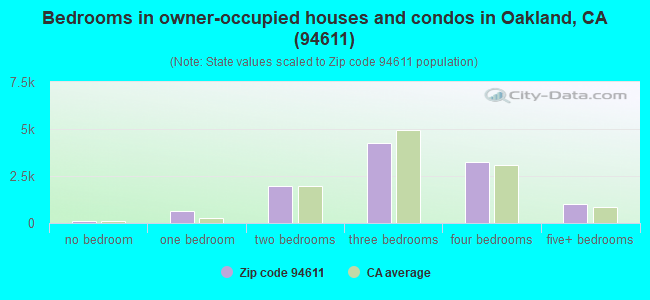
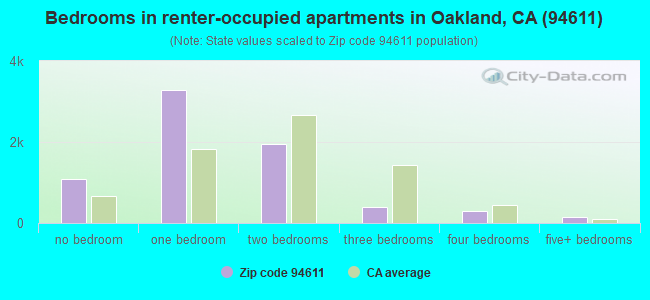
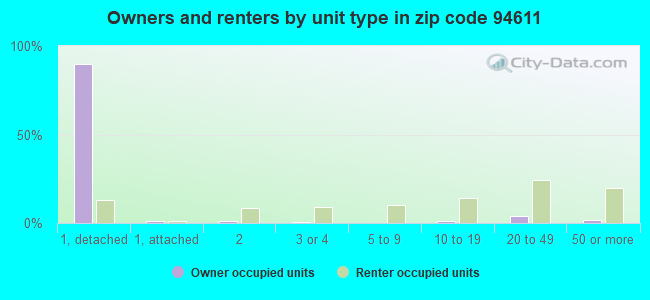
Houses and condos: 19,253 Renter-occupied apartments: 7,130
% of renters here:
39%
State:
44%
March 2022 cost of living index in zip code 94611: 120.1 (high, U.S. average is 100)
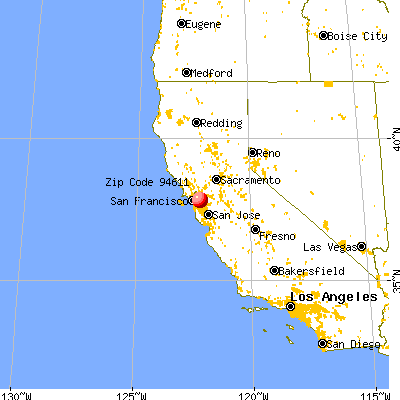
Land area: 10.6 sq. mi. Water area: 0.0 sq. mi.
Population density: 3,736 people per square mile
(average).
OSM Map
General Map
Google Map
MSN Map
OSM Map
General Map
Google Map
MSN Map
OSM Map
General Map
Google Map
MSN Map
OSM Map
General Map
Google Map
MSN Map
Please wait while loading the map...
Real estate property taxes paid for housing units in 2022:
This zip code:
0.7% ($10,292)
California:
0.7% ($4,831)
Median real estate property taxes paid for housing units with mortgages in 2022: $10,330 (0.7%) Median real estate property taxes paid for housing units with no mortgage in 2022: $8,639 (0.6%)
Estimated median house/condo value in 2022: $1,530,178
94611:
$1,530,178
California:
$715,900
According to our research of California and other state lists, there were 20 registered sex offenders living in 94611 zip code as of April 27, 2024. The ratio of all residents to sex offenders in zip code 94611 is 1,922 to 1. The ratio of registered sex offenders to all residents in this zip code is much lower than the state average.
Median resident age:
This zip code:
45.7 years
California median age:
37.9 years
Average household size:
This zip code:
2.1 people
California:
2.8 people
Averages for the 2020 tax year for zip code 94611, filed in 2021:
Average Adjusted Gross Income (AGI) in 2020: $259,270 (Individual Income Tax Returns)
Here:
$259,270
State:
$95,910
Salary/wage: $207,533 (reported on 75.0% of returns)
Here:
$207,533
State:
$77,331
(% of AGI for various income ranges: 1148.9% for AGIs below $25k, 3774.4% for AGIs $25k-50k, 7188.1% for AGIs $50k-75k, 10794.1% for AGIs $75k-100k, 19416.0% for AGIs $100k-200k, 183385.0% for AGIs over 200k)
Taxable interest for individuals: $4,039 (reported on 58.1% of returns)
This zip code:
$4,039
California:
$2,294
(% of AGI for various income ranges: 47.1% for AGIs below $25k, 64.8% for AGIs $25k-50k, 124.8% for AGIs $50k-75k, 156.5% for AGIs $75k-100k, 268.9% for AGIs $100k-200k, 2742.1% for AGIs over 200k)
Ordinary dividends: $26,490 (reported on 51.7% of returns)
Here:
$26,490
State:
$10,949
(% of AGI for various income ranges: 170.5% for AGIs below $25k, 247.7% for AGIs $25k-50k, 411.1% for AGIs $50k-75k, 510.6% for AGIs $75k-100k, 1150.5% for AGIs $100k-200k, 17530.7% for AGIs over 200k)
Net capital gain/loss in AGI: +$75,932 (reported on 48.7% of returns)
Here:
+$75,932
State:
+$49,306
(% of AGI for various income ranges: 88.3% for AGIs below $25k, 166.0% for AGIs $25k-50k, 232.1% for AGIs $50k-75k, 465.4% for AGIs $75k-100k, 1310.4% for AGIs $100k-200k, 52592.2% for AGIs over 200k)
Profit/loss from business: +$42,916 (reported on 23.8% of returns)
Here:
+$42,916
State:
+$15,671
(% of AGI for various income ranges: 258.7% for AGIs below $25k, 498.6% for AGIs $25k-50k, 625.0% for AGIs $50k-75k, 1062.5% for AGIs $75k-100k, 1785.3% for AGIs $100k-200k, 10324.5% for AGIs over 200k)
Taxable individual retirement arrangement distribution: $34,949 (reported on 12.6% of returns)
94611:
$34,949
California:
$23,505
(% of AGI for various income ranges: 103.5% for AGIs below $25k, 176.7% for AGIs $25k-50k, 308.4% for AGIs $50k-75k, 505.2% for AGIs $75k-100k, 1234.8% for AGIs $100k-200k, 3741.4% for AGIs over 200k)
Self-employed (Keogh) retirement plans: $39,265 (reported on 4.9% of returns)
94611:
$39,265
California:
$30,163
(% of AGI for various income ranges: 23.7% for AGIs $25k-50k, 37.9% for AGIs $50k-75k, 102.2% for AGIs $75k-100k, 255.3% for AGIs $100k-200k, 2383.4% for AGIs over 200k)
Total itemized deductions: $50,238 (reported on 32.1% of returns)
Here:
$50,238
State:
$39,517
(% of AGI for various income ranges: 303.8% for AGIs below $25k, 500.1% for AGIs $25k-50k, 757.2% for AGIs $50k-75k, 1250.7% for AGIs $75k-100k, 2435.5% for AGIs $100k-200k, 17894.6% for AGIs over 200k)
Charity contributions: $20,493 (reported on 27.3% of returns)
Here:
$20,493
State:
$12,598
(% of AGI for various income ranges: 11.7% for AGIs below $25k, 35.6% for AGIs $25k-50k, 69.7% for AGIs $50k-75k, 127.8% for AGIs $75k-100k, 341.7% for AGIs $100k-200k, 7664.6% for AGIs over 200k)
Taxes paid: $9,417 (reported on 32.0% of returns)
94611:
$9,417
State:
$8,807
(% of AGI for various income ranges: 68.3% for AGIs below $25k, 104.6% for AGIs $25k-50k, 196.3% for AGIs $50k-75k, 344.1% for AGIs $75k-100k, 701.5% for AGIs $100k-200k, 2820.9% for AGIs over 200k)
Earned income credit: $988 (reported on 3.9% of returns)
Here:
$988
State:
$2,074
(% of AGI for various income ranges: 29.0% for AGIs below $25k, 19.0% for AGIs $25k-50k)
Percentage of individuals using paid preparers for their 2020 taxes: 92.4%
Here:
92%
State:
92%
(% for various income ranges: 88.5% for AGIs below $25k, 91.3% for AGIs $25k-50k, 90.8% for AGIs $50k-75k, 92.1% for AGIs $75k-100k, 93.3% for AGIs $100k-200k, 94.9% for AGIs over 200k)
Averages for the 2012 tax year for zip code 94611, filed in 2013:
Average Adjusted Gross Income (AGI) in 2012: $160,870 (Individual Income Tax Returns)
Here:
$160,870
State:
$72,726
Salary/wage: $121,184 (reported on 76.0% of returns)
Here:
$121,184
State:
$59,079
(% of AGI for various income ranges: 62.7% for AGIs below $25k, 72.4% for AGIs $25k-50k, 69.3% for AGIs $50k-75k, 65.6% for AGIs $75k-100k, 66.5% for AGIs $100k-200k, 52.5% for AGIs over 200k)
Taxable interest for individuals: $3,949 (reported on 56.6% of returns)
This zip code:
$3,949
California:
$2,146
(% of AGI for various income ranges: 2.8% for AGIs below $25k, 1.1% for AGIs $25k-50k, 1.2% for AGIs $50k-75k, 1.2% for AGIs $75k-100k, 1.0% for AGIs $100k-200k, 1.5% for AGIs over 200k)
Ordinary dividends: $21,912 (reported on 45.6% of returns)
Here:
$21,912
State:
$9,308
(% of AGI for various income ranges: 7.7% for AGIs below $25k, 3.5% for AGIs $25k-50k, 3.4% for AGIs $50k-75k, 3.9% for AGIs $75k-100k, 3.6% for AGIs $100k-200k, 7.4% for AGIs over 200k)
Net capital gain/loss in AGI: +$39,091 (reported on 40.8% of returns)
Here:
+$39,091
State:
+$30,460
(% of AGI for various income ranges: 0.3% for AGIs below $25k, 1.0% for AGIs $25k-50k, 1.1% for AGIs $50k-75k, 1.5% for AGIs $75k-100k, 2.1% for AGIs $100k-200k, 13.9% for AGIs over 200k)
Profit/loss from business: +$38,939 (reported on 25.0% of returns)
Here:
+$38,939
State:
+$17,064
(% of AGI for various income ranges: 14.7% for AGIs below $25k, 9.1% for AGIs $25k-50k, 7.9% for AGIs $50k-75k, 8.4% for AGIs $75k-100k, 7.4% for AGIs $100k-200k, 5.0% for AGIs over 200k)
Taxable individual retirement arrangement distribution: $36,760 (reported on 13.9% of returns)
94611:
$36,760
California:
$19,557
(% of AGI for various income ranges: 4.2% for AGIs below $25k, 2.7% for AGIs $25k-50k, 3.5% for AGIs $50k-75k, 4.3% for AGIs $75k-100k, 4.5% for AGIs $100k-200k, 2.7% for AGIs over 200k)
Self-employment retirement plans: $32,252 (reported on 5.5% of returns)
94611:
$32,252
California:
$24,530
(% of AGI for various income ranges: 0.2% for AGIs below $25k, 0.4% for AGIs $25k-50k, 0.5% for AGIs $50k-75k, 0.9% for AGIs $75k-100k, 0.9% for AGIs $100k-200k, 1.3% for AGIs over 200k)
Total itemized deductions: $55,907 (21% of AGI, reported on 54.6% of returns)
Here:
$55,907
State:
$34,004
Here:
21.2% of AGI
State:
22.7% of AGI
(% of AGI for various income ranges: 23.7% for AGIs below $25k, 13.9% for AGIs $25k-50k, 14.9% for AGIs $50k-75k, 19.0% for AGIs $75k-100k, 21.5% for AGIs $100k-200k, 18.8% for AGIs over 200k)
Charity contributions: $8,651 (reported on 46.4% of returns)
Here:
$8,651
State:
$4,659
(% of AGI for various income ranges: 1.0% for AGIs below $25k, 1.1% for AGIs $25k-50k, 1.2% for AGIs $50k-75k, 1.6% for AGIs $75k-100k, 1.8% for AGIs $100k-200k, 3.0% for AGIs over 200k)
Taxes paid: $29,441 (reported on 54.4% of returns)
94611:
$29,441
State:
$14,448
(% of AGI for various income ranges: 5.8% for AGIs below $25k, 3.8% for AGIs $25k-50k, 5.1% for AGIs $50k-75k, 7.5% for AGIs $75k-100k, 9.9% for AGIs $100k-200k, 11.0% for AGIs over 200k)
Earned income credit: $1,021 (reported on 5.6% of returns)
Here:
$1,021
State:
$2,286
(% of AGI for various income ranges: 1.8% for AGIs below $25k, 0.2% for AGIs $25k-50k)
Percentage of individuals using paid preparers for their 2012 taxes: 54.0%
Here:
54%
State:
64%
(% for various income ranges: 44.6% for AGIs below $25k, 43.6% for AGIs $25k-50k, 48.4% for AGIs $50k-75k, 55.6% for AGIs $75k-100k, 58.8% for AGIs $100k-200k, 72.2% for AGIs over 200k)
Averages for the 2004 tax year for zip code 94611, filed in 2005:
Average Adjusted Gross Income (AGI) in 2004: $130,358 (Individual Income Tax Returns)
Here:
$130,358
State:
$58,600
Salary/wage: $97,014 (reported on 74.5% of returns)
Here:
$97,014
State:
$49,455
(% of AGI for various income ranges: 63.0% for AGIs $10k-25k, 73.7% for AGIs $25k-50k, 70.5% for AGIs $50k-75k, 66.8% for AGIs $75k-100k, 51.4% for AGIs over 100k)
Taxable interest for individuals: $4,944 (reported on 65.2% of returns)
This zip code:
$4,944
California:
$2,365
(% of AGI for various income ranges: 5.0% for AGIs $10k-25k, 2.6% for AGIs $25k-50k, 2.6% for AGIs $50k-75k, 2.4% for AGIs $75k-100k, 2.3% for AGIs over 100k)
Taxable dividends: $11,876 (reported on 51.6% of returns)
Here:
$11,876
State:
$4,746
(% of AGI for various income ranges: 5.5% for AGIs $10k-25k, 3.3% for AGIs $25k-50k, 3.6% for AGIs $50k-75k, 3.3% for AGIs $75k-100k, 4.8% for AGIs over 100k)
Net capital gain/loss: +$40,571 (reported on 45.4% of returns)
Here:
+$40,571
State:
+$23,418
(% of AGI for various income ranges: 2.2% for AGIs $10k-25k, 1.1% for AGIs $25k-50k, 1.7% for AGIs $50k-75k, 2.6% for AGIs $75k-100k, 17.0% for AGIs over 100k)
Profit/loss from business: +$33,797 (reported on 24.2% of returns)
Here:
+$33,797
State:
+$16,826
(% of AGI for various income ranges: 12.0% for AGIs $10k-25k, 7.5% for AGIs $25k-50k, 8.2% for AGIs $50k-75k, 7.1% for AGIs $75k-100k, 5.8% for AGIs over 100k)
IRA payment deduction: $3,226 (reported on 3.8% of returns)
94611:
$3,226
California:
$3,192
(% of AGI for various income ranges: 0.5% for AGIs $10k-25k, 0.4% for AGIs $25k-50k, 0.2% for AGIs $50k-75k, 0.2% for AGIs $75k-100k, 0.0% for AGIs over 100k)
Self-employed pension: $23,309 (reported on 6.5% of returns)
Here:
$23,309
California:
$17,688
(% of AGI for various income ranges: 0.4% for AGIs $10k-25k, 0.4% for AGIs $25k-50k, 0.8% for AGIs $50k-75k, 1.0% for AGIs $75k-100k, 1.3% for AGIs over 100k)
Total itemized deductions: $43,231 (20% of AGI, reported on 53.3% of returns)
Here:
$43,231
State:
$28,113
Here:
19.6% of AGI
State:
25.3% of AGI
(% of AGI for various income ranges: 20.2% for AGIs $10k-25k, 16.3% for AGIs $25k-50k, 20.0% for AGIs $50k-75k, 23.5% for AGIs $75k-100k, 16.9% for AGIs over 100k)
Charity contributions deductions: $6,987 (3% of AGI, reported on 47.9% of returns)
Here:
$6,987
State:
$3,923
Here:
3.0% of AGI
State:
3.3% of AGI
(% of AGI for various income ranges: 1.3% for AGIs $10k-25k, 1.4% for AGIs $25k-50k, 2.0% for AGIs $50k-75k, 2.3% for AGIs $75k-100k, 2.7% for AGIs over 100k)
Total tax: $29,203 (reported on 86.4% of returns)
94611:
$29,203
State:
$10,761
(% of AGI for various income ranges: 6.1% for AGIs $10k-25k, 9.5% for AGIs $25k-50k, 11.9% for AGIs $50k-75k, 12.4% for AGIs $75k-100k, 21.3% for AGIs over 100k)
Earned income credit: $939 (reported on 4.6% of returns)
Here:
$939
State:
$1,763
Percentage of individuals using paid preparers for their 2004 taxes: 57.0%
Here:
57%
State:
66%
(% for various income ranges: 53.8% for AGIs below $10k, 50.1% for AGIs $10k-25k, 48.7% for AGIs $25k-50k, 52.5% for AGIs $50k-75k, 61.3% for AGIs $75k-100k, 67.8% for AGIs over 100k)
Likely homosexual households (counted as self-reported same-sex unmarried-partner households)
Lesbian couples: 0.4% of all households
Gay men: 0.6% of all households
Household received Food Stamps/SNAP in the past 12 months: 795 Household did not receive Food Stamps/SNAP in the past 12 months: 17,191
Women who had a birth in the past 12 months: 556 (526 now married, 26 unmarried) Women who did not have a birth in the past 12 months: 8,400 (3,526 now married, 4,865 unmarried)
Housing units in zip code 94611 with a mortgage: 7,666 (1,071 second mortgage, 23 home equity loan, 932 both second mortgage and home equity loan) Houses without a mortgage: 60
Median monthly owner costs for units with a mortgage: $3,876 Median monthly owner costs for units without a mortgage: $1,401
Residents with income below the poverty level in 2022:
This zip code:
6.2%
Whole state:
12.2%
Residents with income below 50% of the poverty level in 2022:
This zip code:
2.5%
Whole state:
6.2%
Median number of rooms in houses and condos:
Here:
7.0
State:
6.0
Median number of rooms in apartments:
Here:
3.3
State:
3.9
Notable locations in this zip code not listed on our city pages
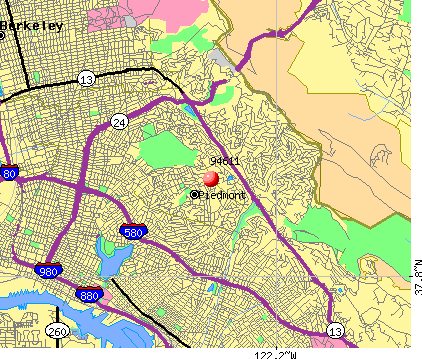
Notable locations in zip code 94611: Piedmont City Hall (A), Piedmont Avenue Branch Oakland Public Library (B), Montclair Branch Oakland Public Library (C), Wildwood (D), Kings Daughters Nursing Home (E), Oakland Fire Department Station 24 (F), Oakland Fire Department Station 6 (G), Piedmont Fire Department (H), Veterans Memorial Building (I). Display/hide their locations on the map
Churches in zip code 94611 include: Central Lutheran Church (A), First Church of Christ Scientist (B), Piedmont Community Church (C), Plymouth Congregational Church (D), Saint Leos Roman Catholic Church (E), First Christian Church (F), Zion Lutheran Church (G), Corpus Christi Roman Catholic Church (H), Chapel of the Chimes (I). Display/hide their locations on the map
Parks in zip code 94611 include: Montclair Playground (1), Mosswood Park (2), Piedmont Recreation Center (3), Piedmont Park (4), Round Top Regional Park (5), North Oakland Regional Sports Cente (6), Oak Glen Park (7), Crocker Park (8), Havens Playground (9). Display/hide their locations on the map
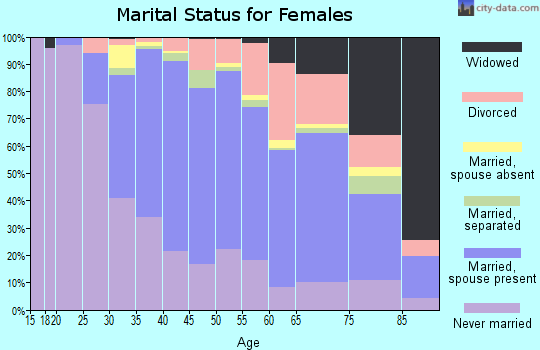
5,482 married couples with children.
1,106 single-parent households (519 men, 587 women).
80.4% of residents of 94611 zip code speak English at home.
3.5% of residents speak Spanish at home (83% very well, 9% well, 7% not well, 1% not at all).
6.0% of residents speak other Indo-European language at home (79% very well, 14% well, 5% not well, 3% not at all).
8.5% of residents speak Asian or Pacific Island language at home (62% very well, 19% well, 14% not well, 4% not at all).
1.8% of residents speak other language at home (76% very well, 22% well, 2% not well).
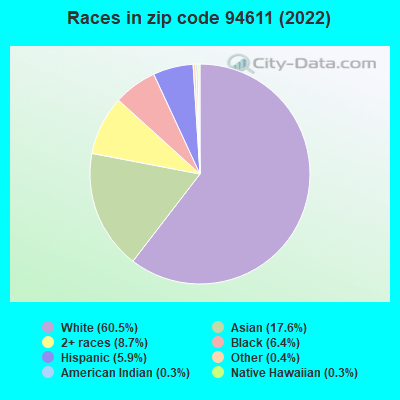
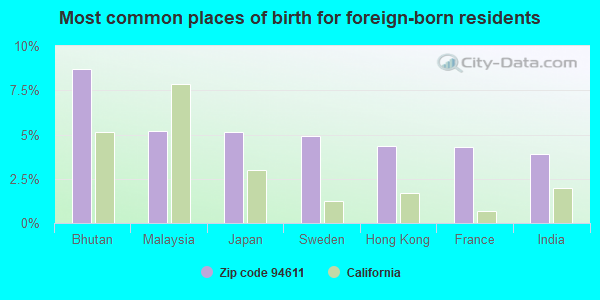
Foreign born population: 6,934 (17.6%) (65.9% of them are naturalized citizens)
Major facilities with environmental interests located in this zip code:
KAISER FOUNDATION HOSPITAL - OAKLAND (280 WEST MACARTHUR BOULEVARD in OAKLAND, CA)
CRITERIA AND HAZARDOUS AIR POLLUTANT INVENTORY (Inventory of air pollution sources) HAZARDOUS WASTE BIENNIAL REPORTER (Resource Conservation and Recovery Act (tracking hazardous waste)) - ICIS-, ENFORCEMENT/COMPLIANCE ACTIVITY Large Quantity Generators, more that 1000 kg of hazardous waste/month (Resource Conservation and Recovery Act (tracking hazardous waste)) - ICIS-, ENFORCEMENT/COMPLIANCE ACTIVITY Business SIC classification: GENERAL MEDICAL AND SURGICAL HOSPITALS; SPECIALTY HOSPITALS, EXCEPT PSYCHIATRIC Business NAICS classification: OFFICES OF PHYSICIANS (EXCEPT MENTAL HEALTH SPECIALISTS).; MEDICAL LABORATORIES.
MONTERA MIDDLE SCHOOL (5555 ASCOT DR in OAKLAND, CA)
STATE MASTER (California - Hazardous Waste Tracking) - HAZARDOU WASTE PROGRAM (National Center for Education Statistics) - STATE ID-6057079 Small Quantity Generators, between 100 kg and 1000 kg of hazardous waste/month (Resource Conservation and Recovery Act (tracking hazardous waste)) - notification Organizations: OAKLAND UNIFIED SCHOOL DIST (CONTACT/OWNER)
, OAKLAND UNIFIED (SCHOOL DISTRICT)
HONDA OF OAKLAND (3741 BROADWAY in OAKLAND, CA)
STATE MASTER (California - Hazardous Waste Tracking) - HAZARDOU WASTE PROGRAM CRITERIA AND HAZARDOUS AIR POLLUTANT INVENTORY (Inventory of air pollution sources) Small Quantity Generators, between 100 kg and 1000 kg of hazardous waste/month (Resource Conservation and Recovery Act (tracking hazardous waste)) - notification Business SIC classification: MOTOR VEHICLE DEALERS (NEW AND USED) Organizations: OAKLAND AUTOMOTIVE GROUP (CONTACT/OWNER)
CHEVRON STATION NO 91740 (6550 MORAGA AVE in OAKLAND, CA)
STATE MASTER (California - Hazardous Waste Tracking) - HAZARDOU WASTE PROGRAM Small Quantity Generators, between 100 kg and 1000 kg of hazardous waste/month (Resource Conservation and Recovery Act (tracking hazardous waste)) - notification Organizations: CHEVRON PRODUCTS CO (CONTACT/OWNER)
Alternative names: CHEVRON 91740, CHEVRON USA INC SERV STA #91740
MOUNTAIN VIEW CEMETERY ASSOCIA (5000 PIEDMONT AVE in OAKLAND, CA)
STATE MASTER (California - Hazardous Waste Tracking) - HAZARDOU WASTE PROGRAM CRITERIA AND HAZARDOUS AIR POLLUTANT INVENTORY (Inventory of air pollution sources) Small Quantity Generators, between 100 kg and 1000 kg of hazardous waste/month (Resource Conservation and Recovery Act (tracking hazardous waste)) - notification Business SIC classification: FUNERAL SERVICE AND CREMATORIES Organizations: MOUNTAIN VIEW CEMETERY ASSC (CONTACT/OWNER)
FULLER OBRIEN PAINTS (3556 PIEDMONT AVE in OAKLAND, CA)
STATE MASTER (California - Hazardous Waste Tracking) - HAZARDOU WASTE PROGRAM Small Quantity Generators, between 100 kg and 1000 kg of hazardous waste/month (Resource Conservation and Recovery Act (tracking hazardous waste)) - notification Organizations: THE GLIDDEN COMPANY (CONTACT/OWNER)
Alternative names: THE GLIDDEN CO DBA ICI PAINTS
GLIDDEN COMPANY (3356 PIEDMONT AVE in OAKLAND, CA)
STATE MASTER (California - Hazardous Waste Tracking) - HAZARDOU WASTE PROGRAM Small Quantity Generators, between 100 kg and 1000 kg of hazardous waste/month (Resource Conservation and Recovery Act (tracking hazardous waste)) - notification Organizations: THE GLIDDEN CO (CONTACT/OWNER)
Alternative names: THE GLIDDEN CO. DBA ICI PAINTS
MERCEDES BENZ OF OAKLAND (370 29TH ST in OAKLAND, CA)
STATE MASTER (California - Hazardous Waste Tracking) - HAZARDOU WASTE PROGRAM Small Quantity Generators, between 100 kg and 1000 kg of hazardous waste/month (Resource Conservation and Recovery Act (tracking hazardous waste)) - notification Organizations: JULES BARSOTTI (CONTACT/OWNER)
HAVENS ELEMENTARY (1800 OAKLAND AVE. in PIEDMONT, CA)
(National Center for Education Statistics) - STATE ID-6002299 Organizations: PIEDMONT CITY UNIFIED (SCHOOL DISTRICT)
LIGHTHOUSE COMMUNITY CHARTER SCHOOL (3040 RICHMOND BLVD. in OAKLAND, CA)
(National Center for Education Statistics) - STATE ID-0130633 Organizations: OAKLAND UNIFIED (SCHOOL DISTRICT)
MILLENNIUM HIGH (CONT.) (800 MAGNOLIA AVE. in PIEDMONT, CA)
(National Center for Education Statistics) - STATE ID-0130286 Organizations: PIEDMONT CITY UNIFIED (SCHOOL DISTRICT)
MILLER (JOAQUIN) ELEMENTARY (5525 ASCOT DR. in OAKLAND, CA)
(National Center for Education Statistics) - STATE ID-6001945 Organizations: OAKLAND UNIFIED (SCHOOL DISTRICT)
MONTCLAIR ELEMENTARY (1757 MOUNTAIN BLVD. in OAKLAND, CA)
(National Center for Education Statistics) - STATE ID-6002083 Organizations: OAKLAND UNIFIED (SCHOOL DISTRICT)
Housing units lacking complete plumbing facilities: 0.8% Housing units lacking complete kitchen facilities: 2.0%
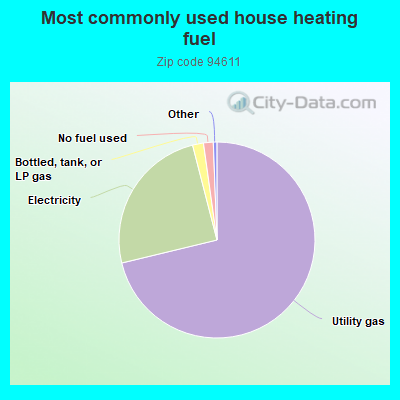
71.3%Utility gas
24.8%Electricity
1.8%Bottled, tank, or LP gas
1.6%No fuel used
Population in 1990: 34,238. Population change in the 1990s: +2,270 (+6.6%).
Place of birth for U.S.-born residents:
This state: 19,425
Northeast: 4,210
Midwest: 3,381
South: 2,897
West: 1,933
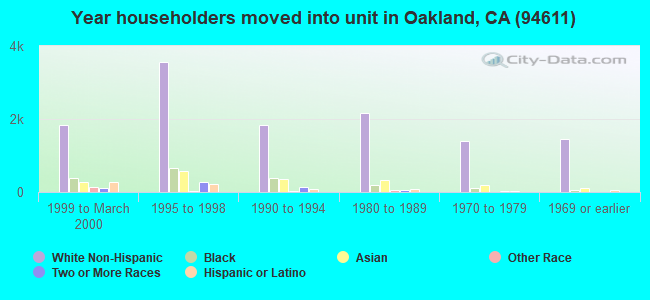
56% of the 94611 zip code residents lived in the same house 5 years ago. Out of people who lived in different houses, 48% lived in this county. Out of people who lived in different counties, 50% lived in California.
86% of the 94611 zip code residents lived in the same house 1 year ago. Out of people who lived in different houses, 58% moved from this county. Out of people who lived in different houses, 20% moved from different county within same state. Out of people who lived in different houses, 14% moved from different state. Out of people who lived in different houses, 6% moved from abroad.
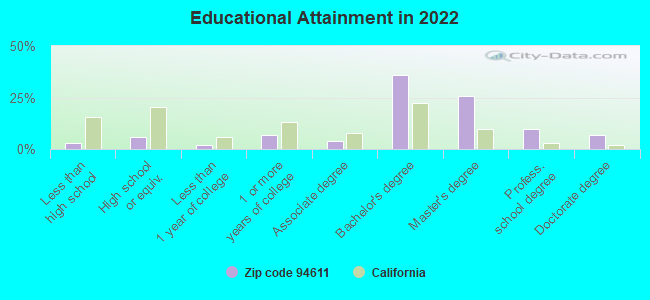
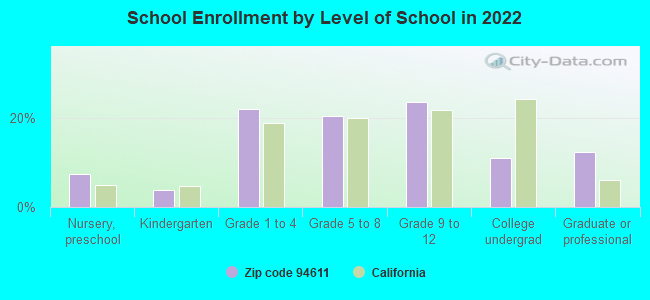
Private vs. public school enrollment:
Students in private schools in grades 1 to 8 (elementary and middle school): 535
Here:
17.7%
California:
10.5%
Students in private schools in grades 9 to 12 (high school): 574
Here:
34.4%
California:
8.5%
Students in private undergraduate colleges: 211
Here:
27.1%
California:
15.9%
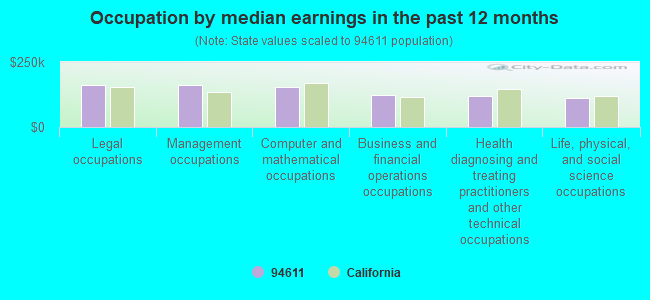
Occupation by median earnings in the past 12 months ($)
162,110Legal occupations
159,725Management occupations
154,957Computer and mathematical occupations
122,351Business and financial operations occupations
120,495Health diagnosing and treating practitioners and other technical occupations
112,705Life, physical, and social science occupations
Companies with federal contracts located in this zip code:
COLE'S PURE HONEY CO, INC (4466 PIEDMONT AVE in OAKLAND, CA; small business) : $359,908 in 6 contractsfrom 2001 to 2005
Contracts for Food Items For Resale, Non-Food Items For Resale by Defense Commissary Agency, Department of Defense Signed by year:2000: $0; 2001: $25,783; 2002: $0; 2003: $0; 2004: $124,460; 2005: $209,665; 2006: $0.
Biggest contracts:
$124,460 with Defense Commissary Agency for Food Items For Resale. Signed on 2004-10-01. Completion date: 2005-02-28.
$75,513 with Defense Commissary Agency for Non-Food Items For Resale. Signed on 2005-10-01. Completion date: 2005-12-31.
$60,816 with Defense Commissary Agency for Food Items For Resale. Signed on 2005-01-01. Completion date: 2005-03-31.
$37,409, same as above.Signed on 2005-09-01. Completion date: 2005-09-30.
SEISMIC ISOLATION ENGINEERING (1200 OAKLAND AVE in PIEDMONT, CA; small business)
$99,544 with Army for Other Research and Development -- Applied Research and Exploratory Development (R&D). Signed on 2004-08-02. Completion date: 2005-02-03.
NAMESYS (6979 EXETER DR in OAKLAND, CA; small business)
$99,000 with Army for Other Defense -- Applied Research and Exploratory Development (R&D). Signed on 2004-08-11. Completion date: 2005-04-11.
COLLINS, WILLIE (30 VISTA DEL MAR CT in OAKLAND, CA; small business) : $92,295 in 2 contractsfrom 2000 to 2001
$64,640 with U.S. Army Corps of Engineers - civil program financing only for Historical Studies. Signed on 2001-06-25. Completion date: 2001-12-13.
$27,655, same as above.Signed on 2000-02-03. Completion date: 2000-07-28.
JONATHAN H FISH MD (33 BONITA AVE in PIEDMONT, CA; small business)
$15,000 with Navy for Radiology Services. Taking place in VA. Signed on 2004-09-20. Completion date: 2005-09-19.
Top industries in this zip code by the number of employees in 2005:
Health Care and Social Assistance: Offices of Physicians (except Mental Health Specialists) (over 1000 employees: 1 establishment, 5-9 employees: 3 establishments, 1-4 employees: 15 establishments)
Health Care and Social Assistance: General Medical and Surgical Hospitals (over 1000: 1, 5-9: 1)
2005 - 2018 National Fire Incident Reporting System (NFIRS) incidents
Based on the data from the years 2005 - 2018 the average number of fire incidents per year is 18. The highest number of fire incidents - 44 took place in 2018, and the least - 0 in 2013. The data has a rising trend.
When looking into fire subcategories, the most reports belonged to: Structure Fires (38.2%), and Outside Fires (35.8%).
Fire incident types reported to NFIRS in Zip Code 94611


 Nearest zip codes: 94602, 94618, 94516, 94610, 94705, 94613.
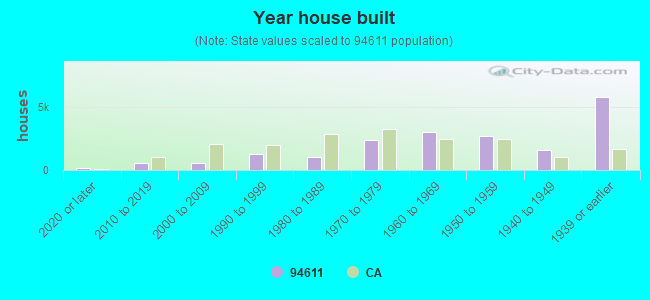


 Based on the data from the years 2005 - 2018 the average number of fire incidents per year is 18. The highest number of fire incidents - 44 took place in 2018, and the least - 0 in 2013. The data has a rising trend.
 When looking into fire subcategories, the most reports belonged to: Structure Fires (38.2%), and Outside Fires (35.8%).