Estimated zip code population in 2022: 14,387 Zip code population in 2010: 12,762 Zip code population in 2000: 12,443
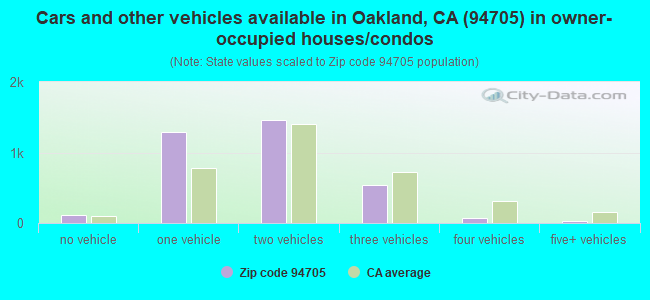
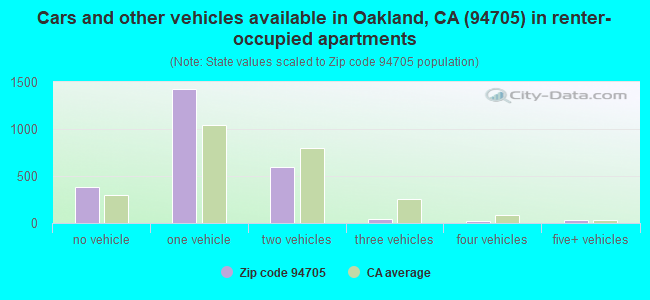
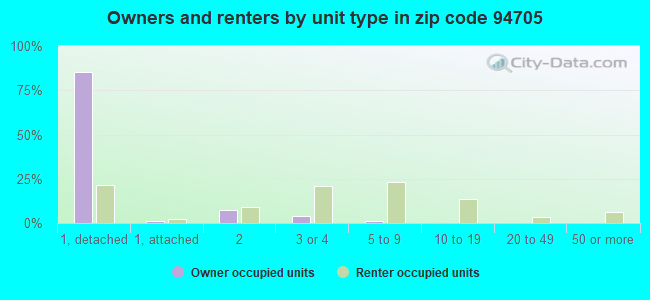
Houses and condos: 6,461 Renter-occupied apartments: 2,486
% of renters here:
42%
State:
44%
March 2022 cost of living index in zip code 94705: 123.8 (high, U.S. average is 100)
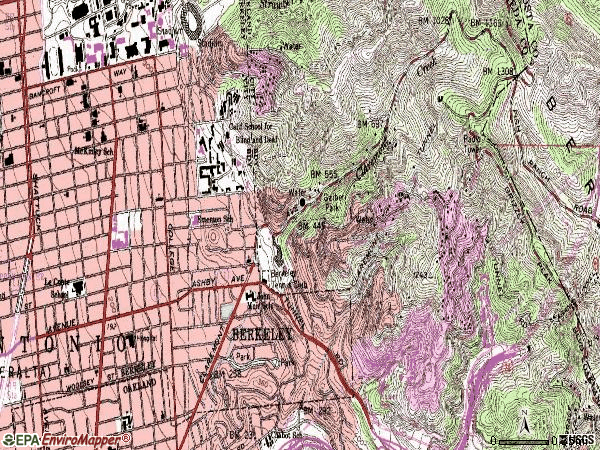
Land area: 3.3 sq. mi. Water area: 0.0 sq. mi.
Population density: 4,354 people per square mile
(average).
OSM Map
General Map
Google Map
MSN Map
OSM Map
General Map
Google Map
MSN Map
OSM Map
General Map
Google Map
MSN Map
OSM Map
General Map
Google Map
MSN Map
Please wait while loading the map...
Real estate property taxes paid for housing units in 2022:
This zip code:
0.5% ($10,292)
California:
0.7% ($4,831)
Median real estate property taxes paid for housing units with mortgages in 2022: $10,330 (0.5%) Median real estate property taxes paid for housing units with no mortgage in 2022: $7,085 (0.4%)
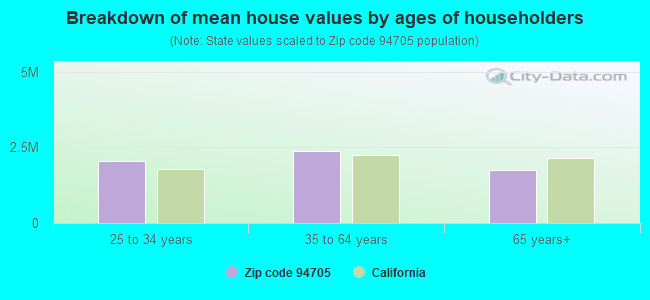
Estimated median house/condo value in 2022: $1,896,869
94705:
$1,896,869
California:
$715,900
According to our research of California and other state lists, there were 4 registered sex offenders living in 94705 zip code as of April 27, 2024. The ratio of all residents to sex offenders in zip code 94705 is 3,351 to 1. The ratio of registered sex offenders to all residents in this zip code is much lower than the state average.
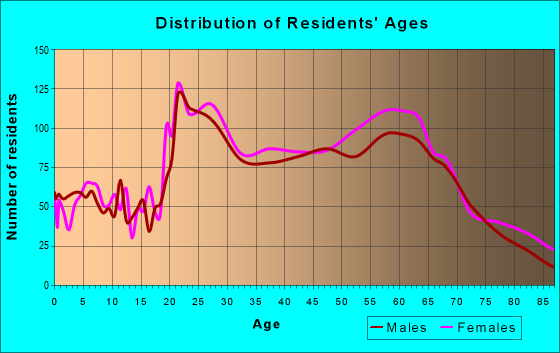
Median resident age:
This zip code:
44.6 years
California median age:
37.9 years
Average household size:
This zip code:
2.4 people
California:
2.8 people
Averages for the 2020 tax year for zip code 94705, filed in 2021:
Average Adjusted Gross Income (AGI) in 2020: $233,932 (Individual Income Tax Returns)
Here:
$233,932
State:
$95,910
Salary/wage: $169,526 (reported on 71.7% of returns)
Here:
$169,526
State:
$77,331
(% of AGI for various income ranges: 1131.6% for AGIs below $25k, 3893.8% for AGIs $25k-50k, 7219.2% for AGIs $50k-75k, 9242.6% for AGIs $75k-100k, 19216.5% for AGIs $100k-200k, 181850.3% for AGIs over 200k)
Taxable interest for individuals: $5,630 (reported on 58.1% of returns)
This zip code:
$5,630
California:
$2,294
(% of AGI for various income ranges: 37.4% for AGIs below $25k, 113.5% for AGIs $25k-50k, 127.6% for AGIs $50k-75k, 200.6% for AGIs $75k-100k, 401.6% for AGIs $100k-200k, 5196.7% for AGIs over 200k)
Ordinary dividends: $23,337 (reported on 53.5% of returns)
Here:
$23,337
State:
$10,949
(% of AGI for various income ranges: 153.6% for AGIs below $25k, 289.2% for AGIs $25k-50k, 564.8% for AGIs $50k-75k, 612.4% for AGIs $75k-100k, 1720.8% for AGIs $100k-200k, 19768.6% for AGIs over 200k)
Net capital gain/loss in AGI: +$84,517 (reported on 51.0% of returns)
Here:
+$84,517
State:
+$49,306
(% of AGI for various income ranges: 83.6% for AGIs below $25k, 246.0% for AGIs $25k-50k, 420.2% for AGIs $50k-75k, 520.3% for AGIs $75k-100k, 1801.5% for AGIs $100k-200k, 81166.4% for AGIs over 200k)
Profit/loss from business: +$38,762 (reported on 26.7% of returns)
Here:
+$38,762
State:
+$15,671
(% of AGI for various income ranges: 285.1% for AGIs below $25k, 589.3% for AGIs $25k-50k, 568.0% for AGIs $50k-75k, 733.5% for AGIs $75k-100k, 1883.1% for AGIs $100k-200k, 14380.3% for AGIs over 200k)
Taxable individual retirement arrangement distribution: $36,167 (reported on 13.6% of returns)
94705:
$36,167
California:
$23,505
(% of AGI for various income ranges: 75.4% for AGIs below $25k, 150.5% for AGIs $25k-50k, 291.8% for AGIs $50k-75k, 601.5% for AGIs $75k-100k, 1306.9% for AGIs $100k-200k, 6215.6% for AGIs over 200k)
Self-employed (Keogh) retirement plans: $38,603 (reported on 5.3% of returns)
94705:
$38,603
California:
$30,163
(% of AGI for various income ranges: 29.2% for AGIs below $25k, 95.8% for AGIs $50k-75k, 317.4% for AGIs $100k-200k, 3335.0% for AGIs over 200k)
Total itemized deductions: $63,191 (reported on 28.1% of returns)
Here:
$63,191
State:
$39,517
(% of AGI for various income ranges: 210.9% for AGIs below $25k, 383.7% for AGIs $25k-50k, 755.6% for AGIs $50k-75k, 1163.8% for AGIs $75k-100k, 2599.4% for AGIs $100k-200k, 27758.9% for AGIs over 200k)
Charity contributions: $25,569 (reported on 24.5% of returns)
Here:
$25,569
State:
$12,598
(% of AGI for various income ranges: 17.8% for AGIs below $25k, 35.7% for AGIs $25k-50k, 77.0% for AGIs $50k-75k, 200.9% for AGIs $75k-100k, 542.4% for AGIs $100k-200k, 11173.6% for AGIs over 200k)
Taxes paid: $9,404 (reported on 28.1% of returns)
94705:
$9,404
State:
$8,807
(% of AGI for various income ranges: 57.0% for AGIs below $25k, 81.7% for AGIs $25k-50k, 207.4% for AGIs $50k-75k, 305.0% for AGIs $75k-100k, 706.8% for AGIs $100k-200k, 3230.3% for AGIs over 200k)
Earned income credit: $845 (reported on 4.0% of returns)
Here:
$845
State:
$2,074
(% of AGI for various income ranges: 21.8% for AGIs below $25k, 14.0% for AGIs $25k-50k)
Percentage of individuals using paid preparers for their 2020 taxes: 91.6%
Here:
92%
State:
92%
(% for various income ranges: 89.1% for AGIs below $25k, 88.2% for AGIs $25k-50k, 92.0% for AGIs $50k-75k, 91.7% for AGIs $75k-100k, 92.4% for AGIs $100k-200k, 94.6% for AGIs over 200k)
Averages for the 2012 tax year for zip code 94705, filed in 2013:
Average Adjusted Gross Income (AGI) in 2012: $178,498 (Individual Income Tax Returns)
Here:
$178,498
State:
$72,726
Salary/wage: $116,965 (reported on 74.6% of returns)
Here:
$116,965
State:
$59,079
(% of AGI for various income ranges: 67.2% for AGIs below $25k, 70.2% for AGIs $25k-50k, 67.4% for AGIs $50k-75k, 62.9% for AGIs $75k-100k, 60.1% for AGIs $100k-200k, 43.3% for AGIs over 200k)
Taxable interest for individuals: $4,442 (reported on 57.7% of returns)
This zip code:
$4,442
California:
$2,146
(% of AGI for various income ranges: 2.4% for AGIs below $25k, 1.4% for AGIs $25k-50k, 1.8% for AGIs $50k-75k, 1.7% for AGIs $75k-100k, 1.3% for AGIs $100k-200k, 1.4% for AGIs over 200k)
Ordinary dividends: $20,130 (reported on 46.7% of returns)
Here:
$20,130
State:
$9,308
(% of AGI for various income ranges: 6.4% for AGIs below $25k, 4.2% for AGIs $25k-50k, 4.0% for AGIs $50k-75k, 3.8% for AGIs $75k-100k, 5.0% for AGIs $100k-200k, 5.5% for AGIs over 200k)
Net capital gain/loss in AGI: +$73,170 (reported on 42.3% of returns)
Here:
+$73,170
State:
+$30,460
(% of AGI for various income ranges: 1.0% for AGIs below $25k, 1.8% for AGIs $25k-50k, 1.6% for AGIs $50k-75k, 2.1% for AGIs $75k-100k, 3.6% for AGIs $100k-200k, 23.0% for AGIs over 200k)
Profit/loss from business: +$50,016 (reported on 29.0% of returns)
Here:
+$50,016
State:
+$17,064
(% of AGI for various income ranges: 17.7% for AGIs below $25k, 10.4% for AGIs $25k-50k, 7.8% for AGIs $50k-75k, 7.3% for AGIs $75k-100k, 7.9% for AGIs $100k-200k, 7.9% for AGIs over 200k)
Taxable individual retirement arrangement distribution: $36,132 (reported on 14.2% of returns)
94705:
$36,132
California:
$19,557
(% of AGI for various income ranges: 3.3% for AGIs below $25k, 2.7% for AGIs $25k-50k, 3.1% for AGIs $50k-75k, 3.5% for AGIs $75k-100k, 4.0% for AGIs $100k-200k, 2.6% for AGIs over 200k)
Self-employment retirement plans: $29,439 (reported on 6.1% of returns)
94705:
$29,439
California:
$24,530
(% of AGI for various income ranges: 0.9% for AGIs $25k-50k, 0.8% for AGIs $50k-75k, 0.9% for AGIs $75k-100k, 1.2% for AGIs $100k-200k, 1.0% for AGIs over 200k)
Total itemized deductions: $58,402 (18% of AGI, reported on 50.9% of returns)
Here:
$58,402
State:
$34,004
Here:
18.5% of AGI
State:
22.7% of AGI
(% of AGI for various income ranges: 21.4% for AGIs below $25k, 12.8% for AGIs $25k-50k, 15.9% for AGIs $50k-75k, 17.7% for AGIs $75k-100k, 19.9% for AGIs $100k-200k, 16.1% for AGIs over 200k)
Charity contributions: $8,997 (reported on 43.6% of returns)
Here:
$8,997
State:
$4,659
(% of AGI for various income ranges: 1.1% for AGIs below $25k, 1.0% for AGIs $25k-50k, 1.8% for AGIs $50k-75k, 1.8% for AGIs $75k-100k, 2.0% for AGIs $100k-200k, 2.4% for AGIs over 200k)
Taxes paid: $33,526 (reported on 50.8% of returns)
94705:
$33,526
State:
$14,448
(% of AGI for various income ranges: 4.8% for AGIs below $25k, 3.9% for AGIs $25k-50k, 5.0% for AGIs $50k-75k, 7.2% for AGIs $75k-100k, 10.0% for AGIs $100k-200k, 10.2% for AGIs over 200k)
Earned income credit: $750 (reported on 6.1% of returns)
Here:
$750
State:
$2,286
(% of AGI for various income ranges: 1.2% for AGIs below $25k, 0.1% for AGIs $25k-50k)
Percentage of individuals using paid preparers for their 2012 taxes: 52.1%
Here:
52%
State:
64%
(% for various income ranges: 38.7% for AGIs below $25k, 39.8% for AGIs $25k-50k, 48.9% for AGIs $50k-75k, 54.4% for AGIs $75k-100k, 62.1% for AGIs $100k-200k, 76.2% for AGIs over 200k)
Averages for the 2004 tax year for zip code 94705, filed in 2005:
Average Adjusted Gross Income (AGI) in 2004: $131,176 (Individual Income Tax Returns)
Here:
$131,176
State:
$58,600
Salary/wage: $87,689 (reported on 74.4% of returns)
Here:
$87,689
State:
$49,455
(% of AGI for various income ranges: 70.2% for AGIs $10k-25k, 72.6% for AGIs $25k-50k, 70.1% for AGIs $50k-75k, 65.0% for AGIs $75k-100k, 44.7% for AGIs over 100k)
Taxable interest for individuals: $4,602 (reported on 63.7% of returns)
This zip code:
$4,602
California:
$2,365
(% of AGI for various income ranges: 4.0% for AGIs $10k-25k, 2.4% for AGIs $25k-50k, 2.6% for AGIs $50k-75k, 3.4% for AGIs $75k-100k, 2.0% for AGIs over 100k)
Taxable dividends: $10,283 (reported on 52.0% of returns)
Here:
$10,283
State:
$4,746
(% of AGI for various income ranges: 4.4% for AGIs $10k-25k, 4.0% for AGIs $25k-50k, 3.9% for AGIs $50k-75k, 4.6% for AGIs $75k-100k, 3.9% for AGIs over 100k)
Net capital gain/loss: +$54,942 (reported on 44.8% of returns)
Here:
+$54,942
State:
+$23,418
(% of AGI for various income ranges: 1.7% for AGIs $10k-25k, 1.7% for AGIs $25k-50k, 3.5% for AGIs $50k-75k, 3.2% for AGIs $75k-100k, 22.4% for AGIs over 100k)
Profit/loss from business: +$30,822 (reported on 28.2% of returns)
Here:
+$30,822
State:
+$16,826
(% of AGI for various income ranges: 11.5% for AGIs $10k-25k, 10.2% for AGIs $25k-50k, 7.8% for AGIs $50k-75k, 7.2% for AGIs $75k-100k, 6.1% for AGIs over 100k)
Profit/loss from farming: +$13,417 (reported on 0.2% of returns)
Here:
+$13,417
State:
-$7,562
IRA payment deduction: $3,206 (reported on 3.9% of returns)
94705:
$3,206
California:
$3,192
(% of AGI for various income ranges: 0.5% for AGIs $10k-25k, 0.4% for AGIs $25k-50k, 0.2% for AGIs $50k-75k, 0.2% for AGIs $75k-100k, 0.0% for AGIs over 100k)
Self-employed pension: $19,769 (reported on 7.0% of returns)
Here:
$19,769
California:
$17,688
(% of AGI for various income ranges: 0.5% for AGIs $10k-25k, 0.9% for AGIs $25k-50k, 0.6% for AGIs $50k-75k, 1.0% for AGIs $75k-100k, 1.1% for AGIs over 100k)
Total itemized deductions: $44,906 (18% of AGI, reported on 48.1% of returns)
Here:
$44,906
State:
$28,113
Here:
18.4% of AGI
State:
25.3% of AGI
(% of AGI for various income ranges: 16.1% for AGIs $10k-25k, 14.5% for AGIs $25k-50k, 19.6% for AGIs $50k-75k, 21.5% for AGIs $75k-100k, 15.9% for AGIs over 100k)
Charity contributions deductions: $9,093 (3% of AGI, reported on 42.4% of returns)
Here:
$9,093
State:
$3,923
Here:
3.4% of AGI
State:
3.3% of AGI
(% of AGI for various income ranges: 1.0% for AGIs $10k-25k, 1.3% for AGIs $25k-50k, 2.1% for AGIs $50k-75k, 2.7% for AGIs $75k-100k, 3.2% for AGIs over 100k)
Total tax: $30,682 (reported on 84.4% of returns)
94705:
$30,682
State:
$10,761
(% of AGI for various income ranges: 6.3% for AGIs $10k-25k, 10.0% for AGIs $25k-50k, 12.1% for AGIs $50k-75k, 12.9% for AGIs $75k-100k, 21.7% for AGIs over 100k)
Earned income credit: $730 (reported on 5.3% of returns)
Here:
$730
State:
$1,763
Percentage of individuals using paid preparers for their 2004 taxes: 52.6%
Here:
53%
State:
66%
(% for various income ranges: 44.2% for AGIs below $10k, 41.3% for AGIs $10k-25k, 41.4% for AGIs $25k-50k, 52.7% for AGIs $50k-75k, 56.1% for AGIs $75k-100k, 72.1% for AGIs over 100k)
Likely homosexual households (counted as self-reported same-sex unmarried-partner households)
Lesbian couples: 0.6% of all households
Gay men: 0.7% of all households
Household received Food Stamps/SNAP in the past 12 months: 339 Household did not receive Food Stamps/SNAP in the past 12 months: 5,517
Women who had a birth in the past 12 months: 79 (46 now married, 33 unmarried) Women who did not have a birth in the past 12 months: 3,282 (1,182 now married, 2,105 unmarried)
Housing units in zip code 94705 with a mortgage: 2,027 (323 second mortgage, 4 home equity loan, 207 both second mortgage and home equity loan) Houses without a mortgage: 64
Median monthly owner costs for units with a mortgage: $3,876 Median monthly owner costs for units without a mortgage: $1,190
Residents with income below the poverty level in 2022:
This zip code:
9.2%
Whole state:
12.2%
Residents with income below 50% of the poverty level in 2022:
This zip code:
2.6%
Whole state:
6.2%
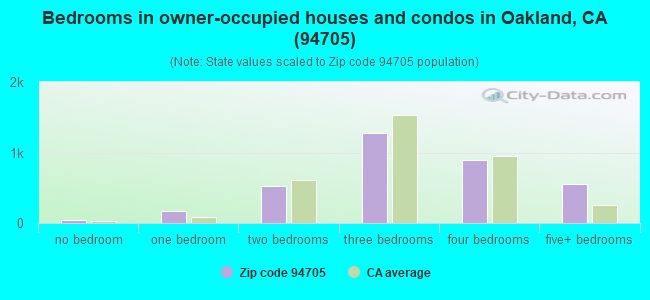
Median number of rooms in houses and condos:
Here:
7.1
State:
6.0
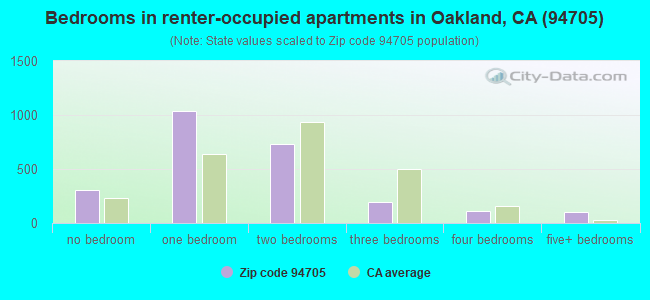
Median number of rooms in apartments:
Here:
3.5
State:
3.9
Notable locations in this zip code not listed on our city pages
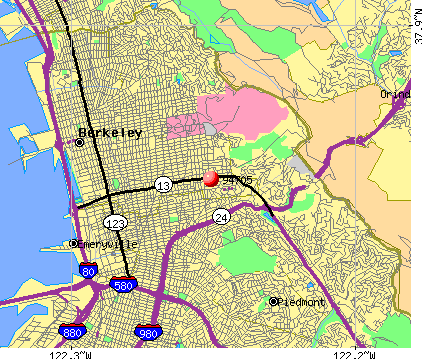
Notable locations in zip code 94705: Berkeley Tennis Club (A), Claremont Branch Berkeley Public Library (B), Claremont Club (C), Oakland Fire Department Station 7 (D), Berkeley Fire Department Station 3 (E). Display/hide their locations on the map
Churches in zip code 94705 include: Third Church of Christ Scientist (A), Saint Clements Church (B), Church of Christ of the Golden Gate (C), Church By The Side Of The Road (D), Bethlehem Lutheran Church (E), Saint Clements Episcopal Church (F). Display/hide their locations on the map
1,763 married couples with children.
332 single-parent households (148 men, 184 women).
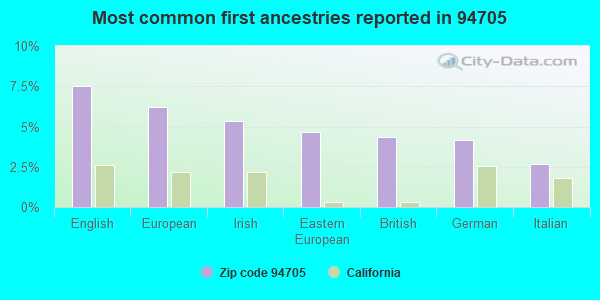
80.5% of residents of 94705 zip code speak English at home.
4.7% of residents speak Spanish at home (87% very well, 9% well, 4% not well).
8.6% of residents speak other Indo-European language at home (91% very well, 8% well, 1% not at all).
4.2% of residents speak Asian or Pacific Island language at home (71% very well, 18% well, 8% not well, 3% not at all).
2.5% of residents speak other language at home (80% very well, 20% well).
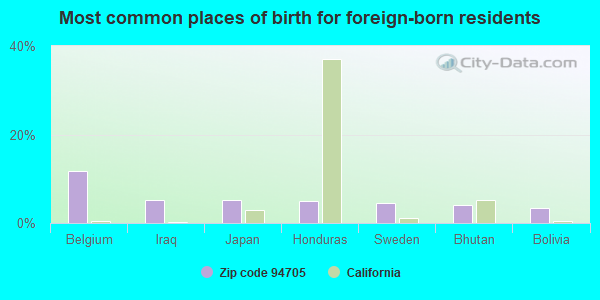
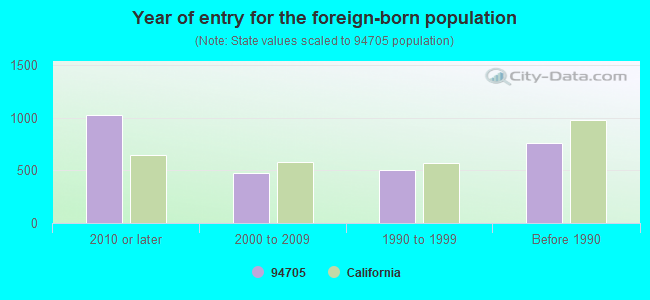
Foreign born population: 2,429 (16.9%) (54.7% of them are naturalized citizens)
Major facilities with environmental interests located in this zip code:
ALTA BATES HOSPITAL (3001 COLBY STREET in BERKELEY, CA)
STATE MASTER (California - Hazardous Waste Tracking) - HAZARDOU WASTE PROGRAM CRITERIA AND HAZARDOUS AIR POLLUTANT INVENTORY (Inventory of air pollution sources) Small Quantity Generators, between 100 kg and 1000 kg of hazardous waste/month (Resource Conservation and Recovery Act (tracking hazardous waste)) - notification Business SIC classification: GENERAL MEDICAL AND SURGICAL HOSPITALS Organizations: HOSPITAL NON PROFIT (CONTACT/OWNER)
Alternative names: ALTA BATES MEDICAL CENTER
EMERSON ELEMENTARY (2800 FOREST AVE. in BERKELEY, CA)
(National Center for Education Statistics) - STATE ID-6090211 Small Quantity Generators, between 100 kg and 1000 kg of hazardous waste/month (Resource Conservation and Recovery Act (tracking hazardous waste)) Organizations: BERKELEY UNIFIED SCHOOL DIST (CONTACT/OPERATOR)
, BERKELEY UNIFIED (SCHOOL DISTRICT)
Alternative names: EMMERSON ELEMENTARY SCHOOL
H W MCKEVITT CO INC (2700 SHATTUCK AVE in BERKELEY, CA)
STATE MASTER (California - Hazardous Waste Tracking) - HAZARDOU WASTE PROGRAM Large Quantity Generators, more that 1000 kg of hazardous waste/month (Resource Conservation and Recovery Act (tracking hazardous waste))
CHEVRON STATION NO 90972 (2996 TELEGRAPH AVENUE in BERKELEY, CA)
STATE MASTER (California - Hazardous Waste Tracking) - HAZARDOU WASTE PROGRAM Small Quantity Generators, between 100 kg and 1000 kg of hazardous waste/month (Resource Conservation and Recovery Act (tracking hazardous waste)) - notification Small Quantity Generators, between 100 kg and 1000 kg of hazardous waste/month (Resource Conservation and Recovery Act (tracking hazardous waste)) - notification Organizations: CHEVRON PRODUCTS CO (CONTACT/OWNER)
, HUGO CORNEJO (CONTACT/OWNER)
Alternative names: INCA CHEVRON INC
MOTOR CITY AUTOMOTIVE (3058 SHATTUCK AVE in BERKELEY, CA)
STATE MASTER (California - Hazardous Waste Tracking) - HAZARDOU WASTE PROGRAM Small Quantity Generators, between 100 kg and 1000 kg of hazardous waste/month (Resource Conservation and Recovery Act (tracking hazardous waste)) - notification Business NAICS classification: GENERAL AUTOMOTIVE REPAIR. Organizations: ALAN CARTWRIGHT (CONTACT/OWNER)
MAGNES MUSEUM (2911 RUSELL STREET in BERKELEY, CA)
STATE MASTER (California - Hazardous Waste Tracking) - HAZARDOU WASTE PROGRAM Small Quantity Generators, between 100 kg and 1000 kg of hazardous waste/month (Resource Conservation and Recovery Act (tracking hazardous waste)) Alternative names: JUDAH L. MAGNES MUSEUM
CHEVRON STATION 90289 (3048 ASHBY AVE in BERKELEY, CA)
STATE MASTER (California - Hazardous Waste Tracking) - HAZARDOU WASTE PROGRAM Small Quantity Generators, between 100 kg and 1000 kg of hazardous waste/month (Resource Conservation and Recovery Act (tracking hazardous waste)) - notification Organizations: CHEVRON PRODUCTS CO (CONTACT/OWNER)
LECONTE ELEMENTARY (2241 RUSSELL ST. in BERKELEY, CA)
(National Center for Education Statistics) - STATE ID-6090278 Organizations: BERKELEY UNIFIED (SCHOOL DISTRICT)
MUIR (JOHN) ELEMENTARY (2955 CLAREMONT AVE. in BERKELEY, CA)
(National Center for Education Statistics) - STATE ID-6105316 Organizations: BERKELEY UNIFIED (SCHOOL DISTRICT)
3075 TELEGRAPH AVE LLC (3075 TELEGRAPH AVE in BERKELEY, CA)
Small Quantity Generators, between 100 kg and 1000 kg of hazardous waste/month (Resource Conservation and Recovery Act (tracking hazardous waste))
MARTIN LUTHER KING JR MIDDLE SCHOOL (1780 ROSE ST in BERKELEY, CA)
Small Quantity Generators, between 100 kg and 1000 kg of hazardous waste/month (Resource Conservation and Recovery Act (tracking hazardous waste)) Organizations: BERKELEY UNIFIED SCHOOL DIST (CONTACT/OPERATOR)
FRANKS UNOCAL 76 (3001 TELEGRAPH AVE in BERKELEY, CA)
Small Quantity Generators, between 100 kg and 1000 kg of hazardous waste/month (Resource Conservation and Recovery Act (tracking hazardous waste))
LANCY YEE & WOON CHAN (2472 VIRGINIA ST in BERKELEY, CA)
COMPLIANCE ACTIVITY (Tracking inspections of insecticide, fungicide, and rodenticide, and toxic substances)
Housing units lacking complete plumbing facilities: 1.7% Housing units lacking complete kitchen facilities: 1.4%
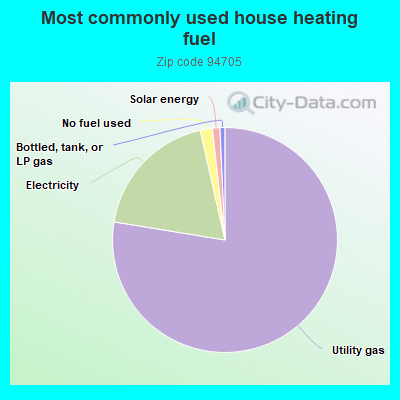
77.2%Utility gas
18.8%Electricity
1.7%No fuel used
1.1%Solar energy
0.7%Bottled, tank, or LP gas
Population in 1990: 11,833. Population change in the 1990s: +610 (+5.2%).
Place of birth for U.S.-born residents:
This state: 6,413
Northeast: 2,179
Midwest: 1,435
South: 877
West: 694
55% of the 94705 zip code residents lived in the same house 5 years ago. Out of people who lived in different houses, 39% lived in this county. Out of people who lived in different counties, 50% lived in California.
85% of the 94705 zip code residents lived in the same house 1 year ago. Out of people who lived in different houses, 38% moved from this county. Out of people who lived in different houses, 39% moved from different county within same state. Out of people who lived in different houses, 14% moved from different state. Out of people who lived in different houses, 8% moved from abroad.
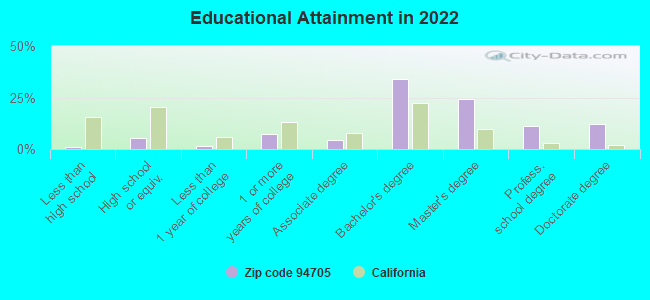
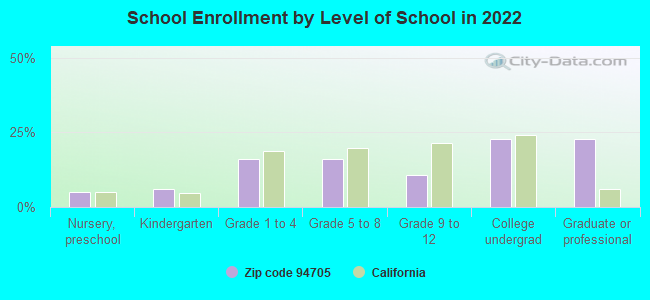
Private vs. public school enrollment:
Students in private schools in grades 1 to 8 (elementary and middle school): 437
Here:
39.0%
California:
10.5%
Students in private schools in grades 9 to 12 (high school): 157
Here:
43.0%
California:
8.5%
Students in private undergraduate colleges: 113
Here:
14.7%
California:
15.9%
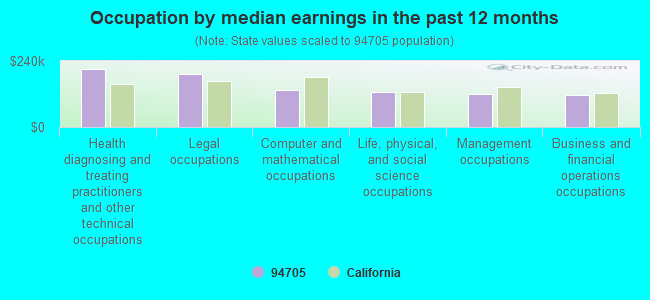
Occupation by median earnings in the past 12 months ($)
210,120Health diagnosing and treating practitioners and other technical occupations
193,441Legal occupations
134,736Computer and mathematical occupations
129,051Life, physical, and social science occupations
120,875Management occupations
117,629Business and financial operations occupations
Companies with federal contracts located in this zip code (BERKELEY, CA):
JERALD H. UDINSKY (2941 TELEGRAPH AVE.; small business) : $1,232,013 in 20 contractsfrom 2002 to 2005
Contracts for Expert Witness, Legal Services by Offices, Boards and Divisions (includes Attorney General, Deputy Attorney General, etc.) Signed by year:2000: $0; 2001: $0; 2002: $507,510; 2003: $301,458; 2004: $321,725; 2005: $101,320; 2006: $0.
Biggest contracts:
$321,000 with Offices, Boards and Divisions (includes Attorney General, Deputy Attorney General, etc.) for Expert Witness. Taking place in DC. Signed on 2002-05-15. Completion date: 2003-05-15.
$148,273, same as above.Signed on 2003-07-15. Completion date: 2004-07-15.
$138,990, same as above.Signed on 2004-12-01. Completion date: 2006-01-01.
$122,000 with Offices, Boards and Divisions (includes Attorney General, Deputy Attorney General, etc.) for Legal Services. Taking place in DC. Signed on 2002-09-15. Completion date: 2003-03-15.
FREEDMAN & STARK (901 ALVARADO ROD) : $583,500 in 7 contractsfrom 2002 to 2005
Contracts for Expert Witness, Legal Services by Offices, Boards and Divisions (includes Attorney General, Deputy Attorney General, etc.) Signed by year:2000: $0; 2001: $0; 2002: $188,000; 2003: $0; 2004: $0; 2005: $395,500; 2006: $0.
Biggest contracts:
$195,000 with Offices, Boards and Divisions (includes Attorney General, Deputy Attorney General, etc.) for Expert Witness. Taking place in DC. Signed on 2005-09-30. Completion date: 2006-09-30.
$118,000 with Offices, Boards and Divisions (includes Attorney General, Deputy Attorney General, etc.) for Legal Services. Taking place in DC. Signed on 2005-06-01. Completion date: 2005-09-30.
$66,000 with Offices, Boards and Divisions (includes Attorney General, Deputy Attorney General, etc.) for Expert Witness. Taking place in DC. Signed on 2002-06-15. Completion date: 2003-03-15.
$61,000, same as above.Signed on 2002-09-15. Completion date: 2003-03-15.
MATTHEW P MITCHELL (151 ALVARADO ROAD; small business)
$139,971 with Air Force for Defense Missile and Space Systems -- Operational Systems Development (R&D). Signed on 2001-03-06. Completion date: 2001-12-15.
SYMPLECTIC ENGINEERING CORPORA (2901 BENVENUE AVE; small business)
$70,000 with Army for Other Defense -- Basic Research (R&D). Signed on 2005-12-15. Completion date: 2006-05-25.
ICEM CFD ENGINEERING INC (2855 TELEGRAPH AVENUE; small business) : $14,460 in 2 contractsfrom 2001 to 2002
$7,260 with Navy for Automated News Services, Data Services, or Other Information Services. Buying data, the electronic equivalent of books, periodicals, newspapers, etc.. Signed on 2002-12-31. Completion date: 2003-12-31.
$7,200, same as above.Signed on 2001-12-27. Completion date: 2002-12-30.
HYDRAPAK INC (2991 SHATTUCK AVE STE 202; small business)
$2,975 with Navy for Athletic and Sporting Equipment. Signed on 2005-02-04. Completion date: 2005-02-18.
Top industries in this zip code by the number of employees in 2005:
Health Care and Social Assistance: General Medical and Surgical Hospitals (over 1000 employees: 1 establishment)
Health Care and Social Assistance: Offices of Physicians (except Mental Health Specialists) (50-99: 2, 20-49: 8, 10-19: 12, 5-9: 18, 1-4: 56)
Accommodation and Food Services: Hotels (except Casino Hotels) and Motels (500-999: 1, 10-19: 1, 1-4: 2)
Health Care and Social Assistance: Offices of Dentists (20-49: 1, 10-19: 8, 5-9: 25, 1-4: 21)
2005 - 2018 National Fire Incident Reporting System (NFIRS) incidents
Based on the data from the years 2005 - 2018 the average number of fire incidents per year is 14. The highest number of fire incidents - 26 took place in 2005, and the least - 4 in 2012. The data has a declining trend.
When looking into fire subcategories, the most reports belonged to: Structure Fires (42.1%), and Outside Fires (34.7%).
Fire incident types reported to NFIRS in Zip Code 94705


+$13,417
-$7,562
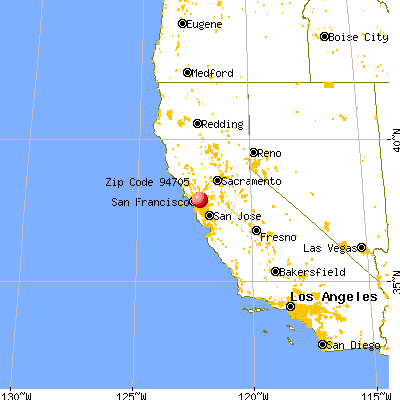
 Nearest zip codes: 94720, 94704, 94618, 94709, 94703, 94609.
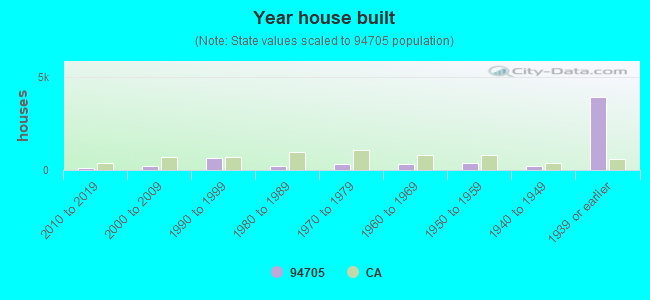


 Based on the data from the years 2005 - 2018 the average number of fire incidents per year is 14. The highest number of fire incidents - 26 took place in 2005, and the least - 4 in 2012. The data has a declining trend.
 When looking into fire subcategories, the most reports belonged to: Structure Fires (42.1%), and Outside Fires (34.7%).