Estimated zip code population in 2022: 17,141 Zip code population in 2010: 16,046 Zip code population in 2000: 15,420
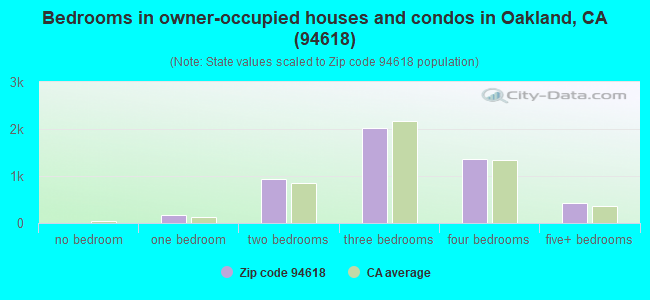
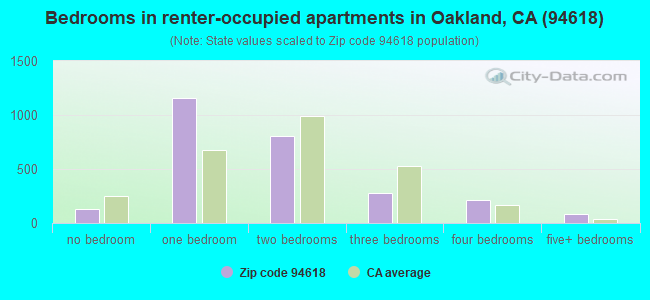
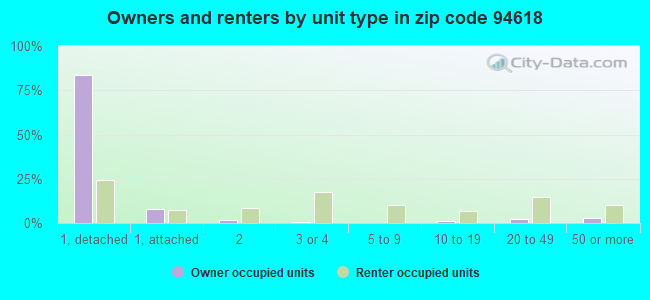
Houses and condos: 7,986 Renter-occupied apartments: 2,664
% of renters here:
35%
State:
44%
March 2022 cost of living index in zip code 94618: 121.1 (high, U.S. average is 100)
Land area: 2.4 sq. mi. Water area: 0.0 sq. mi.
Population density: 7,062 people per square mile
(high).
OSM Map
General Map
Google Map
MSN Map
OSM Map
General Map
Google Map
MSN Map
OSM Map
General Map
Google Map
MSN Map
OSM Map
General Map
Google Map
MSN Map
Please wait while loading the map...
Real estate property taxes paid for housing units in 2022:
This zip code:
0.6% ($10,292)
California:
0.7% ($4,831)
Median real estate property taxes paid for housing units with mortgages in 2022: $10,330 (0.5%) Median real estate property taxes paid for housing units with no mortgage in 2022: $8,814 (0.5%)
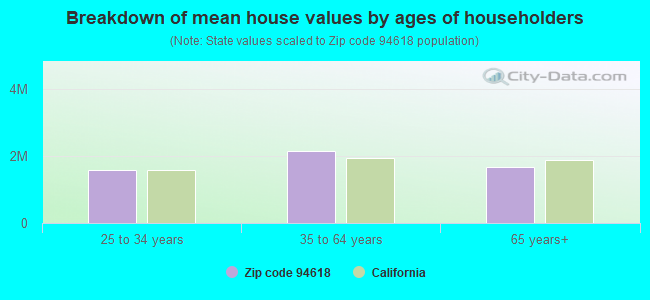
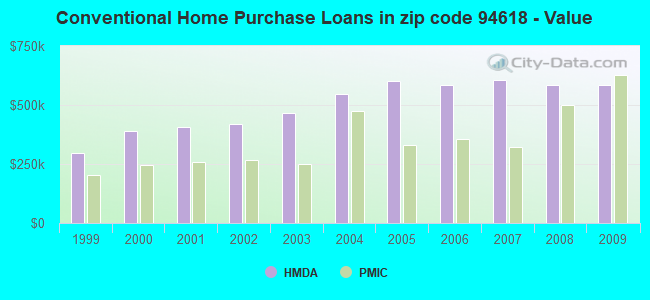
Estimated median house/condo value in 2022: $1,823,466
94618:
$1,823,466
California:
$715,900
According to our research of California and other state lists, there were 8 registered sex offenders living in 94618 zip code as of April 26, 2024. The ratio of all residents to sex offenders in zip code 94618 is 2,107 to 1. The ratio of registered sex offenders to all residents in this zip code is much lower than the state average.
Median resident age:
This zip code:
44.1 years
California median age:
37.9 years
Average household size:
This zip code:
2.2 people
California:
2.8 people
Averages for the 2020 tax year for zip code 94618, filed in 2021:
Average Adjusted Gross Income (AGI) in 2020: $263,366 (Individual Income Tax Returns)
Here:
$263,366
State:
$95,910
Salary/wage: $221,200 (reported on 73.7% of returns)
Here:
$221,200
State:
$77,331
(% of AGI for various income ranges: 1144.4% for AGIs below $25k, 4049.2% for AGIs $25k-50k, 6961.5% for AGIs $50k-75k, 10052.6% for AGIs $75k-100k, 19457.9% for AGIs $100k-200k, 180434.1% for AGIs over 200k)
Taxable interest for individuals: $3,468 (reported on 64.0% of returns)
This zip code:
$3,468
California:
$2,294
(% of AGI for various income ranges: 71.0% for AGIs below $25k, 116.8% for AGIs $25k-50k, 115.0% for AGIs $50k-75k, 210.0% for AGIs $75k-100k, 387.0% for AGIs $100k-200k, 2123.0% for AGIs over 200k)
Ordinary dividends: $19,364 (reported on 59.2% of returns)
Here:
$19,364
State:
$10,949
(% of AGI for various income ranges: 207.5% for AGIs below $25k, 356.4% for AGIs $25k-50k, 515.2% for AGIs $50k-75k, 818.4% for AGIs $75k-100k, 1690.0% for AGIs $100k-200k, 11985.2% for AGIs over 200k)
Net capital gain/loss in AGI: +$73,230 (reported on 56.3% of returns)
Here:
+$73,230
State:
+$49,306
(% of AGI for various income ranges: 116.2% for AGIs below $25k, 217.8% for AGIs $25k-50k, 393.3% for AGIs $50k-75k, 639.8% for AGIs $75k-100k, 2031.8% for AGIs $100k-200k, 52735.7% for AGIs over 200k)
Profit/loss from business: +$38,965 (reported on 23.3% of returns)
Here:
+$38,965
State:
+$15,671
(% of AGI for various income ranges: 326.7% for AGIs below $25k, 612.2% for AGIs $25k-50k, 595.0% for AGIs $50k-75k, 818.8% for AGIs $75k-100k, 1734.0% for AGIs $100k-200k, 8267.5% for AGIs over 200k)
Taxable individual retirement arrangement distribution: $34,609 (reported on 14.5% of returns)
94618:
$34,609
California:
$23,505
(% of AGI for various income ranges: 98.7% for AGIs below $25k, 199.6% for AGIs $25k-50k, 368.1% for AGIs $50k-75k, 740.2% for AGIs $75k-100k, 1429.5% for AGIs $100k-200k, 3897.8% for AGIs over 200k)
Self-employed (Keogh) retirement plans: $35,652 (reported on 6.0% of returns)
94618:
$35,652
California:
$30,163
(% of AGI for various income ranges: 95.0% for AGIs $25k-50k, 77.9% for AGIs $75k-100k, 259.9% for AGIs $100k-200k, 2467.6% for AGIs over 200k)
Total itemized deductions: $42,232 (reported on 33.7% of returns)
Here:
$42,232
State:
$39,517
(% of AGI for various income ranges: 420.5% for AGIs below $25k, 557.4% for AGIs $25k-50k, 775.8% for AGIs $50k-75k, 1274.0% for AGIs $75k-100k, 2661.5% for AGIs $100k-200k, 13599.0% for AGIs over 200k)
Charity contributions: $12,831 (reported on 29.4% of returns)
Here:
$12,831
State:
$12,598
(% of AGI for various income ranges: 19.5% for AGIs below $25k, 41.2% for AGIs $25k-50k, 78.8% for AGIs $50k-75k, 160.7% for AGIs $75k-100k, 481.7% for AGIs $100k-200k, 4304.8% for AGIs over 200k)
Taxes paid: $9,464 (reported on 33.7% of returns)
94618:
$9,464
State:
$8,807
(% of AGI for various income ranges: 86.1% for AGIs below $25k, 107.8% for AGIs $25k-50k, 211.0% for AGIs $50k-75k, 372.6% for AGIs $75k-100k, 774.8% for AGIs $100k-200k, 2741.3% for AGIs over 200k)
Earned income credit: $1,133 (reported on 2.4% of returns)
Here:
$1,133
State:
$2,074
(% of AGI for various income ranges: 30.3% for AGIs below $25k, 10.6% for AGIs $25k-50k)
Percentage of individuals using paid preparers for their 2020 taxes: 92.2%
Here:
92%
State:
92%
(% for various income ranges: 88.0% for AGIs below $25k, 90.2% for AGIs $25k-50k, 91.2% for AGIs $50k-75k, 93.9% for AGIs $75k-100k, 92.2% for AGIs $100k-200k, 94.6% for AGIs over 200k)
Averages for the 2012 tax year for zip code 94618, filed in 2013:
Average Adjusted Gross Income (AGI) in 2012: $158,247 (Individual Income Tax Returns)
Here:
$158,247
State:
$72,726
Salary/wage: $131,421 (reported on 75.8% of returns)
Here:
$131,421
State:
$59,079
(% of AGI for various income ranges: 59.2% for AGIs below $25k, 67.5% for AGIs $25k-50k, 67.2% for AGIs $50k-75k, 67.1% for AGIs $75k-100k, 66.9% for AGIs $100k-200k, 61.0% for AGIs over 200k)
Taxable interest for individuals: $3,663 (reported on 62.3% of returns)
This zip code:
$3,663
California:
$2,146
(% of AGI for various income ranges: 3.0% for AGIs below $25k, 1.5% for AGIs $25k-50k, 1.5% for AGIs $50k-75k, 1.1% for AGIs $75k-100k, 1.0% for AGIs $100k-200k, 1.6% for AGIs over 200k)
Ordinary dividends: $13,977 (reported on 52.5% of returns)
Here:
$13,977
State:
$9,308
(% of AGI for various income ranges: 8.4% for AGIs below $25k, 5.1% for AGIs $25k-50k, 3.8% for AGIs $50k-75k, 3.8% for AGIs $75k-100k, 4.1% for AGIs $100k-200k, 4.8% for AGIs over 200k)
Net capital gain/loss in AGI: +$23,676 (reported on 46.4% of returns)
Here:
+$23,676
State:
+$30,460
(% of AGI for various income ranges: 1.7% for AGIs below $25k, 1.0% for AGIs $25k-50k, 1.6% for AGIs $50k-75k, 1.7% for AGIs $75k-100k, 2.2% for AGIs $100k-200k, 9.7% for AGIs over 200k)
Profit/loss from business: +$34,358 (reported on 26.1% of returns)
Here:
+$34,358
State:
+$17,064
(% of AGI for various income ranges: 21.0% for AGIs below $25k, 11.4% for AGIs $25k-50k, 8.2% for AGIs $50k-75k, 6.4% for AGIs $75k-100k, 6.8% for AGIs $100k-200k, 4.5% for AGIs over 200k)
Taxable individual retirement arrangement distribution: $27,213 (reported on 14.3% of returns)
94618:
$27,213
California:
$19,557
(% of AGI for various income ranges: 4.6% for AGIs below $25k, 2.7% for AGIs $25k-50k, 2.7% for AGIs $50k-75k, 4.6% for AGIs $75k-100k, 3.7% for AGIs $100k-200k, 1.8% for AGIs over 200k)
Self-employment retirement plans: $27,604 (reported on 6.4% of returns)
94618:
$27,604
California:
$24,530
(% of AGI for various income ranges: 1.0% for AGIs $25k-50k, 0.5% for AGIs $50k-75k, 0.9% for AGIs $75k-100k, 0.9% for AGIs $100k-200k, 1.3% for AGIs over 200k)
Total itemized deductions: $46,329 (20% of AGI, reported on 59.5% of returns)
Here:
$46,329
State:
$34,004
Here:
19.6% of AGI
State:
22.7% of AGI
(% of AGI for various income ranges: 28.1% for AGIs below $25k, 14.2% for AGIs $25k-50k, 15.2% for AGIs $50k-75k, 17.2% for AGIs $75k-100k, 19.3% for AGIs $100k-200k, 17.0% for AGIs over 200k)
Charity contributions: $5,576 (reported on 51.6% of returns)
Here:
$5,576
State:
$4,659
(% of AGI for various income ranges: 1.4% for AGIs below $25k, 1.2% for AGIs $25k-50k, 1.5% for AGIs $50k-75k, 1.5% for AGIs $75k-100k, 1.8% for AGIs $100k-200k, 1.9% for AGIs over 200k)
Taxes paid: $25,272 (reported on 59.3% of returns)
94618:
$25,272
State:
$14,448
(% of AGI for various income ranges: 6.8% for AGIs below $25k, 4.0% for AGIs $25k-50k, 4.8% for AGIs $50k-75k, 7.8% for AGIs $75k-100k, 9.3% for AGIs $100k-200k, 10.4% for AGIs over 200k)
Earned income credit: $890 (reported on 3.6% of returns)
Here:
$890
State:
$2,286
(% of AGI for various income ranges: 1.3% for AGIs below $25k)
Percentage of individuals using paid preparers for their 2012 taxes: 53.3%
Here:
53%
State:
64%
(% for various income ranges: 44.2% for AGIs below $25k, 41.7% for AGIs $25k-50k, 48.2% for AGIs $50k-75k, 50.6% for AGIs $75k-100k, 56.9% for AGIs $100k-200k, 70.1% for AGIs over 200k)
Averages for the 2004 tax year for zip code 94618, filed in 2005:
Average Adjusted Gross Income (AGI) in 2004: $110,628 (Individual Income Tax Returns)
Here:
$110,628
State:
$58,600
Salary/wage: $93,824 (reported on 76.6% of returns)
Here:
$93,824
State:
$49,455
(% of AGI for various income ranges: 62.3% for AGIs $10k-25k, 72.6% for AGIs $25k-50k, 71.5% for AGIs $50k-75k, 71.0% for AGIs $75k-100k, 62.4% for AGIs over 100k)
Taxable interest for individuals: $3,663 (reported on 68.0% of returns)
This zip code:
$3,663
California:
$2,365
(% of AGI for various income ranges: 4.8% for AGIs $10k-25k, 2.3% for AGIs $25k-50k, 2.7% for AGIs $50k-75k, 2.4% for AGIs $75k-100k, 2.1% for AGIs over 100k)
Taxable dividends: $6,657 (reported on 54.7% of returns)
Here:
$6,657
State:
$4,746
(% of AGI for various income ranges: 6.8% for AGIs $10k-25k, 3.3% for AGIs $25k-50k, 3.6% for AGIs $50k-75k, 3.4% for AGIs $75k-100k, 3.1% for AGIs over 100k)
Net capital gain/loss: +$19,599 (reported on 47.4% of returns)
Here:
+$19,599
State:
+$23,418
(% of AGI for various income ranges: 2.1% for AGIs $10k-25k, 2.0% for AGIs $25k-50k, 1.1% for AGIs $50k-75k, 1.6% for AGIs $75k-100k, 10.5% for AGIs over 100k)
Profit/loss from business: +$30,160 (reported on 24.8% of returns)
Here:
+$30,160
State:
+$16,826
(% of AGI for various income ranges: 12.7% for AGIs $10k-25k, 9.5% for AGIs $25k-50k, 6.1% for AGIs $50k-75k, 7.5% for AGIs $75k-100k, 6.3% for AGIs over 100k)
IRA payment deduction: $2,968 (reported on 3.8% of returns)
94618:
$2,968
California:
$3,192
(% of AGI for various income ranges: 0.7% for AGIs $10k-25k, 0.4% for AGIs $25k-50k, 0.2% for AGIs $50k-75k, 0.2% for AGIs $75k-100k, 0.0% for AGIs over 100k)
Self-employed pension: $19,434 (reported on 7.1% of returns)
Here:
$19,434
California:
$17,688
(% of AGI for various income ranges: 0.5% for AGIs $10k-25k, 0.6% for AGIs $25k-50k, 0.7% for AGIs $50k-75k, 0.9% for AGIs $75k-100k, 1.4% for AGIs over 100k)
Total itemized deductions: $36,935 (21% of AGI, reported on 55.4% of returns)
Here:
$36,935
State:
$28,113
Here:
21.3% of AGI
State:
25.3% of AGI
(% of AGI for various income ranges: 22.7% for AGIs $10k-25k, 13.9% for AGIs $25k-50k, 17.5% for AGIs $50k-75k, 20.3% for AGIs $75k-100k, 18.4% for AGIs over 100k)
Charity contributions deductions: $6,023 (3% of AGI, reported on 49.7% of returns)
Here:
$6,023
State:
$3,923
Here:
3.3% of AGI
State:
3.3% of AGI
(% of AGI for various income ranges: 1.6% for AGIs $10k-25k, 1.3% for AGIs $25k-50k, 1.6% for AGIs $50k-75k, 2.0% for AGIs $75k-100k, 3.0% for AGIs over 100k)
Total tax: $23,136 (reported on 89.0% of returns)
94618:
$23,136
State:
$10,761
(% of AGI for various income ranges: 6.2% for AGIs $10k-25k, 10.3% for AGIs $25k-50k, 12.5% for AGIs $50k-75k, 13.1% for AGIs $75k-100k, 20.7% for AGIs over 100k)
Earned income credit: $635 (reported on 3.6% of returns)
Here:
$635
State:
$1,763
Percentage of individuals using paid preparers for their 2004 taxes: 54.2%
Here:
54%
State:
66%
(% for various income ranges: 49.8% for AGIs below $10k, 45.5% for AGIs $10k-25k, 45.0% for AGIs $25k-50k, 52.9% for AGIs $50k-75k, 53.8% for AGIs $75k-100k, 65.6% for AGIs over 100k)
Likely homosexual households (counted as self-reported same-sex unmarried-partner households)
Lesbian couples: 0.4% of all households
Gay men: 0.7% of all households
Household received Food Stamps/SNAP in the past 12 months: 314 Household did not receive Food Stamps/SNAP in the past 12 months: 7,112
Women who had a birth in the past 12 months: 181 (180 now married, 0 unmarried) Women who did not have a birth in the past 12 months: 3,680 (1,679 now married, 1,991 unmarried)
Housing units in zip code 94618 with a mortgage: 3,225 (494 second mortgage, 61 home equity loan, 427 both second mortgage and home equity loan) Houses without a mortgage: 53
Median monthly owner costs for units with a mortgage: $3,876 Median monthly owner costs for units without a mortgage: $1,475
Residents with income below the poverty level in 2022:
This zip code:
4.9%
Whole state:
12.2%
Residents with income below 50% of the poverty level in 2022:
This zip code:
1.6%
Whole state:
6.2%
Median number of rooms in houses and condos:
Here:
7.0
State:
6.0
Median number of rooms in apartments:
Here:
3.7
State:
3.9
Notable locations in this zip code not listed on our city pages
Notable locations in zip code 94618: Claremont Country Club (A), Rockbridge Branch Oakland Public Library (B), Oakland Fire Department Station 19 (C). Display/hide their locations on the map
Churches in zip code 94618 include: College Avenue United Presbyterian Church (A), Saint Peters Episcopal Church (B), University Baptist Church (C), Saint Theresa Roman Catholic Church (D). Display/hide their locations on the map
2,450 married couples with children.
602 single-parent households (320 men, 282 women).
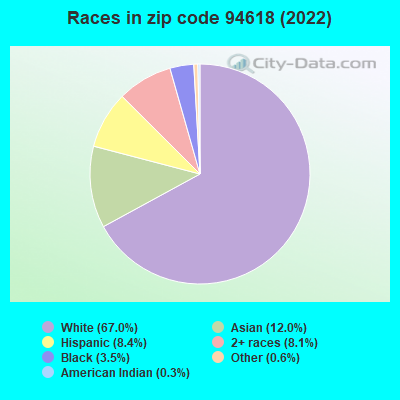
83.8% of residents of 94618 zip code speak English at home.
4.3% of residents speak Spanish at home (89% very well, 7% well, 3% not well).
6.4% of residents speak other Indo-European language at home (94% very well, 4% well, 1% not well, 1% not at all).
5.0% of residents speak Asian or Pacific Island language at home (87% very well, 8% well, 5% not well).
0.3% of residents speak other language at home (63% very well, 37% well).
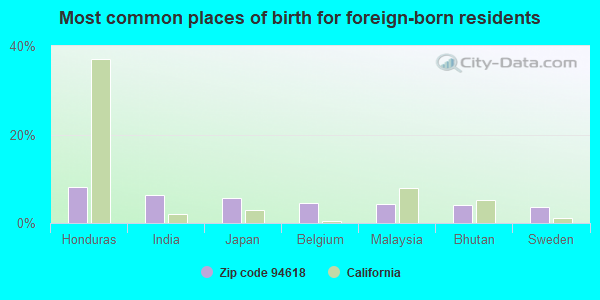
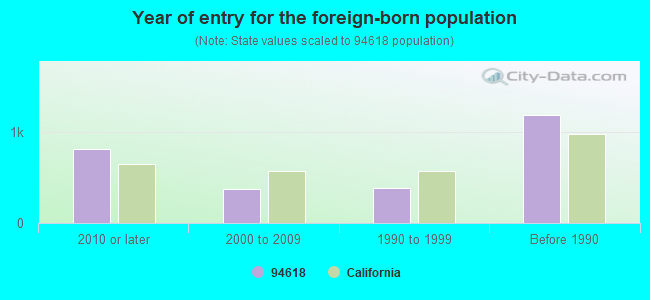
Foreign born population: 2,248 (13.1%) (67.8% of them are naturalized citizens)
Facilities with environmental interests located in this zip code:
ANTHONY CHABOT ELEMENTARY SCHOOL (6686 CHABOT ROAD in OAKLAND, CA)
(Geographic Names Information System) (National Center for Education Statistics) - STATE ID-6001648 Organizations: OAKLAND UNIFIED (SCHOOL DISTRICT)
Alternative names: CHABOT (ANTHONY) ELEMENTARY
FAR WEST SENIOR HIGH SCHOOL (5263 BROADWAY TERRACE in OAKLAND, CA)
STATE MASTER (California - Hazardous Waste Tracking) - HAZARDOU WASTE PROGRAM Small Quantity Generators, between 100 kg and 1000 kg of hazardous waste/month (Resource Conservation and Recovery Act (tracking hazardous waste)) - notification Organizations: OAKLAND UNIFIED SCHOOL DIST (CONTACT/OWNER)
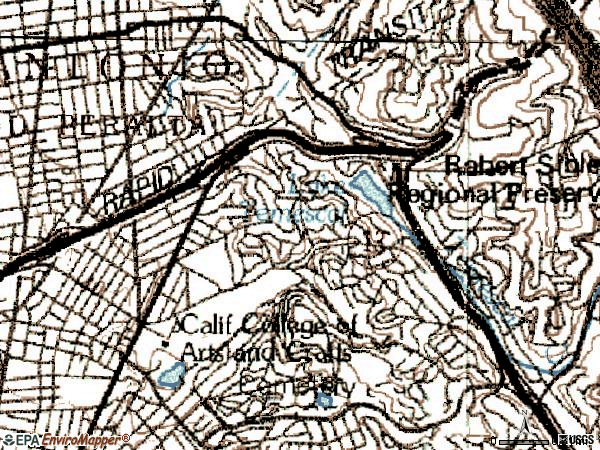
CALIFORNIA COLLEGE OF ARTS AND CRAFTS (5212 BROADWAY in OAKLAND, CA)
STATE MASTER (California - Hazardous Waste Tracking) - HAZARDOU WASTE PROGRAM Small Quantity Generators, between 100 kg and 1000 kg of hazardous waste/month (Resource Conservation and Recovery Act (tracking hazardous waste)) - notification
FAR WEST (CONT.) (5263 BROADWAY TERRACE in OAKLAND, CA)
(National Center for Education Statistics) - STATE ID-0130146 Organizations: OAKLAND UNIFIED (SCHOOL DISTRICT)
HILLCREST ELEMENTARY (30 MARGUERITE DR. in OAKLAND, CA)
(National Center for Education Statistics) - STATE ID-6001911 Organizations: OAKLAND UNIFIED (SCHOOL DISTRICT)
KAISER ELEMENTARY (25 S. HILL CT. in OAKLAND, CA)
(National Center for Education Statistics) - STATE ID-6001895 Organizations: OAKLAND UNIFIED (SCHOOL DISTRICT)
NORTH OAKLAND COMMUNITY CHARTER (5951 COLLEGE AVE. in OAKLAND, CA)
(National Center for Education Statistics) - STATE ID-6117972 Organizations: OAKLAND UNIFIED (SCHOOL DISTRICT)
HWY 13 AT TUNNEL RD (HWY 13 AT TUNNEL RD in OAKLAND, CA)
Large Quantity Generators, more that 1000 kg of hazardous waste/month (Resource Conservation and Recovery Act (tracking hazardous waste)) Organizations: CA DEPT. OF TRANSPORTATION (CONTACT/OPERATOR)
, CA DEPT. OF TRANPORTATION (CONTACT/OWNER)
CAL TRANS CALDICOT TUNNEL (CALDICOT TUNNEL in OAKLAND, CA)
Small Quantity Generators, between 100 kg and 1000 kg of hazardous waste/month (Resource Conservation and Recovery Act (tracking hazardous waste))
J & L PEABERRY COFFEE & TEA CO (5655 COLLEGE AVENUE in OAKLAND, CA)
CRITERIA AND HAZARDOUS AIR POLLUTANT INVENTORY (Inventory of air pollution sources) Business SIC classification: ROASTED COFFEE
Housing units lacking complete kitchen facilities: 0.4%
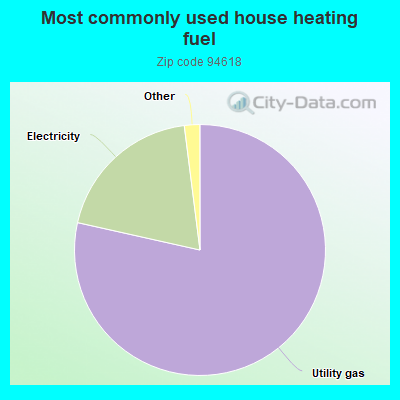
78.5%Utility gas
19.5%Electricity
1.0%Bottled, tank, or LP gas
0.6%Solar energy
Population in 1990: 15,763.
Place of birth for U.S.-born residents:
This state: 8,309
Northeast: 2,178
Midwest: 1,840
South: 1,229
West: 711
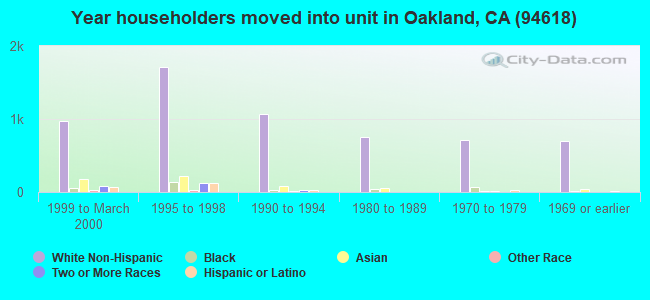
52% of the 94618 zip code residents lived in the same house 5 years ago. Out of people who lived in different houses, 44% lived in this county. Out of people who lived in different counties, 50% lived in California.
89% of the 94618 zip code residents lived in the same house 1 year ago. Out of people who lived in different houses, 39% moved from this county. Out of people who lived in different houses, 27% moved from different county within same state. Out of people who lived in different houses, 22% moved from different state. Out of people who lived in different houses, 15% moved from abroad.
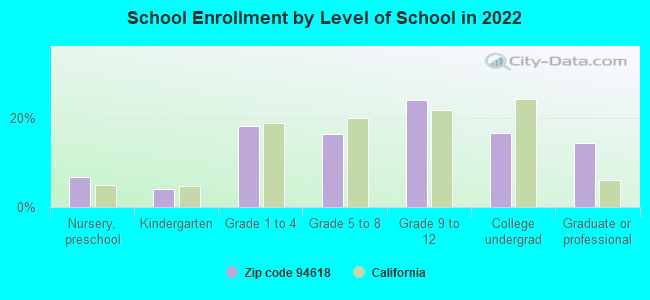
Private vs. public school enrollment:
Students in private schools in grades 1 to 8 (elementary and middle school): 670
Here:
48.6%
California:
10.5%
Students in private schools in grades 9 to 12 (high school): 440
Here:
47.4%
California:
8.5%
Students in private undergraduate colleges: 274
Here:
42.2%
California:
15.9%
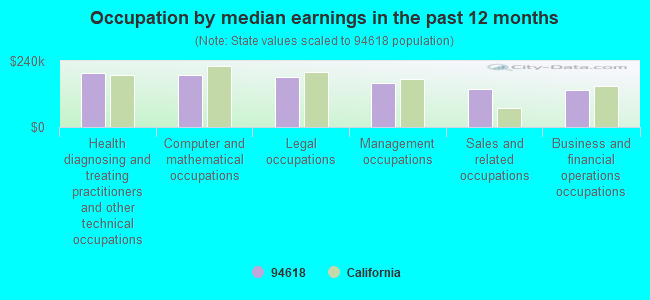
Occupation by median earnings in the past 12 months ($)
196,747Health diagnosing and treating practitioners and other technical occupations
190,429Computer and mathematical occupations
182,167Legal occupations
160,194Management occupations
138,679Sales and related occupations
135,593Business and financial operations occupations
Companies with federal contracts located in this zip code:
DREYER S/EDY S GRAND ICE CREAM (5929 COLLEGE AVE in OAKLAND, CA) : $36,635,140 in 64 contractsfrom 1999 to 2005
Contracts for Food Items For Resale, Non-Food Items For Resale by Defense Commissary Agency, Department of Defense Signed by year:2000: $2,098,951; 2001: $1,465,781; 2002: $3,300,290; 2003: $1,435,365; 2004: $8,152,444; 2005: $19,222,999; 2006: $0.
Biggest contracts:
$5,754,307 with Defense Commissary Agency for Food Items For Resale. Signed on 2005-04-01. Completion date: 2005-08-31.
$3,858,237, same as above.Signed on 2004-10-01. Completion date: 2005-02-28.
$3,137,496 with Defense Commissary Agency for Non-Food Items For Resale. Signed on 2005-10-01. Completion date: 2005-12-31.
$2,879,559 with Defense Commissary Agency for Food Items For Resale. Signed on 2005-04-01. Completion date: 2005-08-31.
BERKELEY EXOTECH, INC (320 FOREST STREET in OAKLAND, CA; small business) : $281,932 in 2 contractsfrom 2005 to 2006
$182,000 with Army for Other Research and Development -- Applied Research and Exploratory Development (R&D). Signed on 2006-05-16. Completion date: 2006-05-31.
$99,932 with Army for Biomedical -- Basic Research (R&D). Signed on 2005-07-15. Completion date: 2006-02-24.
CODETRONIX, LLC (5940 BUENA VISTA AVE in OAKLAND, CA; small business)
$95,946 with Army for Other Defense -- Applied Research and Exploratory Development (R&D). Signed on 2004-01-20. Completion date: 2004-09-15.
Top industries in this zip code by the number of employees in 2005:

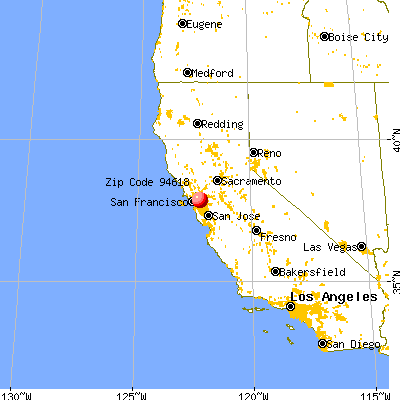


 Nearest zip codes: 94705, 94609, 94704, 94610, 94720, 94611.