Estimated zip code population in 2022: 20,234 Zip code population in 2010: 19,846 Zip code population in 2000: 19,743
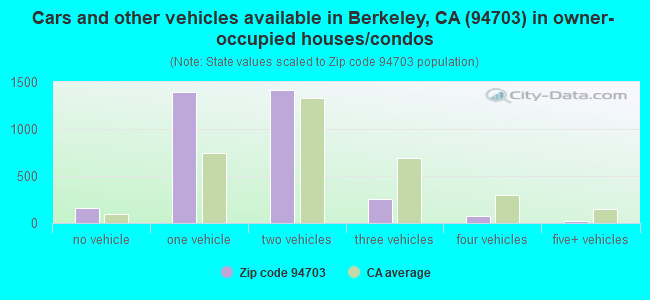
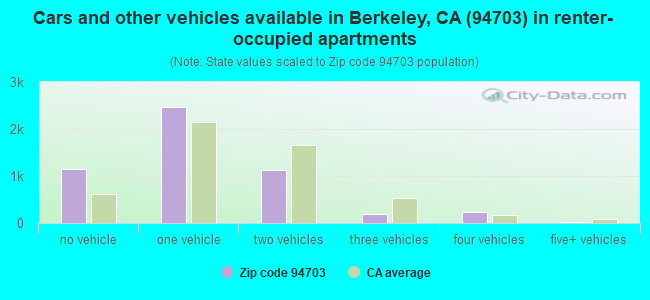
Houses and condos: 9,324 Renter-occupied apartments: 5,193
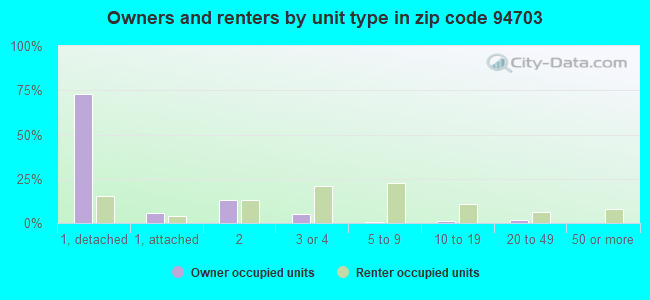
% of renters here:
61%
State:
44%
March 2022 cost of living index in zip code 94703: 125.1 (high, U.S. average is 100)
Land area: 1.3 sq. mi. Water area: 0.0 sq. mi.
Population density: 15,143 people per square mile
(very high).
OSM Map
General Map
Google Map
MSN Map
OSM Map
General Map
Google Map
MSN Map
OSM Map
General Map
Google Map
MSN Map
OSM Map
General Map
Google Map
MSN Map
Please wait while loading the map...
Real estate property taxes paid for housing units in 2022:
This zip code:
0.7% ($9,365)
California:
0.7% ($4,831)
Median real estate property taxes paid for housing units with mortgages in 2022: $10,330 (0.8%) Median real estate property taxes paid for housing units with no mortgage in 2022: $7,055 (0.6%)
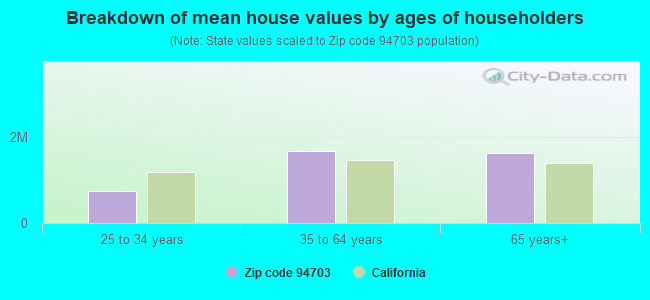
Estimated median house/condo value in 2022: $1,320,283
94703:
$1,320,283
California:
$715,900
According to our research of California and other state lists, there were 16 registered sex offenders living in 94703 zip code as of April 27, 2024. The ratio of all residents to sex offenders in zip code 94703 is 1,346 to 1. The ratio of registered sex offenders to all residents in this zip code is lower than the state average.
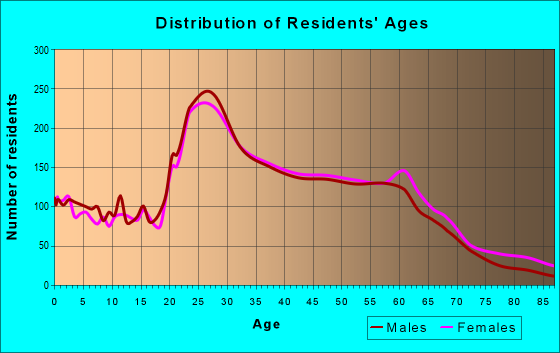
Median resident age:
This zip code:
36.0 years
California median age:
37.9 years
Average household size:
This zip code:
2.4 people
California:
2.8 people
Averages for the 2020 tax year for zip code 94703, filed in 2021:
Average Adjusted Gross Income (AGI) in 2020: $109,472 (Individual Income Tax Returns)
Here:
$109,472
State:
$95,910
Salary/wage: $96,207 (reported on 78.5% of returns)
Here:
$96,207
State:
$77,331
(% of AGI for various income ranges: 1097.0% for AGIs below $25k, 4028.6% for AGIs $25k-50k, 7634.5% for AGIs $50k-75k, 11393.2% for AGIs $75k-100k, 20485.7% for AGIs $100k-200k, 105308.3% for AGIs over 200k)
Taxable interest for individuals: $1,526 (reported on 44.3% of returns)
This zip code:
$1,526
California:
$2,294
(% of AGI for various income ranges: 26.0% for AGIs below $25k, 33.9% for AGIs $25k-50k, 47.3% for AGIs $50k-75k, 119.6% for AGIs $75k-100k, 205.9% for AGIs $100k-200k, 860.0% for AGIs over 200k)
Ordinary dividends: $8,144 (reported on 35.3% of returns)
Here:
$8,144
State:
$10,949
(% of AGI for various income ranges: 68.9% for AGIs below $25k, 90.4% for AGIs $25k-50k, 169.9% for AGIs $50k-75k, 425.4% for AGIs $75k-100k, 724.3% for AGIs $100k-200k, 4604.3% for AGIs over 200k)
Net capital gain/loss in AGI: +$29,517 (reported on 32.6% of returns)
Here:
+$29,517
State:
+$49,306
(% of AGI for various income ranges: 39.4% for AGIs below $25k, 81.7% for AGIs $25k-50k, 204.5% for AGIs $50k-75k, 414.2% for AGIs $75k-100k, 1150.2% for AGIs $100k-200k, 22483.1% for AGIs over 200k)
Profit/loss from business: +$19,994 (reported on 23.2% of returns)
Here:
+$19,994
State:
+$15,671
(% of AGI for various income ranges: 207.7% for AGIs below $25k, 366.1% for AGIs $25k-50k, 476.6% for AGIs $50k-75k, 825.8% for AGIs $75k-100k, 1238.6% for AGIs $100k-200k, 5296.3% for AGIs over 200k)
Taxable individual retirement arrangement distribution: $19,133 (reported on 7.8% of returns)
94703:
$19,133
California:
$23,505
(% of AGI for various income ranges: 51.1% for AGIs below $25k, 72.7% for AGIs $25k-50k, 158.9% for AGIs $50k-75k, 302.6% for AGIs $75k-100k, 578.7% for AGIs $100k-200k, 1443.4% for AGIs over 200k)
Self-employed (Keogh) retirement plans: $23,546 (reported on 2.5% of returns)
94703:
$23,546
California:
$30,163
(% of AGI for various income ranges: 32.3% for AGIs $25k-50k, 65.6% for AGIs $75k-100k, 111.1% for AGIs $100k-200k, 1135.4% for AGIs over 200k)
Total itemized deductions: $35,328 (reported on 15.6% of returns)
Here:
$35,328
State:
$39,517
(% of AGI for various income ranges: 142.4% for AGIs below $25k, 201.4% for AGIs $25k-50k, 348.3% for AGIs $50k-75k, 773.4% for AGIs $75k-100k, 1714.1% for AGIs $100k-200k, 7904.0% for AGIs over 200k)
Charity contributions: $10,110 (reported on 12.8% of returns)
Here:
$10,110
State:
$12,598
(% of AGI for various income ranges: 8.1% for AGIs below $25k, 22.7% for AGIs $25k-50k, 41.7% for AGIs $50k-75k, 128.2% for AGIs $75k-100k, 275.3% for AGIs $100k-200k, 2544.3% for AGIs over 200k)
Taxes paid: $8,980 (reported on 15.5% of returns)
94703:
$8,980
State:
$8,807
(% of AGI for various income ranges: 29.1% for AGIs below $25k, 45.2% for AGIs $25k-50k, 97.4% for AGIs $50k-75k, 251.0% for AGIs $75k-100k, 511.0% for AGIs $100k-200k, 1754.9% for AGIs over 200k)
Earned income credit: $1,540 (reported on 8.2% of returns)
Here:
$1,540
State:
$2,074
(% of AGI for various income ranges: 57.0% for AGIs below $25k, 32.5% for AGIs $25k-50k)
Percentage of individuals using paid preparers for their 2020 taxes: 91.5%
Here:
91%
State:
92%
(% for various income ranges: 88.7% for AGIs below $25k, 91.5% for AGIs $25k-50k, 91.9% for AGIs $50k-75k, 90.3% for AGIs $75k-100k, 92.4% for AGIs $100k-200k, 95.3% for AGIs over 200k)
Averages for the 2012 tax year for zip code 94703, filed in 2013:
Average Adjusted Gross Income (AGI) in 2012: $62,776 (Individual Income Tax Returns)
Here:
$62,776
State:
$72,726
Salary/wage: $55,886 (reported on 81.6% of returns)
Here:
$55,886
State:
$59,079
(% of AGI for various income ranges: 71.6% for AGIs below $25k, 80.6% for AGIs $25k-50k, 76.3% for AGIs $50k-75k, 74.5% for AGIs $75k-100k, 76.1% for AGIs $100k-200k, 61.2% for AGIs over 200k)
Taxable interest for individuals: $1,100 (reported on 40.7% of returns)
This zip code:
$1,100
California:
$2,146
(% of AGI for various income ranges: 1.1% for AGIs below $25k, 0.6% for AGIs $25k-50k, 0.9% for AGIs $50k-75k, 0.6% for AGIs $75k-100k, 0.6% for AGIs $100k-200k, 0.8% for AGIs over 200k)
Ordinary dividends: $5,568 (reported on 27.1% of returns)
Here:
$5,568
State:
$9,308
(% of AGI for various income ranges: 3.0% for AGIs below $25k, 1.6% for AGIs $25k-50k, 2.3% for AGIs $50k-75k, 1.9% for AGIs $75k-100k, 2.5% for AGIs $100k-200k, 2.9% for AGIs over 200k)
Net capital gain/loss in AGI: +$11,696 (reported on 22.9% of returns)
Here:
+$11,696
State:
+$30,460
(% of AGI for various income ranges: 0.3% for AGIs below $25k, 0.5% for AGIs $25k-50k, 1.0% for AGIs $50k-75k, 1.1% for AGIs $75k-100k, 1.7% for AGIs $100k-200k, 14.1% for AGIs over 200k)
Profit/loss from business: +$17,442 (reported on 24.0% of returns)
Here:
+$17,442
State:
+$17,064
(% of AGI for various income ranges: 14.1% for AGIs below $25k, 7.3% for AGIs $25k-50k, 5.9% for AGIs $50k-75k, 6.2% for AGIs $75k-100k, 6.4% for AGIs $100k-200k, 5.1% for AGIs over 200k)
Taxable individual retirement arrangement distribution: $13,635 (reported on 7.1% of returns)
94703:
$13,635
California:
$19,557
(% of AGI for various income ranges: 2.0% for AGIs below $25k, 1.1% for AGIs $25k-50k, 1.6% for AGIs $50k-75k, 1.8% for AGIs $75k-100k, 1.7% for AGIs $100k-200k, 1.3% for AGIs over 200k)
Self-employment retirement plans: $16,200 (reported on 2.2% of returns)
94703:
$16,200
California:
$24,530
(% of AGI for various income ranges: 0.3% for AGIs $25k-50k, 0.3% for AGIs $50k-75k, 0.4% for AGIs $75k-100k, 0.6% for AGIs $100k-200k, 1.0% for AGIs over 200k)
Total itemized deductions: $27,081 (22% of AGI, reported on 31.9% of returns)
Here:
$27,081
State:
$34,004
Here:
21.7% of AGI
State:
22.7% of AGI
(% of AGI for various income ranges: 9.5% for AGIs below $25k, 7.8% for AGIs $25k-50k, 11.9% for AGIs $50k-75k, 13.5% for AGIs $75k-100k, 17.0% for AGIs $100k-200k, 16.0% for AGIs over 200k)
Charity contributions: $3,085 (reported on 25.5% of returns)
Here:
$3,085
State:
$4,659
(% of AGI for various income ranges: 0.5% for AGIs below $25k, 0.6% for AGIs $25k-50k, 1.1% for AGIs $50k-75k, 1.1% for AGIs $75k-100k, 1.3% for AGIs $100k-200k, 1.9% for AGIs over 200k)
Taxes paid: $12,388 (reported on 31.8% of returns)
94703:
$12,388
State:
$14,448
(% of AGI for various income ranges: 2.3% for AGIs below $25k, 2.2% for AGIs $25k-50k, 4.2% for AGIs $50k-75k, 5.7% for AGIs $75k-100k, 8.1% for AGIs $100k-200k, 9.2% for AGIs over 200k)
Earned income credit: $1,550 (reported on 12.5% of returns)
Here:
$1,550
State:
$2,286
(% of AGI for various income ranges: 3.7% for AGIs below $25k, 0.4% for AGIs $25k-50k)
Percentage of individuals using paid preparers for their 2012 taxes: 42.6%
Here:
43%
State:
64%
(% for various income ranges: 38.6% for AGIs below $25k, 37.1% for AGIs $25k-50k, 41.4% for AGIs $50k-75k, 47.7% for AGIs $75k-100k, 53.9% for AGIs $100k-200k, 65.1% for AGIs over 200k)
Averages for the 2004 tax year for zip code 94703, filed in 2005:
Average Adjusted Gross Income (AGI) in 2004: $45,100 (Individual Income Tax Returns)
Here:
$45,100
State:
$58,600
Salary/wage: $41,571 (reported on 82.7% of returns)
Here:
$41,571
State:
$49,455
(% of AGI for various income ranges: 164.0% for AGIs below $10k, 77.0% for AGIs $10k-25k, 83.3% for AGIs $25k-50k, 81.5% for AGIs $50k-75k, 78.2% for AGIs $75k-100k, 67.0% for AGIs over 100k)
Taxable interest for individuals: $1,245 (reported on 47.0% of returns)
This zip code:
$1,245
California:
$2,365
(% of AGI for various income ranges: 6.9% for AGIs below $10k, 1.7% for AGIs $10k-25k, 1.3% for AGIs $25k-50k, 1.1% for AGIs $50k-75k, 1.3% for AGIs $75k-100k, 1.1% for AGIs over 100k)
Taxable dividends: $3,044 (reported on 28.5% of returns)
Here:
$3,044
State:
$4,746
(% of AGI for various income ranges: 9.7% for AGIs below $10k, 1.6% for AGIs $10k-25k, 1.7% for AGIs $25k-50k, 1.5% for AGIs $50k-75k, 1.8% for AGIs $75k-100k, 2.2% for AGIs over 100k)
Net capital gain/loss: +$9,714 (reported on 23.3% of returns)
Here:
+$9,714
State:
+$23,418
(% of AGI for various income ranges: -2.9% for AGIs below $10k, 0.2% for AGIs $10k-25k, 0.8% for AGIs $25k-50k, 1.0% for AGIs $50k-75k, 1.9% for AGIs $75k-100k, 11.5% for AGIs over 100k)
Profit/loss from business: +$15,373 (reported on 21.8% of returns)
Here:
+$15,373
State:
+$16,826
(% of AGI for various income ranges: 27.8% for AGIs below $10k, 8.6% for AGIs $10k-25k, 5.8% for AGIs $25k-50k, 6.1% for AGIs $50k-75k, 6.8% for AGIs $75k-100k, 8.2% for AGIs over 100k)
IRA payment deduction: $2,940 (reported on 3.7% of returns)
94703:
$2,940
California:
$3,192
(% of AGI for various income ranges: 1.1% for AGIs below $10k, 0.4% for AGIs $10k-25k, 0.4% for AGIs $25k-50k, 0.2% for AGIs $50k-75k, 0.2% for AGIs $75k-100k, 0.1% for AGIs over 100k)
Self-employed pension: $11,595 (reported on 3.1% of returns)
Here:
$11,595
California:
$17,688
(% of AGI for various income ranges: 0.3% for AGIs $10k-25k, 0.4% for AGIs $25k-50k, 0.5% for AGIs $50k-75k, 0.8% for AGIs $75k-100k, 1.3% for AGIs over 100k)
Total itemized deductions: $21,488 (25% of AGI, reported on 32.4% of returns)
Here:
$21,488
State:
$28,113
Here:
24.7% of AGI
State:
25.3% of AGI
(% of AGI for various income ranges: 26.3% for AGIs below $10k, 8.9% for AGIs $10k-25k, 9.8% for AGIs $25k-50k, 16.9% for AGIs $50k-75k, 19.8% for AGIs $75k-100k, 17.4% for AGIs over 100k)
Charity contributions deductions: $2,551 (3% of AGI, reported on 27.2% of returns)
Here:
$2,551
State:
$3,923
Here:
2.7% of AGI
State:
3.3% of AGI
(% of AGI for various income ranges: 0.9% for AGIs below $10k, 0.8% for AGIs $10k-25k, 1.0% for AGIs $25k-50k, 1.6% for AGIs $50k-75k, 2.0% for AGIs $75k-100k, 1.8% for AGIs over 100k)
Total tax: $7,171 (reported on 79.6% of returns)
94703:
$7,171
State:
$10,761
(% of AGI for various income ranges: 7.7% for AGIs below $10k, 5.6% for AGIs $10k-25k, 8.7% for AGIs $25k-50k, 11.4% for AGIs $50k-75k, 12.3% for AGIs $75k-100k, 17.3% for AGIs over 100k)
Earned income credit: $1,264 (reported on 12.2% of returns)
Here:
$1,264
State:
$1,763
Percentage of individuals using paid preparers for their 2004 taxes: 46.6%
Here:
47%
State:
66%
(% for various income ranges: 42.1% for AGIs below $10k, 42.2% for AGIs $10k-25k, 46.1% for AGIs $25k-50k, 48.6% for AGIs $50k-75k, 56.3% for AGIs $75k-100k, 57.5% for AGIs over 100k)
Likely homosexual households (counted as self-reported same-sex unmarried-partner households)
Lesbian couples: 0.4% of all households
Gay men: 0.4% of all households
Household received Food Stamps/SNAP in the past 12 months: 1,158 Household did not receive Food Stamps/SNAP in the past 12 months: 7,343
Women who had a birth in the past 12 months: 115 (97 now married, 17 unmarried) Women who did not have a birth in the past 12 months: 5,797 (1,684 now married, 4,137 unmarried)
Housing units in zip code 94703 with a mortgage: 2,301 (252 second mortgage, 5 home equity loan, 233 both second mortgage and home equity loan) Houses without a mortgage: 9
Median monthly owner costs for units with a mortgage: $3,665 Median monthly owner costs for units without a mortgage: $995
Residents with income below the poverty level in 2022:
This zip code:
12.1%
Whole state:
12.2%
Residents with income below 50% of the poverty level in 2022:
This zip code:
4.8%
Whole state:
6.2%
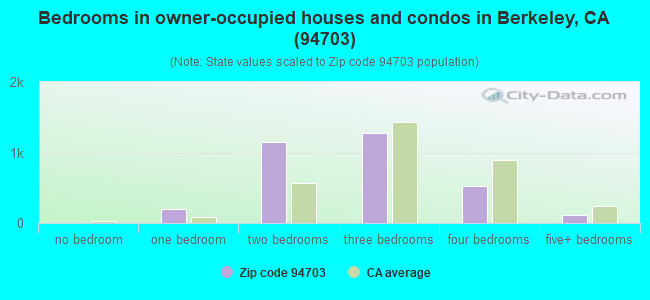
Median number of rooms in houses and condos:
Here:
6.1
State:
6.0
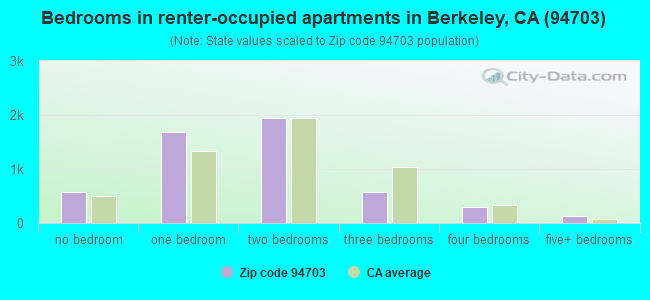
Median number of rooms in apartments:
Here:
3.7
State:
3.9
Notable locations in this zip code not listed on our city pages
Notable locations in zip code 94703: South Branch Berkeley Public Library (A), Berkeley City Hall (B), South Berkeley YMCA (C), South Berkeley Senior Citizens Center (D), Harriet Tubman Terrace (E). Display/hide their locations on the map
Churches in zip code 94703 include: Berkeley Mission Covenant Church (A), South Berkeley Community Congregational Church (B), South Berkeley Church of Christ (C), Saint Paul African Methodist Episcopal Church (D), Saint John Orthodox Church (E), Progressive Baptist Church (F), Philips Temple Church (G), McGee Avenue Baptist Church (H), Grove Street Christian Church (I). Display/hide their locations on the map
1,940 married couples with children.
600 single-parent households (80 men, 520 women).
75.6% of residents of 94703 zip code speak English at home.
12.2% of residents speak Spanish at home (72% very well, 15% well, 10% not well, 4% not at all).
5.1% of residents speak other Indo-European language at home (84% very well, 9% well, 7% not well).
5.2% of residents speak Asian or Pacific Island language at home (49% very well, 31% well, 16% not well, 3% not at all).
1.3% of residents speak other language at home (71% very well, 19% well, 10% not well).
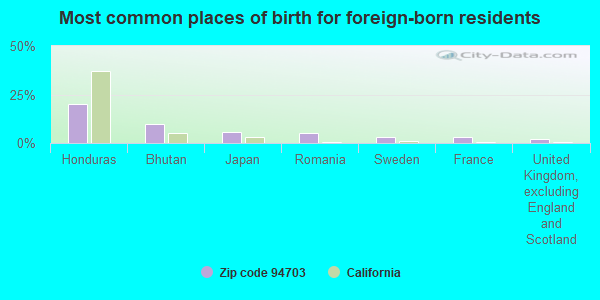
Foreign born population: 3,663 (18.1%) (44.7% of them are naturalized citizens)
Facilities with environmental interests located in this zip code:
CHEVRON STATION 90877 (1500 UNIVERSITY AVE in BERKELEY, CA)
STATE MASTER (California - Hazardous Waste Tracking) - HAZARDOU WASTE PROGRAM HAZARDOUS WASTE BIENNIAL REPORTER (Resource Conservation and Recovery Act (tracking hazardous waste)) Large Quantity Generators, more that 1000 kg of hazardous waste/month (Resource Conservation and Recovery Act (tracking hazardous waste)) Small Quantity Generators, between 100 kg and 1000 kg of hazardous waste/month (Resource Conservation and Recovery Act (tracking hazardous waste)) - notification Organizations: CHEVRON PRODUCTS CO (CONTACT/OWNER)
Alternative names: CHEVRON 90877
MONSEN PLATING & SILVERSMITHS (3370 ADELINE ST in BERKELEY, CA)
STATE MASTER (California - Hazardous Waste Tracking) - HAZARDOU WASTE PROGRAM National Pollutant Discharge Elimination System NON-MAJOR (Tracking pollutant discharge elimination systems) - permit Conditionally Exempt Small Quantity Generators, less than 100 kg/month of hazardous waste (Resource Conservation and Recovery Act (tracking hazardous waste)) Business SIC classification: SCREW MACHINE PRODUCTS Organizations: JON DIAMOND (CONTACT/OPERATOR)
, GARY REOPPLE (CONTACT/OWNER)
MALCOLM X ELEMENTARY (1731 PRINCE ST. in BERKELEY, CA)
(National Center for Education Statistics) - STATE ID-6090286 Small Quantity Generators, between 100 kg and 1000 kg of hazardous waste/month (Resource Conservation and Recovery Act (tracking hazardous waste)) Organizations: BERKELEY UNIFIED SCHOOL DISTRICT (CONTACT/OPERATOR)
, BERKELEY UNIFIED (SCHOOL DISTRICT)
Alternative names: MALCOLM X ELEMENTRY SCHOOL
MARTIN LUTHER KING MIDDLE SCHOOL (1781 ROSE ST in BERKELEY, CA)
(National Center for Education Statistics) - STATE ID-6056857 Small Quantity Generators, between 100 kg and 1000 kg of hazardous waste/month (Resource Conservation and Recovery Act (tracking hazardous waste)) - notification Organizations: BERKELEY UNIFIED SCHOOL DIST (CONTACT/OWNER)
, BERKELEY UNIFIED (SCHOOL DISTRICT)
LONGFELLOW ARTS & TECHNOLOGY MIDDLE (1500 DERBY ST. in BERKELEY, CA)
(National Center for Education Statistics) - STATE ID-6090294 Organizations: BERKELEY UNIFIED (SCHOOL DISTRICT)
JIM DOTEN'S FIDELITY (1824 UNIVERSITY AVE in BERKELEY, CA)
(Resource Conservation and Recovery Act (tracking hazardous waste))
EUWELL CLEANERS (1806 ALCATRAZ AVENUE in BERKELEY, CA)
CRITERIA AND HAZARDOUS AIR POLLUTANT INVENTORY (Inventory of air pollution sources) Small Quantity Generators, between 100 kg and 1000 kg of hazardous waste/month (Resource Conservation and Recovery Act (tracking hazardous waste)) Business SIC classification: DRYCLEANING PLANTS, EXCEPT RUG CLEANING Organizations: EUWELLS CLEANERS (CONTACT/OWNER)
Alternative names: EUWELLS CLEANERS
M AND J AUTO BODY (3033 SAN PABLO AVENUE in BERKELEY, CA)
CRITERIA AND HAZARDOUS AIR POLLUTANT INVENTORY (Inventory of air pollution sources) Small Quantity Generators, between 100 kg and 1000 kg of hazardous waste/month (Resource Conservation and Recovery Act (tracking hazardous waste)) Business SIC classification: TOP, BODY, AND UPHOLSTERY REPAIR SHOPS AND PAINT SHOPS Organizations: MARK E ICANBERRY (CONTACT/OWNER)
Alternative names: AACME HYDRAMATIC SER
HAMSEM TUNE UP (1933 ADDISON ST in BERKELEY, CA)
Small Quantity Generators, between 100 kg and 1000 kg of hazardous waste/month (Resource Conservation and Recovery Act (tracking hazardous waste)) Organizations: KEITH S HALL (CONTACT/OWNER)
MACS FOREIGN CAR SVC (1790 UNIVERSITY AVE in BERKELEY, CA)
Small Quantity Generators, between 100 kg and 1000 kg of hazardous waste/month (Resource Conservation and Recovery Act (tracking hazardous waste)) - notification Organizations: D MICHALEK (CONTACT/OWNER)
LONGFELLOW JR HIGH SCHOOL (1500 DERBY ST in BERKELEY, CA)
Small Quantity Generators, between 100 kg and 1000 kg of hazardous waste/month (Resource Conservation and Recovery Act (tracking hazardous waste)) - notification Organizations: BERKELEY UNIFIED SCHOOL DIST (CONTACT/OWNER)
MOHAMMED MOSLEH (3198 ADELINE ST in BERKELEY, CA)
COMPLIANCE ACTIVITY (Tracking inspections of insecticide, fungicide, and rodenticide, and toxic substances)
ANTO OFFSET PRINTING (1798 UNIVERSITY AVE in BERKELEY, CA)
CRITERIA AND HAZARDOUS AIR POLLUTANT INVENTORY (Inventory of air pollution sources) Business SIC classification: COMMERCIAL PRINTING, LITHOGRAPHIC
Housing units lacking complete plumbing facilities: 1.1% Housing units lacking complete kitchen facilities: 1.5%
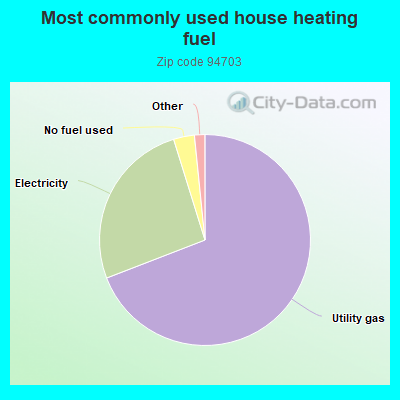
69.2%Utility gas
26.1%Electricity
3.2%No fuel used
0.7%Solar energy
0.5%Bottled, tank, or LP gas
Population in 1990: 18,554. Population change in the 1990s: +1,189 (+6.4%).
Place of birth for U.S.-born residents:
This state: 9,682
Northeast: 2,252
Midwest: 1,491
South: 1,866
West: 807
51% of the 94703 zip code residents lived in the same house 5 years ago. Out of people who lived in different houses, 42% lived in this county. Out of people who lived in different counties, 50% lived in California.
85% of the 94703 zip code residents lived in the same house 1 year ago. Out of people who lived in different houses, 42% moved from this county. Out of people who lived in different houses, 31% moved from different county within same state. Out of people who lived in different houses, 18% moved from different state. Out of people who lived in different houses, 8% moved from abroad.
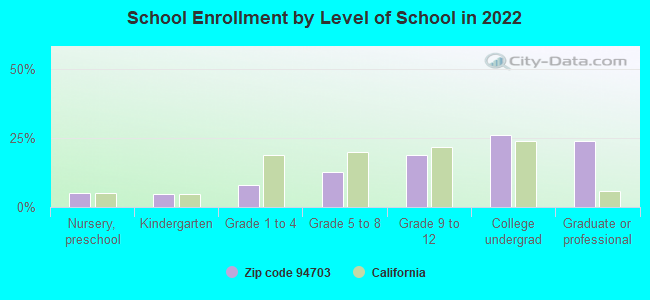
Private vs. public school enrollment:
Students in private schools in grades 1 to 8 (elementary and middle school): 163
Here:
15.9%
California:
10.5%
Students in private schools in grades 9 to 12 (high school): 47
Here:
5.1%
California:
8.5%
Students in private undergraduate colleges: 91
Here:
7.2%
California:
15.9%
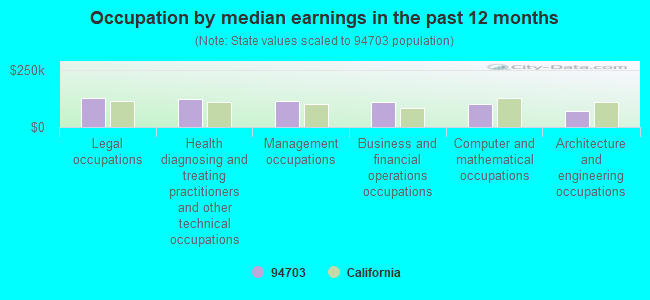
Occupation by median earnings in the past 12 months ($)
128,433Legal occupations
122,324Health diagnosing and treating practitioners and other technical occupations
113,186Management occupations
109,462Business and financial operations occupations
98,920Computer and mathematical occupations
71,808Architecture and engineering occupations
Companies with federal contracts located in this zip code:
BERKELEY MICROINSTRUMENTS, INC (1316 JOSEPHINE STREET in BERKELEY, CA; small business)
$70,782 with Air Force for Other Research and Development -- Applied Research and Exploratory Development (R&D). Signed on 2001-04-12. Completion date: 2001-03-29.
GOEBEL, JOHN & DAY,MARILYN (1849 UNIVERSITY AVE in BERKELEY, CA; small business) : $21,826 in 2 contractsfrom 2003 to 2004
$14,586 with Army for Musical Instruments. Taking place in GA. Signed on 2003-03-11. Completion date: 2003-12-22.
$7,240 with Army for Musical Instruments. Signed on 2004-12-08. Completion date: 2004-12-15.
Top industries in this zip code by the number of employees in 2005:
Other Services (except Public Administration): Religious Organizations (10-19 employees: 3 establishments, 5-9 employees: 4 establishments, 1-4 employees: 6 establishments)
2005 - 2018 National Fire Incident Reporting System (NFIRS) incidents
According to the data from the years 2005 - 2018 the average number of fire incidents per year is 16. The highest number of reported fire incidents - 58 took place in 2006, and the least - 0 in 2008. The data has a decreasing trend.
When looking into fire subcategories, the most reports belonged to: Outside Fires (44.5%), and Structure Fires (38.4%).
Fire incident types reported to NFIRS in Zip Code 94703


 Nearest zip codes: 94702, 94709, 94704, 94720, 94608, 94710.
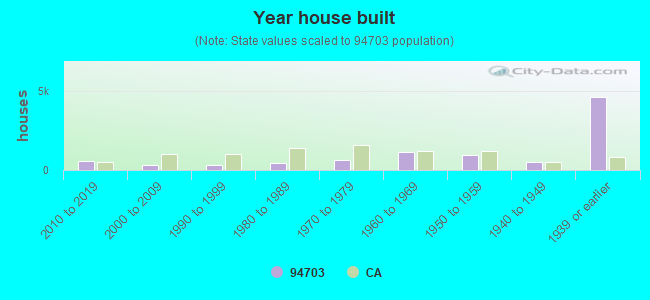


 According to the data from the years 2005 - 2018 the average number of fire incidents per year is 16. The highest number of reported fire incidents - 58 took place in 2006, and the least - 0 in 2008. The data has a decreasing trend.
 When looking into fire subcategories, the most reports belonged to: Outside Fires (44.5%), and Structure Fires (38.4%).