Estimated zip code population in 2022: 62,814 Zip code population in 2010: 60,212 Zip code population in 2000: 58,535
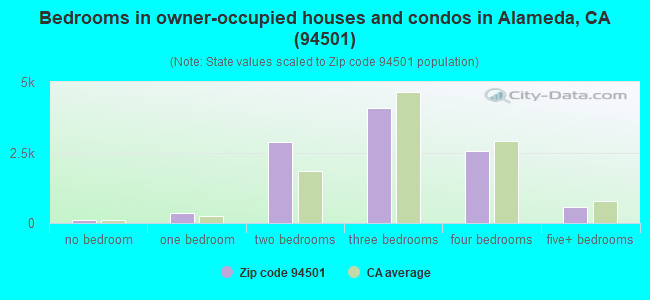
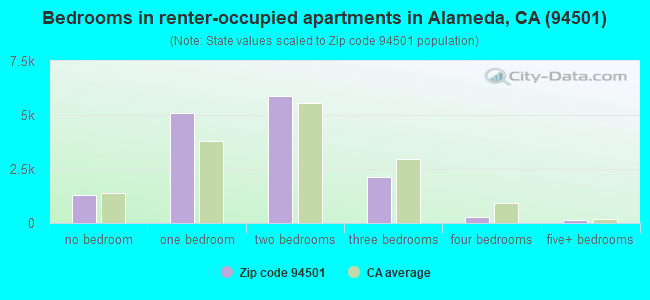
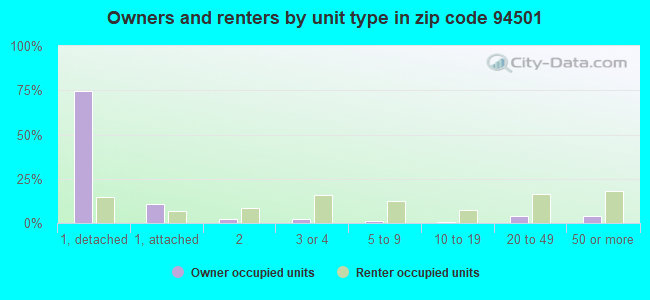
Houses and condos: 27,353 Renter-occupied apartments: 14,823
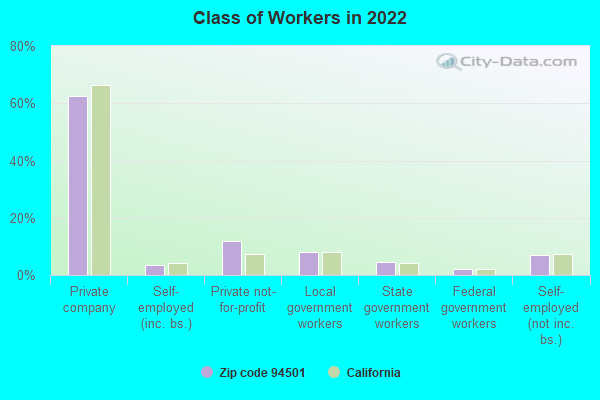
% of renters here:
58%
State:
44%
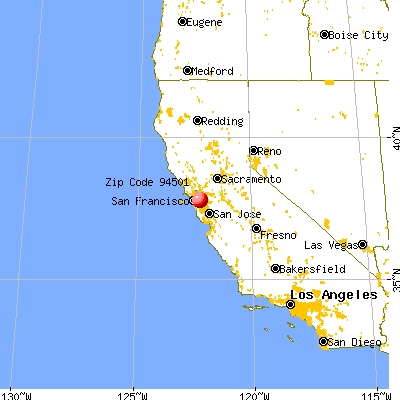
March 2022 cost of living index in zip code 94501: 122.3 (high, U.S. average is 100)
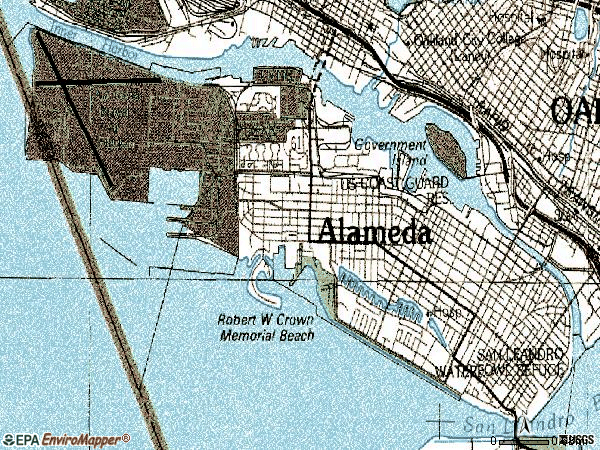
Land area: 7.9 sq. mi. Water area: 3.5 sq. mi.
Population density: 7,928 people per square mile
(high).
OSM Map
General Map
Google Map
MSN Map
OSM Map
General Map
Google Map
MSN Map
OSM Map
General Map
Google Map
MSN Map
OSM Map
General Map
Google Map
MSN Map
Please wait while loading the map...
Real estate property taxes paid for housing units in 2022:
This zip code:
0.7% ($8,738)
California:
0.7% ($4,831)
Median real estate property taxes paid for housing units with mortgages in 2022: $10,139 (0.8%) Median real estate property taxes paid for housing units with no mortgage in 2022: $5,936 (0.5%)
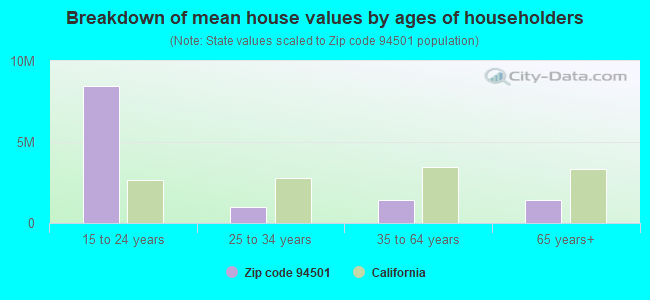
Estimated median house/condo value in 2022: $1,246,989
94501:
$1,246,989
California:
$715,900
According to our research of California and other state lists, there were 26 registered sex offenders living in 94501 zip code as of April 27, 2024. The ratio of all residents to sex offenders in zip code 94501 is 2,467 to 1. The ratio of registered sex offenders to all residents in this zip code is much lower than the state average.
Median resident age:
This zip code:
40.8 years
California median age:
37.9 years
Average household size:
This zip code:
2.4 people
California:
2.8 people
Averages for the 2020 tax year for zip code 94501, filed in 2021:
Average Adjusted Gross Income (AGI) in 2020: $119,043 (Individual Income Tax Returns)
Here:
$119,043
State:
$95,910
Salary/wage: $107,896 (reported on 80.0% of returns)
Here:
$107,896
State:
$77,331
(% of AGI for various income ranges: 1120.8% for AGIs below $25k, 3841.3% for AGIs $25k-50k, 7411.7% for AGIs $50k-75k, 11270.6% for AGIs $75k-100k, 20970.4% for AGIs $100k-200k, 111174.2% for AGIs over 200k)
Taxable interest for individuals: $1,702 (reported on 42.6% of returns)
This zip code:
$1,702
California:
$2,294
(% of AGI for various income ranges: 28.4% for AGIs below $25k, 40.0% for AGIs $25k-50k, 58.8% for AGIs $50k-75k, 88.8% for AGIs $75k-100k, 172.6% for AGIs $100k-200k, 878.5% for AGIs over 200k)
Ordinary dividends: $6,494 (reported on 31.5% of returns)
Here:
$6,494
State:
$10,949
(% of AGI for various income ranges: 50.0% for AGIs below $25k, 88.5% for AGIs $25k-50k, 137.1% for AGIs $50k-75k, 221.5% for AGIs $75k-100k, 510.4% for AGIs $100k-200k, 2695.2% for AGIs over 200k)
Net capital gain/loss in AGI: +$30,256 (reported on 30.3% of returns)
Here:
+$30,256
State:
+$49,306
(% of AGI for various income ranges: 20.0% for AGIs below $25k, 92.0% for AGIs $25k-50k, 134.7% for AGIs $50k-75k, 209.4% for AGIs $75k-100k, 665.4% for AGIs $100k-200k, 19820.6% for AGIs over 200k)
Profit/loss from business: +$19,833 (reported on 19.5% of returns)
Here:
+$19,833
State:
+$15,671
(% of AGI for various income ranges: 195.8% for AGIs below $25k, 292.9% for AGIs $25k-50k, 324.8% for AGIs $50k-75k, 527.5% for AGIs $75k-100k, 929.5% for AGIs $100k-200k, 4166.2% for AGIs over 200k)
Taxable individual retirement arrangement distribution: $22,245 (reported on 8.4% of returns)
94501:
$22,245
California:
$23,505
(% of AGI for various income ranges: 59.9% for AGIs below $25k, 116.9% for AGIs $25k-50k, 183.3% for AGIs $50k-75k, 334.4% for AGIs $75k-100k, 638.3% for AGIs $100k-200k, 1568.6% for AGIs over 200k)
Self-employed (Keogh) retirement plans: $25,928 (reported on 1.8% of returns)
94501:
$25,928
California:
$30,163
(% of AGI for various income ranges: 12.6% for AGIs $25k-50k, 13.1% for AGIs $50k-75k, 26.9% for AGIs $75k-100k, 97.4% for AGIs $100k-200k, 789.3% for AGIs over 200k)
Total itemized deductions: $34,443 (reported on 18.3% of returns)
Here:
$34,443
State:
$39,517
(% of AGI for various income ranges: 113.0% for AGIs below $25k, 231.4% for AGIs $25k-50k, 390.2% for AGIs $50k-75k, 807.9% for AGIs $75k-100k, 1730.3% for AGIs $100k-200k, 8051.1% for AGIs over 200k)
Charity contributions: $6,708 (reported on 14.8% of returns)
Here:
$6,708
State:
$12,598
(% of AGI for various income ranges: 4.9% for AGIs below $25k, 21.0% for AGIs $25k-50k, 38.7% for AGIs $50k-75k, 87.6% for AGIs $75k-100k, 221.9% for AGIs $100k-200k, 1581.2% for AGIs over 200k)
Taxes paid: $9,165 (reported on 18.2% of returns)
94501:
$9,165
State:
$8,807
(% of AGI for various income ranges: 25.3% for AGIs below $25k, 47.2% for AGIs $25k-50k, 114.3% for AGIs $50k-75k, 247.1% for AGIs $75k-100k, 520.6% for AGIs $100k-200k, 1956.2% for AGIs over 200k)
Earned income credit: $1,749 (reported on 8.8% of returns)
Here:
$1,749
State:
$2,074
(% of AGI for various income ranges: 71.0% for AGIs below $25k, 53.3% for AGIs $25k-50k, 0.7% for AGIs $50k-75k)
Percentage of individuals using paid preparers for their 2020 taxes: 91.6%
Here:
92%
State:
92%
(% for various income ranges: 89.1% for AGIs below $25k, 91.2% for AGIs $25k-50k, 91.1% for AGIs $50k-75k, 90.9% for AGIs $75k-100k, 92.9% for AGIs $100k-200k, 95.0% for AGIs over 200k)
Averages for the 2012 tax year for zip code 94501, filed in 2013:
Average Adjusted Gross Income (AGI) in 2012: $72,877 (Individual Income Tax Returns)
Here:
$72,877
State:
$72,726
Salary/wage: $67,185 (reported on 81.6% of returns)
Here:
$67,185
State:
$59,079
(% of AGI for various income ranges: 68.5% for AGIs below $25k, 77.7% for AGIs $25k-50k, 78.7% for AGIs $50k-75k, 78.4% for AGIs $75k-100k, 79.1% for AGIs $100k-200k, 67.9% for AGIs over 200k)
Taxable interest for individuals: $1,225 (reported on 41.5% of returns)
This zip code:
$1,225
California:
$2,146
(% of AGI for various income ranges: 1.3% for AGIs below $25k, 0.6% for AGIs $25k-50k, 0.8% for AGIs $50k-75k, 0.7% for AGIs $75k-100k, 0.6% for AGIs $100k-200k, 0.7% for AGIs over 200k)
Ordinary dividends: $5,009 (reported on 25.2% of returns)
Here:
$5,009
State:
$9,308
(% of AGI for various income ranges: 1.9% for AGIs below $25k, 1.3% for AGIs $25k-50k, 1.5% for AGIs $50k-75k, 1.6% for AGIs $75k-100k, 1.6% for AGIs $100k-200k, 2.2% for AGIs over 200k)
Net capital gain/loss in AGI: +$10,392 (reported on 21.4% of returns)
Here:
+$10,392
State:
+$30,460
(% of AGI for various income ranges: 0.3% for AGIs $25k-50k, 0.5% for AGIs $50k-75k, 0.6% for AGIs $75k-100k, 1.4% for AGIs $100k-200k, 9.0% for AGIs over 200k)
Profit/loss from business: +$19,331 (reported on 19.1% of returns)
Here:
+$19,331
State:
+$17,064
(% of AGI for various income ranges: 13.1% for AGIs below $25k, 6.3% for AGIs $25k-50k, 4.3% for AGIs $50k-75k, 4.2% for AGIs $75k-100k, 4.5% for AGIs $100k-200k, 4.5% for AGIs over 200k)
Taxable individual retirement arrangement distribution: $16,798 (reported on 9.2% of returns)
94501:
$16,798
California:
$19,557
(% of AGI for various income ranges: 3.1% for AGIs below $25k, 2.2% for AGIs $25k-50k, 2.0% for AGIs $50k-75k, 2.0% for AGIs $75k-100k, 2.2% for AGIs $100k-200k, 1.9% for AGIs over 200k)
Self-employment retirement plans: $20,184 (reported on 1.6% of returns)
94501:
$20,184
California:
$24,530
(% of AGI for various income ranges: 0.2% for AGIs $25k-50k, 0.2% for AGIs $50k-75k, 0.3% for AGIs $75k-100k, 0.5% for AGIs $100k-200k, 0.8% for AGIs over 200k)
Total itemized deductions: $29,939 (22% of AGI, reported on 36.3% of returns)
Here:
$29,939
State:
$34,004
Here:
22.4% of AGI
State:
22.7% of AGI
(% of AGI for various income ranges: 11.0% for AGIs below $25k, 8.6% for AGIs $25k-50k, 11.3% for AGIs $50k-75k, 13.9% for AGIs $75k-100k, 17.9% for AGIs $100k-200k, 17.3% for AGIs over 200k)
Charity contributions: $3,137 (reported on 29.0% of returns)
Here:
$3,137
State:
$4,659
(% of AGI for various income ranges: 0.5% for AGIs below $25k, 0.7% for AGIs $25k-50k, 1.1% for AGIs $50k-75k, 1.2% for AGIs $75k-100k, 1.5% for AGIs $100k-200k, 1.5% for AGIs over 200k)
Taxes paid: $13,386 (reported on 36.2% of returns)
94501:
$13,386
State:
$14,448
(% of AGI for various income ranges: 2.9% for AGIs below $25k, 2.2% for AGIs $25k-50k, 3.6% for AGIs $50k-75k, 5.6% for AGIs $75k-100k, 8.0% for AGIs $100k-200k, 9.7% for AGIs over 200k)
Earned income credit: $1,930 (reported on 13.0% of returns)
Here:
$1,930
State:
$2,286
(% of AGI for various income ranges: 5.4% for AGIs below $25k, 0.7% for AGIs $25k-50k)
Percentage of individuals using paid preparers for their 2012 taxes: 50.6%
Here:
51%
State:
64%
(% for various income ranges: 47.5% for AGIs below $25k, 48.2% for AGIs $25k-50k, 49.4% for AGIs $50k-75k, 51.3% for AGIs $75k-100k, 56.3% for AGIs $100k-200k, 63.7% for AGIs over 200k)
Averages for the 2004 tax year for zip code 94501, filed in 2005:
Average Adjusted Gross Income (AGI) in 2004: $56,244 (Individual Income Tax Returns)
Here:
$56,244
State:
$58,600
Salary/wage: $51,449 (reported on 81.5% of returns)
Here:
$51,449
State:
$49,455
(% of AGI for various income ranges: 152.8% for AGIs below $10k, 70.6% for AGIs $10k-25k, 81.3% for AGIs $25k-50k, 80.5% for AGIs $50k-75k, 80.7% for AGIs $75k-100k, 66.9% for AGIs over 100k)
Taxable interest for individuals: $1,740 (reported on 50.5% of returns)
This zip code:
$1,740
California:
$2,365
(% of AGI for various income ranges: 12.8% for AGIs below $10k, 2.4% for AGIs $10k-25k, 1.3% for AGIs $25k-50k, 1.4% for AGIs $50k-75k, 1.2% for AGIs $75k-100k, 1.6% for AGIs over 100k)
Taxable dividends: $3,101 (reported on 28.7% of returns)
Here:
$3,101
State:
$4,746
(% of AGI for various income ranges: 10.3% for AGIs below $10k, 2.0% for AGIs $10k-25k, 1.2% for AGIs $25k-50k, 1.3% for AGIs $50k-75k, 1.6% for AGIs $75k-100k, 1.7% for AGIs over 100k)
Net capital gain/loss: +$9,938 (reported on 24.3% of returns)
Here:
+$9,938
State:
+$23,418
(% of AGI for various income ranges: -6.1% for AGIs below $10k, 0.3% for AGIs $10k-25k, 0.3% for AGIs $25k-50k, 0.8% for AGIs $50k-75k, 0.8% for AGIs $75k-100k, 9.1% for AGIs over 100k)
Profit/loss from business: +$17,667 (reported on 17.6% of returns)
Here:
+$17,667
State:
+$16,826
(% of AGI for various income ranges: 12.9% for AGIs below $10k, 9.6% for AGIs $10k-25k, 4.9% for AGIs $25k-50k, 3.9% for AGIs $50k-75k, 4.8% for AGIs $75k-100k, 6.0% for AGIs over 100k)
IRA payment deduction: $3,126 (reported on 3.5% of returns)
94501:
$3,126
California:
$3,192
(% of AGI for various income ranges: 0.9% for AGIs below $10k, 0.4% for AGIs $10k-25k, 0.4% for AGIs $25k-50k, 0.2% for AGIs $50k-75k, 0.2% for AGIs $75k-100k, 0.1% for AGIs over 100k)
Self-employed pension: $14,678 (reported on 2.0% of returns)
Here:
$14,678
California:
$17,688
(% of AGI for various income ranges: 0.2% for AGIs $10k-25k, 0.2% for AGIs $25k-50k, 0.3% for AGIs $50k-75k, 0.5% for AGIs $75k-100k, 0.8% for AGIs over 100k)
Total itemized deductions: $24,961 (25% of AGI, reported on 36.0% of returns)
Here:
$24,961
State:
$28,113
Here:
24.6% of AGI
State:
25.3% of AGI
(% of AGI for various income ranges: 36.9% for AGIs below $10k, 11.7% for AGIs $10k-25k, 10.6% for AGIs $25k-50k, 13.8% for AGIs $50k-75k, 18.0% for AGIs $75k-100k, 18.5% for AGIs over 100k)
Charity contributions deductions: $2,775 (3% of AGI, reported on 30.8% of returns)
Here:
$2,775
State:
$3,923
Here:
2.6% of AGI
State:
3.3% of AGI
(% of AGI for various income ranges: 1.0% for AGIs below $10k, 0.8% for AGIs $10k-25k, 1.1% for AGIs $25k-50k, 1.3% for AGIs $50k-75k, 1.6% for AGIs $75k-100k, 1.9% for AGIs over 100k)
Total tax: $9,044 (reported on 82.6% of returns)
94501:
$9,044
State:
$10,761
(% of AGI for various income ranges: 7.4% for AGIs below $10k, 5.2% for AGIs $10k-25k, 8.5% for AGIs $25k-50k, 11.4% for AGIs $50k-75k, 12.0% for AGIs $75k-100k, 17.5% for AGIs over 100k)
Earned income credit: $1,463 (reported on 10.6% of returns)
Here:
$1,463
State:
$1,763
Percentage of individuals using paid preparers for their 2004 taxes: 55.5%
Here:
56%
State:
66%
(% for various income ranges: 52.5% for AGIs below $10k, 56.8% for AGIs $10k-25k, 52.4% for AGIs $25k-50k, 54.5% for AGIs $50k-75k, 57.2% for AGIs $75k-100k, 63.5% for AGIs over 100k)
Likely homosexual households (counted as self-reported same-sex unmarried-partner households)
Lesbian couples: 0.1% of all households
Gay men: 0.3% of all households
Household received Food Stamps/SNAP in the past 12 months: 2,631 Household did not receive Food Stamps/SNAP in the past 12 months: 22,657
Women who had a birth in the past 12 months: 973 (689 now married, 283 unmarried) Women who did not have a birth in the past 12 months: 14,449 (6,328 now married, 8,095 unmarried)
Housing units in zip code 94501 with a mortgage: 7,113 (873 second mortgage, 16 home equity loan, 780 both second mortgage and home equity loan) Houses without a mortgage: 121
Median monthly owner costs for units with a mortgage: $3,755 Median monthly owner costs for units without a mortgage: $933
Residents with income below the poverty level in 2022:
This zip code:
8.2%
Whole state:
12.2%
Residents with income below 50% of the poverty level in 2022:
This zip code:
4.3%
Whole state:
6.2%
Median number of rooms in houses and condos:
Here:
6.1
State:
6.0
Median number of rooms in apartments:
Here:
3.8
State:
3.9
Notable locations in this zip code not listed on our city pages
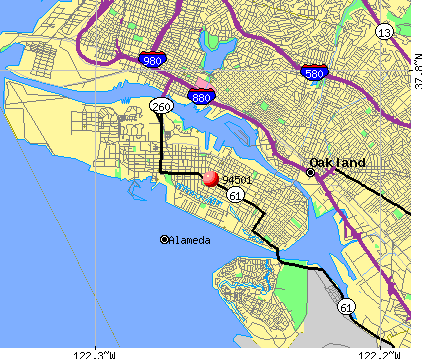
Notable locations in zip code 94501: Alameda Administration Center (A), Aeolian Yacht Club (B), Alameda Marina (C), Ballena Bay Marina (D), Barnhill Marina (E), Dock 5 (F), Encinal Terminal (G), Encinal Yacht Club (H), Fortman Marina (I), Island Yacht Club (J), Olympic Yacht Club (K), Pacific Marina (L), Pier 1 (M), Pier 2 (N), Pier 3 (O), Alameda Reserve Shipyard (P), West End Landing (Q), Hibbards Wharf (R), Alameda Mole (S), Veterans Memorial Building (T). Display/hide their locations on the map
Churches in zip code 94501 include: Immanuel Lutheran Church (A), First Presbyterian Church (B), First Congregational Church (C), Westside Baptist Church (D), Trinity Evangelical Lutheran Church (E), Saint Philip Neri Roman Catholic Church (F), Saint Barnabus Roman Catholic Church (G), Immanuel Baptist Church (H), First Christian Reformed Church (I). Display/hide their locations on the map
Parks in zip code 94501 include: McKinley Park (1), Alameda Memorial State Beach (2), Washington Park (3), Alameda Park (4), Buena Vista Park (5), Franklin Park (6), Longfellow Park (7), Neptune Park (8), Rittler Park (9). Display/hide their locations on the map
9,159 married couples with children.
2,721 single-parent households (502 men, 2,219 women).
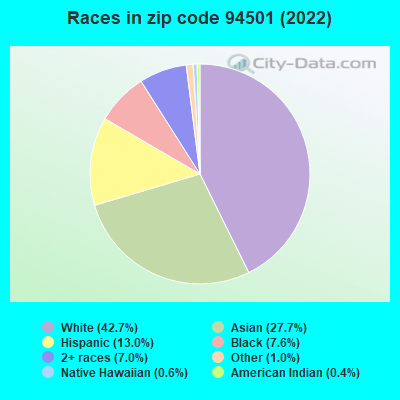
65.8% of residents of 94501 zip code speak English at home.
6.9% of residents speak Spanish at home (78% very well, 13% well, 8% not well, 2% not at all).
7.5% of residents speak other Indo-European language at home (83% very well, 11% well, 5% not well, 1% not at all).
18.4% of residents speak Asian or Pacific Island language at home (61% very well, 20% well, 14% not well, 5% not at all).
1.4% of residents speak other language at home (51% very well, 36% well, 13% not well).
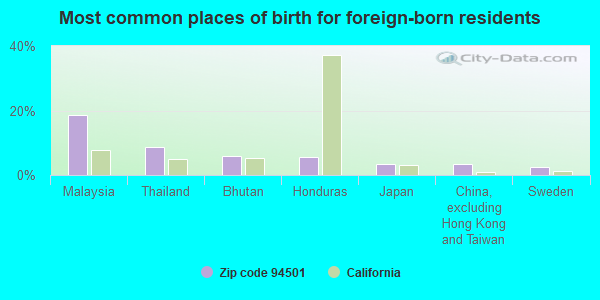
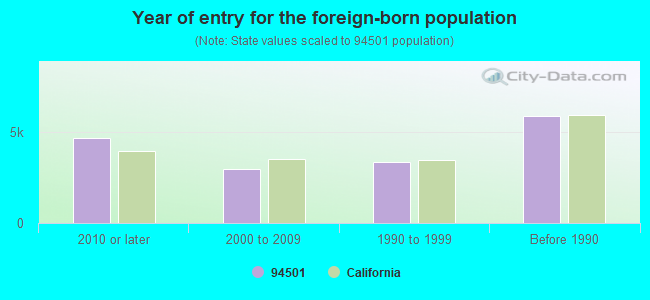
Foreign born population: 15,468 (24.6%) (65.2% of them are naturalized citizens)
Major facilities with environmental interests located in this zip code:
MIRACLE AUTO PAINTING (2307 CLEMENT AVENUE in ALAMEDA, CA)
STATE MASTER (California - Hazardous Waste Tracking) - HAZARDOU WASTE PROGRAM CRITERIA AND HAZARDOUS AIR POLLUTANT INVENTORY (Inventory of air pollution sources) (Resource Conservation and Recovery Act (tracking hazardous waste)) Small Quantity Generators, between 100 kg and 1000 kg of hazardous waste/month (Resource Conservation and Recovery Act (tracking hazardous waste)) - notification Business SIC classification: TOP, BODY, AND UPHOLSTERY REPAIR SHOPS AND PAINT SHOPS Business NAICS classification: AUTOMOTIVE BODY, PAINT, AND INTERIOR REPAIR AND MAINTENANCE. Organizations: DLS & P INC (CONTACT/OWNER)
, DANNY DICKINSON (CONTACT/OWNER)
NRC ENVIRONMENTAL (1605 FERRY PT in ALAMEDA, CA)
STATE MASTER (California - Hazardous Waste Tracking) - HAZARDOU WASTE PROGRAM COMPLIANCE ACTIVITY (Tracking inspections of insecticide, fungicide, and rodenticide, and toxic substances) TRANSPORTER (Resource Conservation and Recovery Act (tracking hazardous waste)) - notification USED OIL PROGRAM (Resource Conservation and Recovery Act (tracking hazardous waste)) Organizations: TRIDENT MNGMT (CONTACT/OWNER)
Alternative names: FOSS ENVIRONMENTAL, FOSS ENVIRONMENTAL SERVICES CO, NRC ENVIRONMENTAL SERVICES
ISLAND HIGH (CONT.) (2437 EAGLE AVE. in ALAMEDA, CA)
(National Center for Education Statistics) - STATE ID-0134304 Small Quantity Generators, between 100 kg and 1000 kg of hazardous waste/month (Resource Conservation and Recovery Act (tracking hazardous waste)) - notification Organizations: ALAMEDA USD (CONTACT/OWNER)
, ALAMEDA CITY UNIFIED (SCHOOL DISTRICT)
Alternative names: ALAMEDA USD ISLAND CONTINUATION HS
HOM DRY CLNERS LLC DBA MARINA VLG CLNRS (817 MARINA VILLAGE PKWAY in ALAMEDA, CA) . Federal Facility
STATE MASTER (California - Hazardous Waste Tracking) - HAZARDOU WASTE PROGRAM CRITERIA AND HAZARDOUS AIR POLLUTANT INVENTORY (Inventory of air pollution sources) Small Quantity Generators, between 100 kg and 1000 kg of hazardous waste/month (Resource Conservation and Recovery Act (tracking hazardous waste)) - notification Business SIC classification: DRYCLEANING PLANTS, EXCEPT RUG CLEANING Organizations: JADE HOM (CONTACT/OWNER)
Alternative names: MARINA VILLAGE CLEANERS, MARINA VILLAGE DRY CLEAN UNITED STATES OF AMERICA
GOOD CHEVROLET (2329 PACIFIC AVENUE in ALAMEDA, CA)
STATE MASTER (California - Hazardous Waste Tracking) - HAZARDOU WASTE PROGRAM CRITERIA AND HAZARDOUS AIR POLLUTANT INVENTORY (Inventory of air pollution sources) Small Quantity Generators, between 100 kg and 1000 kg of hazardous waste/month (Resource Conservation and Recovery Act (tracking hazardous waste)) - notification Business SIC classification: TOP, BODY, AND UPHOLSTERY REPAIR SHOPS AND PAINT SHOPS Organizations: JOHN BUONO (CONTACT/OWNER)
Alternative names: GOOD CHEVROLET PAINT SHOP
CHEVRON STATION NO 96607 (2340 OTIS DR in ALAMEDA, CA)
STATE MASTER (California - Hazardous Waste Tracking) - HAZARDOU WASTE PROGRAM Small Quantity Generators, between 100 kg and 1000 kg of hazardous waste/month (Resource Conservation and Recovery Act (tracking hazardous waste)) - notification Organizations: CHEVRON PRODUCTS CO (CONTACT/OWNER)
CHEVRON STATION 90290 (1802 WEBSTER ST in ALAMEDA, CA)
STATE MASTER (California - Hazardous Waste Tracking) - HAZARDOU WASTE PROGRAM Small Quantity Generators, between 100 kg and 1000 kg of hazardous waste/month (Resource Conservation and Recovery Act (tracking hazardous waste)) - notification Organizations: CHEVRON PRODUCTS CO (CONTACT/OWNER)
HAIGHT ELEMENTARY (2025 SANTA CLARA AVE. in ALAMEDA, CA)
(National Center for Education Statistics) - STATE ID-6090047 Organizations: ALAMEDA CITY UNIFIED (SCHOOL DISTRICT)
LUM (DONALD D.) ELEMENTARY (1801 SANDCREEK WAY in ALAMEDA, CA)
(National Center for Education Statistics) - STATE ID-6090005 Organizations: ALAMEDA CITY UNIFIED (SCHOOL DISTRICT)
ANDERSEN COMMUNITY LEARNING CENTER (210 CENTRAL AVE. in ALAMEDA, CA)
(National Center for Education Statistics) - STATE ID-0130609 Organizations: ALAMEDA CITY UNIFIED (SCHOOL DISTRICT)
LONGFELLOW ELEMENTARY (500 PACIFIC AVE. in ALAMEDA, CA)
(National Center for Education Statistics) - STATE ID-6090062 Organizations: ALAMEDA CITY UNIFIED (SCHOOL DISTRICT)
EDISON ELEMENTARY (2700 BUENA VISTA AVE. in ALAMEDA, CA)
(National Center for Education Statistics) - STATE ID-6090013 Organizations: ALAMEDA CITY UNIFIED (SCHOOL DISTRICT)
ENCINAL HIGH (210 CENTRAL AVE. in ALAMEDA, CA)
(National Center for Education Statistics) - STATE ID-0132878 Organizations: ALAMEDA CITY UNIFIED (SCHOOL DISTRICT)
Housing units lacking complete plumbing facilities: 1.1% Housing units lacking complete kitchen facilities: 1.0%
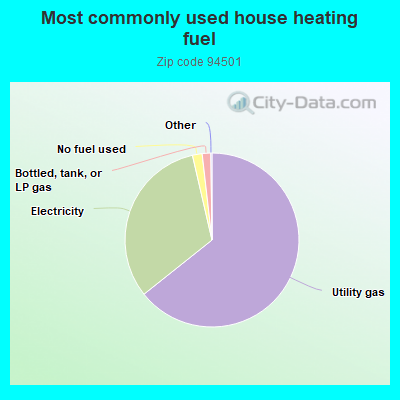
64.3%Utility gas
32.1%Electricity
1.8%No fuel used
1.6%Bottled, tank, or LP gas
Population in 1990: 76,110.
Place of birth for U.S.-born residents:
This state: 32,088
Northeast: 4,265
Midwest: 3,650
South: 3,570
West: 2,344
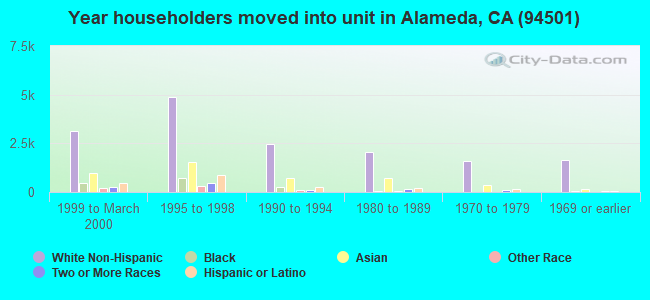
51% of the 94501 zip code residents lived in the same house 5 years ago. Out of people who lived in different houses, 57% lived in this county. Out of people who lived in different counties, 50% lived in California.
86% of the 94501 zip code residents lived in the same house 1 year ago. Out of people who lived in different houses, 50% moved from this county. Out of people who lived in different houses, 31% moved from different county within same state. Out of people who lived in different houses, 12% moved from different state. Out of people who lived in different houses, 6% moved from abroad.
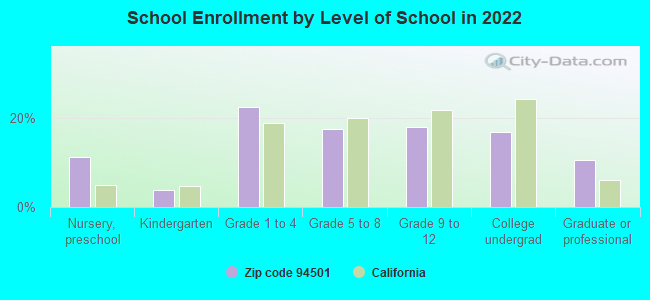
Private vs. public school enrollment:
Students in private schools in grades 1 to 8 (elementary and middle school): 675
Here:
11.8%
California:
10.5%
Students in private schools in grades 9 to 12 (high school): 347
Here:
13.5%
California:
8.5%
Students in private undergraduate colleges: 429
Here:
17.9%
California:
15.9%
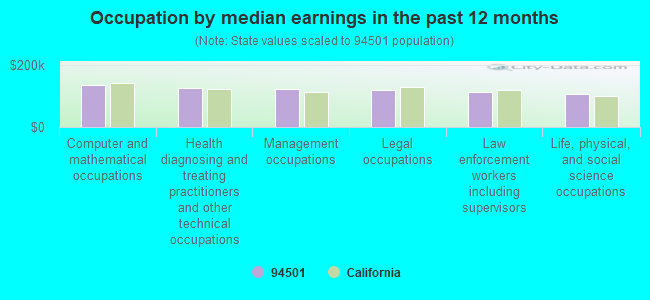
Occupation by median earnings in the past 12 months ($)
133,916Computer and mathematical occupations
125,671Health diagnosing and treating practitioners and other technical occupations
123,339Management occupations
119,360Legal occupations
113,499Law enforcement workers including supervisors
107,947Life, physical, and social science occupations
Companies with biggest federal contracts located in this zip code (ALAMEDA, CA):
DD-M LEASING COMPANY INC (2900 MAIN ST , SUITE 101; small business) : $38,130,603 in 74 contractsfrom 1999 to 2006
Contracts for Maintenance, Repair or Alteration of Real Property -- Other Non-Building Facilities, Construction of Structures and Facilities -- Highways, Roads, Streets, Bridges, and Railways (includes resurfacing), Maintenance, Repair or Alteration of Real Property -- Dredging, Other Buildings, and moreby Army, Federal Highway Administration, U.S. Army Corps of Engineers - civil program financing only, United States Coast Guard (disused code: now 7008), and others Signed by year:2000: $1,647,676; 2001: $3,264,558; 2002: $583,641; 2003: $0; 2004: $4,298,324; 2005: $7,512,723; 2006: $19,771,680.
Biggest contracts:
$17,826,680 with Army for Maintenance, Repair or Alteration of Real Property -- Other Non-Building Facilities. Signed on 2006-06-30. Completion date: 2006-11-01.
$3,898,324 with Federal Highway Administration for Construction of Structures and Facilities -- Highways, Roads, Streets, Bridges, and Railways (includes resurfacing). Signed on 2004-08-05. Effective on 2004-08-16. Completion date: 2004-10-01.
$1,789,950 with U.S. Army Corps of Engineers - civil program financing only for Maintenance, Repair or Alteration of Real Property -- Other Non-Building Facilities. Signed on 2001-09-28. Completion date: 2002-02-01.
$1,550,000 with Army for Maintenance, Repair or Alteration of Real Property -- Other Non-Building Facilities. Signed on 2005-02-25. Completion date: 2005-10-31.
WIND RIVER SYSTEMS INC (500 WIND RIVER WAY) : $7,324,550 in 331 contractsfrom 1999 to 2006
Contracts for Guided Missiles, ADP Software, ADP Support Equipment, Other ADP and Telecommunications Services (includes data storage on tapes, compact disks, etc.), and moreby Army, Navy, Federal Technology Service, Air Force, and others Signed by year:2000: $985,956; 2001: $898,773; 2002: $703,121; 2003: $756,795; 2004: $993,607; 2005: $1,901,131; 2006: $940,666.
Biggest contracts:
$300,000 with Army for Guided Missiles. Signed on 2005-04-15. Completion date: 2005-04-29.
$146,800 with Navy for ADP Software. Signed on 2006-04-01. Completion date: 2007-03-31.
$134,550 with Federal Technology Service for ADP Support Equipment. Taking place in OK. Signed on 2006-06-22. Completion date: 2006-06-30.
$134,000 with Navy for ADP Software. Signed on 2002-09-30. Completion date: 2003-09-30.
POWER ENGINEERING CONTRACTORS (1501 VIKING ST STE 200; small business) : $4,468,555 in 16 contractsfrom 2003 to 2005
Contracts for Construction of Structures and Facilities -- Other Non-Building Facilities, Construction of Structures and Facilities -- Miscellaneous Buildings, Maintenance, Repair or Alteration of Real Property -- Other Non-Building Facilities by Navy Signed by year:2000: $0; 2001: $0; 2002: $0; 2003: $1,158,000; 2004: $2,848,499; 2005: $462,056; 2006: $0.
Biggest contracts:
$1,797,000 with Navy for Construction of Structures and Facilities -- Other Non-Building Facilities. Signed on 2004-07-08. Completion date: 2005-01-19.
$1,158,000 with Navy for Construction of Structures and Facilities -- Miscellaneous Buildings. Signed on 2003-09-15. Completion date: 2004-03-13.
$594,167 with Navy for Maintenance, Repair or Alteration of Real Property -- Other Non-Building Facilities. Signed on 2004-04-16. Completion date: 2004-05-12.
$212,810 with Navy for Construction of Structures and Facilities -- Other Non-Building Facilities. Signed on 2005-03-29. Completion date: 2005-05-02.
VECTOR AEROSPACE OF CALIFORNIA (120 WEST ORISKANY AVENUE) : $2,785,622 in 22 contractsfrom 2002 to 2006
Contracts for Valves, Powered, Aircraft Air Conditioning, Heating, and Pressurizing Equipment, Liquid and Gas Flow, Liquid Level, and Mechanical Motion Measuring Instruments, Pressure, Temperature, and Humidity Measuring and Controlling Instruments by Air Force Signed by year:2000: $0; 2001: $0; 2002: $1,025,332; 2003: $881,250; 2004: $355,680; 2005: $319,480; 2006: $203,880.
Biggest contracts:
$584,652 with Air Force for Valves, Powered. Signed on 2002-05-23. Completion date: 2003-01-31.
$499,250 with Air Force for Aircraft Air Conditioning, Heating, and Pressurizing Equipment. Signed on 2003-04-04. Completion date: 2003-12-31.
$401,800 with Air Force for Valves, Powered. Signed on 2002-10-22. Completion date: 2003-06-30.
$276,000 with Air Force for Liquid and Gas Flow, Liquid Level, and Mechanical Motion Measuring Instruments. Signed on 2003-09-11. Completion date: 2004-05-03.
MACDONALD-BEDFORD, LLC (2900 MAIN ST STE 200; small business) : $1,095,240 in 2 contractsin 2006
$1,095,240 with Army for Program Management/Support Services. Taking place in FL. Signed on 2006-01-06. Completion date: 2006-09-30.
$0, same as above.Signed on 2006-01-06. Completion date: 2006-09-30.
AC3 (2394 MARINER SQUARE DR; small business) : $711,386 in 15 contractsfrom 1999 to 2005
Contracts for Other Non-Building Structures, Maintenance, Repair and Rebuilding of Equipment -- Materials Handling Equipment, Maintenance, Repair and Rebuilding of Equipment -- Maintenance and Repair Shop Equipment, Equipment and Materials Testing -- Vehicular Equipment Components by U.S. Fish and Wildlife Service, Air Force, Army Signed by year:2000: $92,976; 2001: $242,459; 2002: $88,014; 2003: $205,863; 2004: $26,174; 2005: $5,200; 2006: $0.
Biggest contracts:
$92,000 with U.S. Fish and Wildlife Service for Other Non-Building Structures. Signed on 2001-08-15. Completion date: 2001-11-15.
$90,414 with Air Force for Maintenance, Repair and Rebuilding of Equipment -- Materials Handling Equipment. Signed on 2004-10-01. Completion date: 2005-09-30.
$86,544, same as above.Signed on 2003-10-01. Completion date: 2006-09-30.
$85,794, same as above.Signed on 2003-01-29. Completion date: 2003-09-30.
QIAGEN OPERON (1000 ATLANTIC AVE , SUITE) : $685,616 in 14 contractsfrom 2001 to 2004
Contracts for Medical and Surgical Instruments, Equipment, and Supplies, Laboratory Equipment and Supplies, Drugs and Biologicals, Other Professional Services, and moreby National Institutes of Health, Food and Drug Administration, Agricultural Research Service, Army, and others Signed by year:2000: $0; 2001: $151,000; 2002: $271,235; 2003: $260,184; 2004: $3,197; 2005: $0; 2006: $0.
Biggest contracts:
$79,000 with National Institutes of Health for Medical and Surgical Instruments, Equipment, and Supplies. Taking place in MD. Signed on 2001-09-15. Completion date: 2001-10-15.
$77,000 with Food and Drug Administration for Laboratory Equipment and Supplies. Signed on 2002-02-15. Completion date: 2002-03-15.
$70,000 with National Institutes of Health for Drugs and Biologicals. Signed on 2003-09-15. Completion date: 2003-10-15.
$66,444 with Agricultural Research Service for Other Professional Services. Signed on 2003-09-15. Completion date: 2004-03-15.
OSS INTERNATIONAL INC (1499 FERRY POINT; small business) : $558,370 in 13 contractsfrom 2003 to 2005
Contracts for Guard Services, Non-nuclear Ship Repair (West) Ship repair (including overhauls and conversions) performed on. non-nuclear propelled and nonpropelled ships west of the 108th meridian, Maintenance, Repair and Rebuilding of Equipment -- Miscellaneous by Navy Signed by year:2000: $0; 2001: $0; 2002: $0; 2003: $203,019; 2004: $230,984; 2005: $124,367; 2006: $0.
Biggest contracts:
$230,984 with Navy for Guard Services. Signed on 2004-12-16. Completion date: 2004-12-19.
$108,345, same as above.Signed on 2005-08-16. Completion date: 2004-12-19.
$57,840 with Navy for Non-nuclear Ship Repair (West) Ship repair (including overhauls and conversions) performed on. non-nuclear propelled and nonpropelled ships west of the 108th meridian. Signed on 2003-09-09. Completion date: 2003-08-27.
$44,890, same as above.Signed on 2003-09-09. Completion date: 2003-08-27.
TRI-PACIFIC SOFTWARE, INC (TRI-PACIFIC SOFTWARE, INC; small business) : $419,866 in 3 contractsfrom 2000 to 2002
$220,000 with Navy for Defense Electronics and Communication Equipment -- Applied Research and Exploratory Development (R&D). Signed on 2002-06-22. Completion date: 2003-06-20.
$100,000 with Navy for Engineering and Technical Services. Signed on 2000-03-20. Completion date: 2001-03-19.
$99,866, same as above.Signed on 2001-05-07. Completion date: 2002-05-06.
TRI-PACIFIC CONSULTING CORP (1070 MARINA VILLAGE PKWY; small business) : $175,000 in 2 contractsfrom 2000 to 2001
$100,000 with Navy for Engineering and Technical Services. Signed on 2001-04-30. Completion date: 2002-04-30.
$75,000, same as above.Signed on 2000-03-20. Completion date: 2001-03-19.
Top industries in this zip code by the number of employees in 2005:
Utilities: Electric Power Distribution (over 1000 employees: 1 establishment)
Professional, Scientific, and Technical Services: Research and Development in the Physical, Engineering, and Life Sciences (100-249: 1, 50-99: 1, 20-49: 4, 5-9: 1, 1-4: 6)
Management of Companies and Enterprises: Corporate, Subsidiary, and Regional Managing Offices (100-249: 1, 50-99: 2, 10-19: 1, 1-4: 3)
People in group quarters in 2010:
629 people in nursing facilities/skilled-nursing facilities
585 people in military ships
108 people in other noninstitutional facilities
76 people in military barracks and dormitories (nondisciplinary)
30 people in maritime/merchant vessels
27 people in emergency and transitional shelters (with sleeping facilities) for people experiencing homelessness
16 people in workers' group living quarters and job corps centers
13 people in group homes intended for adults
People in group quarters in 2000:
331 people in nursing homes
266 people in other noninstitutional group quarters
198 people in military ships
132 people in wards in general hospitals for patients who have no usual home elsewhere
14 people in other nonhousehold living situations
6 people in hospitals/wards and hospices for chronically ill
6 people in other hospitals or wards for chronically ill
3 people in homes for the mentally retarded
2 people in religious group quarters
Fatal accident statistics in 2014:
Fatal accident count: 2
Vehicles involved in fatal accidents: 2
Fatal accidents caused by drunken drivers: 0
Fatalities: 2
Persons involved in fatal accidents: 3
Pedestrians involved in fatal accidents: 2
Fatal accident statistics in 2012:
Fatal accident count: 1
Vehicles involved in fatal accidents: 1
Fatal accidents caused by drunken drivers: 0
Fatalities: 1
Persons involved in fatal accidents: 1
Pedestrians involved in fatal accidents: 0
Home Mortgage Disclosure Act Aggregated Statistics For Year 2009 (Based on 14 full and 12 partial tracts)
A) FHA, FSA/RHS & VA Home Purchase Loans
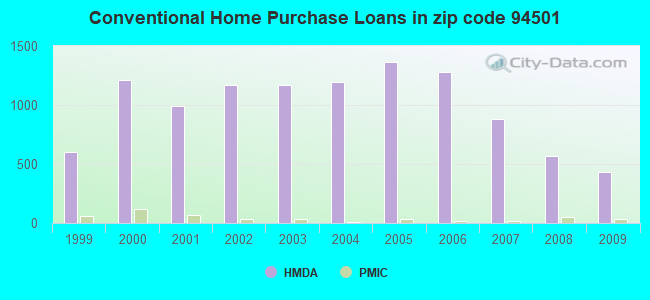
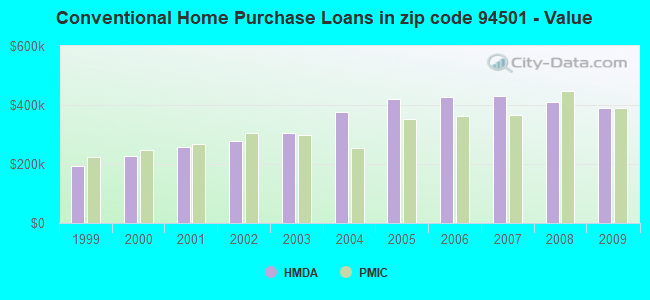
B) Conventional Home Purchase Loans
C) Refinancings
D) Home Improvement Loans
E) Loans on Dwellings For 5+ Families
F) Non-occupant Loans on < 5 Family Dwellings (A B C & D)
Number
Average Value
Number
Average Value
Number
Average Value
Number
Average Value
Number
Average Value
Number
Average Value
LOANS ORIGINATED
99
$470,547
435
$389,948
2,401
$350,952
78
$228,336
12
$999,333
132
$310,801
APPLICATIONS APPROVED, NOT ACCEPTED
15
$400,166
58
$415,190
248
$388,616
9
$247,927
0
$0
16
$301,984
APPLICATIONS DENIED
22
$484,098
89
$368,264
588
$414,538
27
$202,654
2
$712,500
63
$319,244
APPLICATIONS WITHDRAWN
29
$441,343
67
$333,771
344
$384,177
18
$241,153
2
$437,635
45
$280,080
FILES CLOSED FOR INCOMPLETENESS
8
$274,936
13
$317,138
139
$369,527
8
$224,435
0
$0
17
$266,934
Aggregated Statistics For Year 2008 (Based on 14 full and 12 partial tracts)
A) FHA, FSA/RHS & VA Home Purchase Loans
B) Conventional Home Purchase Loans
C) Refinancings
D) Home Improvement Loans
E) Loans on Dwellings For 5+ Families
F) Non-occupant Loans on < 5 Family Dwellings (A B C & D)
G) Loans On Manufactured Home Dwelling (A B C & D)
Number
Average Value
Number
Average Value
Number
Average Value
Number
Average Value
Number
Average Value
Number
Average Value
Number
Average Value
LOANS ORIGINATED
41
$460,717
564
$410,406
860
$367,150
66
$192,840
37
$2,048,183
128
$325,410
0
$0
APPLICATIONS APPROVED, NOT ACCEPTED
6
$471,115
120
$429,554
192
$370,235
14
$251,453
5
$834,798
22
$293,537
2
$56,950
APPLICATIONS DENIED
8
$505,001
171
$478,967
446
$424,967
66
$283,033
1
$1,650,000
57
$430,505
1
$68,000
APPLICATIONS WITHDRAWN
2
$300,000
96
$419,920
219
$382,744
13
$217,473
3
$1,075,333
19
$350,788
0
$0
FILES CLOSED FOR INCOMPLETENESS
2
$316,000
35
$494,956
59
$398,250
7
$390,569
0
$0
8
$429,371
0
$0
Aggregated Statistics For Year 2007 (Based on 14 full and 12 partial tracts)
B) Conventional Home Purchase Loans
C) Refinancings
D) Home Improvement Loans
E) Loans on Dwellings For 5+ Families
F) Non-occupant Loans on < 5 Family Dwellings (A B C & D)
G) Loans On Manufactured Home Dwelling (A B C & D)
Number
Average Value
Number
Average Value
Number
Average Value
Number
Average Value
Number
Average Value
Number
Average Value
LOANS ORIGINATED
884
$429,502
1,088
$416,706
154
$267,273
53
$1,800,684
172
$380,724
0
$0
APPLICATIONS APPROVED, NOT ACCEPTED
212
$466,255
278
$436,658
37
$240,488
0
$0
43
$354,728
1
$202,570
APPLICATIONS DENIED
217
$496,132
596
$453,010
77
$279,159
3
$630,187
77
$456,794
0
$0
APPLICATIONS WITHDRAWN
91
$442,073
227
$382,516
32
$253,985
1
$709,560
45
$366,051
0
$0
FILES CLOSED FOR INCOMPLETENESS
37
$509,573
95
$481,832
7
$404,891
0
$0
11
$467,449
0
$0
Aggregated Statistics For Year 2006 (Based on 14 full and 12 partial tracts)
A) FHA, FSA/RHS & VA Home Purchase Loans
B) Conventional Home Purchase Loans
C) Refinancings
D) Home Improvement Loans
E) Loans on Dwellings For 5+ Families
F) Non-occupant Loans on < 5 Family Dwellings (A B C & D)
G) Loans On Manufactured Home Dwelling (A B C & D)
Number
Average Value
Number
Average Value
Number
Average Value
Number
Average Value
Number
Average Value
Number
Average Value
Number
Average Value
LOANS ORIGINATED
3
$216,000
1,279
$426,395
1,396
$399,897
193
$252,630
41
$4,317,357
239
$390,869
4
$41,642
APPLICATIONS APPROVED, NOT ACCEPTED
0
$0
285
$371,798
286
$398,850
44
$283,125
5
$1,077,164
32
$347,875
2
$138,000
APPLICATIONS DENIED
0
$0
361
$510,339
502
$418,471
96
$318,742
3
$578,600
76
$445,598
5
$161,042
APPLICATIONS WITHDRAWN
0
$0
153
$466,125
337
$412,683
28
$275,387
5
$757,080
48
$474,938
0
$0
FILES CLOSED FOR INCOMPLETENESS
0
$0
43
$509,585
88
$365,605
13
$286,213
0
$0
12
$451,315
0
$0
Aggregated Statistics For Year 2005 (Based on 14 full and 12 partial tracts)
B) Conventional Home Purchase Loans
C) Refinancings
D) Home Improvement Loans
E) Loans on Dwellings For 5+ Families
F) Non-occupant Loans on < 5 Family Dwellings (A B C & D)
G) Loans On Manufactured Home Dwelling (A B C & D)
Number
Average Value
Number
Average Value
Number
Average Value
Number
Average Value
Number
Average Value
Number
Average Value
LOANS ORIGINATED
1,364
$420,716
1,929
$381,872
195
$291,489
45
$3,123,934
299
$377,577
0
$0
APPLICATIONS APPROVED, NOT ACCEPTED
229
$377,391
291
$368,341
17
$229,291
6
$2,139,167
48
$334,494
5
$310,298
APPLICATIONS DENIED
330
$441,986
530
$412,448
111
$290,226
7
$809,977
77
$415,952
1
$191,630
APPLICATIONS WITHDRAWN
208
$399,557
465
$365,596
48
$232,251
0
$0
43
$434,598
2
$6,365
FILES CLOSED FOR INCOMPLETENESS
49
$366,713
123
$410,001
13
$326,749
7
$3,127,577
16
$373,761
0
$0
Aggregated Statistics For Year 2004 (Based on 14 full and 10 partial tracts)
A) FHA, FSA/RHS & VA Home Purchase Loans
B) Conventional Home Purchase Loans
C) Refinancings
D) Home Improvement Loans
E) Loans on Dwellings For 5+ Families
F) Non-occupant Loans on < 5 Family Dwellings (A B C & D)
G) Loans On Manufactured Home Dwelling (A B C & D)
Number
Average Value
Number
Average Value
Number
Average Value
Number
Average Value
Number
Average Value
Number
Average Value
Number
Average Value
LOANS ORIGINATED
2
$205,000
1,191
$377,120
2,331
$318,097
144
$269,411
37
$964,153
356
$309,180
4
$63,500
APPLICATIONS APPROVED, NOT ACCEPTED
0
$0
206
$351,769
356
$310,516
23
$145,283
4
$2,925,000
51
$298,356
0
$0
APPLICATIONS DENIED
1
$355,680
222
$348,824
576
$338,299
88
$222,048
2
$1,600,000
80
$364,470
4
$178,250
APPLICATIONS WITHDRAWN
0
$0
120
$332,232
510
$294,597
27
$216,300
7
$433,694
43
$277,614
0
$0
FILES CLOSED FOR INCOMPLETENESS
0
$0
34
$341,158
129
$323,690
9
$176,007
0
$0
12
$334,778
0
$0
Aggregated Statistics For Year 2003 (Based on 14 full and 12 partial tracts)
A) FHA, FSA/RHS & VA Home Purchase Loans
B) Conventional Home Purchase Loans
C) Refinancings
D) Home Improvement Loans
E) Loans on Dwellings For 5+ Families
F) Non-occupant Loans on < 5 Family Dwellings (A B C & D)
Number
Average Value
Number
Average Value
Number
Average Value
Number
Average Value
Number
Average Value
Number
Average Value
LOANS ORIGINATED
1
$79,940
1,169
$305,897
5,669
$257,221
48
$72,456
65
$832,970
597
$256,191
APPLICATIONS APPROVED, NOT ACCEPTED
4
$134,118
139
$337,482
778
$270,038
25
$66,947
11
$544,894
66
$233,148
APPLICATIONS DENIED
1
$247,000
175
$274,342
801
$298,826
44
$97,481
3
$825,000
81
$273,935
APPLICATIONS WITHDRAWN
0
$0
149
$311,280
792
$275,392
16
$184,389
5
$753,552
80
$241,012
FILES CLOSED FOR INCOMPLETENESS
0
$0
46
$340,181
173
$313,441
9
$50,100
0
$0
28
$304,025
Aggregated Statistics For Year 2002 (Based on 14 full and 12 partial tracts)
A) FHA, FSA/RHS & VA Home Purchase Loans
B) Conventional Home Purchase Loans
C) Refinancings
D) Home Improvement Loans
E) Loans on Dwellings For 5+ Families
F) Non-occupant Loans on < 5 Family Dwellings (A B C & D)
Number
Average Value
Number
Average Value
Number
Average Value
Number
Average Value
Number
Average Value
Number
Average Value
LOANS ORIGINATED
7
$121,241
1,172
$276,930
4,063
$256,278
51
$116,728
42
$1,234,245
455
$248,046
APPLICATIONS APPROVED, NOT ACCEPTED
4
$124,792
153
$294,652
583
$256,559
23
$71,007
0
$0
61
$225,676
APPLICATIONS DENIED
0
$0
117
$262,048
461
$254,852
58
$40,823
8
$4,601,750
49
$286,689
APPLICATIONS WITHDRAWN
1
$96,360
160
$314,194
511
$231,215
15
$55,746
5
$1,035,000
34
$212,497
FILES CLOSED FOR INCOMPLETENESS
2
$196,725
65
$287,397
145
$277,744
9
$15,982
0
$0
21
$256,952
Aggregated Statistics For Year 2001 (Based on 14 full and 12 partial tracts)
A) FHA, FSA/RHS & VA Home Purchase Loans
B) Conventional Home Purchase Loans
C) Refinancings
D) Home Improvement Loans
E) Loans on Dwellings For 5+ Families
F) Non-occupant Loans on < 5 Family Dwellings (A B C & D)
Number
Average Value
Number
Average Value
Number
Average Value
Number
Average Value
Number
Average Value
Number
Average Value
LOANS ORIGINATED
3
$229,000
989
$257,020
2,756
$246,296
159
$63,585
36
$1,141,431
245
$234,659
APPLICATIONS APPROVED, NOT ACCEPTED
0
$0
101
$244,424
358
$238,318
25
$60,755
0
$0
23
$213,320
APPLICATIONS DENIED
2
$169,000
145
$245,090
442
$265,157
66
$37,077
3
$210,250
37
$211,988
APPLICATIONS WITHDRAWN
0
$0
111
$256,107
456
$246,384
33
$74,068
2
$630,435
31
$243,542
FILES CLOSED FOR INCOMPLETENESS
3
$176,113
29
$287,943
144
$236,699
6
$88,283
4
$4,781,225
14
$254,064
Aggregated Statistics For Year 2000 (Based on 14 full and 12 partial tracts)
A) FHA, FSA/RHS & VA Home Purchase Loans
B) Conventional Home Purchase Loans
C) Refinancings
D) Home Improvement Loans
E) Loans on Dwellings For 5+ Families
F) Non-occupant Loans on < 5 Family Dwellings (A B C & D)
Number
Average Value
Number
Average Value
Number
Average Value
Number
Average Value
Number
Average Value
Number
Average Value
LOANS ORIGINATED
19
$167,396
1,211
$225,600
664
$199,426
161
$48,588
41
$1,691,720
146
$208,511
APPLICATIONS APPROVED, NOT ACCEPTED
0
$0
140
$207,343
103
$208,877
46
$38,043
0
$0
18
$212,162
APPLICATIONS DENIED
2
$157,550
151
$220,928
293
$195,327
70
$56,074
2
$469,000
22
$253,385
APPLICATIONS WITHDRAWN
5
$198,020
152
$235,961
189
$165,696
24
$109,598
5
$276,400
12
$219,143
FILES CLOSED FOR INCOMPLETENESS
1
$205,000
40
$259,781
114
$207,137
1
$54,750
8
$3,691,630
15
$188,720
Aggregated Statistics For Year 1999 (Based on 4 full and 11 partial tracts)
A) FHA, FSA/RHS & VA Home Purchase Loans
B) Conventional Home Purchase Loans
C) Refinancings
D) Home Improvement Loans
E) Loans on Dwellings For 5+ Families
F) Non-occupant Loans on < 5 Family Dwellings (A B C & D)
2006 - 2018 National Fire Incident Reporting System (NFIRS) incidents
Based on the data from the years 2006 - 2018 the average number of fire incidents per year is 120. The highest number of fire incidents - 171 took place in 2017, and the least - 68 in 2012. The data has a growing trend.
When looking into fire subcategories, the most incidents belonged to: Structure Fires (54.3%), and Outside Fires (32.9%).
Fire incident types reported to NFIRS in Zip Code 94501


 Nearest zip codes: 94612, 94606, 94607, 94502, 94610, 94601.


 Based on the data from the years 2006 - 2018 the average number of fire incidents per year is 120. The highest number of fire incidents - 171 took place in 2017, and the least - 68 in 2012. The data has a growing trend.
 When looking into fire subcategories, the most incidents belonged to: Structure Fires (54.3%), and Outside Fires (32.9%).