Estimated zip code population in 2022: 14,106 Zip code population in 2010: 13,600 Zip code population in 2000: 13,980
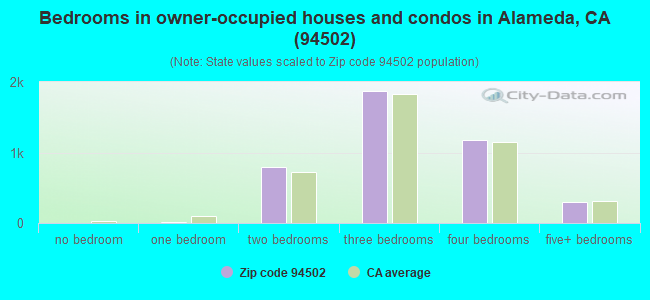
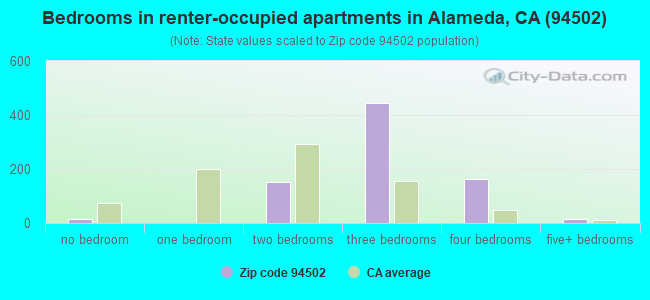
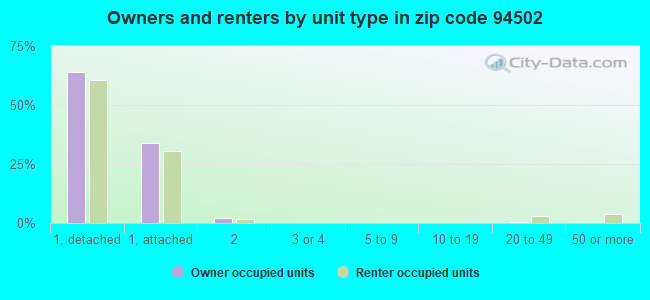
Houses and condos: 5,133 Renter-occupied apartments: 785
% of renters here:
16%
State:
44%
March 2022 cost of living index in zip code 94502: 119.3 (more than average, U.S. average is 100)
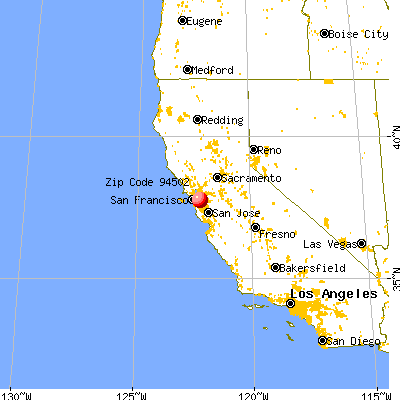
Land area: 2.7 sq. mi. Water area: 1.2 sq. mi.
Population density: 5,263 people per square mile
(average).
OSM Map
General Map
Google Map
MSN Map
OSM Map
General Map
Google Map
MSN Map
OSM Map
General Map
Google Map
MSN Map
OSM Map
General Map
Google Map
MSN Map
Please wait while loading the map...
Real estate property taxes paid for housing units in 2022:
This zip code:
0.8% ($9,952)
California:
0.7% ($4,831)
Median real estate property taxes paid for housing units with mortgages in 2022: $10,330 (0.8%) Median real estate property taxes paid for housing units with no mortgage in 2022: $7,380 (0.6%)
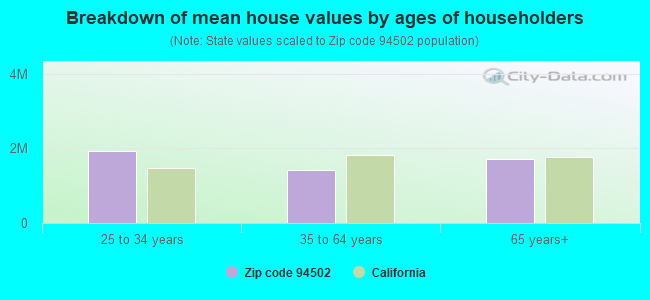
Estimated median house/condo value in 2022: $1,243,840
94502:
$1,243,840
California:
$715,900
According to our research of California and other state lists, there were 2 registered sex offenders living in 94502 zip code as of April 27, 2024. The ratio of all residents to sex offenders in zip code 94502 is 7,192 to 1. The ratio of registered sex offenders to all residents in this zip code is much lower than the state average.
Median resident age:
This zip code:
44.8 years
California median age:
37.9 years
Average household size:
This zip code:
2.9 people
California:
2.8 people
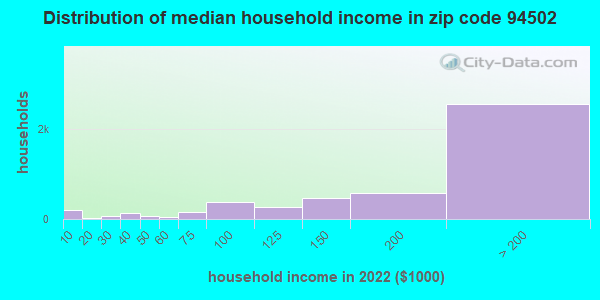
Averages for the 2020 tax year for zip code 94502, filed in 2021:
Average Adjusted Gross Income (AGI) in 2020: $159,631 (Individual Income Tax Returns)
Here:
$159,631
State:
$95,910
Salary/wage: $143,892 (reported on 74.9% of returns)
Here:
$143,892
State:
$77,331
(% of AGI for various income ranges: 1146.2% for AGIs below $25k, 3983.9% for AGIs $25k-50k, 6671.8% for AGIs $50k-75k, 9557.8% for AGIs $75k-100k, 20144.1% for AGIs $100k-200k, 111471.6% for AGIs over 200k)
Taxable interest for individuals: $2,359 (reported on 61.6% of returns)
This zip code:
$2,359
California:
$2,294
(% of AGI for various income ranges: 60.2% for AGIs below $25k, 76.8% for AGIs $25k-50k, 114.3% for AGIs $50k-75k, 199.7% for AGIs $75k-100k, 341.6% for AGIs $100k-200k, 1209.8% for AGIs over 200k)
Ordinary dividends: $9,111 (reported on 50.8% of returns)
Here:
$9,111
State:
$10,949
(% of AGI for various income ranges: 121.9% for AGIs below $25k, 246.8% for AGIs $25k-50k, 330.2% for AGIs $50k-75k, 600.6% for AGIs $75k-100k, 825.0% for AGIs $100k-200k, 4486.7% for AGIs over 200k)
Net capital gain/loss in AGI: +$25,363 (reported on 46.6% of returns)
Here:
+$25,363
State:
+$49,306
(% of AGI for various income ranges: 52.2% for AGIs below $25k, 225.2% for AGIs $25k-50k, 187.0% for AGIs $50k-75k, 369.7% for AGIs $75k-100k, 1181.3% for AGIs $100k-200k, 15504.9% for AGIs over 200k)
Profit/loss from business: +$25,140 (reported on 17.4% of returns)
Here:
+$25,140
State:
+$15,671
(% of AGI for various income ranges: 181.7% for AGIs below $25k, 292.7% for AGIs $25k-50k, 472.0% for AGIs $50k-75k, 456.7% for AGIs $75k-100k, 837.8% for AGIs $100k-200k, 3917.6% for AGIs over 200k)
Taxable individual retirement arrangement distribution: $29,404 (reported on 13.7% of returns)
94502:
$29,404
California:
$23,505
(% of AGI for various income ranges: 113.1% for AGIs below $25k, 230.2% for AGIs $25k-50k, 393.4% for AGIs $50k-75k, 641.7% for AGIs $75k-100k, 1353.4% for AGIs $100k-200k, 2522.7% for AGIs over 200k)
Self-employed (Keogh) retirement plans: $25,206 (reported on 2.6% of returns)
94502:
$25,206
California:
$30,163
(% of AGI for various income ranges: 58.2% for AGIs $50k-75k, 73.9% for AGIs $100k-200k, 816.7% for AGIs over 200k)
Total itemized deductions: $36,097 (reported on 30.2% of returns)
Here:
$36,097
State:
$39,517
(% of AGI for various income ranges: 242.5% for AGIs below $25k, 591.4% for AGIs $25k-50k, 913.2% for AGIs $50k-75k, 1477.5% for AGIs $75k-100k, 2491.6% for AGIs $100k-200k, 9467.3% for AGIs over 200k)
Charity contributions: $9,048 (reported on 24.8% of returns)
Here:
$9,048
State:
$12,598
(% of AGI for various income ranges: 11.7% for AGIs below $25k, 44.1% for AGIs $25k-50k, 115.7% for AGIs $50k-75k, 172.2% for AGIs $75k-100k, 423.2% for AGIs $100k-200k, 2416.9% for AGIs over 200k)
Taxes paid: $9,323 (reported on 30.2% of returns)
94502:
$9,323
State:
$8,807
(% of AGI for various income ranges: 52.8% for AGIs below $25k, 163.0% for AGIs $25k-50k, 258.6% for AGIs $50k-75k, 443.3% for AGIs $75k-100k, 754.8% for AGIs $100k-200k, 2174.7% for AGIs over 200k)
Earned income credit: $1,607 (reported on 3.9% of returns)
Here:
$1,607
State:
$2,074
(% of AGI for various income ranges: 45.0% for AGIs below $25k, 33.2% for AGIs $25k-50k)
Percentage of individuals using paid preparers for their 2020 taxes: 90.0%
Here:
90%
State:
92%
(% for various income ranges: 87.2% for AGIs below $25k, 89.9% for AGIs $25k-50k, 89.3% for AGIs $50k-75k, 89.2% for AGIs $75k-100k, 90.9% for AGIs $100k-200k, 91.8% for AGIs over 200k)
Averages for the 2012 tax year for zip code 94502, filed in 2013:
Average Adjusted Gross Income (AGI) in 2012: $114,281 (Individual Income Tax Returns)
Here:
$114,281
State:
$72,726
Salary/wage: $103,161 (reported on 76.7% of returns)
Here:
$103,161
State:
$59,079
(% of AGI for various income ranges: 67.7% for AGIs below $25k, 69.2% for AGIs $25k-50k, 58.2% for AGIs $50k-75k, 64.7% for AGIs $75k-100k, 73.4% for AGIs $100k-200k, 68.6% for AGIs over 200k)
Taxable interest for individuals: $1,922 (reported on 63.8% of returns)
This zip code:
$1,922
California:
$2,146
(% of AGI for various income ranges: 3.6% for AGIs below $25k, 1.4% for AGIs $25k-50k, 1.6% for AGIs $50k-75k, 1.0% for AGIs $75k-100k, 0.8% for AGIs $100k-200k, 1.0% for AGIs over 200k)
Ordinary dividends: $7,448 (reported on 47.2% of returns)
Here:
$7,448
State:
$9,308
(% of AGI for various income ranges: 6.1% for AGIs below $25k, 2.8% for AGIs $25k-50k, 3.9% for AGIs $50k-75k, 2.5% for AGIs $75k-100k, 2.2% for AGIs $100k-200k, 3.6% for AGIs over 200k)
Net capital gain/loss in AGI: +$11,728 (reported on 39.8% of returns)
Here:
+$11,728
State:
+$30,460
(% of AGI for various income ranges: 0.6% for AGIs $25k-50k, 0.9% for AGIs $50k-75k, 0.6% for AGIs $75k-100k, 1.5% for AGIs $100k-200k, 7.7% for AGIs over 200k)
Profit/loss from business: +$28,569 (reported on 19.4% of returns)
Here:
+$28,569
State:
+$17,064
(% of AGI for various income ranges: 12.4% for AGIs below $25k, 7.1% for AGIs $25k-50k, 6.9% for AGIs $50k-75k, 3.3% for AGIs $75k-100k, 3.7% for AGIs $100k-200k, 5.1% for AGIs over 200k)
Taxable individual retirement arrangement distribution: $21,856 (reported on 15.4% of returns)
94502:
$21,856
California:
$19,557
(% of AGI for various income ranges: 5.2% for AGIs below $25k, 4.3% for AGIs $25k-50k, 5.1% for AGIs $50k-75k, 3.5% for AGIs $75k-100k, 3.4% for AGIs $100k-200k, 2.0% for AGIs over 200k)
Self-employment retirement plans: $25,955 (reported on 3.0% of returns)
94502:
$25,955
California:
$24,530
(% of AGI for various income ranges: 1.2% for AGIs $50k-75k, 0.4% for AGIs $100k-200k, 1.0% for AGIs over 200k)
Total itemized deductions: $35,616 (22% of AGI, reported on 61.1% of returns)
Here:
$35,616
State:
$34,004
Here:
21.9% of AGI
State:
22.7% of AGI
(% of AGI for various income ranges: 31.7% for AGIs below $25k, 18.2% for AGIs $25k-50k, 22.5% for AGIs $50k-75k, 21.3% for AGIs $75k-100k, 19.9% for AGIs $100k-200k, 17.1% for AGIs over 200k)
Charity contributions: $3,741 (reported on 52.4% of returns)
Here:
$3,741
State:
$4,659
(% of AGI for various income ranges: 1.6% for AGIs below $25k, 1.9% for AGIs $25k-50k, 2.3% for AGIs $50k-75k, 2.1% for AGIs $75k-100k, 1.8% for AGIs $100k-200k, 1.5% for AGIs over 200k)
Taxes paid: $17,074 (reported on 61.0% of returns)
94502:
$17,074
State:
$14,448
(% of AGI for various income ranges: 6.8% for AGIs below $25k, 5.4% for AGIs $25k-50k, 7.8% for AGIs $50k-75k, 8.1% for AGIs $75k-100k, 9.2% for AGIs $100k-200k, 9.9% for AGIs over 200k)
Earned income credit: $1,619 (reported on 4.7% of returns)
Here:
$1,619
State:
$2,286
(% of AGI for various income ranges: 2.4% for AGIs below $25k, 0.4% for AGIs $25k-50k)
Percentage of individuals using paid preparers for their 2012 taxes: 52.4%
Here:
52%
State:
64%
(% for various income ranges: 44.7% for AGIs below $25k, 46.7% for AGIs $25k-50k, 56.4% for AGIs $50k-75k, 58.9% for AGIs $75k-100k, 52.7% for AGIs $100k-200k, 60.6% for AGIs over 200k)
Averages for the 2004 tax year for zip code 94502, filed in 2005:
Average Adjusted Gross Income (AGI) in 2004: $89,508 (Individual Income Tax Returns)
Here:
$89,508
State:
$58,600
Salary/wage: $84,952 (reported on 76.0% of returns)
Here:
$84,952
State:
$49,455
(% of AGI for various income ranges: 277.1% for AGIs below $10k, 57.8% for AGIs $10k-25k, 65.1% for AGIs $25k-50k, 68.8% for AGIs $50k-75k, 72.9% for AGIs $75k-100k, 72.9% for AGIs over 100k)
Taxable interest for individuals: $2,000 (reported on 72.7% of returns)
This zip code:
$2,000
California:
$2,365
(% of AGI for various income ranges: 30.2% for AGIs below $10k, 5.0% for AGIs $10k-25k, 3.4% for AGIs $25k-50k, 2.3% for AGIs $50k-75k, 1.7% for AGIs $75k-100k, 1.2% for AGIs over 100k)
Taxable dividends: $3,980 (reported on 52.4% of returns)
Here:
$3,980
State:
$4,746
(% of AGI for various income ranges: 34.3% for AGIs below $10k, 5.7% for AGIs $10k-25k, 3.1% for AGIs $25k-50k, 2.8% for AGIs $50k-75k, 2.5% for AGIs $75k-100k, 2.0% for AGIs over 100k)
Net capital gain/loss: +$9,573 (reported on 44.6% of returns)
Here:
+$9,573
State:
+$23,418
(% of AGI for various income ranges: -14.2% for AGIs below $10k, 1.7% for AGIs $10k-25k, 0.5% for AGIs $25k-50k, 0.9% for AGIs $50k-75k, 1.4% for AGIs $75k-100k, 6.4% for AGIs over 100k)
Profit/loss from business: +$31,453 (reported on 19.9% of returns)
Here:
+$31,453
State:
+$16,826
(% of AGI for various income ranges: -0.5% for AGIs below $10k, 9.0% for AGIs $10k-25k, 8.1% for AGIs $25k-50k, 5.7% for AGIs $50k-75k, 6.8% for AGIs $75k-100k, 7.1% for AGIs over 100k)
IRA payment deduction: $3,643 (reported on 4.4% of returns)
94502:
$3,643
California:
$3,192
(% of AGI for various income ranges: 0.8% for AGIs $10k-25k, 0.5% for AGIs $25k-50k, 0.3% for AGIs $50k-75k, 0.3% for AGIs $75k-100k, 0.1% for AGIs over 100k)
Self-employed pension: $20,638 (reported on 3.9% of returns)
Here:
$20,638
California:
$17,688
(% of AGI for various income ranges: 0.3% for AGIs $25k-50k, 0.4% for AGIs $50k-75k, 0.5% for AGIs $75k-100k, 1.1% for AGIs over 100k)
Total itemized deductions: $30,103 (23% of AGI, reported on 61.0% of returns)
Here:
$30,103
State:
$28,113
Here:
23.3% of AGI
State:
25.3% of AGI
(% of AGI for various income ranges: 113.6% for AGIs below $10k, 23.7% for AGIs $10k-25k, 21.1% for AGIs $25k-50k, 23.6% for AGIs $50k-75k, 24.6% for AGIs $75k-100k, 18.9% for AGIs over 100k)
Charity contributions deductions: $2,975 (2% of AGI, reported on 55.1% of returns)
Here:
$2,975
State:
$3,923
Here:
2.2% of AGI
State:
3.3% of AGI
(% of AGI for various income ranges: 3.7% for AGIs below $10k, 1.5% for AGIs $10k-25k, 1.8% for AGIs $25k-50k, 2.3% for AGIs $50k-75k, 2.3% for AGIs $75k-100k, 1.7% for AGIs over 100k)
Total tax: $16,318 (reported on 85.8% of returns)
94502:
$16,318
State:
$10,761
(% of AGI for various income ranges: 10.8% for AGIs below $10k, 5.4% for AGIs $10k-25k, 8.4% for AGIs $25k-50k, 9.7% for AGIs $50k-75k, 10.7% for AGIs $75k-100k, 18.3% for AGIs over 100k)
Earned income credit: $1,383 (reported on 3.6% of returns)
Here:
$1,383
State:
$1,763
Percentage of individuals using paid preparers for their 2004 taxes: 56.5%
Here:
56%
State:
66%
(% for various income ranges: 48.6% for AGIs below $10k, 59.6% for AGIs $10k-25k, 56.0% for AGIs $25k-50k, 57.6% for AGIs $50k-75k, 57.9% for AGIs $75k-100k, 58.4% for AGIs over 100k)
Household received Food Stamps/SNAP in the past 12 months: 32 Household did not receive Food Stamps/SNAP in the past 12 months: 4,767
Women who had a birth in the past 12 months: 100 (99 now married, 0 unmarried) Women who did not have a birth in the past 12 months: 2,592 (1,478 now married, 1,095 unmarried)
Housing units in zip code 94502 with a mortgage: 2,769 (352 second mortgage, 37 home equity loan, 307 both second mortgage and home equity loan) Houses without a mortgage: 39
Median monthly owner costs for units with a mortgage: $3,560 Median monthly owner costs for units without a mortgage: $1,226
Residents with income below the poverty level in 2022:
This zip code:
2.6%
Whole state:
12.2%
Residents with income below 50% of the poverty level in 2022:
This zip code:
0.1%
Whole state:
6.2%
Median number of rooms in houses and condos:
Here:
5.8
State:
6.0
Median number of rooms in apartments:
Here:
6.0
State:
3.9
Notable locations in this zip code not listed on our city pages
In group quarters: 39 (-1 institutionalized population)
Size of family households: 1,612 2-persons, 984 3-persons, 896 4-persons, 365 5-persons, 75 6-persons, 45 7-or-more-persons
Size of nonfamily households: 839 1-person, 53 2-persons, 36 7-or-more-persons
2,539 married couples with children.
255 single-parent households (46 men, 209 women).
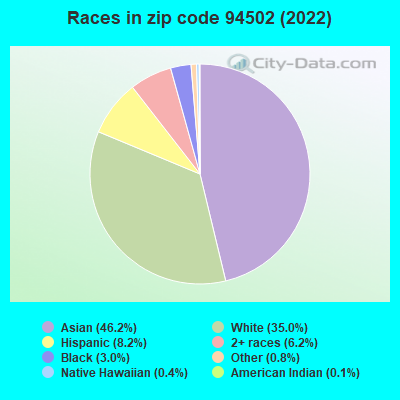
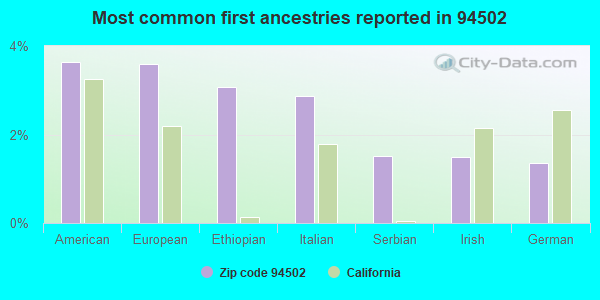
64.6% of residents of 94502 zip code speak English at home.
1.8% of residents speak Spanish at home (73% very well, 27% well).
3.5% of residents speak other Indo-European language at home (66% very well, 26% well, 3% not well, 4% not at all).
28.9% of residents speak Asian or Pacific Island language at home (58% very well, 26% well, 12% not well, 4% not at all).
1.6% of residents speak other language at home (100% very well).
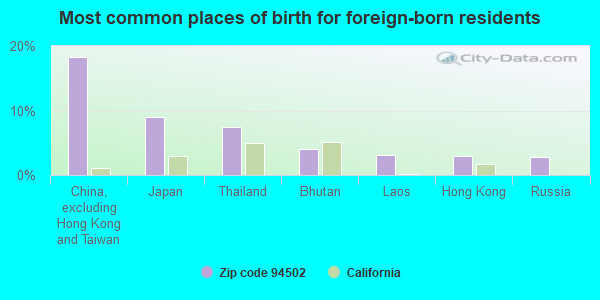
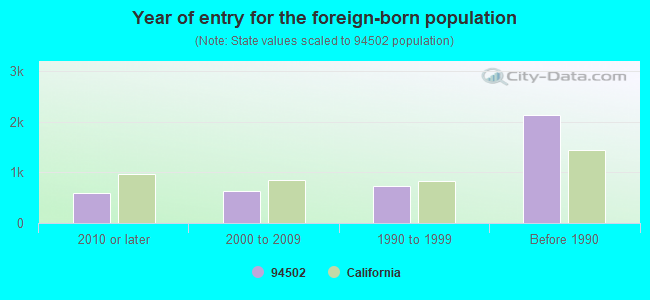
Foreign born population: 3,700 (26.2%) (85.4% of them are naturalized citizens)
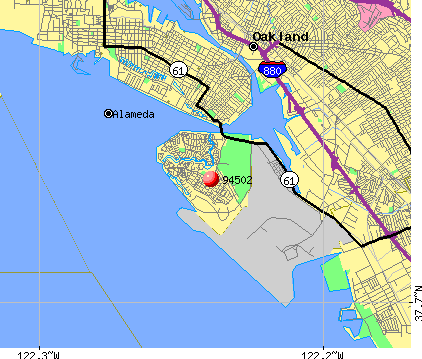
Facilities with environmental interests located in this zip code:
EQUILON ENTERPRISES (1601 WEBSTER/LINCOLN in ALAMEDA, CA) . Federal Facility
STATE MASTER (California - Hazardous Waste Tracking) - HAZARDOU WASTE PROGRAM Small Quantity Generators, between 100 kg and 1000 kg of hazardous waste/month (Resource Conservation and Recovery Act (tracking hazardous waste)) - notification Organizations: EQUILON ENTERPRISES, LLC (CONTACT/OWNER)
Alternative names: SHELL OIL CO
CELERA DIAGNOSTICS LLC (1501 HARBOR BAY PARKWAY in ALAMEDA, CA)
Small Quantity Generators, between 100 kg and 1000 kg of hazardous waste/month (Resource Conservation and Recovery Act (tracking hazardous waste)) Organizations: SCHERING BERLIN INC (CONTACT/OWNER)
, 1501 HARBOR BAY LP (CONTACT/OWNER)
Alternative names: BERLEX BIOSCIENCES INC
APPLERA CORP (1311 HARBOR BAY PARKWAY in ALAMEDA, CA)
Small Quantity Generators, between 100 kg and 1000 kg of hazardous waste/month (Resource Conservation and Recovery Act (tracking hazardous waste)) - notification Alternative names: KABIVITRUM INC
Housing units lacking complete plumbing facilities: 0.2% Housing units lacking complete kitchen facilities: 0.9%
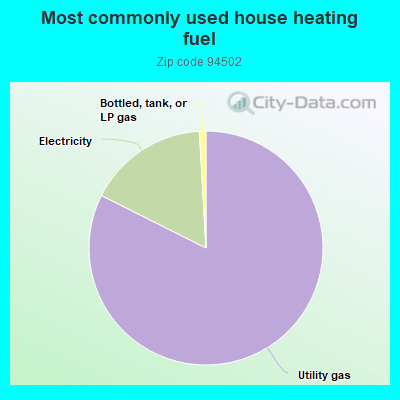
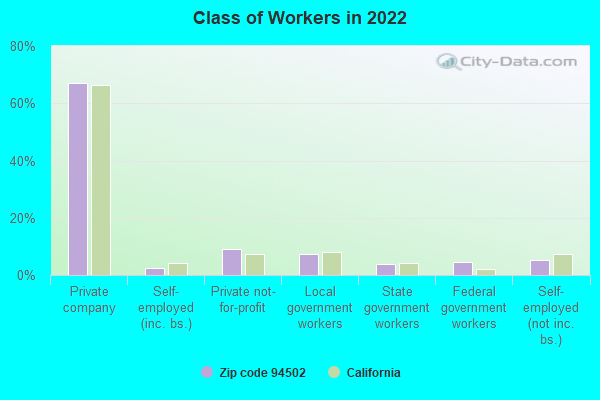
82.0%Utility gas
16.6%Electricity
0.9%Bottled, tank, or LP gas
Place of birth for U.S.-born residents:
This state: 7,468
Northeast: 776
Midwest: 721
South: 442
West: 516
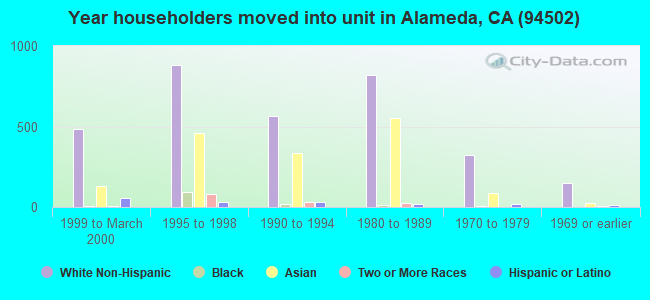
61% of the 94502 zip code residents lived in the same house 5 years ago. Out of people who lived in different houses, 60% lived in this county. Out of people who lived in different counties, 50% lived in California.
96% of the 94502 zip code residents lived in the same house 1 year ago. Out of people who lived in different houses, 72% moved from this county. Out of people who lived in different houses, 20% moved from different county within same state. Out of people who lived in different houses, 14% moved from different state.
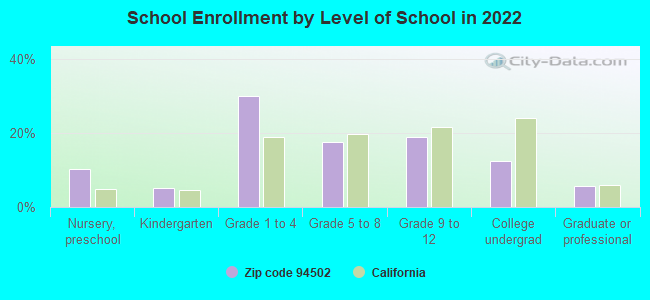
Private vs. public school enrollment:
Students in private schools in grades 1 to 8 (elementary and middle school): 78
Here:
5.2%
California:
10.5%
Students in private schools in grades 9 to 12 (high school): 44
Here:
7.4%
California:
8.5%
Students in private undergraduate colleges: 19
Here:
4.9%
California:
15.9%
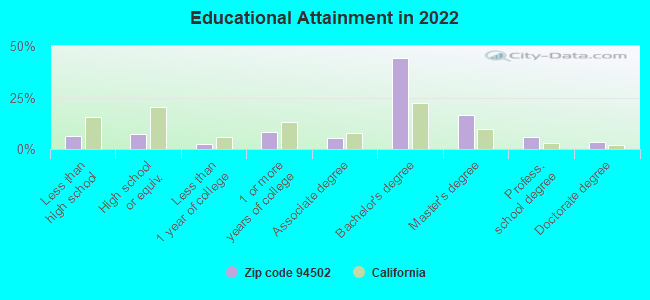
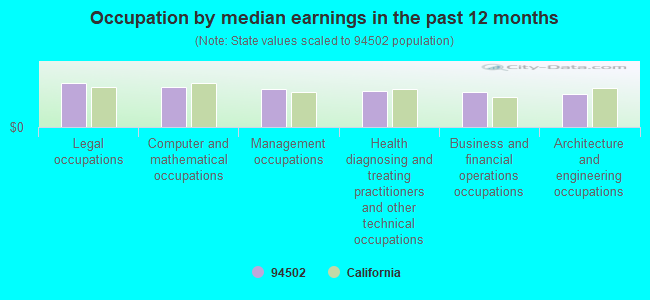
Occupation by median earnings in the past 12 months ($)
163,279Legal occupations
151,422Computer and mathematical occupations
141,599Management occupations
135,505Health diagnosing and treating practitioners and other technical occupations
129,690Business and financial operations occupations
122,946Architecture and engineering occupations
Companies with federal contracts located in this zip code (ALAMEDA, CA):
XINTEC CORPORATION (1660 S LOOP RD; small business) : $331,183 in 11 contractsfrom 2000 to 2006
Contracts for X-Ray Equipment and Supplies: Medical, Dental, Veterinary, MEDICAL, DENTAL, AND VETERINARY EQUIPMENT AND SUPPLIES, Medical and Surgical Instruments, Equipment, and Supplies, Maintenance, Repair and Rebuilding of Equipment -- Special Industry Machinery, and moreby Navy, Department of Veterans Affairs, Army, Air Force, and others Signed by year:2000: $45,000; 2001: $0; 2002: $0; 2003: $0; 2004: $138,353; 2005: $104,977; 2006: $42,853.
Biggest contracts:
$64,352 with Navy for X-Ray Equipment and Supplies: Medical, Dental, Veterinary. Signed on 2005-07-01. Completion date: 2005-07-29.
$62,483 with Department of Veterans Affairs for MEDICAL, DENTAL, AND VETERINARY EQUIPMENT AND SUPPLIES. Signed on 2004-08-13. Completion date: 2004-08-13.
$50,250 with Department of Veterans Affairs for Medical and Surgical Instruments, Equipment, and Supplies. Signed on 2004-01-30. Completion date: 2004-02-28.
$45,000 with Navy for Medical and Surgical Instruments, Equipment, and Supplies. Signed on 2000-08-16. Completion date: 2000-08-24.
519 HCT LLC (519 17TH ST; small business) : $146,955 in 44 contractsfrom 2002 to 2006
Contracts for Lease or Rental of Facilities -- Office Buildings by Public Buildings Service Signed by year:2000: $0; 2001: $0; 2002: $14,550; 2003: $67,900; 2004: $4,850; 2005: $30,555; 2006: $29,100.
Biggest contracts:
$7,275 with Public Buildings Service for Lease or Rental of Facilities -- Office Buildings. Signed on 2002-12-15. Completion date: 2002-12-15.
$7,275, same as above.Signed on 2003-09-15. Completion date: 2003-09-15.
$7,275, same as above.Signed on 2002-12-15. Completion date: 2002-12-15.
$7,275, same as above.Signed on 2003-09-15. Completion date: 2003-09-15.
GOOD GUYS CALIFORNIA INC (1600 HARBOR BAY PKWY STE 2) : $16,000 in 3 contractsin 2004
$10,500 with Navy for Radio and Television Communication Equipment, Except Airborne. Signed on 2004-08-16. Completion date: 2004-09-07.
$4,000, same as above.Signed on 2004-07-12. Completion date: 2004-08-03.
$1,500, same as above.Signed on 2004-09-13. Completion date: 2004-09-07.
FEDERATED HOLDINGS INC (883 ISLAND DR STE B; small business)
$12,150 with Navy for Food Services. Taking place in IL. Signed on 2005-04-29. Completion date: 2005-03-17.
JOSEPH K. LOCHTE (106 PARSAIT LN; small business)
$6,497 with Departmental Offices for Personal Services Contracts. Taking place in DC. Signed on 2003-08-15. Completion date: 2004-09-15.
Top industries in this zip code by the number of employees in 2005:
Wholesale Trade: Other Electronic Parts and Equipment Merchant Wholesalers (over 1000 employees: 1 establishment)
Administrative and Support and Waste Management and Remediation Services: Temporary Help Services (500-999: 1, 100-249: 2, 50-99: 1, 20-49: 1, 10-19: 1, 5-9: 1, 1-4: 2)
Management of Companies and Enterprises: Corporate, Subsidiary, and Regional Managing Offices (250-499: 2, 20-49: 1, 1-4: 2)
Professional, Scientific, and Technical Services: Research and Development in the Physical, Engineering, and Life Sciences (100-249: 1, 50-99: 1, 20-49: 2, 10-19: 1, 1-4: 3)
Finance and Insurance: Third Party Administration of Insurance and Pension Funds (100-249: 1, 20-49: 1, 10-19: 2, 5-9: 1)
2004 - 2018 National Fire Incident Reporting System (NFIRS) incidents
Based on the data from the years 2004 - 2018 the average number of fire incidents per year is 10. The highest number of fire incidents - 22 took place in 2017, and the least - 0 in 2005. The data has a growing trend.
When looking into fire subcategories, the most incidents belonged to: Structure Fires (51.7%), and Outside Fires (35.8%).
Fire incident types reported to NFIRS in Zip Code 94502


 Nearest zip codes: 94621, 94601, 94501, 94606, 94603, 94610.


 . Federal Facility
 Based on the data from the years 2004 - 2018 the average number of fire incidents per year is 10. The highest number of fire incidents - 22 took place in 2017, and the least - 0 in 2005. The data has a growing trend.
 When looking into fire subcategories, the most incidents belonged to: Structure Fires (51.7%), and Outside Fires (35.8%).