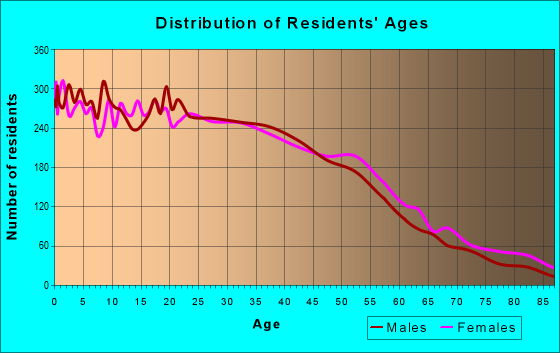
Estimated zip code population in 2022: 36,734 Zip code population in 2010: 31,403 Zip code population in 2000: 31,389
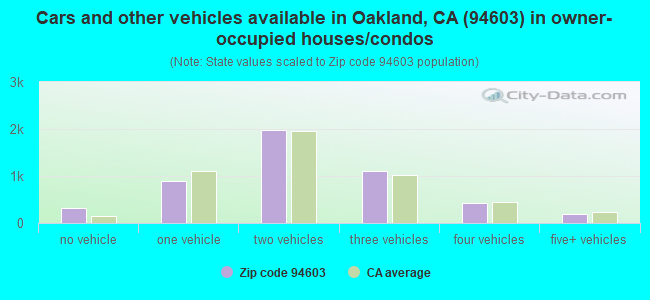
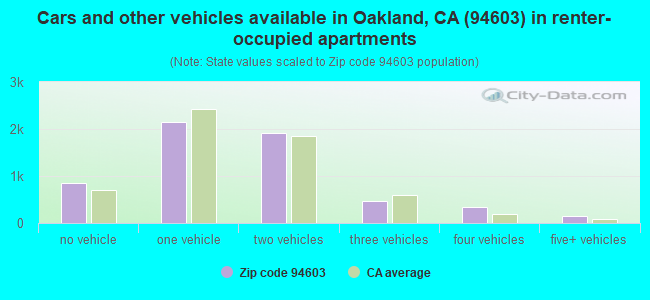
Houses and condos: 11,200 Renter-occupied apartments: 5,862
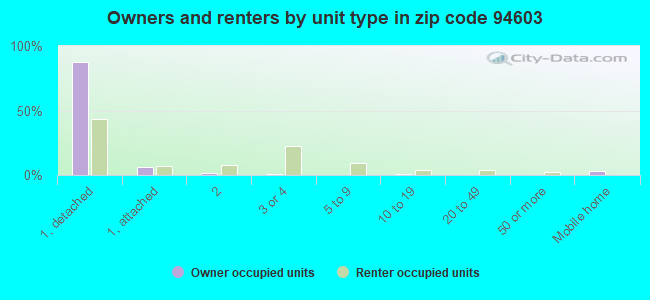
% of renters here:
55%
State:
44%
March 2022 cost of living index in zip code 94603: 119.2 (more than average, U.S. average is 100)
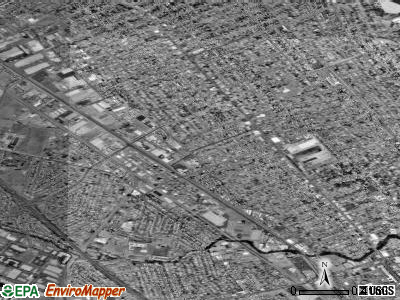
Land area: 3.3 sq. mi. Water area: 0.0 sq. mi.
Population density: 11,268 people per square mile
(high).
OSM Map
General Map
Google Map
MSN Map
OSM Map
General Map
Google Map
MSN Map
OSM Map
General Map
Google Map
MSN Map
OSM Map
General Map
Google Map
MSN Map
Please wait while loading the map...
Real estate property taxes paid for housing units in 2022:
This zip code:
0.8% ($4,525)
California:
0.7% ($4,831)
Median real estate property taxes paid for housing units with mortgages in 2022: $4,826 (0.8%) Median real estate property taxes paid for housing units with no mortgage in 2022: $4,188 (0.8%)
Averages for the 2020 tax year for zip code 94603, filed in 2021:
Average Adjusted Gross Income (AGI) in 2020: $46,947 (Individual Income Tax Returns)
Here:
$46,947
State:
$95,910
Salary/wage: $45,328 (reported on 86.5% of returns)
Here:
$45,328
State:
$77,331
(% of AGI for various income ranges: 1308.3% for AGIs below $25k, 4204.8% for AGIs $25k-50k, 7961.2% for AGIs $50k-75k, 12012.5% for AGIs $75k-100k, 20738.1% for AGIs $100k-200k, 68190.0% for AGIs over 200k)
Taxable interest for individuals: $232 (reported on 18.9% of returns)
This zip code:
$232
California:
$2,294
(% of AGI for various income ranges: 2.4% for AGIs below $25k, 3.3% for AGIs $25k-50k, 6.5% for AGIs $50k-75k, 16.1% for AGIs $75k-100k, 24.0% for AGIs $100k-200k, 134.0% for AGIs over 200k)
Ordinary dividends: $981 (reported on 3.7% of returns)
Here:
$981
State:
$10,949
(% of AGI for various income ranges: 2.3% for AGIs below $25k, 3.0% for AGIs $25k-50k, 4.5% for AGIs $50k-75k, 7.4% for AGIs $75k-100k, 15.1% for AGIs $100k-200k, 282.0% for AGIs over 200k)
Net capital gain/loss in AGI: +$5,795 (reported on 4.4% of returns)
Here:
+$5,795
State:
+$49,306
(% of AGI for various income ranges: 0.6% for AGIs below $25k, 3.0% for AGIs $25k-50k, 13.2% for AGIs $50k-75k, 34.1% for AGIs $75k-100k, 136.8% for AGIs $100k-200k, 5188.0% for AGIs over 200k)
Profit/loss from business: +$9,407 (reported on 16.4% of returns)
Here:
+$9,407
State:
+$15,671
(% of AGI for various income ranges: 216.6% for AGIs below $25k, 174.6% for AGIs $25k-50k, 202.2% for AGIs $50k-75k, 334.3% for AGIs $75k-100k, 345.3% for AGIs $100k-200k, 2914.0% for AGIs over 200k)
Taxable individual retirement arrangement distribution: $10,829 (reported on 1.4% of returns)
94603:
$10,829
California:
$23,505
(% of AGI for various income ranges: 12.8% for AGIs below $25k, 14.9% for AGIs $25k-50k, 21.1% for AGIs $50k-75k, 41.5% for AGIs $75k-100k, 104.9% for AGIs $100k-200k)
Total itemized deductions: $27,856 (reported on 9.1% of returns)
Here:
$27,856
State:
$39,517
(% of AGI for various income ranges: 51.7% for AGIs below $25k, 144.7% for AGIs $25k-50k, 436.6% for AGIs $50k-75k, 968.2% for AGIs $75k-100k, 1960.0% for AGIs $100k-200k, 6732.0% for AGIs over 200k)
Charity contributions: $5,282 (reported on 6.9% of returns)
Here:
$5,282
State:
$12,598
(% of AGI for various income ranges: 2.9% for AGIs below $25k, 17.8% for AGIs $25k-50k, 60.1% for AGIs $50k-75k, 152.1% for AGIs $75k-100k, 292.2% for AGIs $100k-200k, 1230.0% for AGIs over 200k)
Taxes paid: $9,221 (reported on 9.0% of returns)
94603:
$9,221
State:
$8,807
(% of AGI for various income ranges: 12.5% for AGIs below $25k, 47.6% for AGIs $25k-50k, 148.5% for AGIs $50k-75k, 352.2% for AGIs $75k-100k, 649.0% for AGIs $100k-200k, 1684.0% for AGIs over 200k)
Earned income credit: $2,295 (reported on 19.7% of returns)
Here:
$2,295
State:
$2,074
(% of AGI for various income ranges: 121.3% for AGIs below $25k, 77.3% for AGIs $25k-50k, 1.3% for AGIs $50k-75k)
Percentage of individuals using paid preparers for their 2020 taxes: 90.3%
Here:
90%
State:
92%
(% for various income ranges: 89.1% for AGIs below $25k, 90.6% for AGIs $25k-50k, 91.5% for AGIs $50k-75k, 90.5% for AGIs $75k-100k, 90.9% for AGIs $100k-200k, 93.3% for AGIs over 200k)
Averages for the 2012 tax year for zip code 94603, filed in 2013:
Average Adjusted Gross Income (AGI) in 2012: $34,014 (Individual Income Tax Returns)
Here:
$34,014
State:
$72,726
Salary/wage: $32,924 (reported on 86.6% of returns)
Here:
$32,924
State:
$59,079
(% of AGI for various income ranges: 77.1% for AGIs below $25k, 87.1% for AGIs $25k-50k, 87.4% for AGIs $50k-75k, 85.3% for AGIs $75k-100k, 84.8% for AGIs $100k-200k, 51.2% for AGIs over 200k)
Taxable interest for individuals: $254 (reported on 17.8% of returns)
This zip code:
$254
California:
$2,146
(% of AGI for various income ranges: 0.3% for AGIs below $25k, 0.1% for AGIs $25k-50k, 0.3% for AGIs over 200k)
Ordinary dividends: $726 (reported on 3.0% of returns)
Here:
$726
State:
$9,308
(% of AGI for various income ranges: 0.1% for AGIs $75k-100k)
Profit/loss from business: +$8,625 (reported on 14.9% of returns)
Here:
+$8,625
State:
+$17,064
(% of AGI for various income ranges: 12.1% for AGIs below $25k, 2.8% for AGIs $25k-50k, 1.0% for AGIs $50k-75k, 0.9% for AGIs $75k-100k, 2.0% for AGIs $100k-200k)
Taxable individual retirement arrangement distribution: $9,367 (reported on 2.3% of returns)
94603:
$9,367
California:
$19,557
(% of AGI for various income ranges: 0.7% for AGIs below $25k, 0.4% for AGIs $25k-50k, 0.5% for AGIs $50k-75k, 0.9% for AGIs $75k-100k, 1.8% for AGIs $100k-200k)
Total itemized deductions: $19,308 (31% of AGI, reported on 21.7% of returns)
Here:
$19,308
State:
$34,004
Here:
31.4% of AGI
State:
22.7% of AGI
(% of AGI for various income ranges: 6.2% for AGIs below $25k, 9.9% for AGIs $25k-50k, 15.0% for AGIs $50k-75k, 17.0% for AGIs $75k-100k, 18.3% for AGIs $100k-200k, 17.9% for AGIs over 200k)
Charity contributions: $2,863 (reported on 16.1% of returns)
Here:
$2,863
State:
$4,659
(% of AGI for various income ranges: 0.4% for AGIs below $25k, 1.0% for AGIs $25k-50k, 1.7% for AGIs $50k-75k, 1.9% for AGIs $75k-100k, 2.8% for AGIs $100k-200k, 1.3% for AGIs over 200k)
Taxes paid: $5,693 (reported on 21.5% of returns)
94603:
$5,693
State:
$14,448
(% of AGI for various income ranges: 1.3% for AGIs below $25k, 2.3% for AGIs $25k-50k, 4.2% for AGIs $50k-75k, 5.8% for AGIs $75k-100k, 6.8% for AGIs $100k-200k, 9.4% for AGIs over 200k)
Earned income credit: $2,537 (reported on 28.8% of returns)
Here:
$2,537
State:
$2,286
(% of AGI for various income ranges: 8.9% for AGIs below $25k, 1.4% for AGIs $25k-50k)
Percentage of individuals using paid preparers for their 2012 taxes: 64.1%
Here:
64%
State:
64%
(% for various income ranges: 61.4% for AGIs below $25k, 66.0% for AGIs $25k-50k, 68.2% for AGIs $50k-75k, 66.7% for AGIs $75k-100k, 62.9% for AGIs $100k-200k, 75.0% for AGIs over 200k)
Averages for the 2004 tax year for zip code 94603, filed in 2005:
Average Adjusted Gross Income (AGI) in 2004: $31,907 (Individual Income Tax Returns)
Here:
$31,907
State:
$58,600
Salary/wage: $31,157 (reported on 88.0% of returns)
Here:
$31,157
State:
$49,455
(% of AGI for various income ranges: 89.9% for AGIs below $10k, 81.4% for AGIs $10k-25k, 89.3% for AGIs $25k-50k, 89.3% for AGIs $50k-75k, 88.8% for AGIs $75k-100k, 65.7% for AGIs over 100k)
Taxable interest for individuals: $477 (reported on 26.3% of returns)
This zip code:
$477
California:
$2,365
(% of AGI for various income ranges: 1.2% for AGIs below $10k, 0.5% for AGIs $10k-25k, 0.3% for AGIs $25k-50k, 0.3% for AGIs $50k-75k, 0.5% for AGIs $75k-100k, 0.4% for AGIs over 100k)
Taxable dividends: $511 (reported on 5.3% of returns)
Here:
$511
State:
$4,746
(% of AGI for various income ranges: 0.4% for AGIs below $10k, 0.1% for AGIs $10k-25k, 0.1% for AGIs $25k-50k, 0.1% for AGIs $50k-75k, 0.1% for AGIs $75k-100k, 0.1% for AGIs over 100k)
Net capital gain/loss: +$14,913 (reported on 3.8% of returns)
Here:
+$14,913
State:
+$23,418
(% of AGI for various income ranges: -0.2% for AGIs below $10k, -0.0% for AGIs $10k-25k, 0.1% for AGIs $25k-50k, 0.3% for AGIs $50k-75k, 0.8% for AGIs $75k-100k, 18.0% for AGIs over 100k)
Profit/loss from business: +$6,917 (reported on 10.9% of returns)
Here:
+$6,917
State:
+$16,826
(% of AGI for various income ranges: 10.3% for AGIs below $10k, 5.8% for AGIs $10k-25k, 1.9% for AGIs $25k-50k, 1.1% for AGIs $50k-75k, 0.9% for AGIs $75k-100k, 0.6% for AGIs over 100k)
IRA payment deduction: $2,108 (reported on 0.6% of returns)
94603:
$2,108
California:
$3,192
Total itemized deductions: $20,098 (38% of AGI, reported on 30.4% of returns)
Here:
$20,098
State:
$28,113
Here:
38.4% of AGI
State:
25.3% of AGI
(% of AGI for various income ranges: 15.6% for AGIs below $10k, 11.2% for AGIs $10k-25k, 17.6% for AGIs $25k-50k, 24.0% for AGIs $50k-75k, 24.2% for AGIs $75k-100k, 22.4% for AGIs over 100k)
Charity contributions deductions: $2,692 (5% of AGI, reported on 25.0% of returns)
Here:
$2,692
State:
$3,923
Here:
4.9% of AGI
State:
3.3% of AGI
(% of AGI for various income ranges: 0.9% for AGIs below $10k, 1.1% for AGIs $10k-25k, 1.7% for AGIs $25k-50k, 2.7% for AGIs $50k-75k, 3.5% for AGIs $75k-100k, 3.2% for AGIs over 100k)
Total tax: $3,193 (reported on 61.3% of returns)
94603:
$3,193
State:
$10,761
(% of AGI for various income ranges: 2.9% for AGIs below $10k, 3.0% for AGIs $10k-25k, 4.8% for AGIs $25k-50k, 7.0% for AGIs $50k-75k, 8.9% for AGIs $75k-100k, 13.3% for AGIs over 100k)
Earned income credit: $1,888 (reported on 24.1% of returns)
Here:
$1,888
State:
$1,763
Percentage of individuals using paid preparers for their 2004 taxes: 71.5%
Here:
72%
State:
66%
(% for various income ranges: 63.9% for AGIs below $10k, 74.9% for AGIs $10k-25k, 73.4% for AGIs $25k-50k, 70.1% for AGIs $50k-75k, 66.8% for AGIs $75k-100k, 72.7% for AGIs over 100k)
Likely homosexual households (counted as self-reported same-sex unmarried-partner households)
Lesbian couples: 0.5% of all households
Gay men: 0.6% of all households
Household received Food Stamps/SNAP in the past 12 months: 1,948 Household did not receive Food Stamps/SNAP in the past 12 months: 8,934
Women who had a birth in the past 12 months: 649 (364 now married, 287 unmarried) Women who did not have a birth in the past 12 months: 8,881 (3,283 now married, 5,608 unmarried)
Housing units in zip code 94603 with a mortgage: 3,271 (211 second mortgage, 104 both second mortgage and home equity loan) Houses without a mortgage: 70
Median monthly owner costs for units with a mortgage: $2,246 Median monthly owner costs for units without a mortgage: $721
Residents with income below the poverty level in 2022:
This zip code:
13.5%
Whole state:
12.2%
Residents with income below 50% of the poverty level in 2022:
This zip code:
7.8%
Whole state:
6.2%
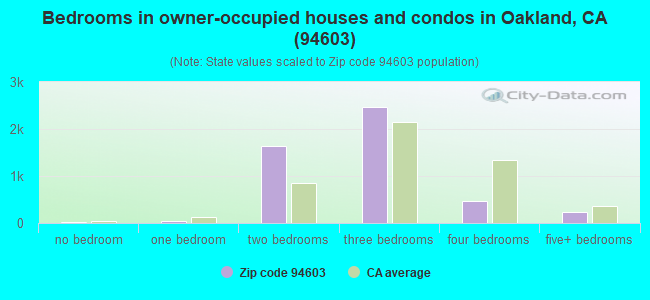
Median number of rooms in houses and condos:
Here:
5.1
State:
6.0
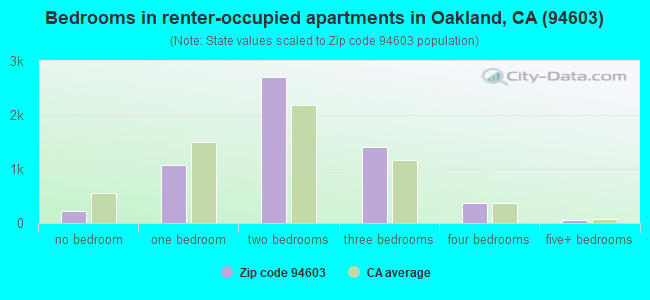
Median number of rooms in apartments:
Here:
4.1
State:
3.9
Notable locations in this zip code not listed on our city pages
Notable locations in zip code 94603: Lew Galbraith Golf Course (A), Brookfield Village Branch Oakland Public Library (B), Oakland Fire Department Station 20 (C), Saint Louis Hall (D). Display/hide their locations on the map
Churches in zip code 94603 include: Kingdom Hall of Jehovahs Witnesses (A), New Apostolic Church (B), Tabernacle Baptist Church (C), United Pentecostal Church (D), Saint Louis Bertrand Roman Catholic Church (E), Church of Christ (F), East Oakland Southern Baptist Church (G), Elmhurst Christian Church (H), Elmhurst Presbyterian Church (I). Display/hide their locations on the map
Parks in zip code 94603 include: Verdese Carter Park (1), Brookfield Village Park (2), Columbian Gardens (3), Carney Park (4), Sobrante Park (5), Stonehurst Recreation Area (6), Elmhurst Park (7). Display/hide their locations on the map
5,146 married couples with children.
2,574 single-parent households (850 men, 1,724 women).
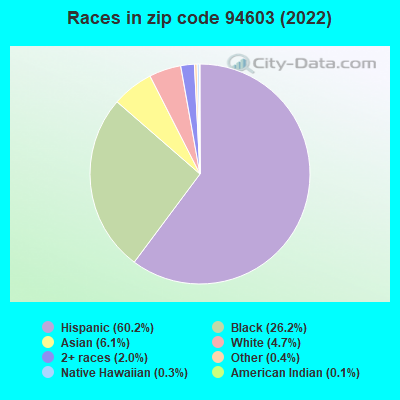
39.3% of residents of 94603 zip code speak English at home.
53.7% of residents speak Spanish at home (66% very well, 15% well, 12% not well, 7% not at all).
0.5% of residents speak other Indo-European language at home (52% very well, 37% well, 10% not at all).
4.8% of residents speak Asian or Pacific Island language at home (39% very well, 29% well, 24% not well, 8% not at all).
1.1% of residents speak other language at home (71% very well, 24% well, 3% not well, 1% not at all).
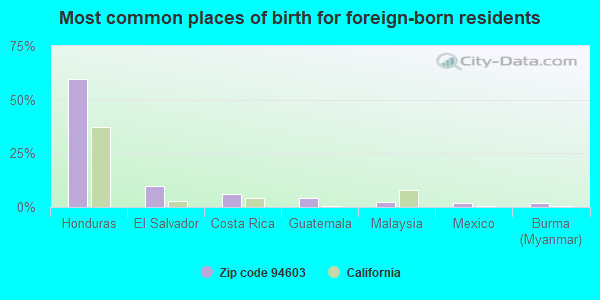
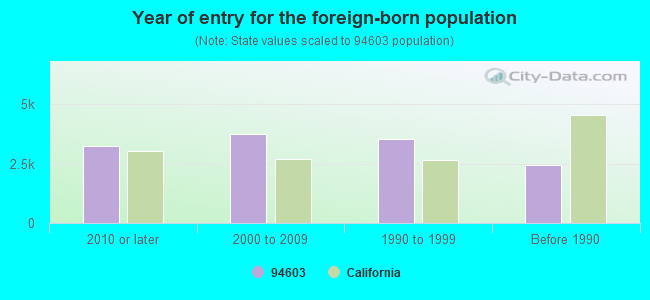
Foreign born population: 12,373 (33.7%) (30.0% of them are naturalized citizens)
Major facilities with environmental interests located in this zip code:
FLEISCHMANN'S YEAST (921 98TH AVE in OAKLAND, CA) . Federal Facility
STATE MASTER (California - Hazardous Waste Tracking) - HAZARDOU WASTE PROGRAM (Integrated Compliance Information System) - ICIS-09-1997-0063, FORMAL ENFORCEMENT ACTION CRITERIA AND HAZARDOUS AIR POLLUTANT INVENTORY (Inventory of air pollution sources) (Resource Conservation and Recovery Act (tracking hazardous waste)) TRI REPORTER (Tracking of toxic chemicals releasing facilities) Business SIC classification: SHORTENING, TABLE OILS, MARGARINE, AND OTHER EDIBLE FATS AND OILS; FOOD PREPARATIONS; NONCLASSIFIABLE ESTABLISHMENTS Organizations: BURNS PHLIP (CONTACT/OWNER)
Alternative names: NABISCO INC. FLEISCHMANN'S CO., NABISCO BRANDS INC
ELMHURST MIDDLE SCHOOL (1800 98TH AVE in OAKLAND, CA)
STATE MASTER (California - Hazardous Waste Tracking) - HAZARDOU WASTE PROGRAM (National Center for Education Statistics) - STATE ID-6057012 Small Quantity Generators, between 100 kg and 1000 kg of hazardous waste/month (Resource Conservation and Recovery Act (tracking hazardous waste)) - notification Organizations: OAKLAND UNIFIED SCHOOL DIST (CONTACT/OWNER)
, OAKLAND UNIFIED (SCHOOL DISTRICT)
MADISON MIDDLE SCHOOL (400 CAPISTRANO DR in OAKLAND, CA)
STATE MASTER (California - Hazardous Waste Tracking) - HAZARDOU WASTE PROGRAM (National Center for Education Statistics) - STATE ID-6066450 Small Quantity Generators, between 100 kg and 1000 kg of hazardous waste/month (Resource Conservation and Recovery Act (tracking hazardous waste)) - notification Organizations: OAKLAND UNIFIED SCHOOL DIST (CONTACT/OWNER)
, OAKLAND UNIFIED (SCHOOL DISTRICT)
MILLERS DISMANTLER (9835 PEARMAIN in OAKLAND, CA)
(Integrated Compliance Information System) - ICIS-09-2005-0151, ENFORCEMENT/COMPLIANCE ACTIVITY FORMAL ENFORCEMENT ACTION (Integrated Compliance Information System) - ICIS-09-2005-0151, ENFORCEMENT/COMPLIANCE ACTIVITY
MATSONS AUTOBODY & FRAME (2130 90TH AVENUE in OAKLAND, CA)
STATE MASTER (California - Hazardous Waste Tracking) - HAZARDOU WASTE PROGRAM CRITERIA AND HAZARDOUS AIR POLLUTANT INVENTORY (Inventory of air pollution sources) Small Quantity Generators, between 100 kg and 1000 kg of hazardous waste/month (Resource Conservation and Recovery Act (tracking hazardous waste)) - notification Business SIC classification: TOP, BODY, AND UPHOLSTERY REPAIR SHOPS AND PAINT SHOPS Business NAICS classification: AUTOMOTIVE BODY, PAINT, AND INTERIOR REPAIR AND MAINTENANCE. Organizations: MATSONS ENTERPRISES INC (CONTACT/OWNER)
Alternative names: MATSON'S
MELROSE METAL FINISHING INCORPORATED (10222 PEARMAIN ST in OAKLAND, CA)
STATE MASTER (California - Hazardous Waste Tracking) - HAZARDOU WASTE PROGRAM CRITERIA AND HAZARDOUS AIR POLLUTANT INVENTORY (Inventory of air pollution sources) Small Quantity Generators, between 100 kg and 1000 kg of hazardous waste/month (Resource Conservation and Recovery Act (tracking hazardous waste)) - notification Business SIC classification: COATING, ENGRAVING, AND ALLIED SERVICES Business NAICS classification: ELECTROPLATING, PLATING, POLISHING, ANODIZING, AND COLORING. Organizations: WERNER NAGENGAST (CONTACT/OWNER)
G M ASSOCIATES (9815 KITTY LN in OAKLAND, CA)
STATE MASTER (California - Hazardous Waste Tracking) - HAZARDOU WASTE PROGRAM Small Quantity Generators, between 100 kg and 1000 kg of hazardous waste/month (Resource Conservation and Recovery Act (tracking hazardous waste)) - notification Organizations: MEL NUTTER (CONTACT/OWNER)
EXCELLENT METAL PROCESSING (9901 SAN LEANDRO ST in OAKLAND, CA) . Federal Facility
STATE MASTER (California - Hazardous Waste Tracking) - HAZARDOU WASTE PROGRAM Small Quantity Generators, between 100 kg and 1000 kg of hazardous waste/month (Resource Conservation and Recovery Act (tracking hazardous waste)) - notification Organizations: ALIPIO VASQUEZ (CONTACT/OWNER)
Alternative names: ALIPIO VASQUEZ
LIONEL WILSON COLLEGE PREPARATORY ACADEMY (460 105TH AVENUE in OAKLAND, CA)
(National Center for Education Statistics) - STATE ID-0130666 Organizations: OAKLAND UNIFIED (SCHOOL DISTRICT)
MONARCH ACADEMY (1445 101ST AVE. in OAKLAND, CA)
(National Center for Education Statistics) - STATE ID-6117568 Organizations: OAKLAND UNIFIED (SCHOOL DISTRICT)
HOLCHEM INC (751 105TH AVE in OAKLAND, CA)
COMPLIANCE ACTIVITY (Tracking inspections of insecticide, fungicide, and rodenticide, and toxic substances) TRANSPORTER (Resource Conservation and Recovery Act (tracking hazardous waste)) Organizations: NORTON LIPKIN (CONTACT/OWNER)
, CHEMICALS & SUPPLIES CO (CONTACT/OWNER)
Alternative names: CHEMS & SUPPLIES CO
AC TRANSIT DISTRICT CENTRAL (10626 INTERNATIONAL BOULEVARD in OAKLAND, CA)
CRITERIA AND HAZARDOUS AIR POLLUTANT INVENTORY (Inventory of air pollution sources) HAZARDOUS WASTE BIENNIAL REPORTER (Resource Conservation and Recovery Act (tracking hazardous waste)) Large Quantity Generators, more that 1000 kg of hazardous waste/month (Resource Conservation and Recovery Act (tracking hazardous waste)) Business SIC classification: LOCAL AND SUBURBAN TRANSIT Business NAICS classification: BUS AND OTHER MOTOR VEHICLE TRANSIT SYSTEMS. Organizations: ALAMEDA CONTRA COSTA TRANSIT (CONTACT/OPERATOR)
Alternative names: ALAMEDA CO TRANSIT
K & L PLATING & MANUFACTURING (10306 PEARMAIN ST in OAKLAND, CA)
(Resource Conservation and Recovery Act (tracking hazardous waste)) Business NAICS classification: ELECTROPLATING, PLATING, POLISHING, ANODIZING, AND COLORING. Organizations: NEENAN S KARRICK (CONTACT/OWNER)
Housing units lacking complete plumbing facilities: 0.9% Housing units lacking complete kitchen facilities: 1.8%
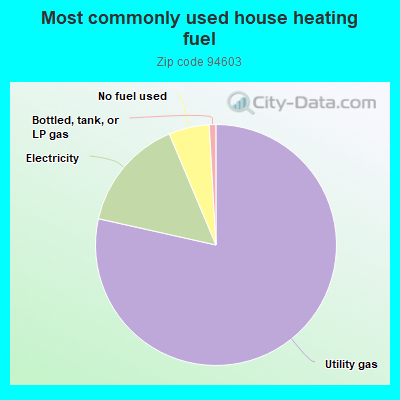
78.2%Utility gas
15.1%Electricity
5.4%No fuel used
0.9%Bottled, tank, or LP gas
Population in 1990: 27,303. Population change in the 1990s: +4,086 (+15.0%).
Place of birth for U.S.-born residents:
This state: 20,988
Northeast: 346
Midwest: 449
South: 1,956
West: 286
59% of the 94603 zip code residents lived in the same house 5 years ago. Out of people who lived in different houses, 79% lived in this county. Out of people who lived in different counties, 50% lived in California.
93% of the 94603 zip code residents lived in the same house 1 year ago. Out of people who lived in different houses, 68% moved from this county. Out of people who lived in different houses, 26% moved from different county within same state. Out of people who lived in different houses, 5% moved from different state. Out of people who lived in different houses, 2% moved from abroad.
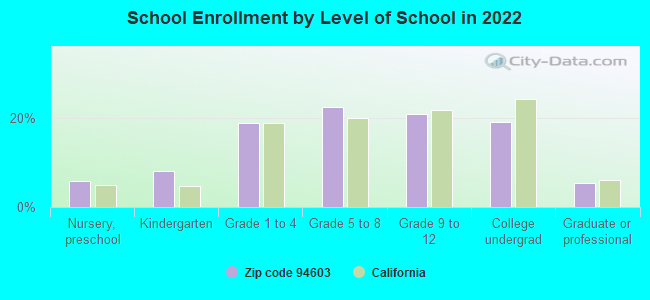
Private vs. public school enrollment:
Students in private schools in grades 1 to 8 (elementary and middle school): 216
Here:
5.3%
California:
10.5%
Students in private schools in grades 9 to 12 (high school): 101
Here:
4.9%
California:
8.5%
Students in private undergraduate colleges: 172
Here:
9.1%
California:
15.9%
Occupation by median earnings in the past 12 months ($)
113,129Law enforcement workers including supervisors
112,278Life, physical, and social science occupations
83,582Health diagnosing and treating practitioners and other technical occupations
82,129Business and financial operations occupations
80,245Legal occupations
67,347Management occupations
Companies with federal contracts located in this zip code (OAKLAND, CA):
XCHANGER MANUFACTURING CORP (9131 SAN LEANDRO ST) : $1,438,559 in 44 contractsfrom 2000 to 2006
Contracts for Heat Exchangers and Steam Condensers, Mechanical Presses, Power Driven, Engine Cooling System Components, Nonaircraft, Air Purification Equipment, and moreby Defense Logistics Agency, Navy Signed by year:2000: $156,632; 2001: $62,800; 2002: $29,000; 2003: $409,291; 2004: $213,935; 2005: $433,701; 2006: $133,200.
Biggest contracts:
$87,700 with Defense Logistics Agency for Heat Exchangers and Steam Condensers. Signed on 2000-10-12. Completion date: 2001-02-15.
$81,915, same as above.Signed on 2005-06-23. Completion date: 2005-09-29.
$68,268, same as above.Signed on 2003-12-05. Completion date: 2004-04-09.
$68,268, same as above.Signed on 2003-12-05. Completion date: 2004-04-09.
RELIABLE WORLD TRADE COMPANY I (9849 KITTY LANE; small business) : $434,926 in 5 contractsfrom 2002 to 2006
Contracts for Badges and Insignia by Defense Logistics Agency Signed by year:2000: $0; 2001: $0; 2002: $185,000; 2003: $0; 2004: $0; 2005: $0; 2006: $249,926.
Biggest contracts:
$240,000 with Defense Logistics Agency for Badges and Insignia. Signed on 2006-06-29. Completion date: 2006-09-14.
$84,600 with Defense Logistics Agency for Badges and Insignia. Taking place in RI. Signed on 2002-09-11. Completion date: 2003-08-28.
$54,800 with Defense Logistics Agency for Badges and Insignia. Signed on 2002-02-06. Completion date: 2002-12-01.
$45,600, same as above.Signed on 2002-03-13. Completion date: 2002-03-24.
CHANNEL SYSTEMS INC (74 98TH AVE; small business)
$211,163 with Navy for Prefabricated and Portable Buildings. Signed on 2003-09-30. Completion date: 2004-02-27.
CALIFORNIA AIRFRAME PARTS INC (72 98TH AVE; small business) : $38,150 in 8 contractsfrom 2004 to 2006
Contracts for Airframe Structural Components, Miscellaneous Battery Retaining Fixtures and Liners, Launchers, Torpedo and Depth Charge, Engine Electrical System Components, Aircraft Prime Moving, and moreby Air Force, Defense Logistics Agency, Navy Signed by year:2000: $0; 2001: $0; 2002: $0; 2003: $0; 2004: $3,000; 2005: $20,150; 2006: $15,000.
Biggest contracts:
$9,000 with Air Force for Airframe Structural Components. Signed on 2006-04-28. Completion date: 2006-05-03.
$7,500 with Defense Logistics Agency for Miscellaneous Battery Retaining Fixtures and Liners. Signed on 2005-05-24. Completion date: 2005-06-30.
$6,650 with Defense Logistics Agency for Launchers, Torpedo and Depth Charge. Signed on 2005-11-04. Completion date: 2005-12-10.
$4,500 with Defense Logistics Agency for Engine Electrical System Components, Aircraft Prime Moving. Signed on 2005-10-28. Completion date: 2005-12-10.
ACTION TECHNOLOGIES, INC (10970 INTERNATIONAL BOULEV; small business)
$17,109 with Navy for ADP Software. Signed on 2004-10-25. Completion date: 2005-09-30.
PACO PUMPS, INC. (845 92ND AVENUE; small business)
$5,211 with Navy for Non-nuclear Ship Repair (West) Ship repair (including overhauls and conversions) performed on. non-nuclear propelled and nonpropelled ships west of the 108th meridian. Signed on 2000-05-15. Completion date: 2000-09-04.
KINGS POINT MACHINERY INC (9936 GOULD ST; small business)
$3,300 with Defense Logistics Agency for Valves, Nonpowered. Signed on 2005-12-23. Completion date: 2006-06-21.
GOLDEN STATE IMAGING & COMPUTE (850 92ND AVE STE3; small business) : $1,121 in 2 contractsin 2003
$1,121 with Defense Finance and Accounting Service for Warehousing and Storage Services. Signed on 2003-11-19. Completion date: 2004-09-30.
$0, same as above.Signed on 2003-11-19. Completion date: 2004-09-30.
MAGNET ENTERPRISES INTERNATION (850 - 92ND AVE , UNIT #4; small business)
-$856 with Navy for Defense Electronics and Communication Equipment -- Advanced Development (R&D). Signed on 2003-11-06. Completion date: 1999-11-01.
Top industries in this zip code by the number of employees in 2005:
Administrative and Support and Waste Management and Remediation Services: Solid Waste Collection (250-499 employees: 1 establishment, 10-19 employees: 1 establishment)
2005 - 2018 National Fire Incident Reporting System (NFIRS) incidents
According to the data from the years 2005 - 2018 the average number of fire incidents per year is 67. The highest number of reported fire incidents - 174 took place in 2018, and the least - 0 in 2010. The data has an increasing trend.
When looking into fire subcategories, the most reports belonged to: Outside Fires (34.3%), and Mobile Property/Vehicle Fires (32.1%).
Fire incident types reported to NFIRS in Zip Code 94603


 Nearest zip codes: 94577, 94605, 94621, 94613, 94579, 94601.


 . Federal Facility

 According to the data from the years 2005 - 2018 the average number of fire incidents per year is 67. The highest number of reported fire incidents - 174 took place in 2018, and the least - 0 in 2010. The data has an increasing trend.
 When looking into fire subcategories, the most reports belonged to: Outside Fires (34.3%), and Mobile Property/Vehicle Fires (32.1%).