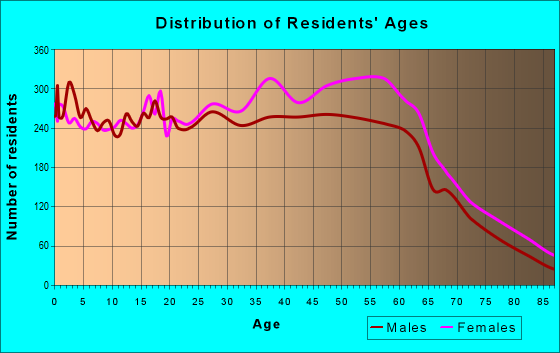
Estimated zip code population in 2022: 44,107 Zip code population in 2010: 39,016 Zip code population in 2000: 42,852
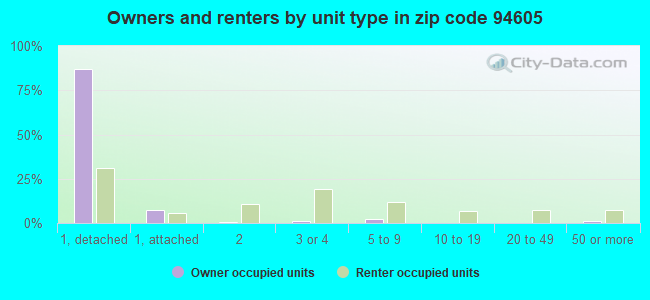
Houses and condos: 18,096 Renter-occupied apartments: 6,710
% of renters here:
39%
State:
44%
March 2022 cost of living index in zip code 94605: 119.9 (more than average, U.S. average is 100)
Land area: 9.0 sq. mi. Water area: 0.1 sq. mi.
Population density: 4,925 people per square mile
(average).
OSM Map
General Map
Google Map
MSN Map
OSM Map
General Map
Google Map
MSN Map
OSM Map
General Map
Google Map
MSN Map
OSM Map
General Map
Google Map
MSN Map
Please wait while loading the map...
Real estate property taxes paid for housing units in 2022:
This zip code:
0.8% ($6,730)
California:
0.7% ($4,831)
Median real estate property taxes paid for housing units with mortgages in 2022: $7,365 (0.8%) Median real estate property taxes paid for housing units with no mortgage in 2022: $4,038 (0.5%)
Averages for the 2020 tax year for zip code 94605, filed in 2021:
Average Adjusted Gross Income (AGI) in 2020: $83,661 (Individual Income Tax Returns)
Here:
$83,661
State:
$95,910
Salary/wage: $76,953 (reported on 81.3% of returns)
Here:
$76,953
State:
$77,331
(% of AGI for various income ranges: 1175.0% for AGIs below $25k, 4218.3% for AGIs $25k-50k, 7755.4% for AGIs $50k-75k, 11040.2% for AGIs $75k-100k, 20673.9% for AGIs $100k-200k, 94453.7% for AGIs over 200k)
Taxable interest for individuals: $883 (reported on 33.6% of returns)
This zip code:
$883
California:
$2,294
(% of AGI for various income ranges: 11.2% for AGIs below $25k, 15.2% for AGIs $25k-50k, 27.0% for AGIs $50k-75k, 47.4% for AGIs $75k-100k, 99.4% for AGIs $100k-200k, 480.2% for AGIs over 200k)
Ordinary dividends: $4,216 (reported on 16.5% of returns)
Here:
$4,216
State:
$10,949
(% of AGI for various income ranges: 14.0% for AGIs below $25k, 24.5% for AGIs $25k-50k, 59.5% for AGIs $50k-75k, 104.0% for AGIs $75k-100k, 199.2% for AGIs $100k-200k, 1445.2% for AGIs over 200k)
Net capital gain/loss in AGI: +$18,824 (reported on 15.7% of returns)
Here:
+$18,824
State:
+$49,306
(% of AGI for various income ranges: 12.4% for AGIs below $25k, 24.8% for AGIs $25k-50k, 45.7% for AGIs $50k-75k, 109.6% for AGIs $75k-100k, 469.9% for AGIs $100k-200k, 9870.8% for AGIs over 200k)
Profit/loss from business: +$14,238 (reported on 20.1% of returns)
Here:
+$14,238
State:
+$15,671
(% of AGI for various income ranges: 182.5% for AGIs below $25k, 184.2% for AGIs $25k-50k, 249.2% for AGIs $50k-75k, 404.6% for AGIs $75k-100k, 761.6% for AGIs $100k-200k, 4722.5% for AGIs over 200k)
Taxable individual retirement arrangement distribution: $20,415 (reported on 5.9% of returns)
94605:
$20,415
California:
$23,505
(% of AGI for various income ranges: 28.9% for AGIs below $25k, 61.3% for AGIs $25k-50k, 113.6% for AGIs $50k-75k, 250.3% for AGIs $75k-100k, 502.6% for AGIs $100k-200k, 1554.0% for AGIs over 200k)
Self-employed (Keogh) retirement plans: $18,837 (reported on 0.9% of returns)
94605:
$18,837
California:
$30,163
(% of AGI for various income ranges: 8.5% for AGIs $25k-50k, 23.6% for AGIs $75k-100k, 46.6% for AGIs $100k-200k, 420.4% for AGIs over 200k)
Total itemized deductions: $30,339 (reported on 22.6% of returns)
Here:
$30,339
State:
$39,517
(% of AGI for various income ranges: 132.3% for AGIs below $25k, 292.3% for AGIs $25k-50k, 802.0% for AGIs $50k-75k, 1604.9% for AGIs $75k-100k, 2930.4% for AGIs $100k-200k, 8404.8% for AGIs over 200k)
Charity contributions: $6,238 (reported on 18.1% of returns)
Here:
$6,238
State:
$12,598
(% of AGI for various income ranges: 9.6% for AGIs below $25k, 45.3% for AGIs $25k-50k, 123.1% for AGIs $50k-75k, 243.3% for AGIs $75k-100k, 458.8% for AGIs $100k-200k, 1646.9% for AGIs over 200k)
Taxes paid: $8,886 (reported on 22.6% of returns)
94605:
$8,886
State:
$8,807
(% of AGI for various income ranges: 31.8% for AGIs below $25k, 84.8% for AGIs $25k-50k, 229.9% for AGIs $50k-75k, 517.1% for AGIs $75k-100k, 920.3% for AGIs $100k-200k, 2213.7% for AGIs over 200k)
Earned income credit: $2,170 (reported on 14.5% of returns)
Here:
$2,170
State:
$2,074
(% of AGI for various income ranges: 119.2% for AGIs below $25k, 67.7% for AGIs $25k-50k, 0.7% for AGIs $50k-75k)
Percentage of individuals using paid preparers for their 2020 taxes: 89.5%
Here:
89%
State:
92%
(% for various income ranges: 87.8% for AGIs below $25k, 88.9% for AGIs $25k-50k, 89.1% for AGIs $50k-75k, 88.6% for AGIs $75k-100k, 91.7% for AGIs $100k-200k, 93.8% for AGIs over 200k)
Averages for the 2012 tax year for zip code 94605, filed in 2013:
Average Adjusted Gross Income (AGI) in 2012: $54,652 (Individual Income Tax Returns)
Here:
$54,652
State:
$72,726
Salary/wage: $50,527 (reported on 81.6% of returns)
Here:
$50,527
State:
$59,079
(% of AGI for various income ranges: 70.7% for AGIs below $25k, 78.3% for AGIs $25k-50k, 77.3% for AGIs $50k-75k, 74.3% for AGIs $75k-100k, 75.4% for AGIs $100k-200k, 74.1% for AGIs over 200k)
Taxable interest for individuals: $638 (reported on 32.3% of returns)
This zip code:
$638
California:
$2,146
(% of AGI for various income ranges: 0.4% for AGIs below $25k, 0.3% for AGIs $25k-50k, 0.5% for AGIs $50k-75k, 0.4% for AGIs $75k-100k, 0.4% for AGIs $100k-200k, 0.3% for AGIs over 200k)
Ordinary dividends: $3,398 (reported on 14.1% of returns)
Here:
$3,398
State:
$9,308
(% of AGI for various income ranges: 0.8% for AGIs below $25k, 0.8% for AGIs $25k-50k, 0.5% for AGIs $50k-75k, 1.1% for AGIs $75k-100k, 0.8% for AGIs $100k-200k, 1.3% for AGIs over 200k)
Net capital gain/loss in AGI: +$5,022 (reported on 11.2% of returns)
Here:
+$5,022
State:
+$30,460
(% of AGI for various income ranges: 0.3% for AGIs $50k-75k, 0.5% for AGIs $75k-100k, 1.1% for AGIs $100k-200k, 4.0% for AGIs over 200k)
Profit/loss from business: +$11,497 (reported on 18.6% of returns)
Here:
+$11,497
State:
+$17,064
(% of AGI for various income ranges: 13.2% for AGIs below $25k, 4.1% for AGIs $25k-50k, 2.4% for AGIs $50k-75k, 2.9% for AGIs $75k-100k, 2.8% for AGIs $100k-200k, 3.2% for AGIs over 200k)
Taxable individual retirement arrangement distribution: $15,702 (reported on 6.8% of returns)
94605:
$15,702
California:
$19,557
(% of AGI for various income ranges: 1.7% for AGIs below $25k, 1.4% for AGIs $25k-50k, 2.0% for AGIs $50k-75k, 2.0% for AGIs $75k-100k, 2.1% for AGIs $100k-200k, 2.3% for AGIs over 200k)
Self-employment retirement plans: $14,750 (reported on 0.6% of returns)
94605:
$14,750
California:
$24,530
(% of AGI for various income ranges: 0.3% for AGIs below $25k, 0.2% for AGIs $50k-75k, 0.2% for AGIs $100k-200k, 0.4% for AGIs over 200k)
Total itemized deductions: $26,046 (27% of AGI, reported on 39.3% of returns)
Here:
$26,046
State:
$34,004
Here:
27.5% of AGI
State:
22.7% of AGI
(% of AGI for various income ranges: 11.3% for AGIs below $25k, 13.3% for AGIs $25k-50k, 19.3% for AGIs $50k-75k, 22.0% for AGIs $75k-100k, 21.8% for AGIs $100k-200k, 19.0% for AGIs over 200k)
Charity contributions: $3,523 (reported on 32.0% of returns)
Here:
$3,523
State:
$4,659
(% of AGI for various income ranges: 0.9% for AGIs below $25k, 1.5% for AGIs $25k-50k, 2.4% for AGIs $50k-75k, 2.5% for AGIs $75k-100k, 2.5% for AGIs $100k-200k, 1.7% for AGIs over 200k)
Taxes paid: $9,621 (reported on 39.2% of returns)
94605:
$9,621
State:
$14,448
(% of AGI for various income ranges: 2.8% for AGIs below $25k, 3.3% for AGIs $25k-50k, 5.9% for AGIs $50k-75k, 7.9% for AGIs $75k-100k, 8.8% for AGIs $100k-200k, 9.6% for AGIs over 200k)
Earned income credit: $2,367 (reported on 21.4% of returns)
Here:
$2,367
State:
$2,286
(% of AGI for various income ranges: 8.9% for AGIs below $25k, 1.0% for AGIs $25k-50k)
Percentage of individuals using paid preparers for their 2012 taxes: 56.6%
Here:
57%
State:
64%
(% for various income ranges: 52.7% for AGIs below $25k, 57.2% for AGIs $25k-50k, 57.0% for AGIs $50k-75k, 58.7% for AGIs $75k-100k, 62.6% for AGIs $100k-200k, 68.0% for AGIs over 200k)
Averages for the 2004 tax year for zip code 94605, filed in 2005:
Average Adjusted Gross Income (AGI) in 2004: $47,785 (Individual Income Tax Returns)
Here:
$47,785
State:
$58,600
Salary/wage: $44,429 (reported on 82.8% of returns)
Here:
$44,429
State:
$49,455
(% of AGI for various income ranges: 125.8% for AGIs below $10k, 71.9% for AGIs $10k-25k, 81.7% for AGIs $25k-50k, 80.5% for AGIs $50k-75k, 80.7% for AGIs $75k-100k, 70.1% for AGIs over 100k)
Taxable interest for individuals: $1,235 (reported on 42.7% of returns)
This zip code:
$1,235
California:
$2,365
(% of AGI for various income ranges: 3.9% for AGIs below $10k, 1.4% for AGIs $10k-25k, 0.8% for AGIs $25k-50k, 1.0% for AGIs $50k-75k, 1.0% for AGIs $75k-100k, 1.3% for AGIs over 100k)
Taxable dividends: $2,171 (reported on 18.1% of returns)
Here:
$2,171
State:
$4,746
(% of AGI for various income ranges: 3.0% for AGIs below $10k, 1.1% for AGIs $10k-25k, 0.6% for AGIs $25k-50k, 0.6% for AGIs $50k-75k, 0.7% for AGIs $75k-100k, 1.0% for AGIs over 100k)
Net capital gain/loss: +$11,379 (reported on 14.3% of returns)
Here:
+$11,379
State:
+$23,418
(% of AGI for various income ranges: -1.2% for AGIs below $10k, 0.1% for AGIs $10k-25k, 0.1% for AGIs $25k-50k, 0.9% for AGIs $50k-75k, 1.2% for AGIs $75k-100k, 8.7% for AGIs over 100k)
Profit/loss from business: +$12,075 (reported on 16.7% of returns)
Here:
+$12,075
State:
+$16,826
(% of AGI for various income ranges: 12.8% for AGIs below $10k, 7.8% for AGIs $10k-25k, 3.6% for AGIs $25k-50k, 2.6% for AGIs $50k-75k, 3.3% for AGIs $75k-100k, 4.8% for AGIs over 100k)
IRA payment deduction: $2,776 (reported on 1.8% of returns)
94605:
$2,776
California:
$3,192
(% of AGI for various income ranges: 0.4% for AGIs below $10k, 0.1% for AGIs $10k-25k, 0.1% for AGIs $25k-50k, 0.1% for AGIs $50k-75k, 0.1% for AGIs $75k-100k, 0.1% for AGIs over 100k)
Self-employed pension: $11,427 (reported on 1.2% of returns)
Here:
$11,427
California:
$17,688
(% of AGI for various income ranges: 0.1% for AGIs $10k-25k, 0.1% for AGIs $25k-50k, 0.2% for AGIs $50k-75k, 0.2% for AGIs $75k-100k, 0.6% for AGIs over 100k)
Total itemized deductions: $24,849 (33% of AGI, reported on 45.5% of returns)
Here:
$24,849
State:
$28,113
Here:
32.7% of AGI
State:
25.3% of AGI
(% of AGI for various income ranges: 42.6% for AGIs below $10k, 19.5% for AGIs $10k-25k, 20.8% for AGIs $25k-50k, 27.6% for AGIs $50k-75k, 26.6% for AGIs $75k-100k, 22.1% for AGIs over 100k)
Charity contributions deductions: $3,493 (4% of AGI, reported on 39.3% of returns)
Here:
$3,493
State:
$3,923
Here:
4.4% of AGI
State:
3.3% of AGI
(% of AGI for various income ranges: 1.8% for AGIs below $10k, 1.6% for AGIs $10k-25k, 2.3% for AGIs $25k-50k, 3.3% for AGIs $50k-75k, 3.4% for AGIs $75k-100k, 3.1% for AGIs over 100k)
Total tax: $6,784 (reported on 73.9% of returns)
94605:
$6,784
State:
$10,761
(% of AGI for various income ranges: 4.8% for AGIs below $10k, 3.8% for AGIs $10k-25k, 6.5% for AGIs $25k-50k, 9.1% for AGIs $50k-75k, 10.5% for AGIs $75k-100k, 15.5% for AGIs over 100k)
Earned income credit: $1,792 (reported on 17.7% of returns)
Here:
$1,792
State:
$1,763
Percentage of individuals using paid preparers for their 2004 taxes: 65.3%
Here:
65%
State:
66%
(% for various income ranges: 60.7% for AGIs below $10k, 68.7% for AGIs $10k-25k, 64.8% for AGIs $25k-50k, 65.0% for AGIs $50k-75k, 62.9% for AGIs $75k-100k, 68.6% for AGIs over 100k)
Likely homosexual households (counted as self-reported same-sex unmarried-partner households)
Lesbian couples: 0.7% of all households
Gay men: 0.4% of all households
Household received Food Stamps/SNAP in the past 12 months: 2,468 Household did not receive Food Stamps/SNAP in the past 12 months: 14,749
Women who had a birth in the past 12 months: 800 (341 now married, 463 unmarried) Women who did not have a birth in the past 12 months: 10,446 (3,707 now married, 6,757 unmarried)
Housing units in zip code 94605 with a mortgage: 8,223 (673 second mortgage, 39 home equity loan, 445 both second mortgage and home equity loan) Houses without a mortgage: 271
Median monthly owner costs for units with a mortgage: $3,076 Median monthly owner costs for units without a mortgage: $808
Residents with income below the poverty level in 2022:
This zip code:
13.2%
Whole state:
12.2%
Residents with income below 50% of the poverty level in 2022:
This zip code:
7.1%
Whole state:
6.2%
Median number of rooms in houses and condos:
Here:
5.9
State:
6.0
Median number of rooms in apartments:
Here:
4.1
State:
3.9
Notable locations in this zip code not listed on our city pages
Notable locations in zip code 94605: Upper San Leandro Filtration Plant (A), Sequoyah Country Club (B), Lake Chabot Municipal Golf Course (C), Eastmont Branch Oakland Public Library (D), Oakland Fire Department Station 28 (E), Oakland Fire Department Station 26 (F), Oakland Fire Department Station 23 (G). Display/hide their locations on the map
Churches in zip code 94605 include: Grace Community Methodist Church (A), Greater Emmanuel Church of God in Christ (B), Hillside Presbyterian Church (C), Mills Terrace Christian Church (D), Philadelphia Church (E), Pilgrim Temple Community Church (F), Saint Cyrils Convent (G), Trinity Baptist Church (H), New Pilgrim Congregational Church (I). Display/hide their locations on the map
Parks in zip code 94605 include: Arroyo Viejo Recreation Center (1), Knowland State Arboretum and Park (2), Concordia Park (3), Hellman Recreation Center (4), Lake Chapot Park (5). Display/hide their locations on the map
4,125 married couples with children.
2,928 single-parent households (437 men, 2,491 women).
70.7% of residents of 94605 zip code speak English at home.
19.5% of residents speak Spanish at home (60% very well, 20% well, 14% not well, 6% not at all).
2.2% of residents speak other Indo-European language at home (91% very well, 8% well, 2% not well).
6.0% of residents speak Asian or Pacific Island language at home (63% very well, 18% well, 13% not well, 6% not at all).
1.3% of residents speak other language at home (81% very well, 3% well, 16% not well).
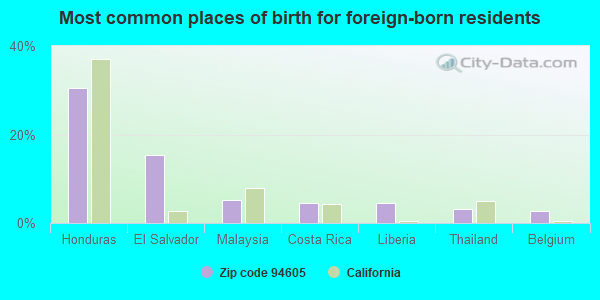
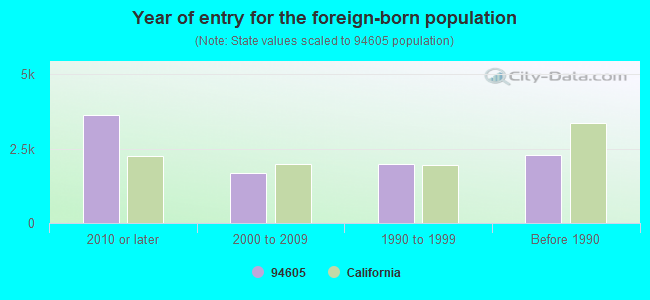
Foreign born population: 8,739 (19.8%) (40.7% of them are naturalized citizens)
Major facilities with environmental interests located in this zip code:
CASTLEMONT SENIOR HIGH SCHOOL (8601 MACARTHUR BLVD in OAKLAND, CA)
STATE MASTER (California - Hazardous Waste Tracking) - HAZARDOU WASTE PROGRAM COMPLIANCE ACTIVITY (Tracking inspections of insecticide, fungicide, and rodenticide, and toxic substances) (National Center for Education Statistics) - STATE ID-0132092 Small Quantity Generators, between 100 kg and 1000 kg of hazardous waste/month (Resource Conservation and Recovery Act (tracking hazardous waste)) - notification Organizations: OAKLAND UNIFIED SCHOOL DIST (CONTACT/OWNER)
, OAKLAND UNIFIED (SCHOOL DISTRICT)
Alternative names: CASTLEMONT HIGH SCHOOL
KING ESTATES MIDDLE SCHOOL (8251 FONTAINE ST in OAKLAND, CA)
STATE MASTER (California - Hazardous Waste Tracking) - HAZARDOU WASTE PROGRAM (National Center for Education Statistics) - STATE ID-6066443 Small Quantity Generators, between 100 kg and 1000 kg of hazardous waste/month (Resource Conservation and Recovery Act (tracking hazardous waste)) - notification Organizations: OAKLAND UNIFIED SCHOOL DIST (CONTACT/OWNER)
, OAKLAND UNIFIED (SCHOOL DISTRICT)
CHEVRON USA INC SERV STA #93322 (7225 BANCROFT AVE in OAKLAND, CA)
STATE MASTER (California - Hazardous Waste Tracking) - HAZARDOU WASTE PROGRAM (Resource Conservation and Recovery Act (tracking hazardous waste)) Alternative names: CHEVRON 93322
FRICK MIDDLE SCHOOL (2845 64TH AVENUE in OAKLAND, CA)
(National Center for Education Statistics) - STATE ID-6057020 Small Quantity Generators, between 100 kg and 1000 kg of hazardous waste/month (Resource Conservation and Recovery Act (tracking hazardous waste)) - notification Organizations: OAKLAND UNIFIED SCHOOL DIST (CONTACT/OWNER)
, OAKLAND UNIFIED (SCHOOL DISTRICT)
Alternative names: FRICK JUNIOR HIGH SCHOOL
EQUILON ENTERPRISES (9750 GOLF LINKS RD/KNOWLAND in OAKLAND, CA) . Federal Facility
STATE MASTER (California - Hazardous Waste Tracking) - HAZARDOU WASTE PROGRAM Small Quantity Generators, between 100 kg and 1000 kg of hazardous waste/month (Resource Conservation and Recovery Act (tracking hazardous waste)) - notification Organizations: EQUILON ENTERPRISES, LLC (CONTACT/OWNER)
Alternative names: SHELL OIL CO
EQUILON ENTERPRISES (8930 BANCROFT in OAKLAND, CA) . Federal Facility
STATE MASTER (California - Hazardous Waste Tracking) - HAZARDOU WASTE PROGRAM Small Quantity Generators, between 100 kg and 1000 kg of hazardous waste/month (Resource Conservation and Recovery Act (tracking hazardous waste)) - notification Organizations: EQUILON ENTERPRISES, LLC (CONTACT/OWNER)
Alternative names: SHELL OIL CO
GRASS VALLEY ELEMENTARY (4720 DUNKIRK AVE. in OAKLAND, CA)
(National Center for Education Statistics) - STATE ID-6001879 Organizations: OAKLAND UNIFIED (SCHOOL DISTRICT)
HOWARD ELEMENTARY (8755 FONTAINE ST. in OAKLAND, CA)
(National Center for Education Statistics) - STATE ID-6001713 Organizations: OAKLAND UNIFIED (SCHOOL DISTRICT)
MARKHAM ELEMENTARY (7220 KRAUSE AVE. in OAKLAND, CA)
(National Center for Education Statistics) - STATE ID-6002059 Organizations: OAKLAND UNIFIED (SCHOOL DISTRICT)
MARSHALL ELEMENTARY (3400 MALCOLM AVE. in OAKLAND, CA)
(National Center for Education Statistics) - STATE ID-6001952 Organizations: OAKLAND UNIFIED (SCHOOL DISTRICT)
CHEVRON USA INC SERV STA #93899 (9001 MACARTHUR BLVD in OAKLAND, CA)
(Resource Conservation and Recovery Act (tracking hazardous waste))
EXXON CO USA #78907 (8008 MOUNTAIN BLVD in OAKLAND, CA)
(Resource Conservation and Recovery Act (tracking hazardous waste))
FIRESTONE EASTMONT 3141 (73RD MACAUTHUR in OAKLAND, CA)
Small Quantity Generators, between 100 kg and 1000 kg of hazardous waste/month (Resource Conservation and Recovery Act (tracking hazardous waste)) Organizations: FIRETONE TIRE & RUBBER (CONTACT/OWNER)
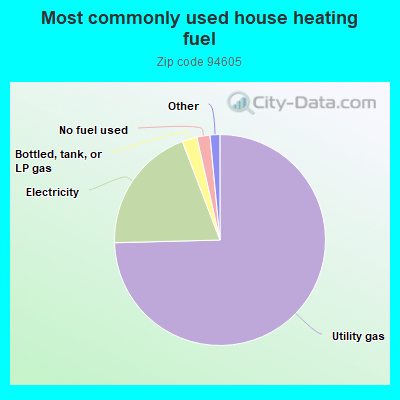
Housing units lacking complete plumbing facilities: 0.8% Housing units lacking complete kitchen facilities: 1.0%
74.6%Utility gas
19.6%Electricity
2.3%Bottled, tank, or LP gas
2.0%No fuel used
0.8%Solar energy
0.7%Wood
Population in 1990: 38,511. Population change in the 1990s: +4,341 (+11.3%).
Place of birth for U.S.-born residents:
This state: 26,575
Northeast: 1,450
Midwest: 1,836
South: 3,974
West: 896
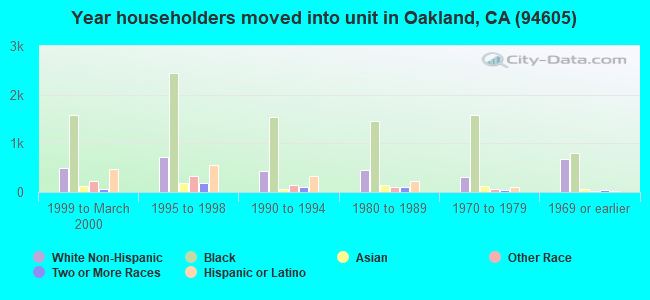
59% of the 94605 zip code residents lived in the same house 5 years ago. Out of people who lived in different houses, 71% lived in this county. Out of people who lived in different counties, 50% lived in California.
89% of the 94605 zip code residents lived in the same house 1 year ago. Out of people who lived in different houses, 56% moved from this county. Out of people who lived in different houses, 33% moved from different county within same state. Out of people who lived in different houses, 4% moved from different state. Out of people who lived in different houses, 6% moved from abroad.
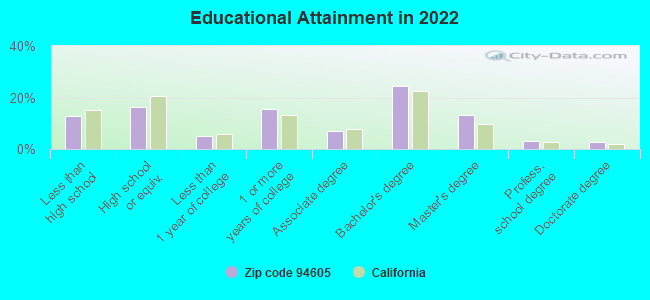
Private vs. public school enrollment:
Students in private schools in grades 1 to 8 (elementary and middle school): 551
Here:
16.0%
California:
10.5%
Students in private schools in grades 9 to 12 (high school): 265
Here:
13.2%
California:
8.5%
Students in private undergraduate colleges: 258
Here:
15.0%
California:
15.9%
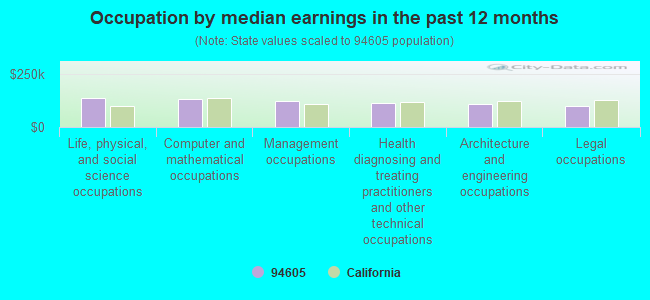
Occupation by median earnings in the past 12 months ($)
134,495Life, physical, and social science occupations
130,878Computer and mathematical occupations
123,772Management occupations
113,368Health diagnosing and treating practitioners and other technical occupations
109,717Architecture and engineering occupations
100,478Legal occupations
Companies with federal contracts located in this zip code:
DEPENDABLE JANITORIAL SERVICE (6681 FOOTHILL BLVD in OAKLAND, CA; small business) : $487,056 in 16 contractsfrom 1999 to 2006
Contracts for Custodial Janitorial Services by Federal Aviation Administration, Army, Navy Signed by year:2000: $0; 2001: $22,184; 2002: $22,184; 2003: $82,390; 2004: $90,260; 2005: $98,038; 2006: $0.
Biggest contracts:
$172,000 with Federal Aviation Administration for Custodial Janitorial Services. Signed on 1999-10-15. Completion date: 2000-03-15.
$68,076 with Army for Custodial Janitorial Services. Signed on 2004-01-29. Completion date: 2000-12-31.
$63,264, same as above.Signed on 2005-07-21. Completion date: 2006-06-30.
$60,206, same as above.Signed on 2003-05-02. Completion date: 2000-12-31.
RESEARCH INSTITUTE FOR SCIENCE (11452 LOCHARD ST in OAKLAND, CA; small business) : $39,000 in 2 contractsfrom 2004 to 2005
$24,000 with Army for Scientific Data Studies. Taking place in NY. Signed on 2005-02-08. Completion date: 2004-10-14.
$15,000, same as above.Signed on 2004-09-15. Completion date: 2004-10-14.
GERALD L TANK (7558 GREENLY DR in OAKLAND, CA; small business) : $37,148 in 4 contractsfrom 2004 to 2006
$20,848 with Maritime Administration for Radio Navigation Equipment, Except Airborne. Signed on 2004-03-22. Effective on 2004-03-19. Completion date: 2004-04-15.
$9,200 with Army for Defense Ships -- Management and Support (R&D). Signed on 2006-04-21. Completion date: 2006-04-30.
$6,250 with Navy for Installation of Equipment -- Communication, Detection, and Coherent Radiation Equipment. Signed on 2005-09-17. Completion date: 2005-10-28.
$850 with Maritime Administration for Radio Navigation Equipment, Except Airborne. Signed on 2004-03-26. Completion date: 2004-04-15.
Top industries in this zip code by the number of employees in 2005:
Health Care and Social Assistance: Other Residential Care Facilities (50-99 employees: 2 establishments, 20-49 employees: 3 establishments, 10-19 employees: 2 establishments, 5-9 employees: 3 establishments, 1-4 employees: 1 establishment)
2005 - 2018 National Fire Incident Reporting System (NFIRS) incidents
Based on the data from the years 2005 - 2018 the average number of fire incidents per year is 97. The highest number of fire incidents - 243 took place in 2006, and the least - 1 in 2010. The data has a rising trend.
When looking into fire subcategories, the most reports belonged to: Mobile Property/Vehicle Fires (37.6%), and Outside Fires (33.2%).
Fire incident types reported to NFIRS in Zip Code 94605


 Nearest zip codes: 94619, 94613, 94603, 94577, 94578, 94621.


 Based on the data from the years 2005 - 2018 the average number of fire incidents per year is 97. The highest number of fire incidents - 243 took place in 2006, and the least - 1 in 2010. The data has a rising trend.
 When looking into fire subcategories, the most reports belonged to: Mobile Property/Vehicle Fires (37.6%), and Outside Fires (33.2%).