Estimated zip code population in 2022: 41,998 Zip code population in 2010: 38,558 Zip code population in 2000: 36,565
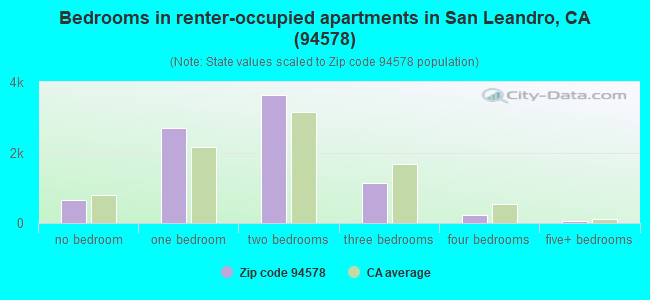
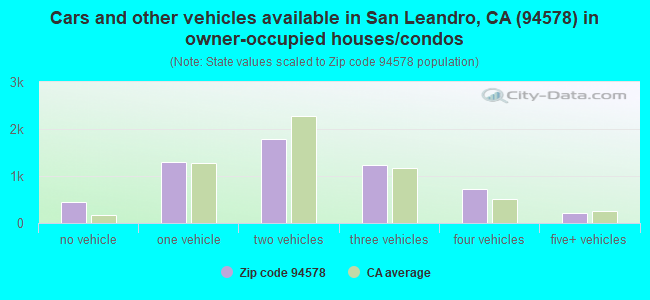
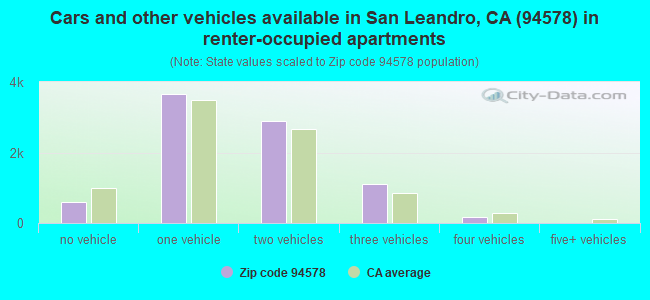
Houses and condos: 14,942 Renter-occupied apartments: 8,421
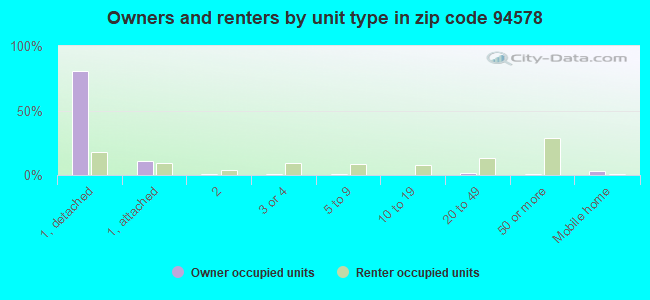
% of renters here:
60%
State:
44%
March 2022 cost of living index in zip code 94578: 119.6 (more than average, U.S. average is 100)
Land area: 4.4 sq. mi. Water area: 0.0 sq. mi.
Population density: 9,536 people per square mile
(high).
OSM Map
General Map
Google Map
MSN Map
OSM Map
General Map
Google Map
MSN Map
OSM Map
General Map
Google Map
MSN Map
OSM Map
General Map
Google Map
MSN Map
Please wait while loading the map...
Real estate property taxes paid for housing units in 2022:
This zip code:
0.7% ($5,721)
California:
0.7% ($4,831)
Median real estate property taxes paid for housing units with mortgages in 2022: $6,441 (0.8%) Median real estate property taxes paid for housing units with no mortgage in 2022: $4,013 (0.5%)
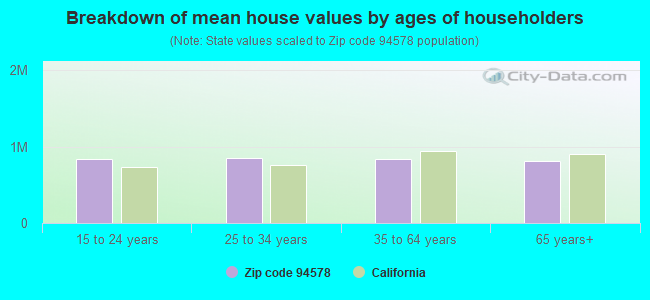
Estimated median house/condo value in 2022: $796,904
94578:
$796,904
California:
$715,900
According to our research of California and other state lists, there were 53 registered sex offenders living in 94578 zip code as of April 27, 2024. The ratio of all residents to sex offenders in zip code 94578 is 777 to 1. The ratio of registered sex offenders to all residents in this zip code is near the state average.
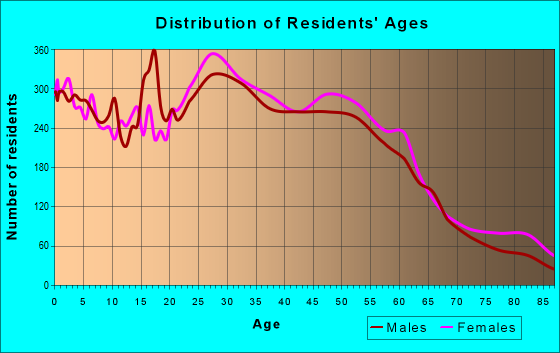
Median resident age:
This zip code:
38.6 years
California median age:
37.9 years
Average household size:
This zip code:
2.9 people
California:
2.8 people
Averages for the 2020 tax year for zip code 94578, filed in 2021:
Average Adjusted Gross Income (AGI) in 2020: $61,021 (Individual Income Tax Returns)
Here:
$61,021
State:
$95,910
Salary/wage: $56,810 (reported on 85.1% of returns)
Here:
$56,810
State:
$77,331
(% of AGI for various income ranges: 1285.7% for AGIs below $25k, 4201.2% for AGIs $25k-50k, 7966.8% for AGIs $50k-75k, 12029.8% for AGIs $75k-100k, 20535.8% for AGIs $100k-200k, 80599.4% for AGIs over 200k)
Taxable interest for individuals: $925 (reported on 25.6% of returns)
This zip code:
$925
California:
$2,294
(% of AGI for various income ranges: 10.5% for AGIs below $25k, 11.3% for AGIs $25k-50k, 26.8% for AGIs $50k-75k, 41.8% for AGIs $75k-100k, 103.5% for AGIs $100k-200k, 753.3% for AGIs over 200k)
Ordinary dividends: $3,286 (reported on 12.0% of returns)
Here:
$3,286
State:
$10,949
(% of AGI for various income ranges: 12.6% for AGIs below $25k, 16.6% for AGIs $25k-50k, 45.2% for AGIs $50k-75k, 61.9% for AGIs $75k-100k, 168.1% for AGIs $100k-200k, 1501.1% for AGIs over 200k)
Net capital gain/loss in AGI: +$12,121 (reported on 12.7% of returns)
Here:
+$12,121
State:
+$49,306
(% of AGI for various income ranges: 8.1% for AGIs below $25k, 14.2% for AGIs $25k-50k, 54.3% for AGIs $50k-75k, 106.6% for AGIs $75k-100k, 452.5% for AGIs $100k-200k, 11846.1% for AGIs over 200k)
Profit/loss from business: +$8,299 (reported on 17.4% of returns)
Here:
+$8,299
State:
+$15,671
(% of AGI for various income ranges: 170.8% for AGIs below $25k, 153.3% for AGIs $25k-50k, 200.0% for AGIs $50k-75k, 229.6% for AGIs $75k-100k, 451.5% for AGIs $100k-200k, 1755.6% for AGIs over 200k)
Taxable individual retirement arrangement distribution: $16,935 (reported on 4.2% of returns)
94578:
$16,935
California:
$23,505
(% of AGI for various income ranges: 31.7% for AGIs below $25k, 34.9% for AGIs $25k-50k, 94.8% for AGIs $50k-75k, 160.7% for AGIs $75k-100k, 374.0% for AGIs $100k-200k, 1303.3% for AGIs over 200k)
Self-employed (Keogh) retirement plans: $15,725 (reported on 0.2% of returns)
94578:
$15,725
California:
$30,163
(% of AGI for various income ranges: 45.3% for AGIs $100k-200k)
Total itemized deductions: $28,194 (reported on 11.5% of returns)
Here:
$28,194
State:
$39,517
(% of AGI for various income ranges: 71.3% for AGIs below $25k, 172.2% for AGIs $25k-50k, 415.9% for AGIs $50k-75k, 838.5% for AGIs $75k-100k, 1713.5% for AGIs $100k-200k, 6742.2% for AGIs over 200k)
Charity contributions: $5,216 (reported on 8.7% of returns)
Here:
$5,216
State:
$12,598
(% of AGI for various income ranges: 2.0% for AGIs below $25k, 20.2% for AGIs $25k-50k, 51.9% for AGIs $50k-75k, 116.0% for AGIs $75k-100k, 264.7% for AGIs $100k-200k, 1067.2% for AGIs over 200k)
Taxes paid: $8,820 (reported on 11.4% of returns)
94578:
$8,820
State:
$8,807
(% of AGI for various income ranges: 17.6% for AGIs below $25k, 48.9% for AGIs $25k-50k, 137.2% for AGIs $50k-75k, 277.1% for AGIs $75k-100k, 565.8% for AGIs $100k-200k, 1838.9% for AGIs over 200k)
Earned income credit: $1,973 (reported on 15.1% of returns)
Here:
$1,973
State:
$2,074
(% of AGI for various income ranges: 98.4% for AGIs below $25k, 61.7% for AGIs $25k-50k, 1.1% for AGIs $50k-75k)
Percentage of individuals using paid preparers for their 2020 taxes: 90.4%
Here:
90%
State:
92%
(% for various income ranges: 88.2% for AGIs below $25k, 90.8% for AGIs $25k-50k, 91.3% for AGIs $50k-75k, 91.5% for AGIs $75k-100k, 91.5% for AGIs $100k-200k, 92.2% for AGIs over 200k)
Averages for the 2012 tax year for zip code 94578, filed in 2013:
Average Adjusted Gross Income (AGI) in 2012: $44,973 (Individual Income Tax Returns)
Here:
$44,973
State:
$72,726
Salary/wage: $42,781 (reported on 85.5% of returns)
Here:
$42,781
State:
$59,079
(% of AGI for various income ranges: 74.7% for AGIs below $25k, 85.6% for AGIs $25k-50k, 85.8% for AGIs $50k-75k, 83.1% for AGIs $75k-100k, 81.6% for AGIs $100k-200k, 58.5% for AGIs over 200k)
Taxable interest for individuals: $734 (reported on 26.7% of returns)
This zip code:
$734
California:
$2,146
(% of AGI for various income ranges: 0.7% for AGIs below $25k, 0.3% for AGIs $25k-50k, 0.4% for AGIs $50k-75k, 0.3% for AGIs $75k-100k, 0.5% for AGIs $100k-200k, 0.6% for AGIs over 200k)
Ordinary dividends: $3,327 (reported on 10.7% of returns)
Here:
$3,327
State:
$9,308
(% of AGI for various income ranges: 0.8% for AGIs below $25k, 0.5% for AGIs $25k-50k, 0.7% for AGIs $50k-75k, 0.7% for AGIs $75k-100k, 0.8% for AGIs $100k-200k, 2.3% for AGIs over 200k)
Net capital gain/loss in AGI: +$5,709 (reported on 9.0% of returns)
Here:
+$5,709
State:
+$30,460
(% of AGI for various income ranges: 0.9% for AGIs $100k-200k, 14.2% for AGIs over 200k)
Profit/loss from business: +$10,311 (reported on 14.9% of returns)
Here:
+$10,311
State:
+$17,064
(% of AGI for various income ranges: 10.9% for AGIs below $25k, 3.3% for AGIs $25k-50k, 2.2% for AGIs $50k-75k, 2.1% for AGIs $75k-100k, 1.9% for AGIs $100k-200k, 2.7% for AGIs over 200k)
Taxable individual retirement arrangement distribution: $12,335 (reported on 5.4% of returns)
94578:
$12,335
California:
$19,557
(% of AGI for various income ranges: 1.5% for AGIs below $25k, 1.2% for AGIs $25k-50k, 1.1% for AGIs $50k-75k, 1.5% for AGIs $75k-100k, 2.1% for AGIs $100k-200k, 1.3% for AGIs over 200k)
Self-employment retirement plans: $11,700 (reported on 0.2% of returns)
94578:
$11,700
California:
$24,530
Total itemized deductions: $22,232 (26% of AGI, reported on 25.6% of returns)
Here:
$22,232
State:
$34,004
Here:
26.2% of AGI
State:
22.7% of AGI
(% of AGI for various income ranges: 6.8% for AGIs below $25k, 8.0% for AGIs $25k-50k, 12.5% for AGIs $50k-75k, 15.3% for AGIs $75k-100k, 18.1% for AGIs $100k-200k, 15.2% for AGIs over 200k)
Charity contributions: $2,698 (reported on 19.7% of returns)
Here:
$2,698
State:
$4,659
(% of AGI for various income ranges: 0.4% for AGIs below $25k, 0.7% for AGIs $25k-50k, 1.2% for AGIs $50k-75k, 1.6% for AGIs $75k-100k, 1.7% for AGIs $100k-200k, 2.0% for AGIs over 200k)
Taxes paid: $7,618 (reported on 25.6% of returns)
94578:
$7,618
State:
$14,448
(% of AGI for various income ranges: 1.6% for AGIs below $25k, 1.9% for AGIs $25k-50k, 3.6% for AGIs $50k-75k, 5.4% for AGIs $75k-100k, 7.3% for AGIs $100k-200k, 7.7% for AGIs over 200k)
Earned income credit: $2,174 (reported on 20.6% of returns)
Here:
$2,174
State:
$2,286
(% of AGI for various income ranges: 6.7% for AGIs below $25k, 1.0% for AGIs $25k-50k)
Percentage of individuals using paid preparers for their 2012 taxes: 58.3%
Here:
58%
State:
64%
(% for various income ranges: 55.9% for AGIs below $25k, 58.4% for AGIs $25k-50k, 60.4% for AGIs $50k-75k, 63.4% for AGIs $75k-100k, 59.7% for AGIs $100k-200k, 64.7% for AGIs over 200k)
Averages for the 2004 tax year for zip code 94578, filed in 2005:
Average Adjusted Gross Income (AGI) in 2004: $41,099 (Individual Income Tax Returns)
Here:
$41,099
State:
$58,600
Salary/wage: $40,032 (reported on 85.7% of returns)
Here:
$40,032
State:
$49,455
(% of AGI for various income ranges: 112.2% for AGIs below $10k, 76.4% for AGIs $10k-25k, 87.1% for AGIs $25k-50k, 86.8% for AGIs $50k-75k, 86.0% for AGIs $75k-100k, 74.4% for AGIs over 100k)
Taxable interest for individuals: $1,222 (reported on 39.3% of returns)
This zip code:
$1,222
California:
$2,365
(% of AGI for various income ranges: 5.0% for AGIs below $10k, 1.7% for AGIs $10k-25k, 0.9% for AGIs $25k-50k, 1.1% for AGIs $50k-75k, 1.0% for AGIs $75k-100k, 1.3% for AGIs over 100k)
Taxable dividends: $2,098 (reported on 16.2% of returns)
Here:
$2,098
State:
$4,746
(% of AGI for various income ranges: 3.1% for AGIs below $10k, 1.1% for AGIs $10k-25k, 0.6% for AGIs $25k-50k, 0.5% for AGIs $50k-75k, 0.9% for AGIs $75k-100k, 1.2% for AGIs over 100k)
Net capital gain/loss: +$5,544 (reported on 13.0% of returns)
Here:
+$5,544
State:
+$23,418
(% of AGI for various income ranges: -2.8% for AGIs below $10k, -0.1% for AGIs $10k-25k, 0.3% for AGIs $25k-50k, 0.3% for AGIs $50k-75k, 1.0% for AGIs $75k-100k, 7.1% for AGIs over 100k)
Profit/loss from business: +$10,115 (reported on 12.3% of returns)
Here:
+$10,115
State:
+$16,826
(% of AGI for various income ranges: 5.9% for AGIs below $10k, 6.2% for AGIs $10k-25k, 2.9% for AGIs $25k-50k, 1.9% for AGIs $50k-75k, 2.2% for AGIs $75k-100k, 3.4% for AGIs over 100k)
IRA payment deduction: $3,005 (reported on 2.5% of returns)
94578:
$3,005
California:
$3,192
(% of AGI for various income ranges: 0.4% for AGIs below $10k, 0.3% for AGIs $10k-25k, 0.2% for AGIs $25k-50k, 0.2% for AGIs $50k-75k, 0.1% for AGIs $75k-100k, 0.1% for AGIs over 100k)
Self-employed pension: $9,108 (reported on 0.5% of returns)
Here:
$9,108
California:
$17,688
(% of AGI for various income ranges: 0.1% for AGIs $25k-50k, 0.0% for AGIs $50k-75k, 0.1% for AGIs $75k-100k, 0.4% for AGIs over 100k)
Total itemized deductions: $20,869 (30% of AGI, reported on 31.0% of returns)
Here:
$20,869
State:
$28,113
Here:
29.9% of AGI
State:
25.3% of AGI
(% of AGI for various income ranges: 18.3% for AGIs below $10k, 9.4% for AGIs $10k-25k, 11.9% for AGIs $25k-50k, 17.2% for AGIs $50k-75k, 20.3% for AGIs $75k-100k, 18.6% for AGIs over 100k)
Charity contributions deductions: $2,532 (3% of AGI, reported on 26.1% of returns)
Here:
$2,532
State:
$3,923
Here:
3.5% of AGI
State:
3.3% of AGI
(% of AGI for various income ranges: 0.6% for AGIs below $10k, 0.7% for AGIs $10k-25k, 1.1% for AGIs $25k-50k, 1.7% for AGIs $50k-75k, 2.1% for AGIs $75k-100k, 2.2% for AGIs over 100k)
Total tax: $5,113 (reported on 75.8% of returns)
94578:
$5,113
State:
$10,761
(% of AGI for various income ranges: 4.0% for AGIs below $10k, 4.1% for AGIs $10k-25k, 6.9% for AGIs $25k-50k, 9.4% for AGIs $50k-75k, 10.2% for AGIs $75k-100k, 15.1% for AGIs over 100k)
Earned income credit: $1,634 (reported on 14.8% of returns)
Here:
$1,634
State:
$1,763
Percentage of individuals using paid preparers for their 2004 taxes: 62.9%
Here:
63%
State:
66%
(% for various income ranges: 58.3% for AGIs below $10k, 66.5% for AGIs $10k-25k, 62.8% for AGIs $25k-50k, 62.6% for AGIs $50k-75k, 62.6% for AGIs $75k-100k, 62.6% for AGIs over 100k)
Likely homosexual households (counted as self-reported same-sex unmarried-partner households)
Lesbian couples: 0.1% of all households
Gay men: 0.2% of all households
Household received Food Stamps/SNAP in the past 12 months: 2,493 Household did not receive Food Stamps/SNAP in the past 12 months: 11,771
Women who had a birth in the past 12 months: 424 (300 now married, 124 unmarried) Women who did not have a birth in the past 12 months: 11,294 (3,793 now married, 7,529 unmarried)
Housing units in zip code 94578 with a mortgage: 3,592 (238 second mortgage, 121 both second mortgage and home equity loan) Houses without a mortgage: 40
Median monthly owner costs for units with a mortgage: $2,840 Median monthly owner costs for units without a mortgage: $688
Residents with income below the poverty level in 2022:
This zip code:
12.4%
Whole state:
12.2%
Residents with income below 50% of the poverty level in 2022:
This zip code:
5.3%
Whole state:
6.2%
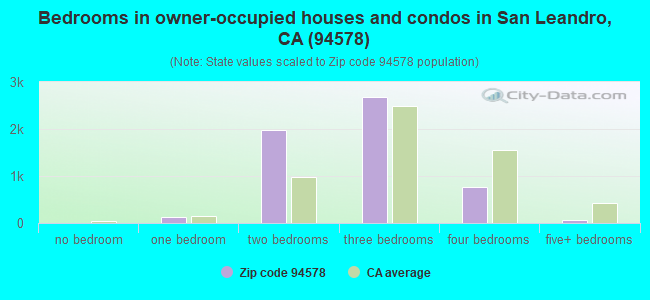
Median number of rooms in houses and condos:
Here:
5.2
State:
6.0
Median number of rooms in apartments:
Here:
3.8
State:
3.9
Notable locations in this zip code not listed on our city pages
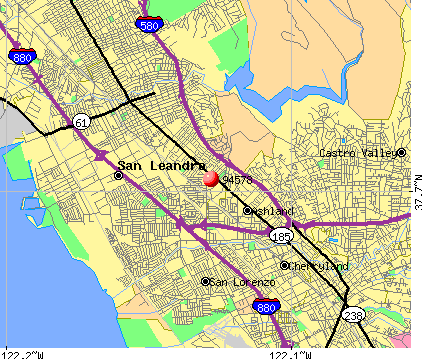
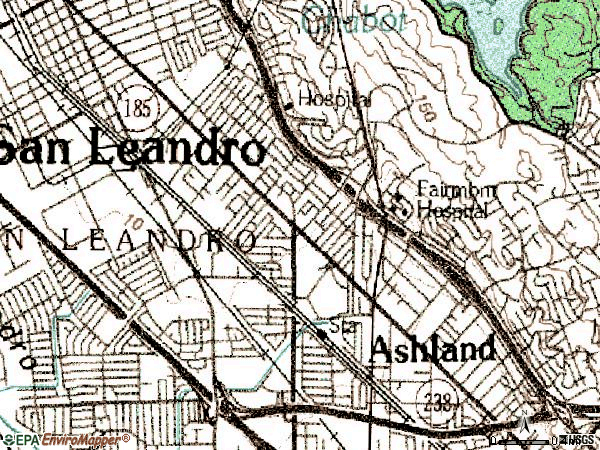
Notable locations in zip code 94578: Chabots Boys Ranch (A), South Branch San Leandro Community Library (B), Alameda County Juvenile Hall (C), American Medical Response Alameda County Division (D), Alameda County Fire Department Station 12 (E), Alameda County Fire Department Station 3 (F). Display/hide their locations on the map
Churches in zip code 94578 include: Bethel Presbyterian Church (A), Halcyon Baptist Church (B), Siloam Church (C), Saint Alphonsus Catholic Church (D), International Bible Baptist Church (E), Grace Baptist Church (F), Epiphany Lutheran Church (G), Badarikashrama Temple (H). Display/hide their locations on the map
Parks in zip code 94578 include: Ashland Park (1), Halcyon Park (2), Heath Park (3), Toyon Park (4), Fairmont Terrace Park (5). Display/hide their locations on the map
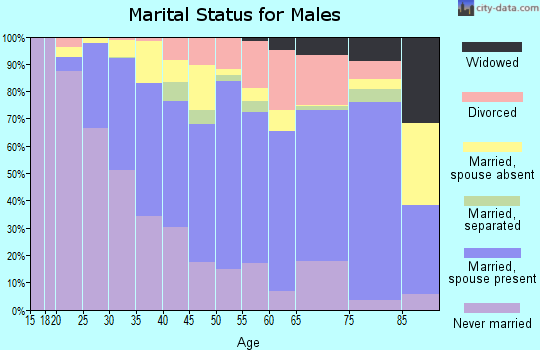
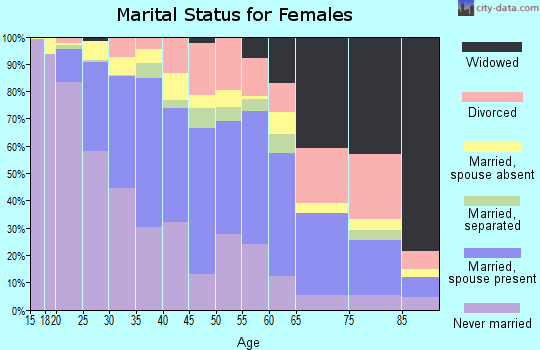
4,460 married couples with children.
2,455 single-parent households (394 men, 2,061 women).
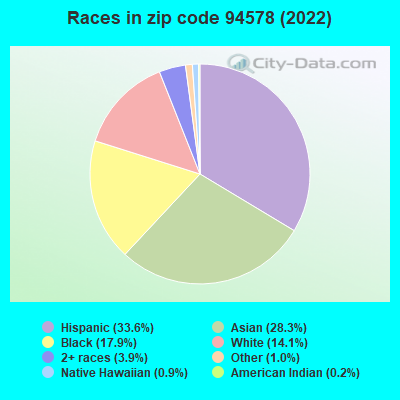
43.0% of residents of 94578 zip code speak English at home.
26.1% of residents speak Spanish at home (50% very well, 26% well, 17% not well, 8% not at all).
3.1% of residents speak other Indo-European language at home (75% very well, 11% well, 11% not well, 2% not at all).
23.4% of residents speak Asian or Pacific Island language at home (37% very well, 33% well, 20% not well, 9% not at all).
4.5% of residents speak other language at home (84% very well, 7% well, 8% not well, 1% not at all).
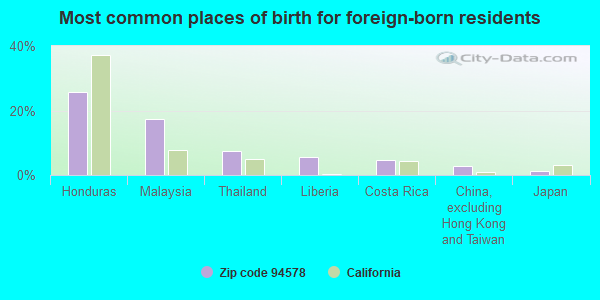
Foreign born population: 16,417 (39.1%) (48.0% of them are naturalized citizens)
Major facilities with environmental interests located in this zip code:
GRANT LABORATORIES INC (14688 WASHINGTON AVE in SAN LEANDRO, CA)
STATE MASTER (California - Hazardous Waste Tracking) - HAZARDOU WASTE PROGRAM COMPLIANCE ACTIVITY (Tracking inspections of insecticide, fungicide, and rodenticide, and toxic substances) STATE MASTER (New Jersey environmental info) - NJEMS-002498, PESTICIDES - MANUFACTURE Small Quantity Generators, between 100 kg and 1000 kg of hazardous waste/month (Resource Conservation and Recovery Act (tracking hazardous waste)) Organizations: REGISTRATIONS BY DESIGN INC
KRAFT GENERAL FOODS INTERNATIONAL (100 HALCYON DRIVE in SAN LEANDRO, CA)
STATE MASTER (California - Hazardous Waste Tracking) - HAZARDOU WASTE PROGRAM COMPLIANCE ACTIVITY (Tracking inspections of insecticide, fungicide, and rodenticide, and toxic substances) CRITERIA AND HAZARDOUS AIR POLLUTANT INVENTORY (Inventory of air pollution sources) Small Quantity Generators, between 100 kg and 1000 kg of hazardous waste/month (Resource Conservation and Recovery Act (tracking hazardous waste)) Business SIC classification: ROASTED COFFEE Business NAICS classification: ALL OTHER MISCELLANEOUS FOOD MANUFACTURING. Alternative names: GENERAL FOODS MANUFACTURING, KRAFT FOODS INC
HUMANA HOSPITAL (13855 EAST 14TH STREET in SAN LEANDRO, CA)
STATE MASTER (California - Hazardous Waste Tracking) - HAZARDOU WASTE PROGRAM CRITERIA AND HAZARDOUS AIR POLLUTANT INVENTORY (Inventory of air pollution sources) Small Quantity Generators, between 100 kg and 1000 kg of hazardous waste/month (Resource Conservation and Recovery Act (tracking hazardous waste)) - notification Business SIC classification: GENERAL MEDICAL AND SURGICAL HOSPITALS Organizations: TRIAD HEALTHCARE SYSTEMS (CONTACT/OWNER)
Alternative names: SAN LEANDRO HOSPITAL
CINTAS (777 139TH AVENUE in SAN LEANDRO, CA)
STATE MASTER (California - Hazardous Waste Tracking) - HAZARDOU WASTE PROGRAM CRITERIA AND HAZARDOUS AIR POLLUTANT INVENTORY (Inventory of air pollution sources) Small Quantity Generators, between 100 kg and 1000 kg of hazardous waste/month (Resource Conservation and Recovery Act (tracking hazardous waste)) - notification Business SIC classification: LINEN SUPPLY Business NAICS classification: OTHER PERSONAL CARE SERVICES. Organizations: CINTAS CORP (CONTACT/OWNER)
Alternative names: CINTAS CORP #54, WEST COAST CINTAS CORP
FAIRMONT HOSPITAL (15400 FOOTHILL BOULEVARD in SAN LEANDRO, CA)
STATE MASTER (California - Hazardous Waste Tracking) - HAZARDOU WASTE PROGRAM CRITERIA AND HAZARDOUS AIR POLLUTANT INVENTORY (Inventory of air pollution sources) Small Quantity Generators, between 100 kg and 1000 kg of hazardous waste/month (Resource Conservation and Recovery Act (tracking hazardous waste)) Business SIC classification: GENERAL MEDICAL AND SURGICAL HOSPITALS Alternative names: COUNTY OF ALAMEDA GSA-TECHNICAL SERVICES
MIRACLE AUTO PAINTING (14140 WASHINGTON STREET in SAN LEANDRO, CA)
STATE MASTER (California - Hazardous Waste Tracking) - HAZARDOU WASTE PROGRAM CRITERIA AND HAZARDOUS AIR POLLUTANT INVENTORY (Inventory of air pollution sources) Small Quantity Generators, between 100 kg and 1000 kg of hazardous waste/month (Resource Conservation and Recovery Act (tracking hazardous waste)) Business SIC classification: TOP, BODY, AND UPHOLSTERY REPAIR SHOPS AND PAINT SHOPS
MILLER & HODGE AUTOM MACHINE (14505 E 14TH ST in SAN LEANDRO, CA)
STATE MASTER (California - Hazardous Waste Tracking) - HAZARDOU WASTE PROGRAM Small Quantity Generators, between 100 kg and 1000 kg of hazardous waste/month (Resource Conservation and Recovery Act (tracking hazardous waste)) Business NAICS classification: OTHER COMMERCIAL AND SERVICE INDUSTRY MACHINERY MANUFACTURING.
HILLSIDE ELEMENTARY (15980 MARCELLA ST. in SAN LEANDRO, CA)
(National Center for Education Statistics) - STATE ID-6002620 Organizations: SAN LORENZO UNIFIED (SCHOOL DISTRICT)
JEFFERSON ELEMENTARY (14311 LARK ST. in SAN LEANDRO, CA)
(National Center for Education Statistics) - STATE ID-6002398 Organizations: SAN LEANDRO UNIFIED (SCHOOL DISTRICT)
JUVENILE HALL/COURT (2400 FAIRMONT DR. in SAN LEANDRO, CA)
(National Center for Education Statistics) - STATE ID-0130401 Organizations: ALAMEDA CO. OFFICE OF EDUCATION (SCHOOL DISTRICT)
MONROE ELEMENTARY (3750 MONTEREY BLVD. in SAN LEANDRO, CA)
(National Center for Education Statistics) - STATE ID-6002430 Organizations: SAN LEANDRO UNIFIED (SCHOOL DISTRICT)
GHIRARDELLI CHOCOLATE COMPANY (1111 139TH AVENUE in SAN LEANDRO, CA)
CRITERIA AND HAZARDOUS AIR POLLUTANT INVENTORY (Inventory of air pollution sources) (Resource Conservation and Recovery Act (tracking hazardous waste)) Business SIC classification: CHOCOLATE AND COCOA PRODUCTS
JIM DEANGELIS TRUCKING (655 CAPE COD DR in SAN LEANDRO, CA)
(Resource Conservation and Recovery Act (tracking hazardous waste)) Organizations: JAMES DEANGELIS (CONTACT/OWNER)
Housing units lacking complete plumbing facilities: 0.4% Housing units lacking complete kitchen facilities: 0.7%
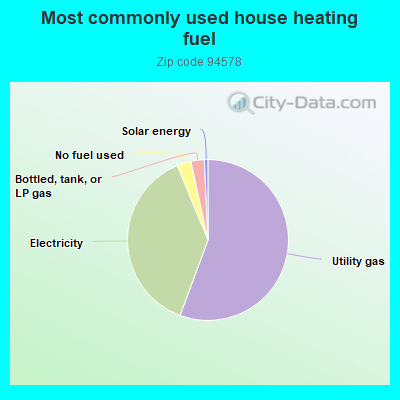
55.6%Utility gas
38.1%Electricity
2.8%No fuel used
2.7%Bottled, tank, or LP gas
0.7%Solar energy
Population in 1990: 31,780. Population change in the 1990s: +4,785 (+15.1%).
Place of birth for U.S.-born residents:
This state: 21,570
Northeast: 533
Midwest: 1,054
South: 1,395
West: 687
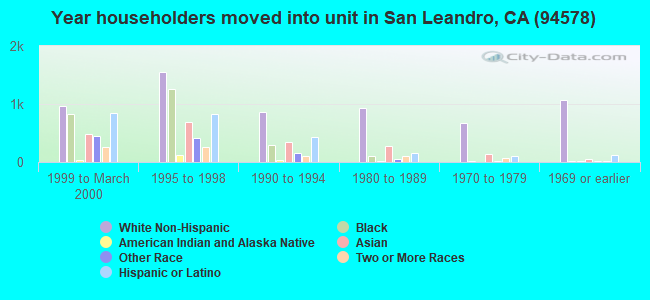
48% of the 94578 zip code residents lived in the same house 5 years ago. Out of people who lived in different houses, 66% lived in this county. Out of people who lived in different counties, 50% lived in California.
91% of the 94578 zip code residents lived in the same house 1 year ago. Out of people who lived in different houses, 60% moved from this county. Out of people who lived in different houses, 21% moved from different county within same state. Out of people who lived in different houses, 9% moved from different state. Out of people who lived in different houses, 10% moved from abroad.
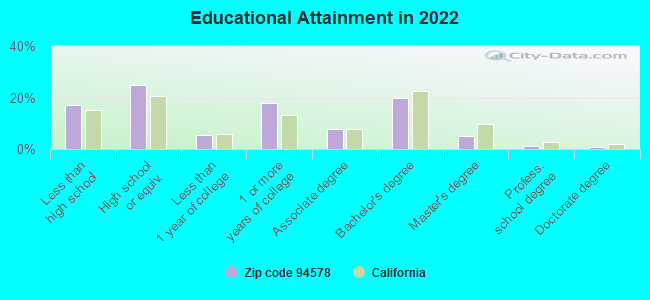
Private vs. public school enrollment:
Students in private schools in grades 1 to 8 (elementary and middle school): 375
Here:
10.8%
California:
10.5%
Students in private schools in grades 9 to 12 (high school): 210
Here:
9.2%
California:
8.5%
Students in private undergraduate colleges: 267
Here:
12.7%
California:
15.9%
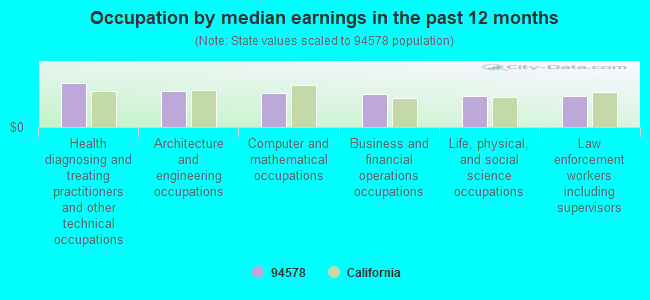
Occupation by median earnings in the past 12 months ($)
108,924Health diagnosing and treating practitioners and other technical occupations
89,276Architecture and engineering occupations
83,706Computer and mathematical occupations
82,570Business and financial operations occupations
77,684Life, physical, and social science occupations
75,916Law enforcement workers including supervisors
Top industries in this zip code by the number of employees in 2005:
Health Care and Social Assistance: General Medical and Surgical Hospitals (over 1000 employees: 1 establishment, 500-999 employees: 1 establishment)
Health Care and Social Assistance: Nursing Care Facilities (250-499: 1, 100-249: 2)
Health Care and Social Assistance: Ambulance Services (250-499: 1)
Administrative and Support and Waste Management and Remediation Services: Temporary Help Services (100-249: 2)
2005 - 2018 National Fire Incident Reporting System (NFIRS) incidents
According to the data from the years 2005 - 2018 the average number of fire incidents per year is 50. The highest number of reported fires - 111 took place in 2006, and the least - 0 in 2013. The data has a declining trend.
When looking into fire subcategories, the most reports belonged to: Structure Fires (46.1%), and Outside Fires (32.0%).
Fire incident types reported to NFIRS in Zip Code 94578


 Nearest zip codes: 94580, 94579, 94577, 94546, 94541, 94605.
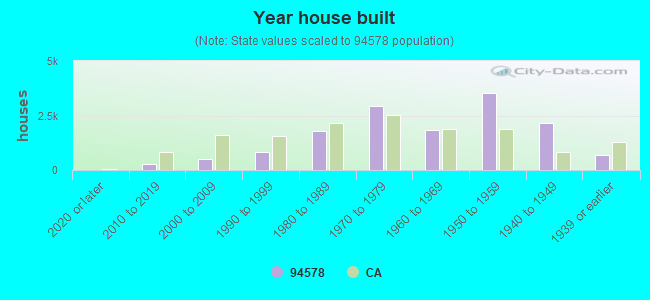


 According to the data from the years 2005 - 2018 the average number of fire incidents per year is 50. The highest number of reported fires - 111 took place in 2006, and the least - 0 in 2013. The data has a declining trend.
 When looking into fire subcategories, the most reports belonged to: Structure Fires (46.1%), and Outside Fires (32.0%).